Eco-Efficiency Assessment of Intensive Rice Production in Japan: Joint Application of Life Cycle Assessment and Data Envelopment Analysis

Department of Biological Resources Management, School of Environmental Science, The University of Shiga Prefecture, 2500 Hassaka-cho, Hikone, Shiga 522-8533, Japan
Sustainability 2019, 11(19), 5368; https://doi.org/10.3390/su11195368
Submission received: 8 August 2019
/
Revised: 22 September 2019
/
Accepted: 25 September 2019
/
Published: 28 September 2019
(This article belongs to the Section Sustainable Agriculture)
Abstract
:To promote sustainable agriculture worldwide, it is important to understand what constitutes eco-efficiency for rice, a staple food in many countries. This study examined whether expanding the scale of rice farming contributed to the improved eco-efficiency of intensive rice production in Japan. Both life cycle assessment (LCA) and data envelopment analysis (DEA) were used to measure comprehensively the eco-efficiency of rice production. A DEA window analysis technique with two DEA inputs (global warming and eutrophication from the LCA results) and one DEA output (weight-based rice yield) was applied to the statistical data for 2005–2011 categorized by the size of rice farms. The results indicate that expanding the size of rice farms is an effective way of improving the eco-efficiency of intensive rice production in Japan. The important factors for improving eco-efficiency are the implementation of economies of scale, reduced outsourcing of farm work, and savings in chemical fertilizers and pesticides. Expansion of the size of rice farms through the recent abolition of the rice production adjustment program will also contribute to improving the eco-efficiency of Japanese rice production.
1. Introduction
In recent decades, intensification of agriculture by various means including irrigation, fertilizers, pesticides, and mechanization has contributed to an increase in crop production but has caused harmful impacts such as global warming and eutrophication of terrestrial and aquatic environments [1,2]. Sustainable intensification that can maintain high crop yields under acceptable environmental impacts is required to meet the growing demand for food [3]. For example, efficient nutrient and water use, good soil fertility management, improved disease and pest control, and environmentally friendly farming practices are effective ways to achieve sustainable intensification of crop production [3].
Because eco-efficiency can integrate both economic and environmental aspects of production [4], it is a useful index to evaluate sustainable intensification of crop production. Eco-efficiency is defined as a product or service value per unit of environmental impact such as energy consumption, materials consumption, and greenhouse gas emissions [4]. Life cycle assessment (LCA), which is a tool for analyzing the environmental impact of products at all stages in their life cycle (from the cradle to the grave) [5], is used to calculate the values assigned to the denominator of the eco-efficiency equation, represented as [4]. In general, eco-efficiency indicators can be measured with respect to each environmental impact [4]. However, such indicators do not allow the substitution of different environmental impacts, and cannot provide a single criterion that fulfills the requirements for decision-making [6].
To calculate a single eco-efficiency index, there is a need to integrate multiple environmental impacts into a single environmental damage score for use in the denominator of an eco-efficiency equation [6]. One solution is to apply a weighting approach to LCA, which can aggregate multiple environmental impacts in accordance with their relative importance [5]. However, this solution is incomplete because the weighting depends on value choices influenced by monetary values, standards, and expert panels [5]. Another solution is to calculate a comprehensive eco-efficiency index using data envelopment analysis (DEA) [6]. DEA, which can calculate efficiency scores using linear programming techniques [7], has the advantage that it can accommodate the substitution of different performance criteria independently of subjective aggregation weightings [6].
It is important to understand the eco-efficiency of rice production to promote sustainable agriculture around the world. Rice is an important source of nutrients and constitutes a staple food in many regions in the world, especially Asian countries including Japan [8,9]. Japanese rice production is very intensive because essentially all of the rice-planted area is irrigated, large amounts of fertilizers and pesticides are used, and nearly all operations are mechanized [10]. Because the size of Japanese rice farms has traditionally been small, policy makers in Japan have used agricultural policy reforms to attach importance to the establishment of large-scale rice farming [9]. However, it is not clear whether such reforms enhance sustainable intensification of Japanese rice production.
The present study examined the aggregate eco-efficiency improvement of intensive rice production in Japan that was achieved by increasing the size of rice farms. A joint LCA and DEA methodology was applied to calculate a single eco-efficiency score for rice production. Because Japanese rice production is very intensive [10], Japan provides the best case for the analysis.
2. Literature Review
Numerous environmental impact assessment studies of rice production using LCA have been conducted. Many of these studies assessed only global warming (e.g., [11,12]) or a small number of environmental impact categories such as global warming and eutrophication (e.g., [13,14]), although several studies aggregated multiple environmental impacts using a weighting approach [15,16,17,18,19]. However, as noted above, these weighting assessments were subjective and reflected value choices [5]. The combined method of LCA and DEA used in this study can resolve these problems that were attributable to a weighting approach.
Several previous studies have used DEA to evaluate the energy efficiency/eco-efficiency of rice production [20,21,22,23,24,25,26]. Chauhan et al. [20] determined the energy efficiency of rice farmers in India using DEA. Houshyar et al. [21] applied DEA to analyze the impacts of farmers’ socioeconomic conditions on energy use and environmental impacts of Iranian rice production. Masuda [22] studied the effect of increasing the scale of rice farming on the DEA-based energy efficiency of intensive rice production in Japan. Nabavi-Pelesaraei et al. [23] assessed the CO2 reduction based on DEA optimization of energy inputs for rice production in Iran. Nabavi-Pelesaraei et al. [24] optimized the energy consumption for Iranian rice farms by employing DEA and a multiobjective genetic algorithm. Nassiri and Singh [25] calculated the DEA-based energy efficiency of rice production in India with respect to farm size classification and agro-climatic zone classification. Mohammadi et al. [26] quantified the potential environmental impact reductions and the potential economic savings for inefficient rice farmers in Iran using the physical inputs optimized by DEA.
As with the research subject of this study, Masuda [22] and Nassiri and Singh [25] analyzed the variations of DEA-based energy efficiency due to rice farm size differences. Masuda [22] concluded that an increase in farm size improves the energy efficiency of Japanese rice production, whereas Nassiri and Singh [25] revealed that compared with larger rice farmers, small rice farmers in India are energy efficient. It appears that the discrepancy between their findings reflected a difference in the intensity of rice production between Japan and India. However, because their analyses focused only on energy efficiency, a comprehensive eco-efficiency assessment is also needed.
The research subject of this study is whether increasing the scale of rice farming improves the eco-efficiency of intensive rice production. The findings obtained from the analysis should be useful for achieving sustainable intensification of rice production in developed countries such as Japan. Further, this study can give implications to construct a sustainable rice production system when a relatively low-intensity rice production in developing countries is highly intensified in the future.
3. Materials and Methods
3.1. Japanese Rice Production
Rice is a major agricultural commodity in Japan. The Ministry of Agriculture, Forestry and Fisheries of Japan (MAFF) reported that in 2015, the rice-planted area was approximately 1.5 million hectares (ha), which accounted for 33% of the total farmland [27]. In 2015, about 17% (1.5 trillion yen) of the gross national agricultural output was derived from rice [27]. Recent agricultural policy reforms such as easing farmland regulations and introducing some support programs for core farmers [9] have resulted in a steady increase in the average size of Japanese rice farms (from 1.9 to 2.4 ha per farm) [28].
In Japan, the rice production adjustment program, which hindered competitiveness by increasing rice production costs and dampening market signals, was introduced in 1971 to mitigate overproduction of rice [9]. In accordance with this program, MAFF allocated to each rice farmer an area of paddy fields to be converted from rice to upland crops in exchange for subsidies [9]. These allocation procedures under MAFF’s control were abolished in 2018 [29]. However, because the current farming income stabilization measures include direct payments for upland crops that are cultivated in paddy fields [29], abolition of the rice production adjustment program will not necessarily result in a large increase in rice production.
3.2. Data Sources
There are several articles (e.g., [17,22,30]) that referenced the data from national statistical surveys on crop production. Following Masuda [22], in this study, MAFF studies [28] on rice production costs in Japan were used to calculate DEA-based eco-efficiency scores of rice farming. The statistical reports published by MAFF are typical data sources for identifying crop production in Japan.
MAFF [28] included average data for nine size ranges of rice farms: <0.5 ha, 0.5 to <1 ha, 1 to <2 ha, 2 to <3 ha, 3 to <5 ha, 5 to <7 ha, 7 to <10 ha, 10 to <15 ha, and ≥15 ha. In the present analysis, each of these size ranges was defined as forming a rice farm. To obtain an adequate sample size for DEA calculations, the panel data for these size ranges between 2005 and 2011 were collected from MAFF [28]. The data for 2004 and earlier were excluded because of a change in the size range definitions. The data for 2012 and after were also omitted because there were no deflators to convert these production costs of inputs into real values (base year = 2005) when assessing off-farm environmental impacts based on a 2005-based input–output approach [31].
3.3. Life Cycle Assessment
3.3.1. Goal and Scope Definition
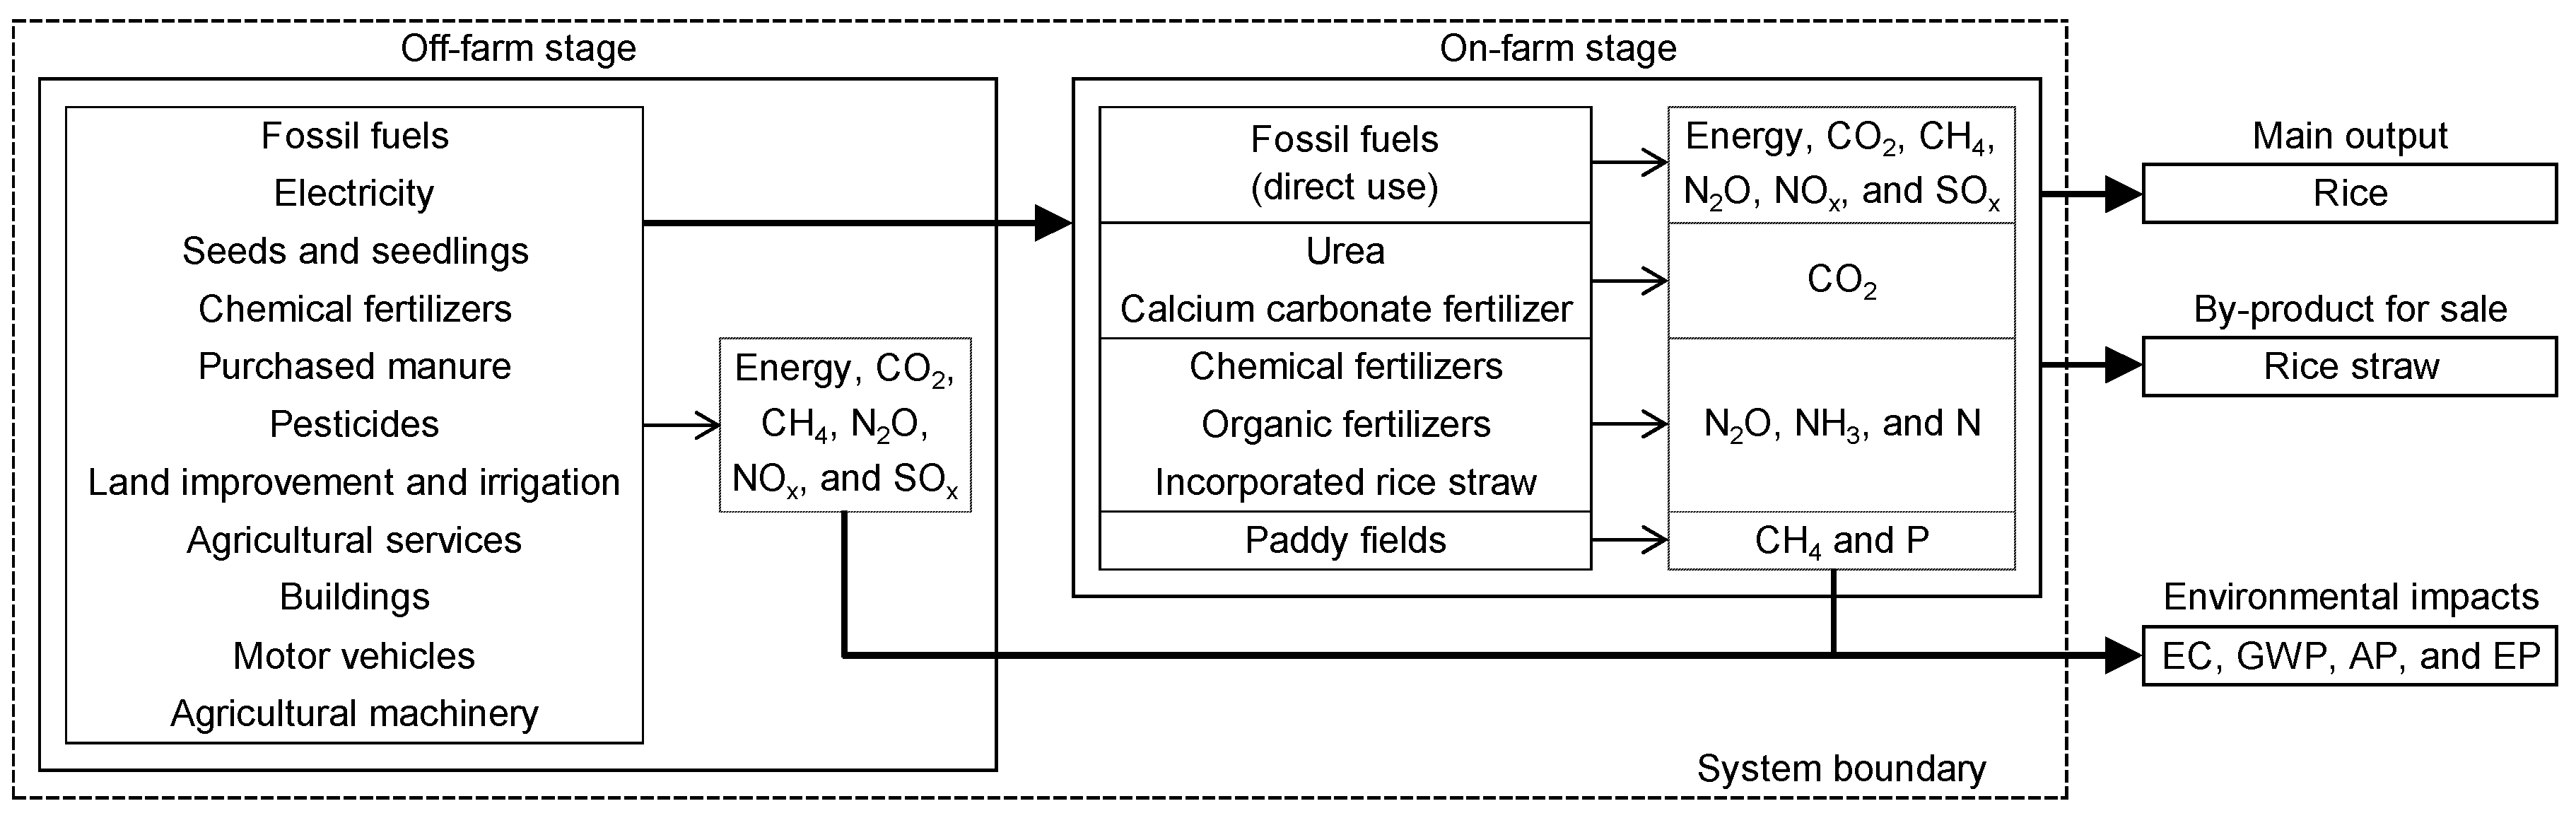
The goal of this LCA was to quantify the environmental impacts of Japanese rice production based on scale observations for a DEA input set. Because both inputs (environmental impacts) and an output (weight-based rice yield) used in DEA calculations were referenced to an area-based unit [22,30], the functional unit selected was 1 ha of rice-planted area. Figure 1 outlines the rice production system that was defined on the basis of the information from MAFF [28]. The rice production system was composed of on-farm and off-farm stages, and yielded rice as the main output and rice straw as a byproduct. The environmental impacts that were attributable to rice were allocated using economic allocation ratios, which were calculated by dividing the sales of rice by the total proceeds from rice production. Four environmental impact categories, namely energy consumption (EC), global warming potential (GWP), acidification potential (AP), and eutrophication potential (EP), were assessed as a DEA input set because they were the major environmental concerns associated with Japanese rice production [13].
3.3.2. Inventory Analysis
The input and output data for the rice production system were collected from MAFF [28] as indicated in Figure 1, and were used to calculate the energy usage and environmental load emissions.
In the on-farm stage, combustion of fossil fuels, which included heavy oil, diesel oil, kerosene, gasoline, motor oil, and premixed fuel, was related to directly consumed energy, CO2, CH4, N2O, NOx, and SOx. Energy consumption for each fuel type on a net calorific value basis was assumed to be 95% of the gross calorific value [32,33]. The greenhouse gas emission factors from Japan’s greenhouse gas inventory report were used to calculate the emissions of CO2, CH4, and N2O from direct energy use [32,34]. The NOx and SOx emission factors for fossil fuel combustion were cited from the National Institute of Agro-Environmental Sciences report [35].
Urea and calcium carbonate fertilizer applied to paddy fields release CO2 into the air. The CO2–C emission factors of urea and calcium carbonate fertilizers on a weight basis were 20% and 12%, respectively [32].
Nitrogen inputs of chemical fertilizers, organic fertilizers (purchased and self-supplied manure), and incorporated rice straw were collected to calculate nitrogen emissions to the air (N2O and NH3) and to the water (nitrogen leaching) that arose from paddy fields. The nitrogen inputs of chemical fertilizers and organic fertilizers were calculated by multiplying their quantities by the nitrogen content rates (5–46% and 0.5%, respectively [36]). Because of the lack of information about incorporated rice straw in the MAFF report [28], the quantity of incorporated rice straw was deemed to be the difference between the total production and the quantity removed from paddy fields. The total production of rice straw on a dry-matter basis was calculated by multiplying 84.5% of the actual weight-based rice yield [37] by the ratio of rice straw to rice (105.9% [38]). The dry-matter weight of rice straw removed from paddy fields was calculated by multiplying the actual weight of rice straw (calculated by dividing the sales of rice straw by the price per unit weight obtained from MAFF [39]) by the dry-matter content (87.8% [40]). Finally, the nitrogen input of incorporated rice straw was calculated by multiplying the dry-matter weight of incorporated rice straw by the nitrogen content rate (0.7% [38]).
For nitrogen input, the N2O–N emission factors were 0.31% for chemical fertilizers and organic fertilizers and 1% for incorporated rice straw [32]. The NH3–N emission factors on a per nitrogen basis were 2–15% for chemical fertilizers [41], 2% for organic fertilizers [42], and 0.9% for incorporated rice straw [43]. The amount of nitrogen leaching was assumed to be 30% of the total nitrogen input, which was the default value defined by the Intergovernmental Panel on Climate Change [32].
CH4 emitted by and phosphorus leaching from paddy fields were assumed to be independent of the inputs in the on-farm stage. The CH4 emission factors were 313.8–363.1 kg CH4/ha/year, which were calculated by dividing the total CH4 emission by the total rice-planted area in the country for each year [32]. The amount of phosphorus leaching was deemed to be constant (5.7 kg P/ha/year [44]) because in Japan, a decrease in phosphorus fertilizer input did not result in a reduction in phosphorus leaching [44].
The off-farm data were collected based on the production costs of rice, which were converted into real values using a price index for agricultural production materials (2005 = 100) [39]. Indirect energy consumption on a net calorific value basis and emissions of CO2, CH4, N2O, NOx, and SOx were calculated using the embodied global energy and air-emission coefficients based on the purchaser price for household consumables or the producer price in 2005 [31]. Nansai et al. [31] provided the CH4 and N2O emission coefficients that were converted into CO2 equivalents using the early CO2-equivalence factors (21 for CH4 and 310 for N2O) [45,46]; therefore, CH4 and N2O emission coefficients that were recalculated in terms of CH4 and N2O, respectively, were used to calculate these indirect emissions.
The values for rice and rice straw for sale were obtained from the rice production system. The weight-based rice yield was not used in this LCA, but it was collected for the DEA output variable. Data collected in the inventory analysis were allocated to rice using the economic allocation ratios.
3.3.3. Impact Assessment
EC, GWP, AP, and EP were included in the impact assessment. EC was measured in terms of net calorific values of consumed energy. For GWP, the greenhouse gas emissions were converted into CO2 equivalents using the CO2-equivalence factors for 100 years (1 of CO2, 28 of CH4, and 265 of N2O) [47]. AP on a SO2-equivalence basis was calculated by multiplying the quantities of acidifying pollutants by the SO2-equivalence factors: NOx 0.7, SOx 1, and NH3 1.88 [5]. For EP, expressed as PO4-equivalence, the eutrophying emissions were characterized using the PO4-equivalence factors for NOx (0.13), NH3 (0.35), N (0.42), and P (3.06) [5].
3.4. Data Envelopment Analysis
The decision-making units (DMUs), which are regarded as the entities responsible for converting inputs into outputs [7], corresponded to the nine size categories of rice farms that ranged from <0.5 ha to ≥15 ha. Following the framework proposed by Kuosmanen and Kortelainen [6], the DEA-based eco-efficiency scores of rice production were calculated using the environmental impacts as DEA inputs and the weight-based rice yield as a DEA output. Because there was a substantial overlap of inputs between EC, GWP, AP, and EP, a grouping procedure based on a correlation analysis was applied to avoid redundancy between the environmental impacts [30,48].
An input-oriented, slacks-based measure of efficiency (SBM) model with variable returns to scale (VRS) was used to measure the DEA-based eco-efficiency scores of rice production [22,30]. The SBM model overcomes the shortcomings of radial models such as the Charnes–Cooper–Rhodes model (i.e., the assumption of proportional changes in inputs or outputs and the neglect of slacks in reporting the efficiency score) [49]. An input-oriented DEA aims at reducing the input levels by as much as possible while keeping at least the present output levels [7]. Given that farmers have more control over the inputs responsible for environmental impacts than over the outputs [50], the adoption of an input orientation rather than an output orientation was most appropriate. When not all the DMUs operate at an optimal scale, the assumption of VRS is better than that of constant returns to scale [51]. Because Japanese rice farmers produced rice under the rice production adjustment program during the analyzed period of 2005–2011 [9,29], VRS was assumed in the DEA calculations.
When the DMUs () have m inputs () and s outputs (), the relative efficiency of each DMUo () based on an input-oriented SBM model with VRS is calculated by solving the following linear programming model [49]:
subject to
where is the SBM-input efficiency, is the ith input slack, is the rth output slack, and is the jth intensity. If equals one, a DMUo is efficient. Because an inefficient DMUo becomes efficient by deleting the input excesses (input slacks) and augmenting the output shortfalls (output slacks) [7,49], the input slacks and output slacks were assumed to be the potential input reductions and potential output increases, respectively.
DEA window analysis, where the DMU in each period is dealt with as if it were a different DMU [7,52], was applied to address the small number of DMUs. The length of the window was calculated using the following equation [7]:
where pw is the length of the window and k is the number of periods. Because k was seven years, pw was four years. Therefore, the 2005–2011 panel data based on observations of the size of rice farms were divided into 2005–2008, 2006–2009, 2007–2010, and 2008–2011 windows. Each window included 36 DMUs (multiplying nine DMUs by four years). For the purpose of comparison of eco-efficiency between the different sizes of rice farm, a cumulative average was calculated by averaging the annual averages in these windows.
4. Results
4.1. Collected Data
Table 1 presents the descriptive statistics of input and output data on an annual mean basis. To calculate the energy usage and environmental load emissions of rice production in the LCA, the input data that were allocated to rice were collected as indicated in Figure 1. As noted above, direct emissions of CH4 and phosphorus from paddy fields were calculated using constant values. The output data for rice yield were used for the DEA output. Of these data, the values of production costs, fossil fuels, rice yield, and allocation ratio were the same as those used by Masuda [22]. In a comparison of the <0.5 ha range and the ≥15 ha range farms, expansion of the size of rice farms caused a considerable reduction in several inputs: fossil fuels (−49.6 and −18.6 L/ha/year for gasoline and premixed fuel, respectively), seeds and seedlings (−50.7 thousand yen/ha/year), chemical fertilizers (−24.0 thousand yen/ha/year and −8.7 kg N/ha/year), pesticides (−23.0 thousand yen/ha/year), agricultural services (−180.8 thousand yen/ha/year), buildings (−74.0 thousand yen/ha/year), motor vehicles (−53.0 thousand yen/ha/year), and agricultural machinery (−158.0 thousand yen/ha/year).
4.2. Environmental Impacts
Table 2 presents the LCA results for rice production on an annual mean basis. Overall, the expansion of the size of rice farms resulted in the mitigation of environmental impacts. The value of EC was 39.0–64.2 GJ/ha/year, which is the same as that reported by Masuda [22]. GWP was within the range of 12,682–14,902 kg CO2 eq./ha/year. The main greenhouse gas contributing to GWP was CH4 (63.8–73.8%). The AP impacts (kg SO2 eq./ha/year) ranged from 16.7 to 23.0. There was little difference in the contribution rates to AP by NOx (29.1–31.4%), SOx (30.8–38.7%), and NH3 (29.9–39.6%). The value of EP was 29.6–31.5 kg PO4 eq./ha/year. The two greatest contributors of nutrients to EP were P (54.1–57.6%) and N (35.4–37.7%).
4.3. DEA Input and Output Data
As shown in Table 3, to group the candidate DEA input variables, analysis of the correlations between the environmental impact categories was performed on 63 samples (multiplying nine size ranges by seven years). The correlation coefficients between EC and GWP, EC and AP, and GWP and AP were 0.855 (p < 0.001), 0.978 (p < 0.001), and 0.815 (p < 0.001), respectively. However, the correlation coefficients between EP and the other categories were not very high (0.188–0.604). Further, there was no significant relationship between EP and GWP (r = 0.188, p = 0.1401). The main reasons for these relatively weak relationships between EP and the other categories are that phosphorus leaching was calculated using the constant value independent of the inputs and nitrogen input as the cause of nitrogen leaching was less important for the other categories.
Based on these results, and similarly to Masuda [30], the DEA inputs that were finally selected were GWP as a global environmental problem and EP as a regional one. The DEA output was the weight-based rice yield.
Table 4 presents the input and output data for the DEA calculations. Overall, annual variations in the data were small, although the GWP values for each rice farm size demonstrated a relatively increasing trend from 2005 to 2011. The use of the constant value per unit area for phosphorus leaching contributed to reducing the EP variations. Considering small variations of the rice yields, there was not a great change in rice production conditions during the analyzed period.
4.4. Eco-Efficiency Scores and Operational Targets
Table 5 presents the eco-efficiency scores of rice production based on DEA window analysis. From the perspective of cumulative averages, the eco-efficiency scores of rice production ranged from 0.878 for the <0.5 ha range to 0.991 for the 10 to <15 ha range. The results showed that expansion of the size of rice farms is useful to improve the eco-efficiency of rice production.
Table 6 presents the operational targets for rice production based on the cumulative averages from DEA window analysis. To improve the eco-efficiency of rice production, GWP (up to 16.2% potential reduction) was a more important reduction target than EP (up to 8.5% potential reduction). In contrast, the potential increase in the rice yield (up to 1.5%) was very low.
5. Discussion
5.1. Factors That Improve Eco-Efficiency
It was found that expansion of the size of rice farms contributed to enhancing the aggregate eco-efficiency of Japanese rice production (Table 5). These findings are consistent with the results obtained by Masuda [22], who reported an improvement of the DEA-based energy efficiency of Japanese rice production based on the increase in the size of rice farms. From the perspective of the operational targets of increasing the size of rice farms (Table 6), targeting a reduction in the environmental impacts, especially GWP, was more effective for improving the eco-efficiency of rice production than targeting an increase in rice yields.
A comparison of the values of GWP between the <0.5 ha range and the ≥15 ha range farms showed that the main means of reducing GWP (kg CO2 eq./ha/year) were, in order, agricultural machinery (−679), agricultural services (−640), buildings (−313), chemical fertilizers (−252), motor vehicles (–173), seeds and seedlings (−171), and pesticides (−110). These reductions were largely caused by decreasing the greenhouse gas emissions, especially CO2, in the off-farm stage; these indirect emissions were calculated using the emission coefficients per unit of cost based on an input–output approach [31]. The main reason for the difference in the values of EP between the <0.5 ha range and the ≥15 ha range farms was a reduction in nitrogen leaching from paddy fields (−1.0 kg PO4 eq./ha/year), which was caused by a decrease in the nitrogen inputs derived from chemical fertilizers (Table 1). The factors leading to a reduction in GWP had only limited effects on reducing EP (from −0.02 kg PO4 eq./ha/year for pesticides to −0.13 kg PO4 eq./ha/year for agricultural machinery).
Economies of scale, which occur when the farmer can spread more production over the same level of fixed expenses [55], greatly influenced the reduction in the environmental load emissions per ha of agricultural machinery, buildings, and motor vehicles as the result of an expansion of the size of rice farms. A reduction in the environmental load emissions of agricultural services per ha was achieved by reducing dependence on outside contractors for services such as harvesting by having a full complement of agricultural machinery on larger rice farms [28]. Although large-scale rice farmers invested widely in high-performance agricultural machines [28] to allow them to effectively perform farm work themselves, economies of scale nonetheless enabled a reduction in the cost of agricultural machinery per ha in large rice farms. Furthermore, the environmental load emissions of seeds and seedlings per ha decreased as the size of rice farms expanded because, in contrast to small-scale rice farmers who purchased expensive rice seedlings, large-scale rice farmers raised rice seedlings themselves from inexpensive seeds [28].
However, the main reason for a reduction in the environmental load emissions per ha of chemical fertilizers and pesticides with an increased size of rice farms is that, compared with small-scale rice farmers, large-scale rice farmers tended to adopt environmentally friendly agricultural practices, such as reduced use of chemical fertilizers and pesticides, to achieve product differentiation in the market [9]. Larger rice farms may also introduce more efficient nitrogen application techniques, which are effective in reducing nitrogen leaching from paddy fields. For example, a side-dressing technique of coated nitrogen fertilizer during rice transplanting, which is recommended throughout Japan [56], is useful to decrease the quantity of nitrogen derived from chemical fertilizers [57]. However, because a rice transplanter equipped with a fertilizer applicator for side dressing is more expensive than a normal rice transplanter [57], large-scale rice farmers can better afford to purchase these agricultural machines than can small-scale rice farmers.
5.2. Implications for Sustainable Intensification
The findings of this study suggested that expanding the size of rice farms contributes to enhancing the sustainability of intensive rice production in Japan. Japanese agricultural policy reforms that pursue the promotion of large-scale rice farms [9,29] are justified in terms of not only farm income enhancement but also eco-efficiency improvement. In the analysis, realization of economies of scale, reduction in the outsourcing of farm work, and savings in chemical fertilizers and pesticides were identified as important means of sustainable intensification for rice production. Of these factors, the implementation of economies of scale is most closely related to an increase in the rice farm size.
The rice production systems in developing countries have been less mechanized, considering that human labor was treated as an important input variable for rice production [20,21,23,24,25,26]. From the viewpoint of the reduction in the environmental load emissions per unit area from fixed capital goods such as agricultural machinery, the eco-efficiency improvement of rice production based on an increase in the size of rice farming will be achieved under the conditions of high-level mechanization. Therefore, some program that simultaneously supports both the expansion of farm size and agricultural mechanization should be an effective way to promote sustainable intensification of rice farmers in developing countries.
5.3. Limitations
This analysis had several limitations that were attributable to the data sources. The MAFF studies [28], which are the statistical reports on rice production costs in Japan, contained no information about agricultural practices and field conditions at the farm level. Because of a lack of information about the soil conditions in the paddy fields, soil carbon budgets were excluded from the GWP evaluations. CH4 emissions from paddy fields were assumed to be constant within each size range of rice farms. Although GIO [32] included the information about water regimes that was required to estimate CH4 emissions from paddy fields at the regional level, it was impossible to associate such information with the MAFF data [28] at the farm level. For the same reason, water budgets at the farm level were not taken into account in the calculations of nitrogen and phosphorus leaching from paddy fields. If actual measurement data at the farm level were available, the accuracy of these calculations could be enhanced. However, soil conditions and water regimes that are site-specific are not directly affected by an increase in the size of rice farms. Therefore, even with these limitations, the results of this analysis demonstrate that expansion of the size of rice farms is an effective way to improve the eco-efficiency of Japanese rice production.
In this study, DEA, which is a nonparametric method, was used to calculate the aggregate eco-efficiency of Japanese rice production. However, stochastic frontier models are also useful to estimate eco-efficiency of agricultural production (e.g., [58,59]), but application of such parametric approaches requires a large sample size. Because the sample size derived from the panel data was small (63 samples), a nonparametric DEA method was most appropriate for the analysis of these data.
6. Conclusions
In this study, LCA and DEA methods were jointly applied to examine whether expansion of the size of rice farms contributed to improvement of the eco-efficiency of intensive rice production in Japan. An input-oriented SBM model with VRS that had two DEA inputs (GWP and EP) and one DEA output (weight-based rice yield) was constructed to measure the aggregate eco-efficiency of rice production.
The results showed that expansion of the size of rice farms is an effective way to improve the eco-efficiency of Japanese rice production. From the perspective of operational targets, a reduction in the environmental impacts, especially GWP, was more effective for improving the eco-efficiency of rice production than an increase in rice yields. Realization of economies of scale, reduction in the outsourcing of farm work, and savings in chemical fertilizers and pesticides were identified as the key factors affecting the improvement in eco-efficiency.
Japanese agricultural policy reforms aim to develop larger rice farms. For example, the recent abolition of the rice production adjustment program will contribute to improving the eco-efficiency of Japanese rice production by expanding the size of rice farms. However, the current direct payments for upland crops that are cultivated in paddy fields may diminish the improvement in eco-efficiency of rice production by suppressing this expansion of rice farm size.
Funding
This work was supported by the Japan Society for the Promotion of Science under Grants-in-Aid for Scientific Research (Nos. 26252036 and 17K07971).
Conflicts of Interest
The author declares no conflict of interest.
References
- Foley, J.A.; Ramankutty, N.; Brauman, K.A.; Cassidy, E.S.; Gerber, J.S.; Johnston, M.; Mueller, N.D.; O’Connell, C.; Ray, D.K.; West, P.C.; et al. Solutions for a cultivated planet. Nature 2011, 478, 337–342. [Google Scholar] [CrossRef] [PubMed] [Green Version]
- Tilman, D. Global environmental impacts of agricultural expansion: The need for sustainable and efficient practices. Proc. Natl. Acad. Sci. USA 1999, 96, 5995–6000. [Google Scholar] [CrossRef] [Green Version]
- Tilman, D.; Cassman, K.G.; Matson, P.A.; Naylor, R.; Polasky, S. Agricultural sustainability and intensive production practices. Nature 2002, 418, 671–677. [Google Scholar] [CrossRef] [PubMed]
- Verfaillie, H.A.; Bidwell, R. Measuring Eco-Efficiency: A Guide to Reporting Company Performance; World Business Council for Sustainable Development: Geneva, Switzerland, 2000. [Google Scholar]
- Guinée, J.B. Handbook on Life Cycle Assessment: Operational Guide to the ISO Standards; Kluwer Academic Publishers: Dordrecht, The Netherlands, 2002. [Google Scholar]
- Kuosmanen, T.; Kortelainen, M. Measuring eco-efficiency of production with data envelopment analysis. J. Ind. Ecol. 2005, 9, 59–72. [Google Scholar] [CrossRef]
- Cooper, W.W.; Seiford, L.M.; Tone, K. Data Envelopment Analysis: A Comprehensive Text with Models, Applications, References and DEA-Solver Software, 2nd ed.; Springer: New York, NY, USA, 2007. [Google Scholar]
- McKevith, B. Nutritional aspects of cereals. Nutr. Bull. 2004, 29, 111–142. [Google Scholar] [CrossRef]
- Organisation for Economic Co-operation and Development (OECD). Evaluation of Agricultural Policy Reforms in Japan; OECD Publishing: Paris, France, 2009. [Google Scholar]
- Barker, R.; Herdt, R.W. The Rice Economy of Asia; Resources for the Future: Washington, DC, USA, 1985. [Google Scholar]
- Hayashi, K.; Makino, N.; Shobatake, K.; Hokazono, S. Influence of scenario uncertainty in agricultural inputs on life cycle greenhouse gas emissions from agricultural production systems: The case of chemical fertilizers in Japan. J. Clean. Prod. 2014, 73, 109–115. [Google Scholar] [CrossRef]
- Masuda, K. Optimization model for mitigating global warming at the farm scale: An application to Japanese rice farms. Sustainability 2016, 8, 593. [Google Scholar] [CrossRef]
- Hokazono, S.; Hayashi, K. Variability in environmental impacts during conversion from conventional to organic farming: A comparison among three rice production systems in Japan. J. Clean. Prod. 2012, 28, 101–112. [Google Scholar] [CrossRef]
- Leon, A.; Kohyama, K. Estimating nitrogen and phosphorus losses from lowland paddy rice fields during cropping seasons and its application for life cycle assessment. J. Clean. Prod. 2017, 164, 963–979. [Google Scholar] [CrossRef]
- He, X.; Qiao, Y.; Liang, L.; Knudsen, M.T.; Martin, F. Environmental life cycle assessment of long-term organic rice production in subtropical China. J. Clean. Prod. 2018, 176, 880–888. [Google Scholar] [CrossRef]
- Khoshnevisan, B.; Rajaeifar, M.A.; Clark, S.; Shamahirband, S.; Anuar, N.B.; Shuib, N.L.M.; Gani, A. Evaluation of traditional and consolidated rice farms in Guilan Province, Iran, using life cycle assessment and fuzzy modeling. Sci. Total Environ. 2014, 481, 242–251. [Google Scholar] [CrossRef] [PubMed]
- Kim, S.; Kim, T.; Smith, T.M.; Suh, K. Environmental implications of eco-labeling for rice farming systems. Sustainability 2018, 10, 1050. [Google Scholar] [CrossRef]
- Tayefeh, M.; Sadeghi, S.M.; Noorhosseini, S.A.; Bacenetti, J.; Damalas, C.A. Environmental impact of rice production based on nitrogen fertilizer use. Environ. Sci. Pollut. Res. 2018, 25, 15885–15895. [Google Scholar] [CrossRef] [PubMed]
- Wang, M.; Xia, X.; Zhang, Q.; Liu, J. Life cycle assessment of a rice production system in Taihu region, China. Int. J. Sust. Dev. World 2010, 17, 157–161. [Google Scholar] [CrossRef]
- Chauhan, N.S.; Mohapatra, P.K.J.; Pandey, K.P. Improving energy productivity in paddy production through benchmarking: An application of data envelopment analysis. Energy Convers. Manag. 2006, 47, 1063–1085. [Google Scholar] [CrossRef]
- Houshyar, E.; Chen, B.; Chen, G.Q. Environmental impacts of rice production analyzed via social capital development: An Iranian case study with a life cycle assessment/data envelopment analysis approach. Ecol. Indic. 2019, 105, 675–687. [Google Scholar] [CrossRef]
- Masuda, K. Energy efficiency of intensive rice production in Japan: An application of data envelopment analysis. Sustainability 2018, 10, 120. [Google Scholar] [CrossRef]
- Nabavi-Pelesaraei, A.; Abdi, R.; Rafiee, S.; Taromi, K. Applying data envelopment analysis approach to improve energy efficiency and reduce greenhouse gas emission of rice production. Eng. Agric. Environ. Food 2014, 7, 155–162. [Google Scholar] [CrossRef]
- Nabavi-Pelesaraei, A.; Rafiee, S.; Mohtasebi, S.S.; Hosseinzadeh-Bandbafha, H.; Chau, K. Energy consumption enhancement and environmental life cycle assessment in paddy production using optimization techniques. J. Clean. Prod. 2017, 162, 571–586. [Google Scholar] [CrossRef]
- Nassiri, S.M.; Singh, S. Study on energy use efficiency for paddy crop using data envelopment analysis (DEA) technique. Appl. Energy 2009, 86, 1320–1325. [Google Scholar] [CrossRef]
- Mohammadi, A.; Rafiee, S.; Jafari, A.; Keyhani, A.; Dalgaard, T.; Knudsen, M.T.; Nguyen, T.L.; Borek, R.; Hermansen, J.E. Joint Life Cycle Assessment and Data Envelopment Analysis for the benchmarking of environmental impacts in rice paddy production. J. Clean. Prod. 2015, 106, 521–532. [Google Scholar] [CrossRef]
- Ministry of Agriculture, Forestry and Fisheries of Japan (MAFF). Pocketbook of Agriculture, Forestry and Fisheries Statistics in 2017; Association of Agriculture and Forestry Statistics: Tokyo, Japan, 2018. (In Japanese)
- Ministry of Agriculture, Forestry and Fisheries of Japan (MAFF). Production Cost of Rice, Wheat and Barley (2005–2011). Available online: http://www.maff.go.jp/j/tokei/kouhyou/noukei/seisanhi_nousan/ (accessed on 2 September 2015). (In Japanese)
- Ministry of Agriculture, Forestry and Fisheries of Japan (MAFF). Summary of Farming Income Stabilization Measures in 2018. Available online: http://www.maff.go.jp/j/kobetu_ninaite/keiei/attach/pdf/pamph-17.pdf (accessed on 6 November 2018). (In Japanese)
- Masuda, K. Measuring eco-efficiency of wheat production in Japan: A combined application of life cycle assessment and data envelopment analysis. J. Clean. Prod. 2016, 126, 373–381. [Google Scholar] [CrossRef]
- Nansai, K.; Kondo, Y.; Kagawa, S.; Suh, S.; Nakajima, K.; Inaba, R.; Tohno, S. Estimates of embodied global energy and air-emission intensities of Japanese products for building a Japanese input-output life cycle assessment database with a global system boundary. Environ. Sci. Technol. 2012, 46, 9146–9154. [Google Scholar] [CrossRef] [PubMed]
- Greenhouse Gas Inventory Office of Japan (GIO). National Greenhouse Gas. Inventory Report of Japan (2018); National Institute for Environmental Studies: Tsukuba, Japan, 2018.
- International Energy Agency (IEA). Energy Statistics Manual; IEA Publications: Paris, France, 2005. [Google Scholar]
- Kainou, K. Recommendation of Draft Revised Standard Calorific Value and Carbon Emission Factor for Fossil Fuel Energy Sources in Japan: 2013 FY Revised Standard Calorific Value and Carbon Emission Factor, Revised Edition (January 2016); RIETI Discussion Paper Series 14-J-047; Research Institute of Economy, Trade and Industry: Tokyo, Japan, 2016. (In Japanese)
- National Institute for Agro-Environmental Sciences (NIAES). Manual for Life Cycle Assessment of Agricultural Practices in Japan; NIAES: Tsukuba, Japan, 2003. (In Japanese)
- Association of Agriculture and Forestry Statistics (AAFS). Pocket Directory of Fertilizers 2011/2012; AAFS: Tokyo, Japan, 2013. (In Japanese) [Google Scholar]
- Ministry of Education, Culture, Sports, Science and Technology of Japan (MEXT). Food Composition Database. Available online: http://fooddb.mext.go.jp/ (accessed on 7 October 2015). (In Japanese)
- Owa, N. Nutrient balances of crops in Japan. Kanhonokenren News 1996, 33, 428–445. (In Japanese) [Google Scholar]
- Ministry of Agriculture, Forestry and Fisheries of Japan (MAFF). Statistics on Commodity Prices in Agriculture (2005–2011). Available online: http://www.maff.go.jp/j/tokei/kouhyou/noubukka/ (accessed on 5 October 2015). (In Japanese)
- National Agricultural Research Organization (NARO). Standard Tables of Feed Composition in Japan (2001); Japan Livestock Industry Association: Tokyo, Japan, 2002. (In Japanese)
- Asman, W.A.H. Ammonia Emission in Europe: Updated Emission and Emission Variations; Report No. 228471008; National Institute of Public Health and Environmental Protection: Bilthoven, The Netherlands, 1992. [Google Scholar]
- AMAFE Joint Research Team. User Manual of Decision Support System for Application of Manure and Fertilizer to Grassland and Forage Corn Field Based on Nutrient Recycling (AMAFE 2006); AMAFE Joint Research Team: Kitahiroshima, Japan, 2006. (In Japanese) [Google Scholar]
- Mannheim, T.; Braschkat, J.; Marschner, H. Ammonia emissions from senescing plants and during decomposition of crop residues. J. Plant. Nutr. Soil Sci. 1997, 160, 125–132, (In German with English abstract). [Google Scholar]
- Haruta, S.; Sudo, M.; Eguchi, S.; Okubo, T.; Kuroda, H.; Takeda, I.; Fujiwara, T.; Yamamoto, T.; Hitomi, T.; Shiratani, E.; et al. Effluent N, P and COD loads from paddy fields in Japan: A critical review. J. Jpn. Soc. Water Environ. 2015, 38, 81–91, (In Japanese with English abstract). [Google Scholar] [CrossRef]
- Greenhouse Gas Inventory Office of Japan (GIO). National Greenhouse Gas. Inventory Report of Japan (2013); National Institute for Environmental Studies: Tsukuba, Japan, 2013.
- Nansai, K. Estimation Methods of Sectoral Energy Consumption and Greenhouse Gas Emissions Based on 2005 Input-Output Tables, Revised Edition (August 2013). Available online: http://www.cger.nies.go.jp/publications/report/d031/jpn/pdf/6/3EID2005_Method_jp.pdf (accessed on 2 June 2016). (In Japanese)
- Stocker, T.F.; Qin, D.; Plattner, G.-K.; Tignor, M.; Allen, S.K.; Boschung, J.; Nauels, A.; Xia, Y.; Bex, V.; Midgley, P.M. Climate Change 2013: The Physical Science Basis; Cambridge University Press: New York, NY, USA, 2013. [Google Scholar]
- Jan, P.; Dux, D.; Lips, M.; Alig, M.; Dumondel, M. On the link between economic and environmental performance of Swiss dairy farms of the alpine area. Int. J. Life Cycl. Assess. 2012, 17, 706–719. [Google Scholar] [CrossRef] [Green Version]
- Tone, K. Slacks-based measure of efficiency. In Handbook on Data Envelopment Analysis, 2nd ed.; Cooper, W.W., Seiford, L.M., Zhu, J., Eds.; Springer: New York, NY, USA, 2011; pp. 195–209. [Google Scholar]
- Galanopoulos, K.; Aggelopoulos, S.; Kamenidou, I.; Mattas, K. Assessing the effects of managerial and production practices on the efficiency of commercial pig farming. Agr. Syst. 2006, 88, 125–141. [Google Scholar] [CrossRef]
- Lozano, S.; Iribarren, D.; Moreira, M.T.; Feijoo, G. The link between operational efficiency and environmental impacts: A joint application of Life Cycle Assessment and Data Envelopment Analysis. Sci. Total Environ. 2009, 407, 1744–1754. [Google Scholar] [CrossRef]
- Cooper, W.W.; Seiford, L.M.; Zhu, J. Data envelopment analysis: History, models, and interpretations. In Handbook on Data Envelopment Analysis, 2nd ed.; Cooper, W.W., Seiford, L.M., Zhu, J., Eds.; Springer: New York, NY, USA, 2011; pp. 1–39. [Google Scholar]
- SaiTech. User’s Guide to DEA-Solver-PRO (Professional Version 14.0); SaiTech: Holmdel, NJ, USA, 2017. [Google Scholar]
- Social Survey Research Information Co., Ltd. (SSRI). BellCurve for Excel. Available online: https://bellcurve.jp/ex/ (accessed on 3 December 2018). (In Japanese).
- Duffy, M. Economies of size in production agriculture. J. Hunger Environ. Nutr. 2009, 4, 375–392. [Google Scholar] [CrossRef]
- Ministry of Agriculture, Forestry and Fisheries of Japan (MAFF). Prefectural Recommendations of Fertilizers. Available online: http://www.maff.go.jp/j/seisan/kankyo/hozen_type/h_sehi_kizyun/ (accessed on 9 January 2019). (In Japanese)
- ZEN-NOH. Side-Dressing Technique of Fertilizer for Rice Production. Available online: https://www.zennoh.or.jp/eigi/research/pdf/technology_03.pdf (accessed on 8 January 2019). (In Japanese).
- Reinhard, S.; Lovell, C.A.K.; Thijssen, G. Econometric estimation of technical and environmental efficiency: An application to Dutch dairy farms. Amer. J. Agr. Econ. 1999, 81, 44–60. [Google Scholar] [CrossRef]
- Deng, X.; Gibson, J. Improving eco-efficiency for the sustainable agricultural production: A case study in Shandong, China. Technol. Forecast. Soc. 2019, 144, 394–400. [Google Scholar] [CrossRef]
Figure 1.
A simplified flowchart of rice production. EC, energy consumption; GWP, global warming potential; AP, acidification potential; EP, eutrophication potential.
Figure 1.
A simplified flowchart of rice production. EC, energy consumption; GWP, global warming potential; AP, acidification potential; EP, eutrophication potential.


Table 1.
Descriptive statistics of input and output data on an annual mean basis (2005–2011, per year) 1.
Table 1.
Descriptive statistics of input and output data on an annual mean basis (2005–2011, per year) 1.
| Rice Farm Size (ha Per Farm) | |||||||||
|---|---|---|---|---|---|---|---|---|---|
| <0.5 | 0.5 to <1 | 1 to <2 | 2 to <3 | 3 to <5 | 5 to <7 | 7 to <10 | 10 to <15 | ≥15 | |
| Production costs (thousand yen/ha) 2,3 | |||||||||
| Fossil fuels | 31.8 | 30.7 | 29.9 | 28.7 | 28.5 | 27.9 | 29.6 | 31.7 | 27.9 |
| (3.4) | (2.6) | (2.5) | (2.8) | (3.5) | (2.6) | (3.4) | (3.6) | (3.5) | |
| Electricity | 4.4 | 5.5 | 7.3 | 7.2 | 6.5 | 7.3 | 6.5 | 7.3 | 5.4 |
| (0.7) | (0.8) | (0.4) | (0.7) | (0.4) | (0.6) | (0.5) | (1.1) | (0.7) | |
| Seeds and seedlings | 66.8 | 46.3 | 32.8 | 23.9 | 23.4 | 20.5 | 18.1 | 16.6 | 16.1 |
| (5.3) | (5.4) | (3.3) | (0.9) | (2.6) | (1.4) | (1.9) | (1.1) | (0.5) | |
| Chemical fertilizers | 88.3 | 81.8 | 75.5 | 75.8 | 71.5 | 76.6 | 69.7 | 63.0 | 64.3 |
| (8.8) | (7.7) | (5.4) | (7.7) | (6.5) | (5.4) | (9.3) | (5.5) | (3.8) | |
| Purchased manure 4 | 4.1 | 4.1 | 4.6 | 2.4 | 1.9 | 3.4 | 1.3 | 2.4 | 3.3 |
| (1.0) | (1.0) | (0.4) | (1.1) | (1.0) | (0.8) | (1.4) | (0.8) | (1.9) | |
| Pesticides | 72.5 | 68.6 | 66.5 | 64.3 | 62.4 | 66.4 | 61.7 | 55.2 | 49.5 |
| (3.8) | (2.8) | (3.6) | (3.3) | (3.1) | (5.4) | (4.5) | (4.2) | (3.4) | |
| Land improvement and irrigation | 42.5 | 43.6 | 47.3 | 49.0 | 52.7 | 55.8 | 51.7 | 55.7 | 49.0 |
| (7.0) | (10.1) | (5.5) | (6.2) | (13.1) | (5.5) | (7.5) | (3.9) | (5.3) | |
| Agricultural services | 232.4 | 180.8 | 112.1 | 81.5 | 67.6 | 55.9 | 58.9 | 57.0 | 51.6 |
| (19.7) | (14.9) | (15.1) | (8.4) | (11.7) | (9.8) | (9.7) | (8.8) | (4.8) | |
| Buildings | 107.4 | 82.9 | 56.0 | 37.7 | 30.5 | 25.7 | 33.8 | 38.2 | 33.4 |
| (35.0) | (23.8) | (10.8) | (6.3) | (4.5) | (5.5) | (4.4) | (5.1) | (4.0) | |
| Motor vehicles | 66.2 | 50.5 | 32.8 | 26.1 | 21.0 | 16.8 | 15.9 | 16.3 | 13.2 |
| (14.5) | (5.5) | (3.6) | (5.5) | (1.0) | (2.5) | (2.7) | (3.5) | (1.9) | |
| Agricultural machinery | 309.5 | 303.1 | 246.4 | 197.1 | 194.1 | 159.3 | 158.0 | 147.9 | 151.4 |
| (61.6) | (37.9) | (12.7) | (13.8) | (13.9) | (14.3) | (25.6) | (11.9) | (7.2) | |
| Fossil fuels (L/ha) 2 | |||||||||
| Heavy oil | 0 | 0.1 | 0 | 0 | 0 | 0.1 | 0 | 0 | 0 |
| (0) | (0.4) | (0) | (0) | (0) | (0.4) | (0) | (0) | (0) | |
| Diesel oil | 111.4 | 116.4 | 116.7 | 119.4 | 120.1 | 121.2 | 136.0 | 153.9 | 152.8 |
| (11.6) | (7.9) | (1.6) | (8.7) | (7.8) | (2.4) | (6.2) | (11.4) | (9.2) | |
| Kerosene | 34.4 | 43.4 | 73.4 | 79.9 | 88.4 | 98.2 | 108.9 | 109.8 | 103.4 |
| (4.8) | (2.9) | (5.2) | (6.8) | (9.7) | (4.8) | (5.0) | (16.2) | (9.0) | |
| Gasoline | 94.2 | 88.2 | 75.6 | 72.2 | 67.0 | 59.4 | 60.1 | 64.7 | 44.5 |
| (5.0) | (4.0) | (4.5) | (7.2) | (2.9) | (7.6) | (3.2) | (5.5) | (10.2) | |
| Motor oil | 5.0 | 3.6 | 3.5 | 3.4 | 2.5 | 3.1 | 2.5 | 3.2 | 1.8 |
| (1.2) | (0.7) | (0.5) | (0.5) | (0.5) | (0.7) | (0.5) | (0.5) | (0.4) | |
| Premixed fuel | 19.4 | 15.1 | 8.9 | 4.6 | 4.3 | 2.9 | 2.9 | 2.5 | 0.8 |
| (1.6) | (1.4) | (1.3) | (1.1) | (0.8) | (0.6) | (1.1) | (1.1) | (0.7) | |
| Chemical fertilizers for CO2 emission sources (kg/ha) 2 | |||||||||
| Urea | 1.0 | 0.7 | 1.3 | 1.3 | 1.1 | 1.7 | 1.7 | 3.1 | 5.0 |
| (0.6) | (0.9) | (0.9) | (0.7) | (1.0) | (0.9) | (2.2) | (2.7) | (5.2) | |
| Calcium carbonate fertilizer | 1.0 | 18.7 | 1.7 | 8.8 | 5.0 | 8.6 | 7.7 | 1.9 | 1.2 |
| (1.1) | (5.0) | (1.4) | (10.5) | (5.5) | (15.5) | (9.8) | (2.4) | (2.2) | |
| Nitrogen inputs (kg N/ha) 2 | |||||||||
| Chemical fertilizers | 66.6 | 64.8 | 58.3 | 61.0 | 55.9 | 61.5 | 62.5 | 56.7 | 57.9 |
| (3.3) | (3.9) | (3.4) | (2.8) | (5.2) | (2.9) | (2.8) | (6.6) | (7.2) | |
| Organic fertilizers 4 | 4.0 | 6.1 | 5.2 | 3.1 | 3.1 | 5.2 | 2.6 | 2.9 | 4.4 |
| (0.9) | (2.1) | (1.1) | (1.5) | (0.9) | (1.1) | (2.8) | (1.7) | (1.6) | |
| Incorporated rice straw | 23.5 | 22.9 | 23.7 | 24.3 | 24.2 | 24.9 | 25.5 | 24.0 | 23.6 |
| (1.1) | (1.6) | (1.7) | (0.9) | (1.7) | (1.5) | (2.5) | (1.4) | (2.8) | |
| Total | 94.1 | 93.8 | 87.2 | 88.5 | 83.3 | 91.5 | 90.6 | 83.6 | 86.0 |
| (4.2) | (4.0) | (4.1) | (4.3) | (6.4) | (2.9) | (3.6) | (7.9) | (11.0) | |
| Rice yield (kg/ha) | 5084 | 5040 | 5113 | 5231 | 5277 | 5346 | 5419 | 5380 | 5207 |
| (131) | (80) | (72) | (128) | (93) | (139) | (189) | (194) | (131) | |
| Allocation ratio | 0.978 | 0.977 | 0.978 | 0.978 | 0.977 | 0.978 | 0.979 | 0.974 | 0.976 |
| (0.002) | (0.003) | (0.004) | (0.002) | (0.003) | (0.004) | (0.005) | (0.003) | (0.006) | |
1 Values in parentheses are standard deviations. Sources of these data are described in the text. Data on production costs, fossil fuels, rice yield, and allocation ratio are the same as those used by Masuda [22]. 2 Data were allocated to rice using economic allocation ratios. 3 Production costs are real values (base year = 2005). 4 Costs of purchased manure included the valuations of self-supplied manure. Nitrogen inputs of organic fertilizers were derived from both purchased and self-supplied manure.
Table 2.
LCA results for rice production on an annual mean basis (2005–2011, per year) 1.
| Rice Farm Size (ha Per Farm) | |||||||||
|---|---|---|---|---|---|---|---|---|---|
| <0.5 | 0.5 to <1 | 1 to <2 | 2 to <3 | 3 to <5 | 5 to <7 | 7 to <10 | 10 to <15 | ≥15 | |
| EC (GJ/ha) | 64.2 | 58.9 | 51.1 | 45.5 | 43.6 | 42.1 | 42.0 | 42.3 | 39.0 |
| (5.8) | (3.4) | (1.2) | (2.0) | (1.2) | (1.5) | (1.9) | (1.5) | (1.8) | |
| GWP (kg CO2 eq./ha) | 14902 | 14410 | 13727 | 13263 | 13086 | 12987 | 12961 | 12880 | 12682 |
| (1002) | (801) | (553) | (689) | (495) | (639) | (637) | (484) | (393) | |
| CO2 | 34.3% | 32.5% | 29.5% | 27.3% | 26.5% | 25.8% | 25.7% | 25.7% | 24.4% |
| CH4 | 63.8% | 65.7% | 68.7% | 70.9% | 71.8% | 72.3% | 72.5% | 72.6% | 73.8% |
| N2O | 1.9% | 1.8% | 1.8% | 1.8% | 1.7% | 1.8% | 1.8% | 1.7% | 1.8% |
| AP (kg SO2 eq./ha) | 23.0 | 21.5 | 18.9 | 17.9 | 16.8 | 17.1 | 17.2 | 16.9 | 16.7 |
| (1.5) | (0.8) | (0.4) | (0.6) | (0.8) | (0.4) | (0.6) | (0.7) | (0.8) | |
| NOx | 31.4% | 31.1% | 30.9% | 29.8% | 30.5% | 29.1% | 29.7% | 31.2% | 29.6% |
| SOx | 38.7% | 37.4% | 35.9% | 33.6% | 33.9% | 32.0% | 31.7% | 32.2% | 30.8% |
| NH3 | 29.9% | 31.5% | 33.2% | 36.6% | 35.6% | 38.9% | 38.7% | 36.6% | 39.6% |
| EP (kg PO4 eq./ha) | 31.5 | 31.4 | 30.3 | 30.4 | 29.6 | 30.7 | 30.7 | 29.6 | 30.0 |
| (0.5) | (0.6) | (0.6) | (0.6) | (1.0) | (0.4) | (0.6) | (1.1) | (1.6) | |
| NOx | 4.2% | 4.0% | 3.6% | 3.3% | 3.2% | 3.0% | 3.1% | 3.3% | 3.1% |
| NH3 | 4.1% | 4.0% | 3.9% | 4.0% | 3.8% | 4.0% | 4.0% | 3.9% | 4.1% |
| N | 37.6% | 37.7% | 36.2% | 36.7% | 35.4% | 37.5% | 37.2% | 35.5% | 36.1% |
| P | 54.1% | 54.3% | 56.3% | 56.1% | 57.6% | 55.5% | 55.7% | 57.3% | 56.7% |
EC, energy consumption; GWP, global warming potential; AP, acidification potential; EP, eutrophication potential. 1 Values in parentheses are standard deviations. EC results are the same as those used by Masuda [22].
Table 3.
Pearson correlation coefficients between the environmental impact variables.
| EC | GWP | AP | EP | |
|---|---|---|---|---|
| EC | 1 | |||
| GWP | 0.855 ** | 1 | ||
| AP | 0.978 ** | 0.815 ** | 1 | |
| EP | 0.489 ** | 0.188 | 0.604 ** | 1 |
EC, energy consumption; GWP, global warming potential; AP, acidification potential; EP, eutrophication potential; ** indicates statistical significance at 1% level.
Table 4.
Input and output data for the DEA calculations.
| Rice Farm Size (ha Per Farm) | |||||||||
|---|---|---|---|---|---|---|---|---|---|
| <0.5 | 0.5 to <1 | 1 to <2 | 2 to <3 | 3 to <5 | 5 to <7 | 7 to <10 | 10 to <15 | ≥15 | |
| GWP (kg CO2 eq./ha) | |||||||||
| 2005 | 13855 | 13652 | 13144 | 12483 | 12659 | 12278 | 12402 | 12380 | 12369 |
| 2006 | 13789 | 13315 | 13151 | 12511 | 12369 | 12244 | 12148 | 12251 | 12224 |
| 2007 | 14136 | 13910 | 13315 | 12827 | 12766 | 12588 | 12507 | 12596 | 12513 |
| 2008 | 15031 | 14778 | 13920 | 13384 | 13346 | 13174 | 13038 | 12980 | 12879 |
| 2009 | 15333 | 14584 | 13748 | 13450 | 13202 | 13135 | 13151 | 13073 | 12447 |
| 2010 | 16303 | 15394 | 14535 | 14251 | 13636 | 13867 | 13770 | 13495 | 13254 |
| 2011 | 15870 | 15241 | 14275 | 13938 | 13620 | 13621 | 13709 | 13384 | 13091 |
| EP (kg PO4 eq./ha) | |||||||||
| 2005 | 32.2 | 32.1 | 31.4 | 30.7 | 31.5 | 30.9 | 31.6 | 31.0 | 31.4 |
| 2006 | 32.2 | 31.6 | 30.7 | 30.4 | 30.0 | 30.6 | 31.0 | 30.7 | 31.7 |
| 2007 | 31.2 | 31.5 | 30.0 | 30.4 | 29.4 | 30.3 | 30.6 | 30.2 | 31.7 |
| 2008 | 31.2 | 31.4 | 30.4 | 30.7 | 29.9 | 31.1 | 30.2 | 29.4 | 29.9 |
| 2009 | 31.0 | 30.2 | 30.1 | 29.7 | 29.0 | 30.3 | 30.2 | 29.1 | 28.1 |
| 2010 | 31.1 | 31.4 | 29.9 | 31.4 | 28.6 | 31.5 | 31.0 | 27.9 | 28.8 |
| 2011 | 31.9 | 31.4 | 29.5 | 29.6 | 28.9 | 30.6 | 30.1 | 29.1 | 28.6 |
| Rice yield (kg/ha) 1 | |||||||||
| 2005 | 5180 | 5110 | 5190 | 5240 | 5330 | 5410 | 5580 | 5640 | 5310 |
| 2006 | 4920 | 4980 | 5040 | 5070 | 5260 | 5350 | 5400 | 5420 | 5370 |
| 2007 | 4910 | 5090 | 5010 | 5080 | 5250 | 5360 | 5280 | 5300 | 5230 |
| 2008 | 5150 | 5160 | 5200 | 5400 | 5450 | 5570 | 5760 | 5580 | 5240 |
| 2009 | 5140 | 5000 | 5110 | 5180 | 5230 | 5210 | 5230 | 5240 | 5030 |
| 2010 | 5040 | 4940 | 5090 | 5300 | 5150 | 5140 | 5290 | 5080 | 5030 |
| 2011 | 5250 | 5000 | 5150 | 5350 | 5270 | 5380 | 5390 | 5400 | 5240 |
GWP, global warming potential; EP, eutrophication potential; 1 MAFF [28].
Table 5.
Eco-efficiency scores of rice production based on DEA window analysis.
| Rice Farm Size (ha Per Farm) | |||||||||
|---|---|---|---|---|---|---|---|---|---|
| <0.5 | 0.5 to <1 | 1 to <2 | 2 to <3 | 3 to <5 | 5 to <7 | 7 to <10 | 10 to <15 | ≥15 | |
| 2005–2008 average | 0.909 | 0.919 | 0.951 | 0.976 | 0.985 | 0.988 | 0.993 | 0.997 | 0.978 |
| 2006–2009 average | 0.880 | 0.896 | 0.929 | 0.953 | 0.979 | 0.974 | 0.983 | 0.989 | 0.977 |
| 2007–2010 average | 0.866 | 0.880 | 0.921 | 0.938 | 0.970 | 0.955 | 0.970 | 0.991 | 0.974 |
| 2008–2011 average | 0.856 | 0.870 | 0.918 | 0.937 | 0.964 | 0.940 | 0.957 | 0.988 | 0.979 |
| Cumulative average | 0.878 | 0.891 | 0.930 | 0.951 | 0.975 | 0.964 | 0.976 | 0.991 | 0.977 |
Table 6.
Operational targets for rice production based on the cumulative averages from DEA window analysis.
Table 6.
Operational targets for rice production based on the cumulative averages from DEA window analysis.
| Rice Farm Size (ha Per Farm) | |||||||||
|---|---|---|---|---|---|---|---|---|---|
| <0.5 | 0.5 to <1 | 1 to <2 | 2 to <3 | 3 to <5 | 5 to <7 | 7 to <10 | 10 to <15 | ≥15 | |
| GWP | |||||||||
| Potential reduction (kg CO2 eq./ha) | 2419 | 1973 | 1241 | 670 | 463 | 381 | 300 | 131 | 205 |
| Potential reduction rate (%) | 16.2 | 13.7 | 9.0 | 5.1 | 3.5 | 2.9 | 2.3 | 1.0 | 1.6 |
| EP | |||||||||
| Potential reduction (kg PO4 eq./ha) | 2.7 | 2.6 | 1.5 | 1.5 | 0.5 | 1.3 | 0.8 | 0.2 | 0.9 |
| Potential reduction rate (%) | 8.5 | 8.3 | 5.1 | 4.9 | 1.6 | 4.3 | 2.7 | 0.8 | 3.1 |
| Rice yield | |||||||||
| Potential increase (kg/ha) | 76.9 | 65.6 | 40.0 | 24.4 | 0 | 0 | 0 | 0 | 3.0 |
| Potential increase rate (%) | 1.5 | 1.3 | 0.8 | 0.5 | 0 | 0 | 0 | 0 | 0.1 |
GWP, global warming potential; EP, eutrophication potential.
© 2019 by the author. Licensee MDPI, Basel, Switzerland. This article is an open access article distributed under the terms and conditions of the Creative Commons Attribution (CC BY) license (http://creativecommons.org/licenses/by/4.0/).
Share and Cite
MDPI and ACS Style
Masuda, K. Eco-Efficiency Assessment of Intensive Rice Production in Japan: Joint Application of Life Cycle Assessment and Data Envelopment Analysis. Sustainability 2019, 11, 5368. https://doi.org/10.3390/su11195368
AMA Style
Masuda K. Eco-Efficiency Assessment of Intensive Rice Production in Japan: Joint Application of Life Cycle Assessment and Data Envelopment Analysis. Sustainability. 2019; 11(19):5368. https://doi.org/10.3390/su11195368
Chicago/Turabian StyleMasuda, Kiyotaka. 2019. "Eco-Efficiency Assessment of Intensive Rice Production in Japan: Joint Application of Life Cycle Assessment and Data Envelopment Analysis" Sustainability 11, no. 19: 5368. https://doi.org/10.3390/su11195368
Note that from the first issue of 2016, this journal uses article numbers instead of page numbers. See further details here.