Article

GIS-Based Site Selection for Check Dams in Watersheds: Considering Geomorphometric and Topo-Hydrological Factors

1
Soil Conservation and Watershed Management Research Department, Kurdistan Agricultural and Natural Resources Research and Education Center, AREEO, Sanandaj 6616936311, Iran
2
Department of Physical Geography and Bolin Centre for Climate Research, Stockholm University, SE-106 91 Stockholm, Sweden
3
Faculty of Natural Resources, University of Tehran, Karaj 31587-77871, Iran
4
Department of Geography, University of Tartu, Vanemuise St. 46, 51003 Tartu, Estonia
5
Department of Watershed Management, Faculty of Agriculture and Natural Resources, Lorestan University, Khorramabad 68151-44316, Iran
6
Department of Watershed Management, Gorgan University of Agricultural Sciences and Natural Resources, Gorgan 4918943464, Iran
7
Geographic Information Science Research Group, Ton Duc Thang University, Ho Chi Minh City 70000, Vietnam
8
Faculty of Environment and Labour Safety, Ton Duc Thang University, Ho Chi Minh City 70000, Vietnam
*
Author to whom correspondence should be addressed.
Sustainability 2019, 11(20), 5639; https://doi.org/10.3390/su11205639
Submission received: 18 July 2019 / Revised: 25 September 2019 / Accepted: 10 October 2019 / Published: 13 October 2019
(This article belongs to the Special Issue Watershed Modelling and Management for Sustainability)

Abstract

:
Check dams are widely used watershed management measures for reducing flood peak discharge and sediment transport, and increasing lag time and groundwater recharge throughout the world. However, identifying the best suitable sites for check dams within the stream networks of various watersheds remains challenging. This study aimed to develop an open-source software with user-friendly interface for screening the stream network possibilities and identifying and guiding the selection of suitable sites for check dams within watersheds. In this developed site selection software (SSS), multi-criteria decision analysis (MCDA) was integrated into geographic information systems (GIS), which allowed for numerous spatial data of the multiple criteria to be relatively simply and visually processed. Different geomorphometric and topo-hydrological factors were considered and accounted for to enhance the SSS identification of the best locations for check dams. The factors included topographic wetness index (TWI), terrain ruggedness index (TRI), topographic position index (TPI), sediment transport index (STI), stream power index (SPI), slope, drainage density (DD), and stream order (SO). The site identification performance of the SSS was assessed using the receiver operating characteristic (ROC) curve method, with results for the case study example of the Poldokhtar watershed in Iran showing excellent performance and identifying 327 potential sites for efficient check dam construction in this watershed. The SSS tool is not site-specific but is rather general, adaptive, and comprehensive, such that it can and should be further applied and tested across different watersheds and parts of the world.

1. Introduction

Check dams are well-known structures for soil and water conservation world-wide and significantly affect hydro-environmental processes in watersheds. Abbasi et al. [1] reported on the prevalence of check dams across different countries, including Austria, China, France, India, Iran, Italy, Ethiopia, Japan, Spain, Swaziland, Thailand, and the USA. In China, about 110,000 constructed check dams have been built in the Loess Plateau, and this number will double by 2020 [2,3]. Check dams are constructed with many objectives and their functions can be multi-dimensional. Their primary function is for rainwater harvesting for agricultural and drainage applications [4,5,6]. In watersheds, they are installed as erosion control structures across stream beds and gullies, to control soil, water, and sediment flow, whereas in mountain fluvial systems they are used to disrupt the transfer of water and sediments downstream [7,8,9]. However, it is undeniable that each intervention in a complex natural ecosystem, such as a stream network, may change the balance of hydrological and morphological conditions [10]. Although scouring features and erosion pools sometimes appear downstream of check dams, which is known as one of their disadvantages, the construction of check dams has several positive geomorphic effects [11]. Check dams can stabilize river channel morphology (e.g., channel width and depth) by controlling erosive power and retaining a large amount of sediments upstream [1]. In addition, they can also decrease the channel slope gradient [11,12]. In fact, check dams modify longitudinal and cross-sectional profiles of the intermediate reaches (i.e., distance between two check dams), and sedimentological characteristics of the original channel [13]. Apart from controlling flooding and trapping sediment, constructed dams and water storage units can be an effective and economically efficient way to create carbon sinks [14], as they contribute to carbon sequestration needed for climate change mitigation [15,16,17], and can also contribute to sustainable land management [18]. All these mentioned challenges are related to the sustainability of watersheds and check dams to help decision makers achieve sustainable watershed management by preventing the degradation of ecosystems.
The performance and functioning (morphological, hydraulic, sedimentary, ecological) of check dams have been investigated in previous studies [3,19]. However, their function efficiency depends on different circumstances, such as construction quality, design criteria, and, more importantly, their location [20]. For example, Lü et al. [21] studied carbon retention by check dams in the Loess Plateau region of China and estimated it to be about 42.3 million tons of soil organic carbon depending on topography and deposited volume of sediment. Since the construction of numerous check dams is expensive and not feasible across a whole watershed, trade-offs must be made (e.g., between flood control provided by the dams and the financial resources required for building them). Therefore, a comprehensive and practical framework is needed to rationally identify suitable sites for the efficient construction of check dams within a watershed.
A limited number of studies in the literature have addressed the identification of suitable check dam sites [22]. Osti and Egashira [23] optimized check dam locations on an alluvial fan using a 1D numerical model for controlling debris flows. Singh et al. [24] studied the suitability of check dam sites in the Soankhad watershed, India, using a simple overlay method based on stream order, slope degree, and land use. Kalantari et al. [13] identified suitable areas of check dams for artificial aquifer recharge in the Baghmalek plain, Iran, based on cost-benefit analysis and permeability of stream bed.
The use and processing of numerous spatial data, satellite images, and aerial photographs in geographic information systems (GIS) for the selection of appropriate check dam sites over large watershed scales are computationally costly [25,26]. Straightforward site identification for a more efficient management support may be facilitated by an analytic hierarchy process (AHP) in GIS [27,28] based on some geomorphometric and topo-hydrological watershed factors [29,30] that, to our best knowledge, yet remain to be considered for this purpose. Such characteristic factors may include slope, terrain ruggedness index (TRI), topographic position index (TPI), drainage density (DD), stream order (SO), stream power index (SPI), topographic wetness index (TWI), and sediment transport index (STI). However, carrying out this process with commercial software for multi-criteria decision analysis (MCDA) and GIS may still be resource and time consuming [31] and, most importantly, not readily evaluated in terms of efficiency and accuracy of site selection results (e.g., [23,24]).
There are three research gaps in this field of study. First, previous studies conducted for site selection of check dams only applied a simple overlay method in a GIS environment. In fact, the relative importance of layers are equal in this approach. More importantly, topo-hydrological and geomorphometric factors have not been often used in the site section of check dams. Second, site selection projects in environmental and natural hazard management must calculate the weights of factors using commercial decision-making software packages such as Expert Choice and transport the weights to GIS software programs (e.g., ArcGIS). Third, most of the related studies conducting site selection programs often ignore to investigate the accuracy and efficiency of the method for site selection. This is particularly crucial in natural disaster management and optimal budget allocation for watershed measures in catchments. Even if researchers want to evaluate the accuracy of the site selection method, they have to use commercial statistical software programs (e.g., SPSS). In fact, all these processes are cumbersome step-by-step procedures and need expensive software packages. To address these computational and evaluation problems, we developed and applied in this study a Python-based site selection software (SSS; GitHub, San Francisco, CA, USA) for the identification of suitable sites for check dam construction within watersheds based on geomorphometric and topo-hydrological factors. As an alternative to the simple overlay method of site selection, the AHP method was considered to determine the relative importance of factors. Moreover, the software includes a standard statistical method, the receiver operating characteristic (ROC) curve, for an accuracy assessment of site selection results. The Poldokhtar watershed, Iran, which experiences deadly flash floods that require decisive action, was used as a case study for software application and testing. Based on this testing, the developed software and application methodology may be generally useful as a robust basis for first-order check dam screening and planning, and for focusing possibly further needed detailed and costlier model and field investigations.

2. Materials and Methods
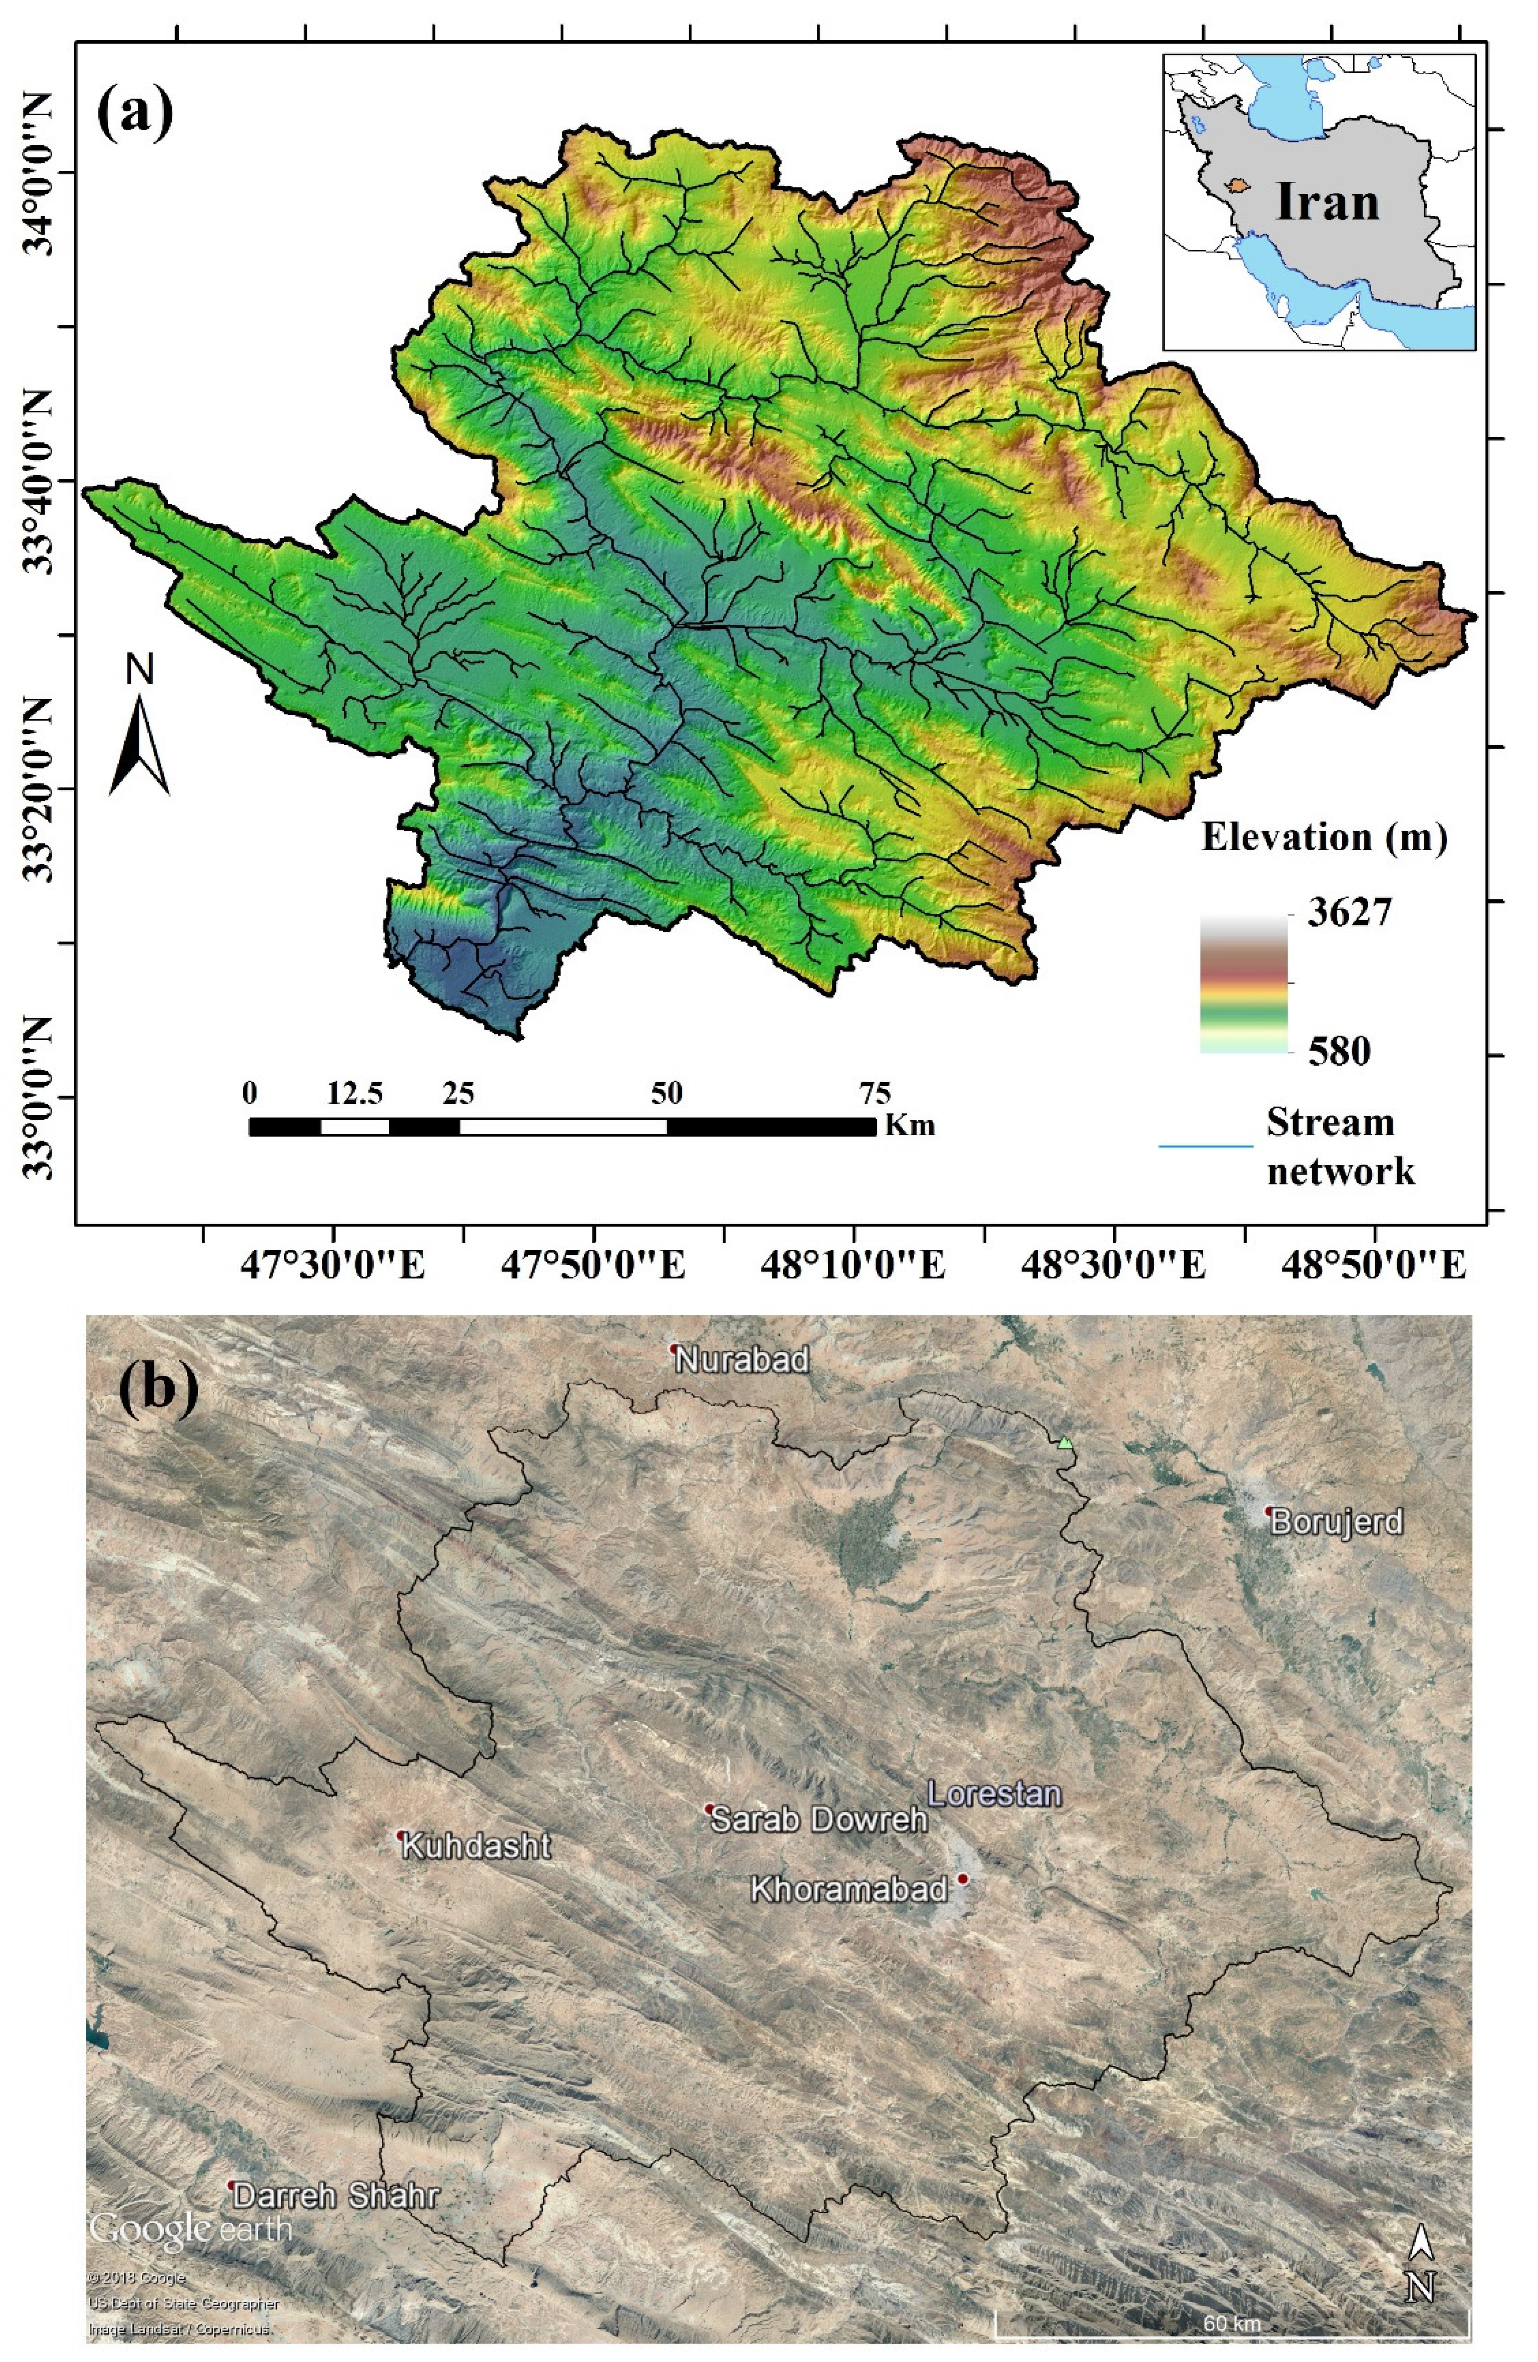
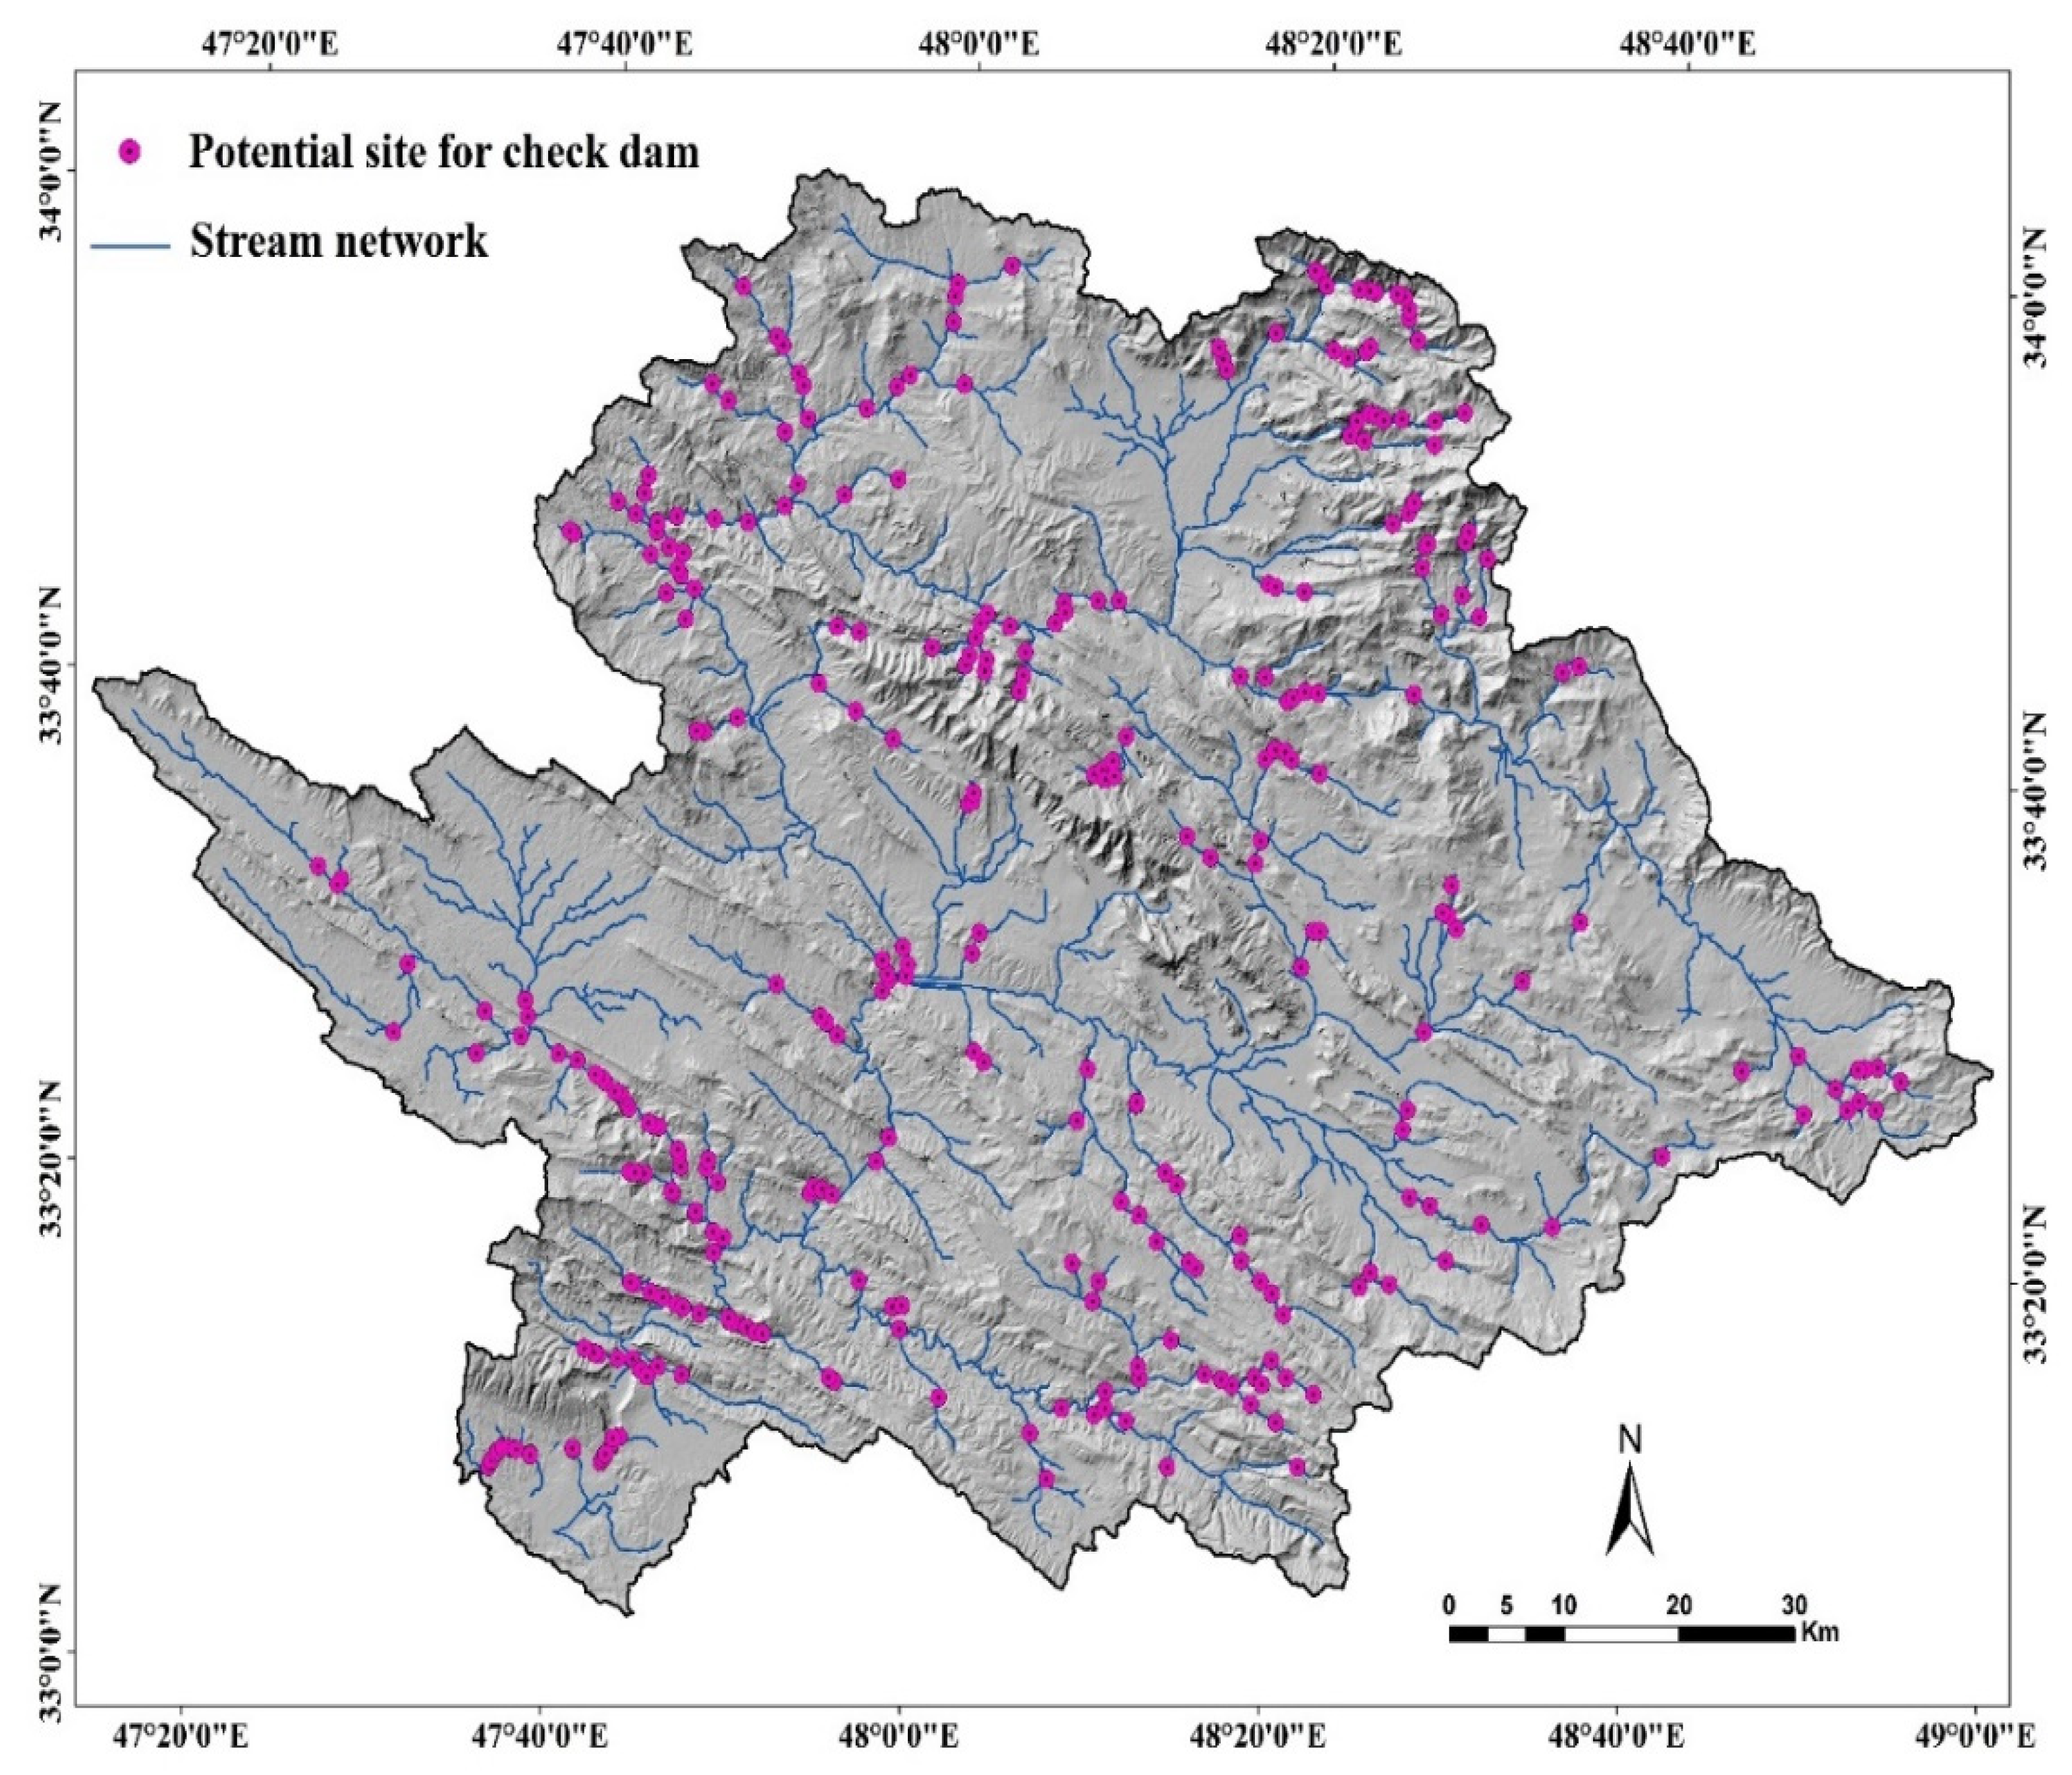
2.1. Study Area

The Poldokhtar watershed in the Lorestan province of Iran (Figure 1) covers an area of 9443.95 km2, located between 33°04ꞌ and 34°03ꞌ N, and between 47°12ꞌ and 48°58ꞌ E, and contains a population of approximately 144,000 residents. The climate is semi-arid, with the mean annual rainfall of about 369 mm occurring with high intensity mainly from December to March. Temperature peaks in June–September (approximately 47 °C) and has its minimum value in February (−2.4 °C). The altitude ranges between 580 and 3627 m a.s.l., with an average of 1609 m. Limestone (and in places limestone and shale) predominates in the highlands of the watershed, whereas downstream parts are mainly characterized by sandstone, conglomerates, and Quaternary deposits [32].
The main soil types in this area are Vertisols, Inceptisols, and Entisols, as is common in semi-arid environments [33]. These soils, especially Vertisols, are characterized by crusting and sealing of the surface layer and low infiltration rate, and consequently, they often generate high annual runoff under dry soil conditions [34]. Some parts of the study area have high soil erosion sensitivity due to the lack of vegetation cover, massive rainfall events, and topographical characteristics combined with heavy livestock grazing, leading to high surface runoff and sediment transport [35]. The watershed also experiences flash floods with severe damages to the environment, buildings, and infrastructure; Figure 2 shows two field photographs of such a deadly flood event on April 1, 2019, causing the deaths of 13 people, and heavy damage to infrastructures and buildings.

2.2. Methodology Development

2.2.1. Designing the Site Selection Software (SSS)

The SSS is designed to be straightforward, self-explanatory, and end-user friendly, avoiding cumbersome calculations and concentrating on key input layers and output inferences. The mathematics of the SSS for suitability-based prioritization of dam construction sites is underpinned by AHP and GIS. Figure 3 depicts an excerpt script of the programming session for the software and Figure 4 illustrates the steps involved.
The first step involves introducing the preparatory thematic layers in a raster format (e.g., the considered geomorphometric and topo-hydrological factors, as outlined further below, in Section 2.2.2). Drawing on a knowledge-based approach, the software then reclassifies thematic layers and assigns numerical values to them. This is followed by pairwise comparison of the input layers and their constituent classes based on their importance, from which the final weights are determined and rescaled into a 0-1 normalized range. Finally, the weighted layers are linearly combined. Applying a weighted linear combination (WLC) is an analytical way of dealing with multi-attribute decision-making, where each attribute corresponds to a criterion.
The end product of this process is a multi-attribute spatial feature in which higher values indicate higher suitability. The final suitability map derived from WLC is subjected to a performance assessment test, which is carried out based on the ROC fed by locations that have already flooded in recent years. The ROC as a holdout-independent measure can decisively pinpoint the performance of any spatial model and is a crucial tool for validating the results of spatial maps [36]. It plots the 1-specificity (i.e., false positive; incorrectly predicting an unsuitable location as suitable) on the x-axis against the sensitivity (i.e., true positive; correctly predicting a suitable location as observed in reality) on the y-axis [37]. Based on these premises, if the final output of the software tends to locate the dams in areas with no or rather insignificant flood histories, the ROC will penalize the model by resulting in a decreased area under the receiver operating characteristic curve (AUC) value, indicating low precision. The latter indicates that the rivers which have experienced more floods in recent years require more check dams to be built.

2.2.2. Considered Geomorphometric and Topo-Hydrological Factors

A range of different geomorphometric and topo-hydrological factors affects flood events, soil erosion, and sediment yield [38,39,40,41,42], and should as such influence site selection for check dams [40]. In assessing the suitability of sites for check dam construction, we considered in this study the range of geomorphometric and topo-hydrological factors listed above (Introduction), based on their previous applications in flood and soil erosion studies (e.g., [43,44,45,46,47]). These factors are slope, TRI, TPI, DD, SO, SPI, TWI, and STI, and they were all calculated as outlined in the following subsections, with the SAGA-GIS software based on a digital elevation model [48]. The digital elevation model (DEM) with resolution of 5 m was obtained from the Water Resources Company of Lorestan. It shows that the elevation of the study area ranges from 580 to 3627 m a.s.l. SAGA-GIS software has the “Module Fill Sinks” that uses an algorithm proposed by Wang and Liu [49] to identify and fill surface depressions in digital elevation models.

Topographic Wetness Index (TWI)

The TWI is a topo-hydrological factor proposed by Beven and Kirkby [50] and is often used to quantify topographic control on hydrological processes [51]. The TWI controls the spatial pattern of saturated areas that directly affect hydrological processes at the watershed scale. Manual mapping of soil moisture patterns is often labor intensive, costly, and not feasible at large scales. The TWI provides an alternative for understanding the spatial pattern of wetness and upslope contributing areas [52]. It is a function of both the slope and the upstream contributing area:
T W I = ln ( a tan b )
where a is the specific upslope area draining through a certain point per unit contour length (m2 m- 1), and b is the slope gradient (in degrees). TWI values ranged from 5.10 to 21.15 in the study area (Figure 5a).

Terrain Ruggedness Index (TRI)

The TRI, in turn, is one of the main factors which affects stream energy, surface storage capacity, runoff velocity, and routing at the watershed scale [53]. The TRI expresses the amount of elevation difference between neighboring cells [54], where the differences between the focal cell and eight neighboring cells are calculated:
T R I = Y [ ( x i j x 00 ) 2 ] 1 2
where xij is the elevation of each neighbor cell to cell (0,0). Flat areas have a value of zero, whereas mountain areas with steep ridges have positive values. TRI values ranged from 0 to 156.1 in the study area (Figure 5b).

Topographic Position Index (TPI)

Microtopography plays an important role in runoff generation, flow velocity, and sediment transport [54]. In addition, topography properties considerably influence water retention time (also termed lag-time in hydrology) at a given watershed and, consequently, change the connectivity of water sources [24]. The TPI, first proposed by Guisan et al. [55], compares the elevation of each cell in a digital elevation map to the mean elevation of a specified neighborhood around that cell [48,52]:
T P I = Z 0 1 n Z n n
where Z0 is the elevation of the point under evaluation, Zn is the elevation of the points within the local window, and n is the total number of surrounding points employed in the evaluation. A positive value of the TPI indicates that the target point is higher than adjacent areas, a negative value indicates that it is lower, and zero TPI values indicate flat areas. TPI values in the study area ranged from −83.22 to 82.66 (Figure 5c).

Sediment Transport Index (STI)

One of the main functions of check dams is to reduce sediment yield and transport of sediment-associated contaminants to receiving water bodies [56]. The STI can provide vital information on the potential of sediment transport in the stream network of a given watershed [57]. It considers the effect of topography on erosion [58] and is, as such, used for characterizing erosion and deposition processes [59], and as a flood conditioning factor that defines the movements of waterborne sediments due to the water movement:
S T I = ( A s / 22.13 ) 0.6 × ( s i n β / 0.0896 ) 1.3
where As is the upstream area (i.e., the upslope contributing area per unit contour length) and β is the slope at a given cell. STI values ranged from 0.9 to 1.46 in the study area (Figure 5d).

Stream Power Index (SPI)

Flood damages and river channel erosion are highly dependent on the magnitude of flow factors including stream power, shear stress, and velocity [46]. The SPI that reflects stream power was selected for use in the analysis. It is the product of the catchment area and slope, and measures the erosive power of overland flow [57]:
S P I = A s t a n β
where As is the upstream area and β is the slope in a given cell. The SPI can be used to identify suitable locations for soil conservation measures, thereby reducing the effect of concentrated surface runoff [58]. SPI values ranged from 0 to 3.54 in the study area (Figure 5e).

Slope

Slope is the simplest and one of the most significant topographical factors influencing water flow. Higher slope implies greater flow speed and water accumulation, and therefore makes the terrain more susceptible to flooding and sediment transport. Slope is also an informative factor in deciding the location of check dams, as higher slopes are more suitable for check dam construction [27]. Slope varied from 0% to 80.37% in the study area (Figure 5f).

Drainage Density (DD)

Drainage density plays an important role in flooding, such that a decrease in drainage density often results in decreasing flood volumes [56]. In addition, DD affects the magnitude of peak flow by changing the concentration time; therefore, it can provide useful information for site selection of check dams. The DD value is calculated by dividing the total length of all rivers in a watershed by the watershed area [59]. In the present case, drainage density was calculated using the line density tool in ArcGIS software. Higher drainage density indicates better potential for dam construction. Drainage density ranged from 0 to 0.82 km/km2 in the study area (Figure 5g).

Strahler Stream Order (SO)

Flood volume is affected by stream order and it is considerably increased in streams that have a higher stream order [29]. Therefore, stream order was selected as one of the criteria for finding suitable sites of check dams. The Strahler SO [60] assigns all streams without any tributaries an order of 1. If two first-order streams intersect, they become a second-order stream. When two upstream streams of different orders join, the downstream stream takes the higher order of the two incoming upstream streams. The SO is a simple measure to indicate stream size and drainage area. SO values in the study area were calculated using the Stream Order tool in ArcGIS 10.2 software (Figure 5h). SO values in the study area ranged from 1 to 6.

Thematic Layer Handling

Thematic layers were classified as indicated in Table 1. Scores (S) were assigned to each class according to the order of the influence of the class on flood susceptibility. Assigned S values of 1–5 were adopted, where S = 1, 2, 3, 4, 5 imply very low, low, medium, high, very high flood susceptibility, respectively. The score values of all thematic layer classes are also shown in Table 1.
The assigned scores were further normalized for use in the WLC method. Since the TWI directly indicates the tendency of surface water to accumulate at each pixel in the watershed area, high weights were assigned to high TWI and low weights to low TWI (Table 1). The TRI shows topographic irregularities, and higher ranks were assigned to higher TRI values. Additionally, the TPI has an inverse relationship with surface water accumulation; hence, higher scores were given to low TPI values. High scores were assigned high STI values because high sediment transport can be expected in these areas and check dams are needed to trap sediments. The SPI describes the erosive power of flowing water [61]; therefore, higher scores were assigned to higher SPI values.
For the slope factor, there is a direct relationship between flood power and slope [62]; therefore, higher weights were assigned to steep slopes. Since DD has an important effect on flood occurrence [63], areas with high DD values are considered favorable for constructing check dams; therefore, higher scores were assigned to areas with high DD (i.e., DD > 0.60). Regarding SO, the least score (i.e., zero) was assigned to SO 1 as these streams are very small and construction of check dams in them is commonly not cost-efficient [24]. Check dams are commonly expected to control a limited drainage area, because large drainage areas produce greater runoff volumes and lead to higher runoff energies, which would likely lead to collapsing the check dams [64]; therefore, the highest score (5) was assigned to second-order streams with the ranking decreasing with increasing SO, so that sixth-order streams got a ranking of 1.

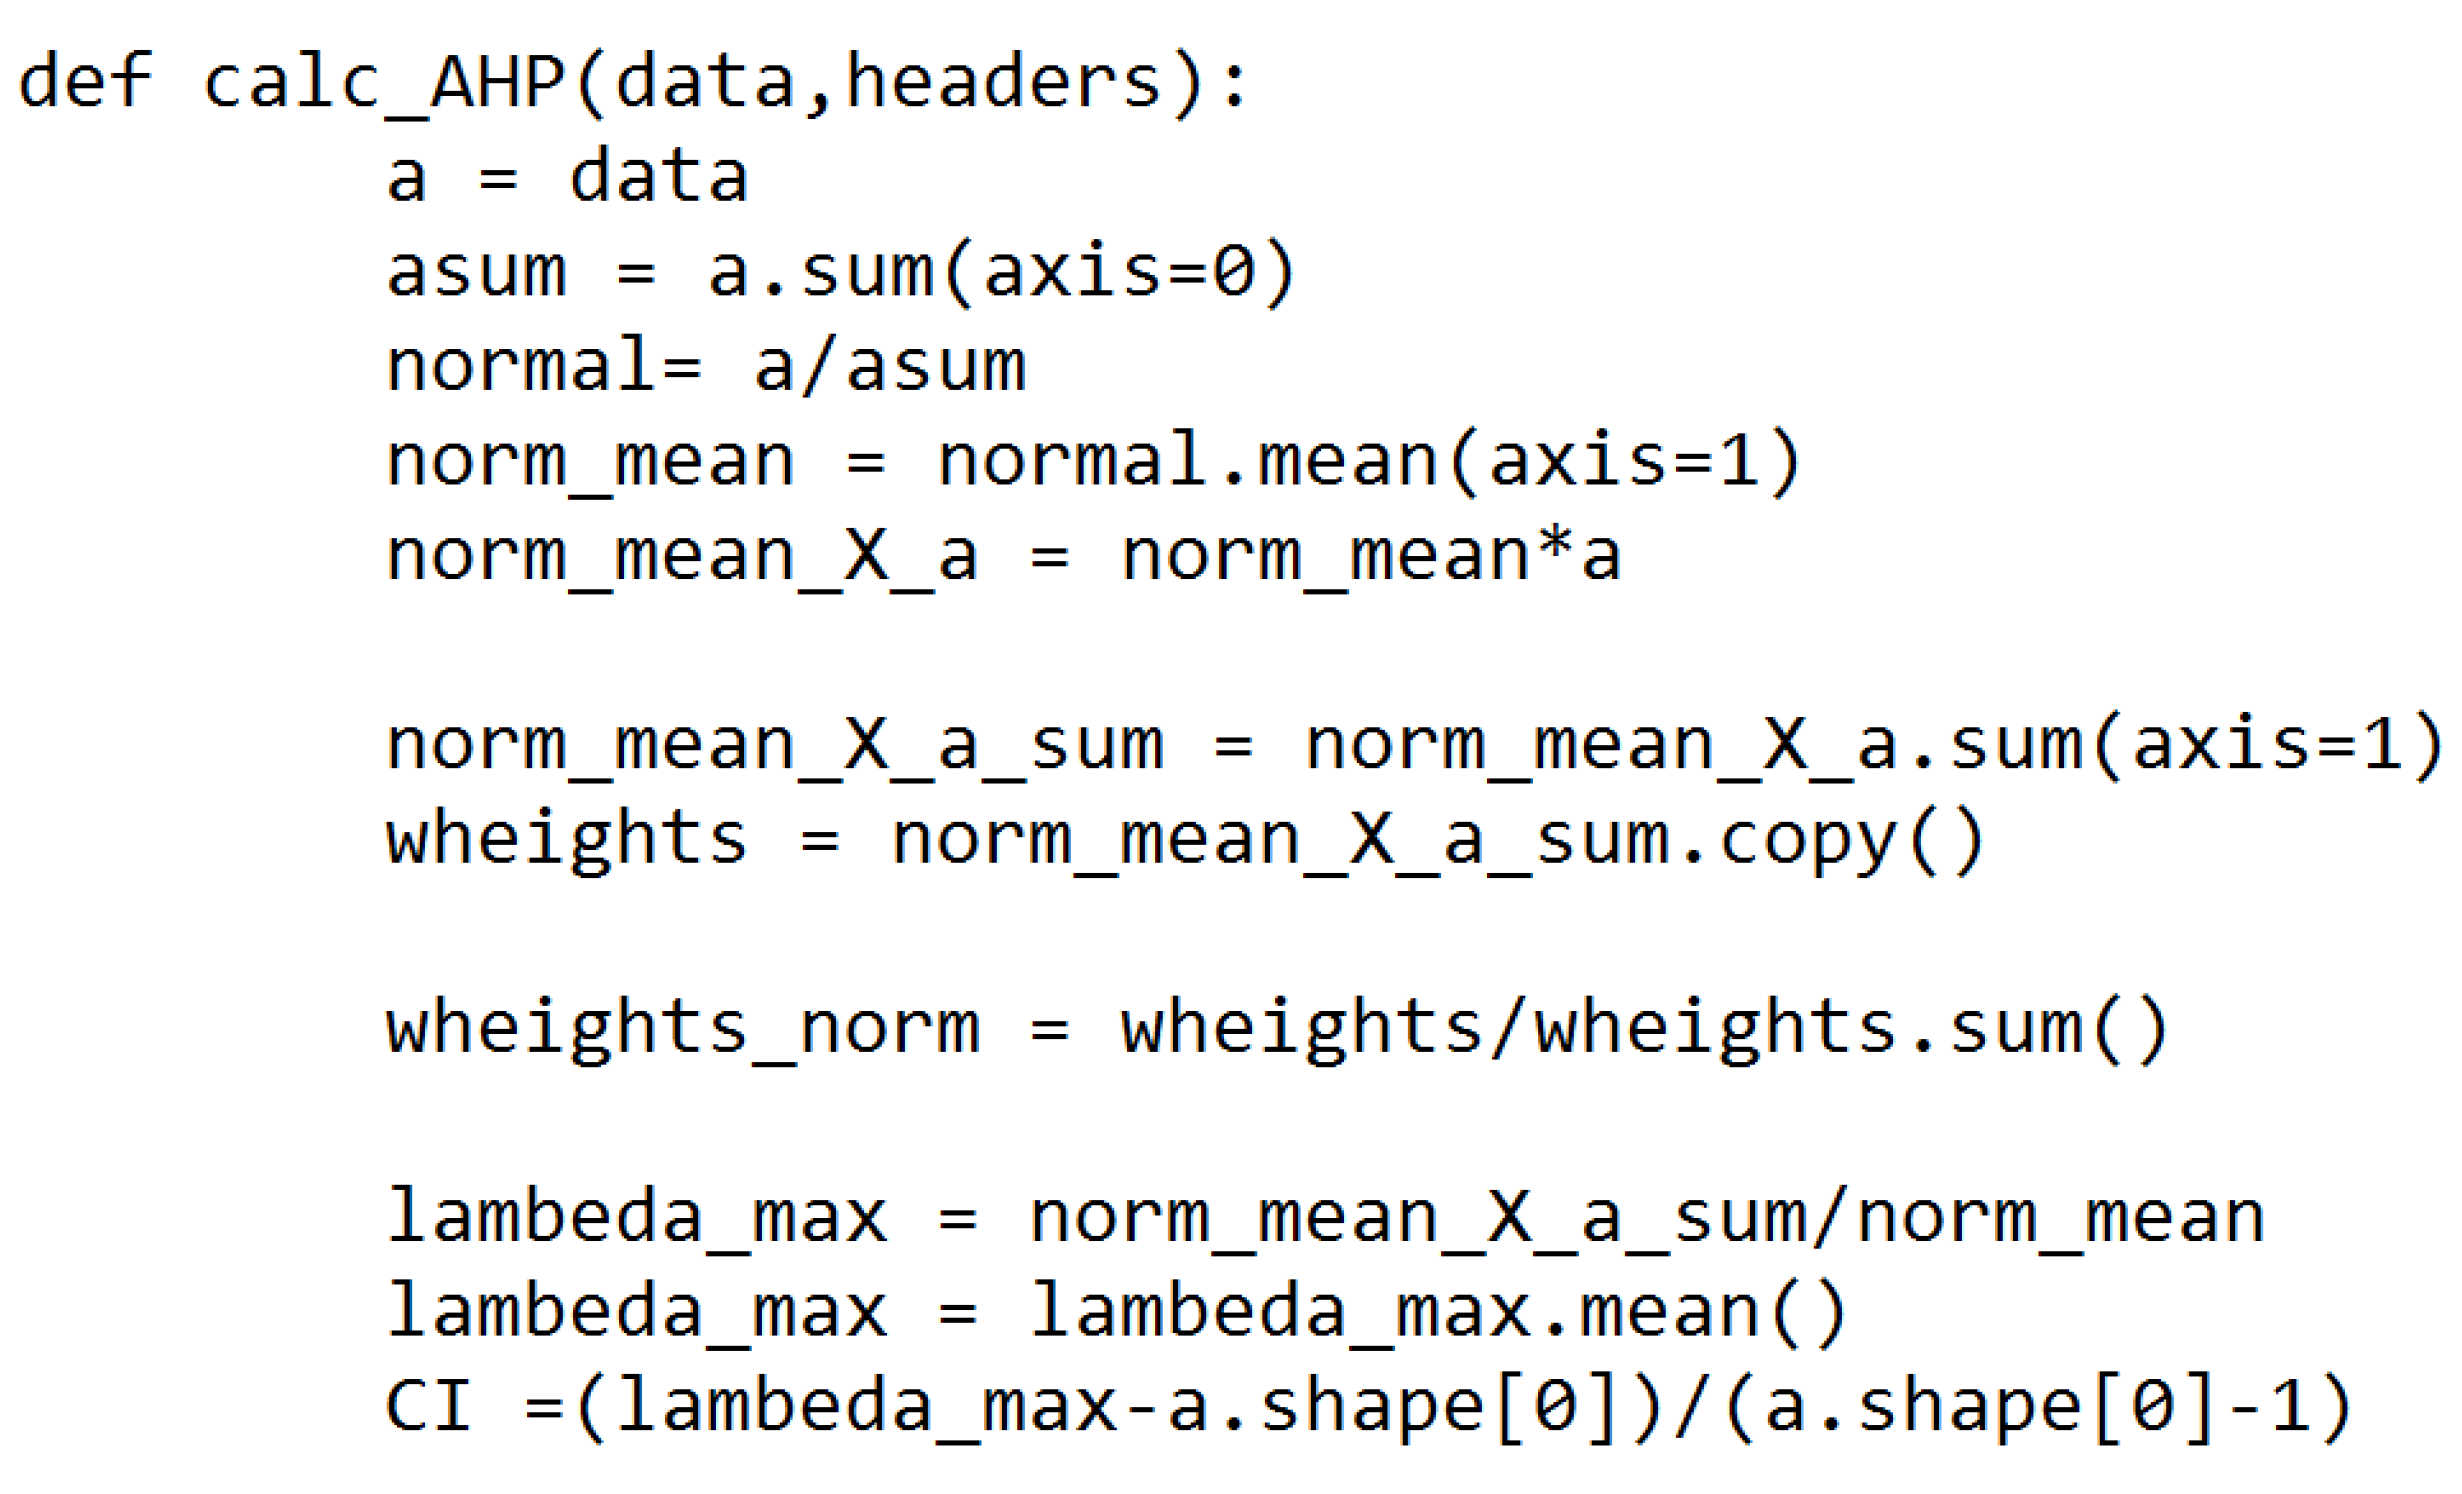
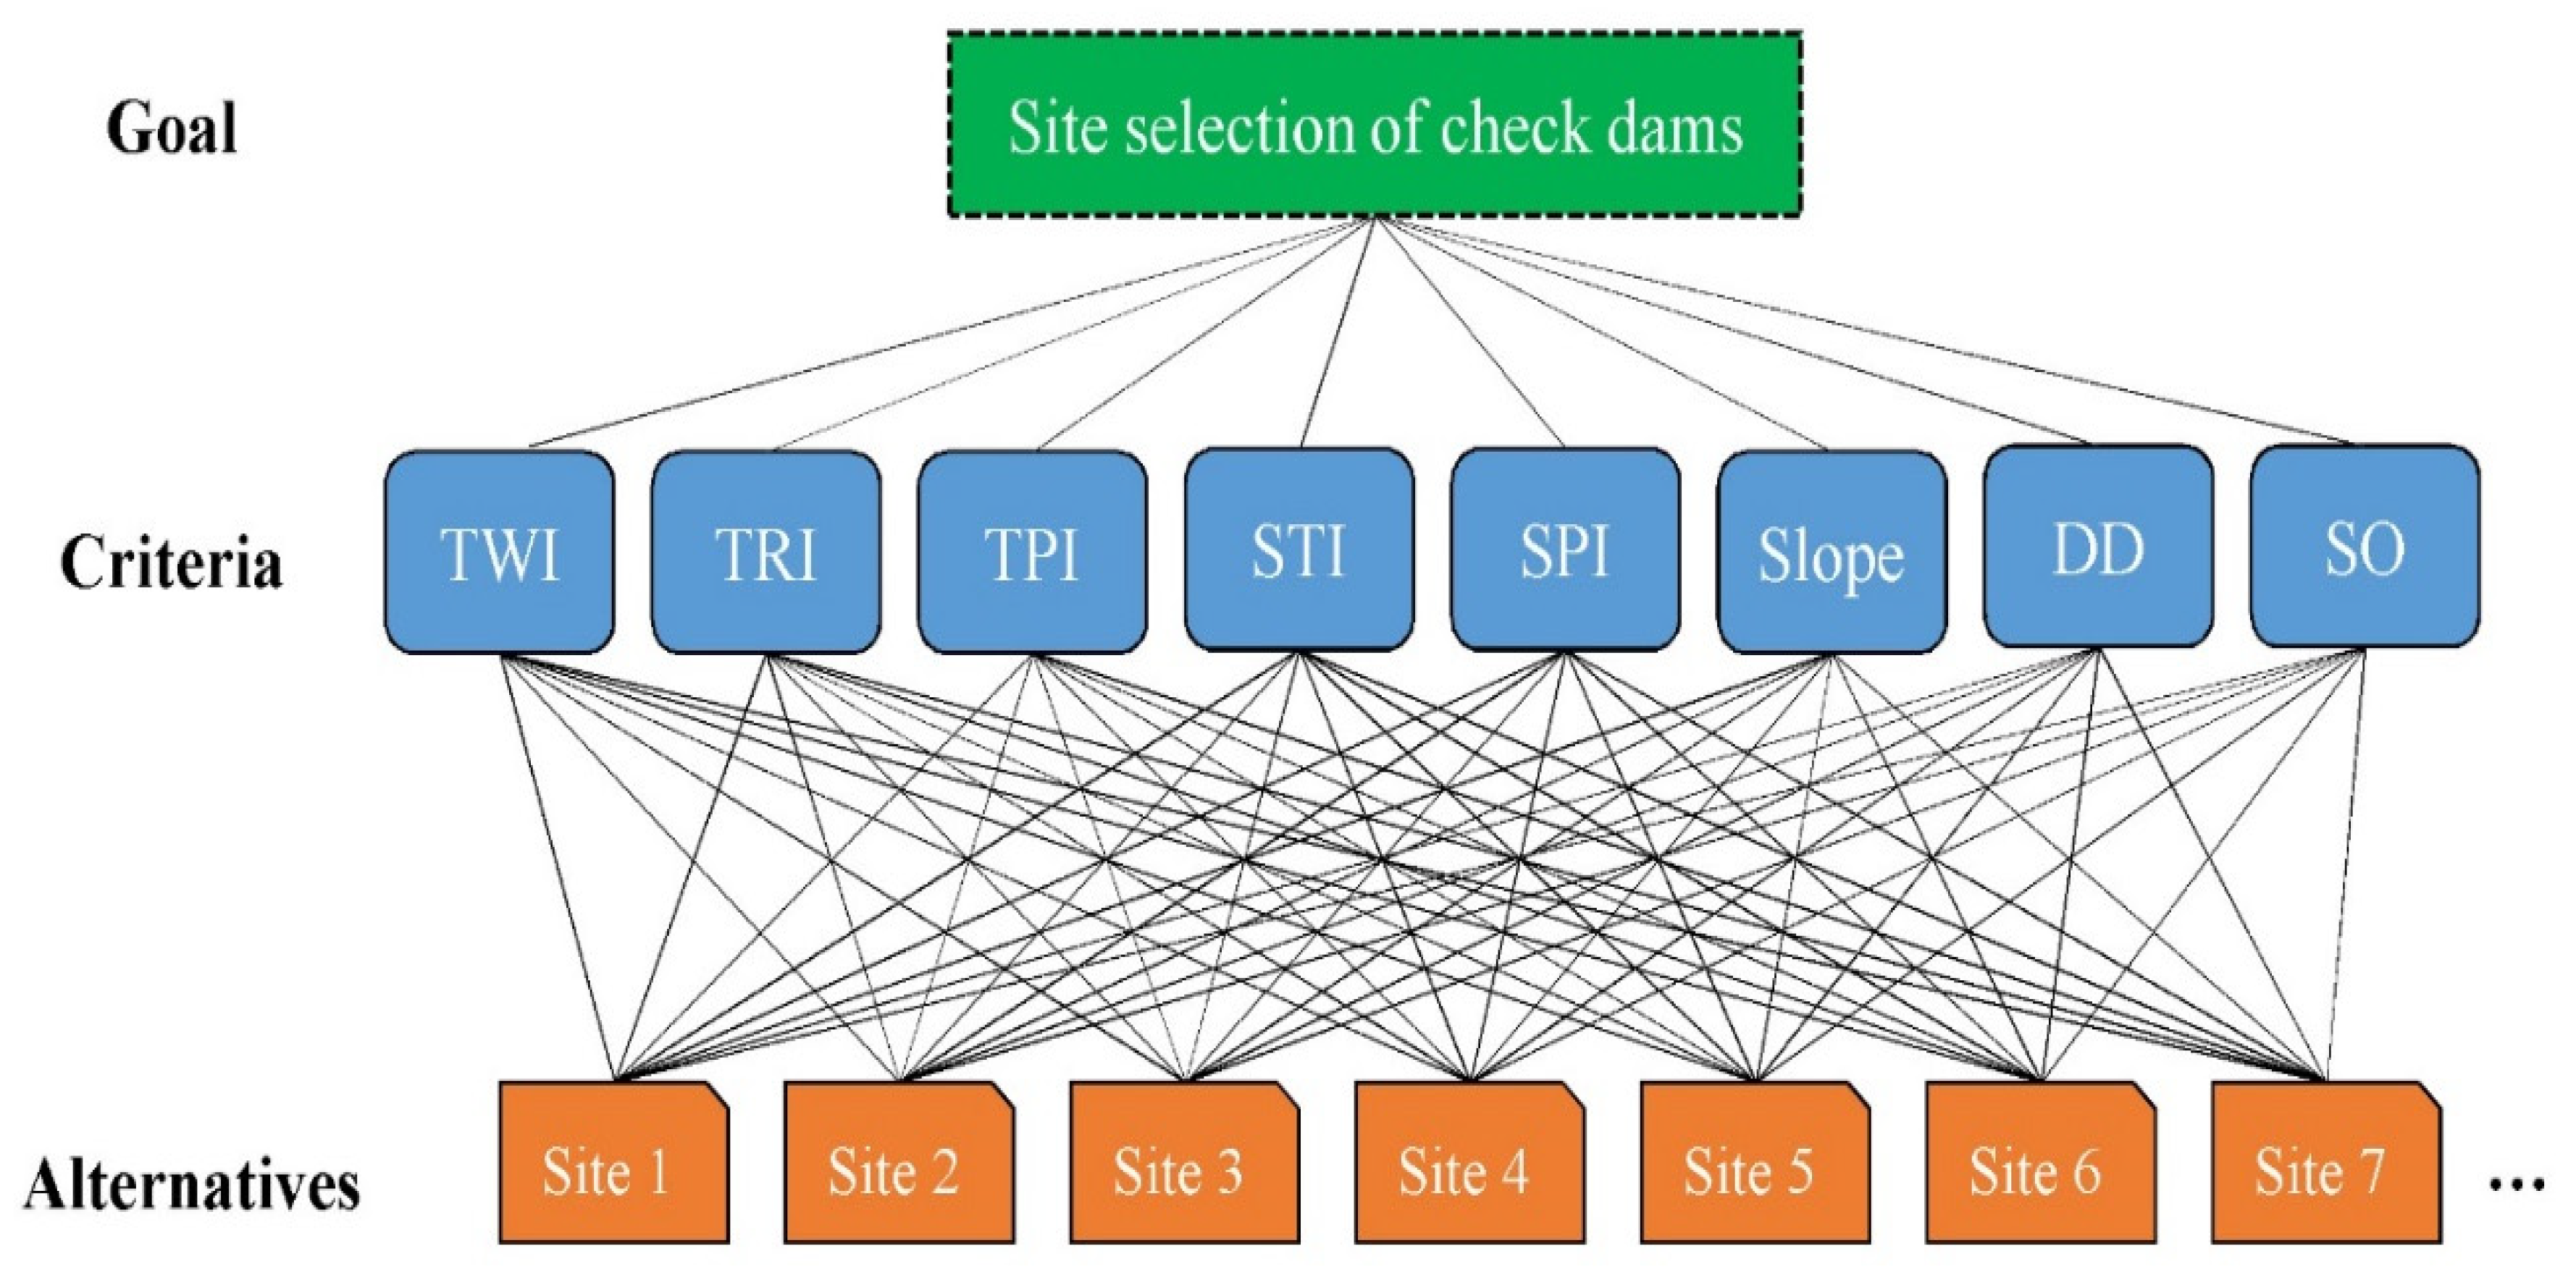
2.2.3. Multi-Criteria Decision Analysis

There are many criteria involved in determining the priority of check dam construction sites, which complicates objective decision-making. Multi-criteria decision-making (MCDM) is therefore used to select among alternative solutions based on many criteria. One widely used MCDM technique is the AHP, which reduces complex decisions to a series of pairwise comparisons [65]. The first step in an AHP analysis is to build a hierarchy for the decision, based on the goal, criteria, and alternatives [66] (Figure 6). In the next step, a pairwise comparison matrix of the criteria involved in the decision needs to be created, to derive the relative priorities (weights) for the criteria. For comparisons, the scale of Saaty [67] with values 1–9 was used, which indicates how much one element dominates another with respect to a given attribute (Table 2).
Using the scale in Table 2, weights were assigned to the criteria (geomorphometric and topo-hydrological factors) based on their importance for dam site selection. The matrix was completed by a relevant expert (or decision maker) concerning pairs of criteria (1/9, 1/7, 1/5, 1/3, 1, 3, 5, 7, 9) (Table 2). For example, for slope and TPI, a score of 9 means that slope is very important, whereas 1/9 means that it is much less important. A consistency check was needed to ensure that the expert (decision maker) evaluations were not biased. In AHP, a consistency ratio (CR) is calculated as follows [67]:
CR = CI RI
where CI is a consistency index of the matrix developed by the expert (decision maker) and RI is a consistency index of a random matrix, in which the decisions are generated randomly and therefore can be expected not to be consistent [17]. The judgment matrix is considered to be adequately consistent if the corresponding CR is less than 10% [67].

2.2.4. Prioritization of Check Dam Sites

As a case-study application example, the SSS was applied to identify the most suitable sites for building check dams in the Poldokhtar watershed, Iran. The eight geomorphometric and topo-hydrological factors (TWI, TRI, TPI, STI, SPI, slope, DD, and SO) were entered into the software for consideration as predictive variables. The weighting values were calculated based on pairwise comparison scores given by different expert groups. The objective was to select experts from different knowledge backgrounds who had practical insights and experiences for the mitigation of surface runoff, soil erosion, sediment transport, and flood hazard management. The consistency ratio (CR) was calculated and used to measure how consistent the judgments were compared to random judgments. CR provides a standard control of consistency on the decision matrix for the expert group depending on the number of elements being compared. In this study, a CR value of less than 0.10 indicated consistent judgment in pairwise comparisons. The opinions of these experts, combined with several field investigations, assisted in developing the pairwise comparison matrix (based on Table 2), which was entered on the second page of the software.
All factors were further classified in the software and different scores on a scale of 1–5 were assigned to them based on the expert opinion of class influence on flood susceptibility, as expressed in Table 1. The software also calculated normalized scores (Table 1) for the prediction process. The final prediction of suitable sites for check dams was carried out based on the WLC method. The final map was divided into four classes of resulting suitability (low, medium, high, and very high) based on equal result intervals.

2.2.5. Accuracy Assessment

In order to evaluate the performance of the site selection results, the SSS uses the receiver operating characteristic (ROC) curve method. The ROC curve is a plot of the sensitivity (on the vertical axis) versus “1-specificity” (on the horizontal axis) of a diagnostic test [68]. In fact, sensitivity is the fraction of events (i.e., in this study, flood occurrences) that are correctly predicted, whereas specificity is the proportion of the non-flood pixels that are correctly identified as non-flood. Sensitivity and specificity can be calculated as follows:
S e n s i t i v i t y = T P T P + F N
S p e c i f i c i t y = T N F P + T N
where FN (false negative) and FP (false positive) are the numbers of pixels erroneously predicted, whereas TN (true negative) and TP (true positive) are the numbers of pixels that are correctly predicted.
The ROC curve determines the learning capability (termed goodness-of-fit) of the model if the model results are compared with the training data set, whereas it determines the predictive performance of the model if the model results are compared with an independent validation data set [69,70]. The area under the ROC curve (AUC) is commonly used as a threshold-independent evaluation criterion [71,72]. The AUC value varies between 0 and 1; a higher value implies a higher prediction performance, whereas a value near 0.5 indicates that the prediction is no better than a random prediction [73]. According to Rahmati et al. [36], the strength of agreement given the AUC magnitude is for 0–0.2 slight, 0.2–0.4 fair, 0.4–0.6 moderate, 0.6–0.8 substantial, and 0.8–1.0 almost perfect. The SSS can plot the ROC curve based on training and validation data sets to determine the goodness-of-fit and predictive performance of site selection methods. In this study, stakeholders helped us to identify and record a number of historical flash floods that had occurred in the study area in 2018–2019. This flood inventory (n = 186) was verified by checking damages in the locations’ farms, buildings, or infrastructures and then these locations were considered to be used in the validation part of the SSS and plot the ROC curve.

3. Case Study Results and Discussion

3.1. Determining Criteria Weights

The matrix of pairwise criteria comparisons and their normalized weights are summarized in Table 3. The AHP method implied that slope (NW = 0.32) and SPI (NW = 0.26) are the main factors influencing the site selection of check dams, where SO (NW = 0.1), DD (NW = 0.07), and TWI (NW = 0.04) had moderate importance for the considered case study example. Conversely, TRI (NW = 0.02) and TPI (NW = 0.02) were judged to contribute weakly to the site selection of check dams.
As a simplified solution approach to a complex problem, the AHP divides the problem into a number of simpler problems in the form of a hierarchy structure [74]. As discussed by Moeinaddini et al. [75] and Wang and Liu [49], AHP advantages include offering an effective handling of both quantitative and qualitative data, considering multiple criteria, and being easy to understand by local stakeholders. One of the main problems in integrated watershed management plans is that stakeholders do not sufficiently contribute to management programs, at least in part because the understanding of complex modeling used may be too difficult for them. In integrated watershed management, local stakeholders are expected to be important parts of watershed management committees and asked about their opinions and attitudes. The SSS allows stakeholders to share their viewpoints about historical floods, agents, the environment, and rules, as well as their local knowledge about magnitudes and locations of historical floods and associated damages.
The SSS framework thus supports and enhances participatory modeling, as an essential process for incorporating stakeholder views and knowledge in watershed management. Participatory modeling can improve watershed management measures by also considering socio-economic concerns of the community [76]. As discussed by Voinov and Gaddis [77], the stakeholder sharing of their information and experiences regarding previous flood events and damages implies a shift from top-down, prescriptive management towards co-developed planning and decision/policy-making processes among scientists, stakeholders, and decision makers.

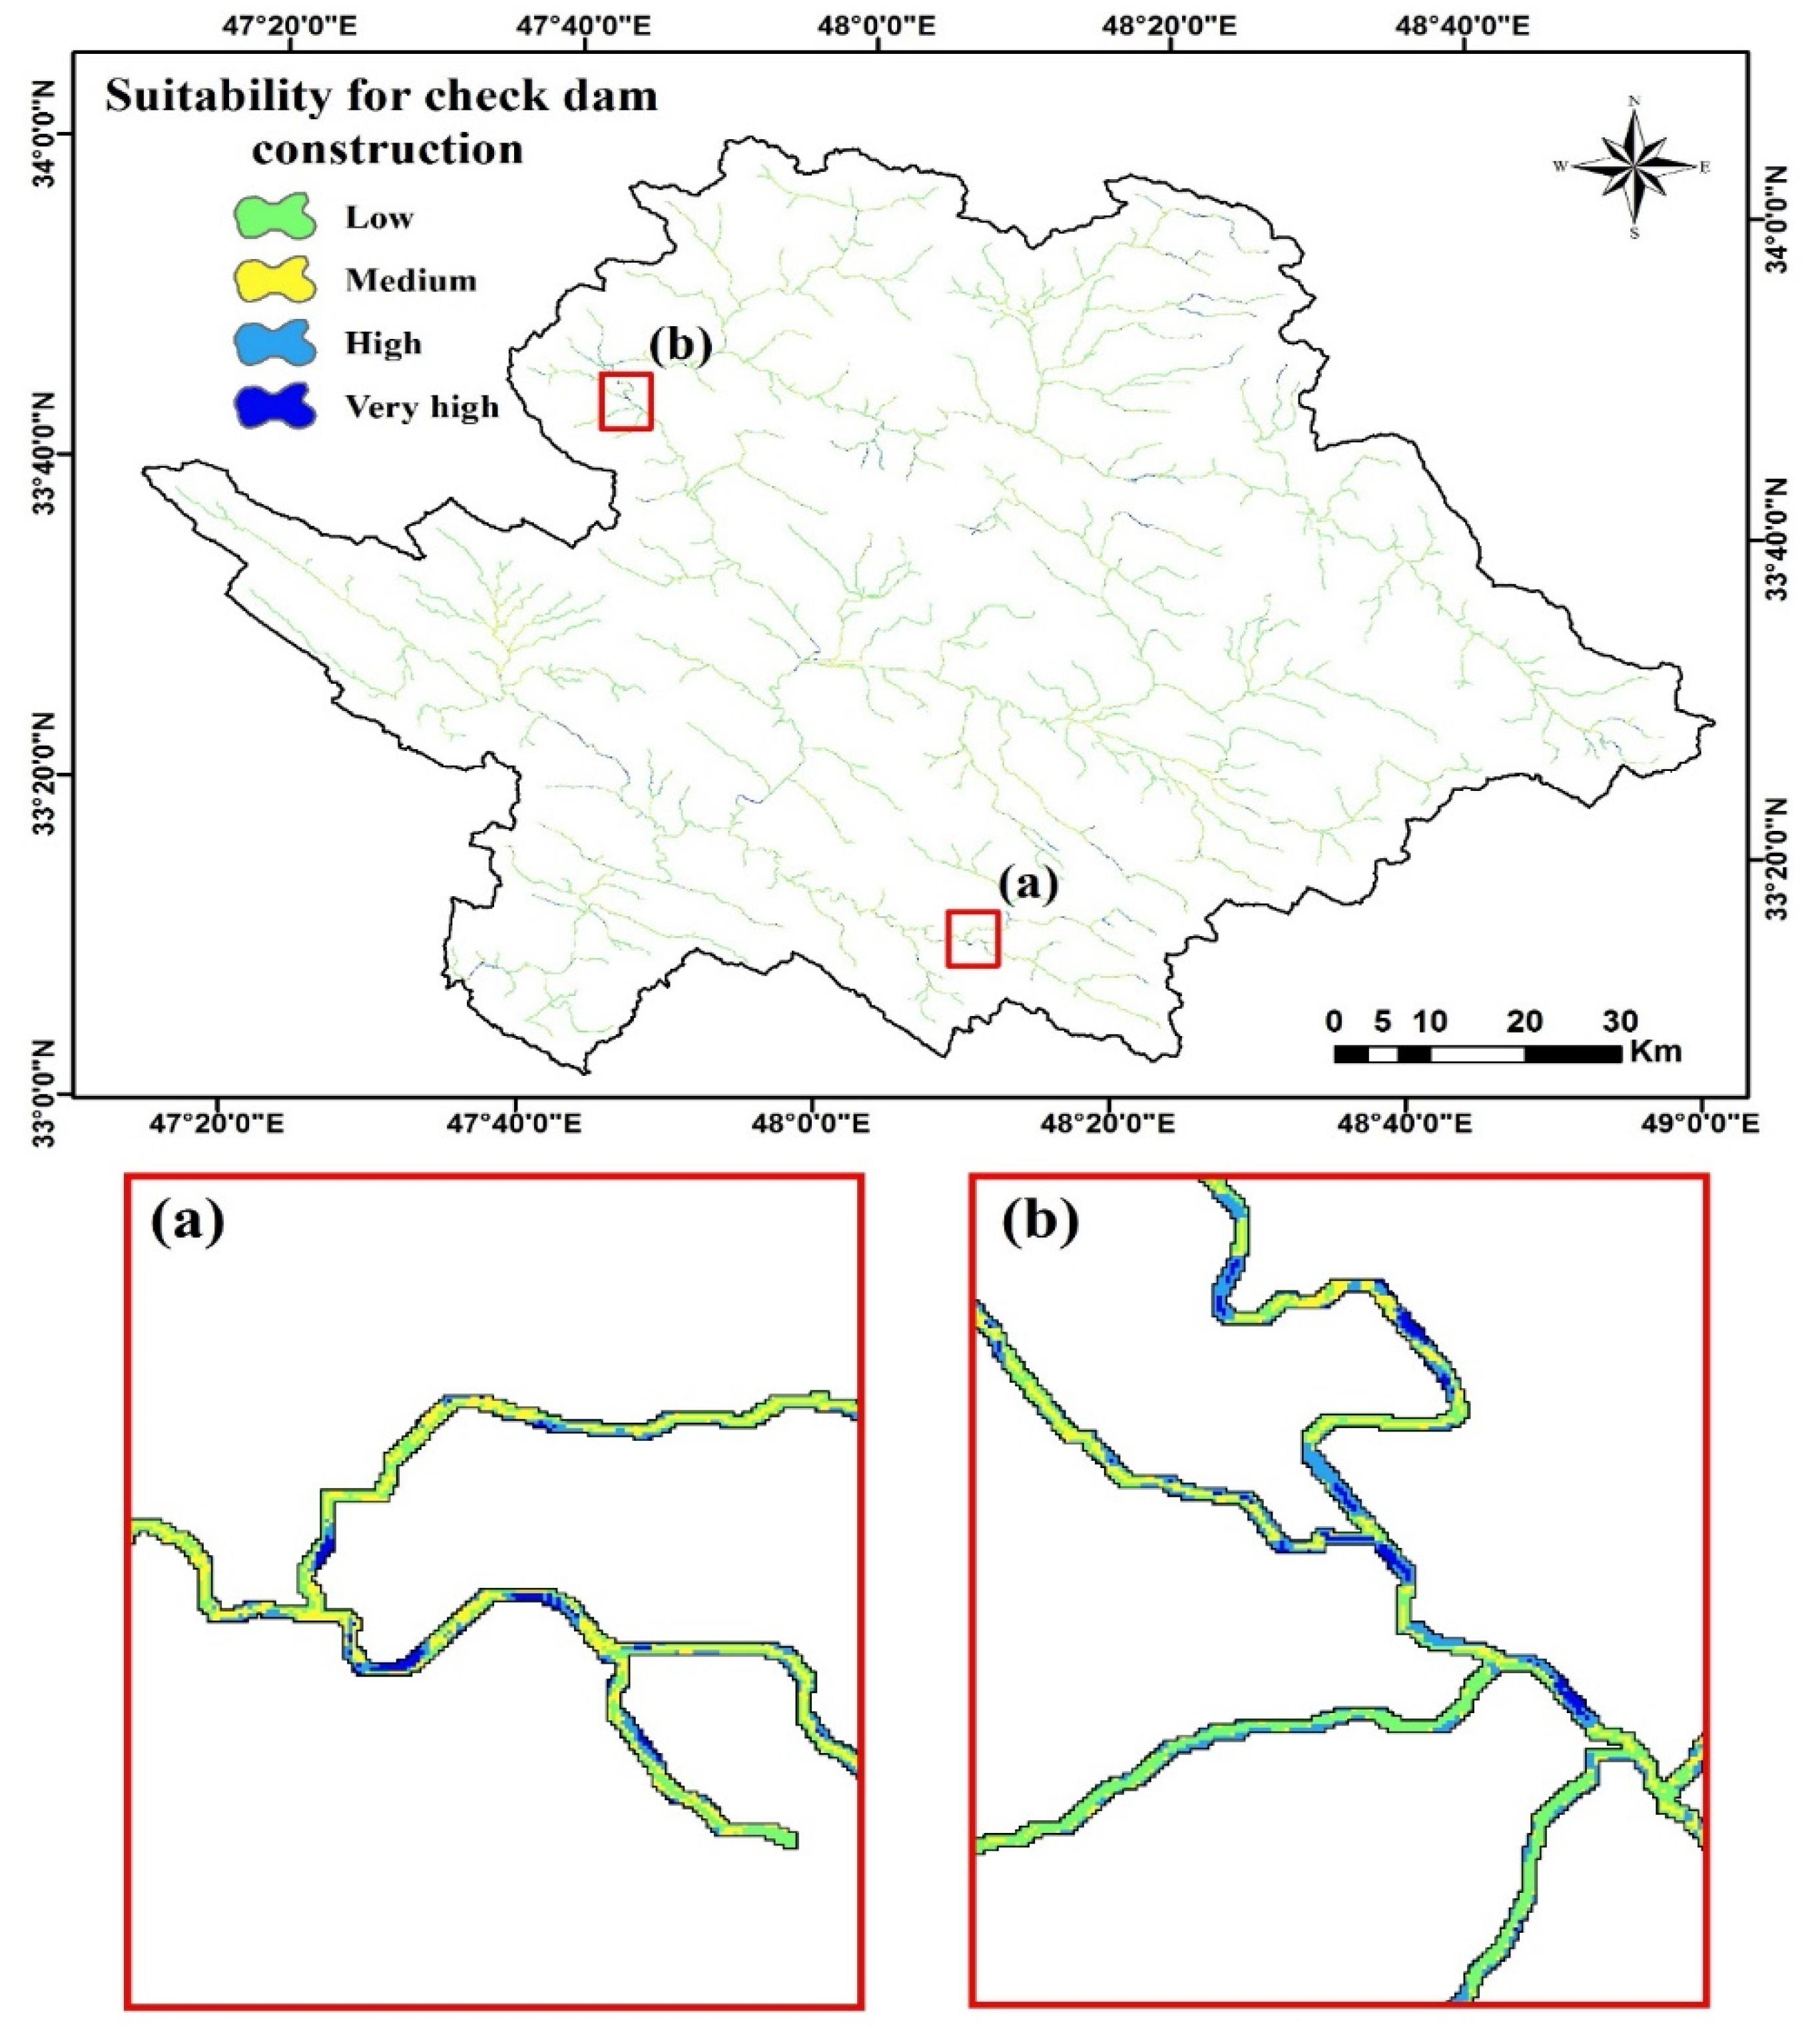
3.2. Suitable Sites for Check Dams in the Study Area

Figure 7 shows the sites identified by the SSS application as suitable for check dam construction in the study area, in terms of a suitability map based on the four-point result scale (low to very high suitability). As shown in Figure 7, different sections of a river may have different suitability for check dam construction, due to the variable manifestations of the different considered influence factors. Table 4 details the areal percentage of each suitability class, based on which about 10% of the drainage network in the study area was found to be highly suitable for check dam construction.
For the high potential class in the suitability map, a total of 327 potential sites for check dam construction (i.e., candidate sites) were identified (Figure 8). Some of these were located on one river branch, and some were scattered among different parts of the drainage network. Multiple episodes of severe flooding have already occurred in the Poldokhtar watershed in recent years, and its burgeoning population residing at flood hazard sites demands immediate practical action. The proposed SSS platform with its semi-automated algorithm can support a fast screening process for site selection and also guide more detailed measurements in the field if that is required. Constructing check dams serves a valuable purpose by reducing water velocity (i.e., increasing lag time), thereby improving water conservation, and also assists in soil restoration through preventing soil material being washed away and trapping them behind the dam structure [78]. As a consequence, the lives of residents and the environment in the vicinity of check dams can be improved [38]. Preliminary site selection can save time and resources that can be devoted to further efforts and in situ measurements on, for example, the capacity of reservoirs to hold the runoff volume during floods, their physical construction details, prevailing hazards on-site (i.e., landslides, earthquake, soil liquefaction, etc.), and more generally on all other required dam engineering aspects [79].

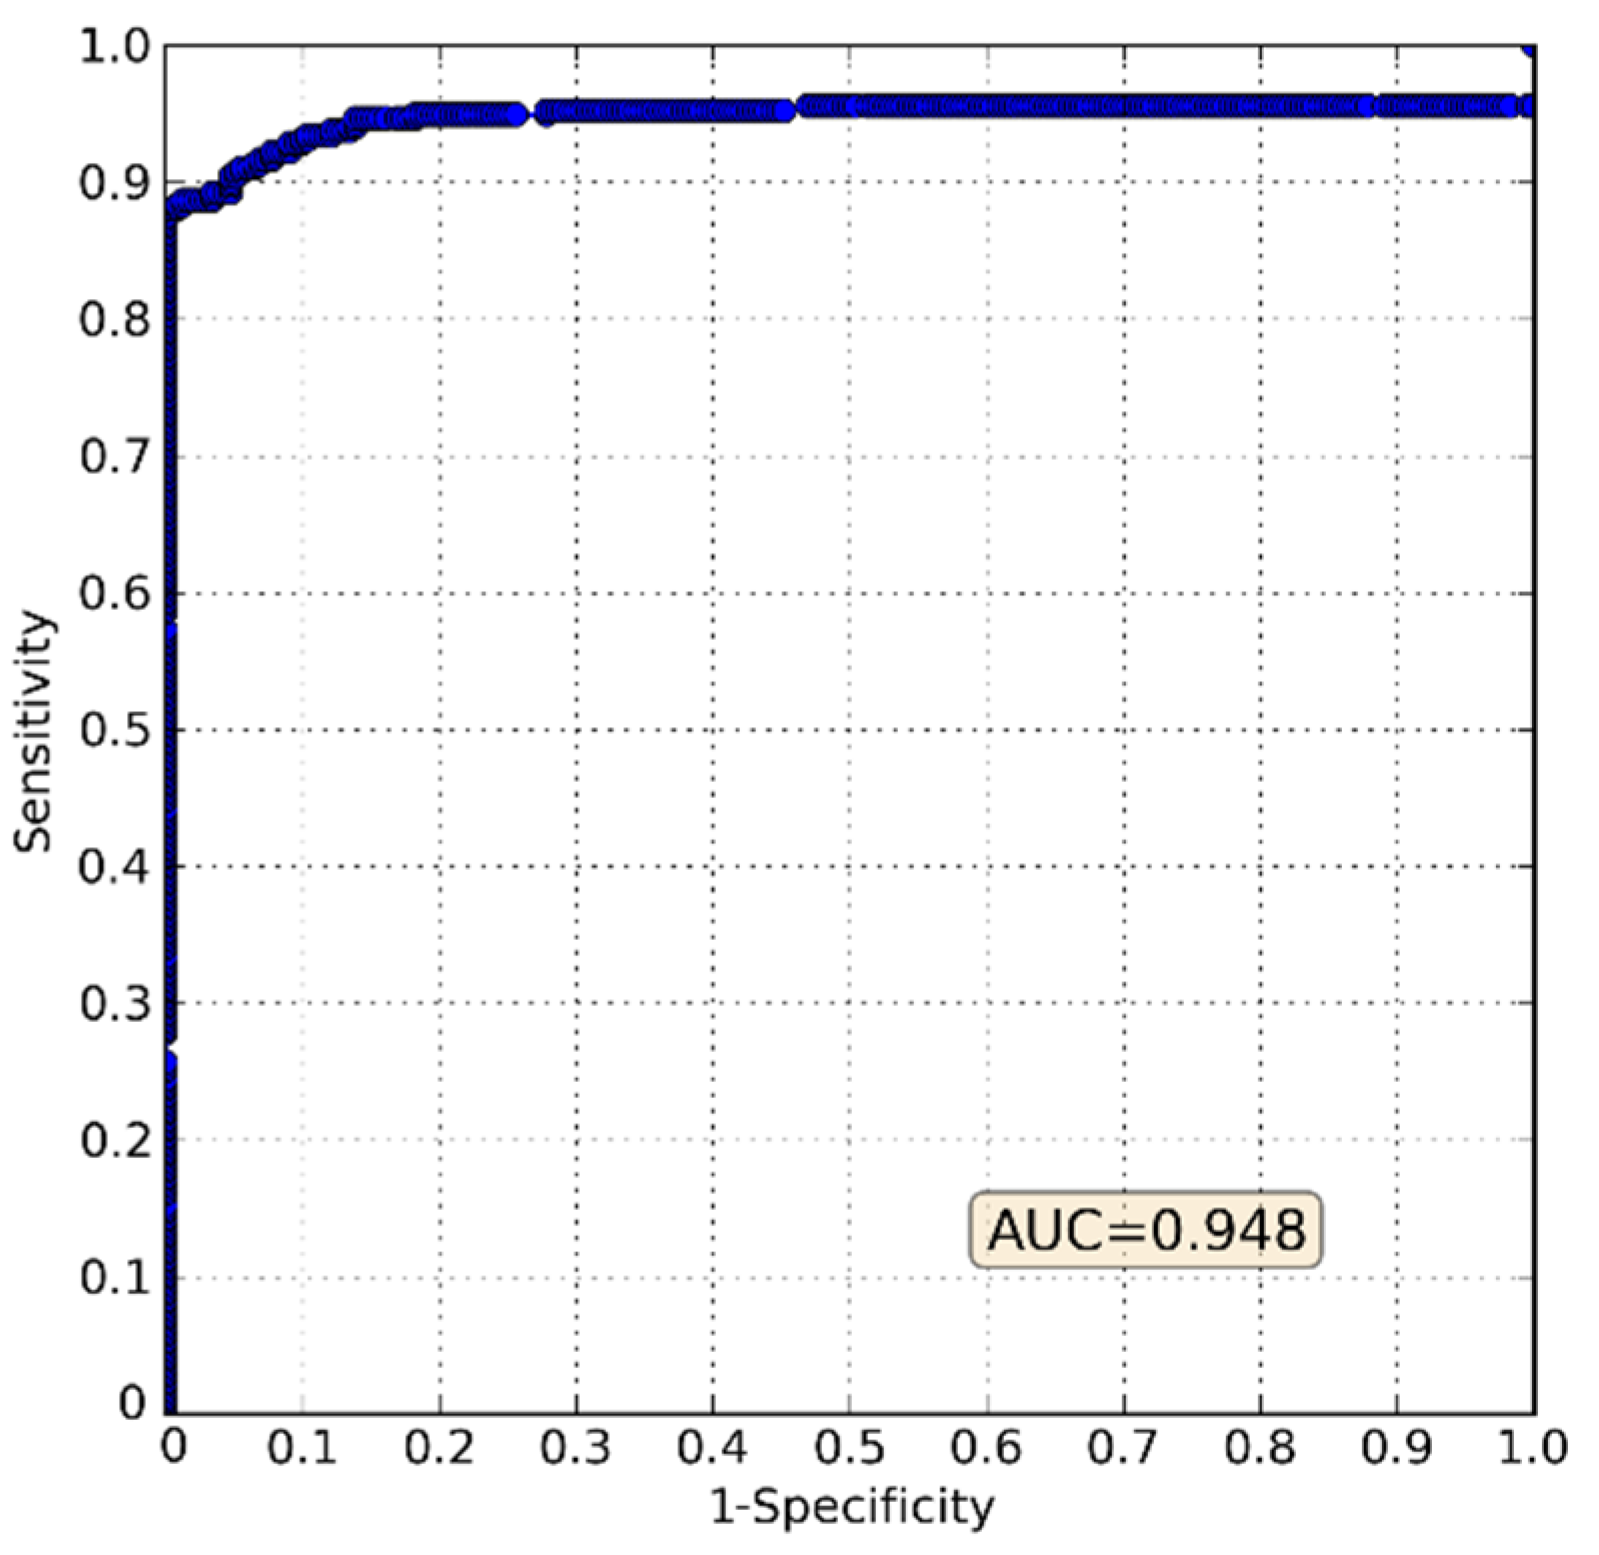
3.3. Accuracy Assessment

The accuracy of the resulting map of potential sites for constructing check dams was analyzed by comparing it with the historical flood data set, and further constructing the ROC curve (Figure 9). Figure 9 shows that the AUC value was 94.8%, which implies that the site selection map had excellent accuracy (i.e., AUC > 90%). If fact, the AUC values showed a strong agreement between the suggested sites for check dams and historical flood locations. The accuracy achieved in this case study strongly supports the SSS as an efficient tool in watershed management for site selection of check dams based on the considered geomorphometric and topo-hydrological factors. The SSS thus offers a robust siting methodology that can provide essential practical support for managers and decision makers and, as such, calls for further use and testing in other case studies.

4. Conclusions

Available resources for watershed planning and management, including for the siting of check dams investigated in this study, are commonly limited and must be intelligently and efficiently spent. The new user-friendly software SSS for ranking potential check dam sites developed using the Python programming language and applied in this study is a useful tool for achieving such planning intelligence and management efficiency. The following conclusions can be drawn.
  • There were some research gaps (explained before in the Introduction), which this study filled, and our work provides practical advantages for the site selection of check dams. Unlike previous studies that used a simple overlay method to find suitable sites for constructing check dams, this study developed software which offers pairwise comparisons and their calculations in a GIS environment with a direct weighting method for selecting suitable sites for check dams. The framework of this site selection is novel in that it explicitly considers eight geomorphometric and topo-hydrological factors that combine into a complex decision system, which is still relatively simple and rapid to use in the SSS. As another advantage of the SSS, researchers can investigate the accuracy of site selection program using the ROC curve method. Moreover, although the site selection process requires some commercial software packages (e.g., Expert Choice), the developed software is freely available for researchers and decision makers, especially in developing countries.
  • The testing of the SSS efficiency in siting check dams in this study (based on the ROC method), yielded an AUC value of 94.8%, implying excellent efficiency for the case study example of the Poldokhtar watershed. Therefore, the proposed framework with geomorphometric and topo-hydrological factors is efficient and can be taken into consideration for site selection of check dams.
  • Among the considered geomorphometric and topo-hydrological factors, slope (0.32) and SPI (0.26) were the most important ones followed by STI (0.17), leading in combination to approximately 7% and 2% of pixels in the stream network of the Poldokhtar watershed with high or very high potential for efficient check dam function. The SSS is not site-specific but is rather general, adaptive, and comprehensive, such that it can and should be further applied to other watersheds and parts of the world.
  • In this study, a digital elevation model (DEM) with resolution of 5 m was used to produce topo-hydrological factors. However, the DEM resolution may affect the performance of the developed SSS. Therefore, it is recommended that further research be conducted where different resolutions are used to determine their effects on the results of the SSS method. In addition, the adopted framework should be improved by considering socioeconomic factors as the second phase for the site selection of check dams.

5. Software Information

Name of software: SSS (site selection software)
Developers: Rahmati, O., Samadi, M.,
Hardware required: General-purpose computer (3 GB RAM)
Program language: Python
Software size: 18 KB
Cost: Free of charge

Author Contributions

Conceptualization, O.R., M.S., and D.D.M.; Methodology, O.R., M.S., and E.U.; Designing software, O.R., M.S., and O.A.N.; Validation, O.R. and D.D.M.; Formal analysis, O.R. and M.S.; Data Curation, O.R. and O.A.N.; Field investigation, O.R., O.A.N., D.D.M., and M.S.; Writing—original draft preparation, O.R., Z.K., E.U., and D.T.B.; Writing—review and editing, Z.K., G.D., and D.T.B.; Visualization, O.R., D.D.M., and M.S.

Funding

This research received no external funding.

Acknowledgments

The authors gratefully acknowledge the Iranian Department of Water Resources Management (IDWRM) and the Department of Geological Survey of Iran (GSI) for providing necessary data and maps. The authors appreciate anonymous reviewers for their constructive comments that helped them to improve the paper.

Conflicts of Interest

The authors declare no conflict of interest.

References

  1. Abbasi, N.A.; Xu, X.; Lucas-Borja, M.E.; Dang, W.; Liu, B. The use of check dams in watershed management projects: Examples from around the world. Sci. Total Environ. 2019, 676, 683–691. [Google Scholar] [CrossRef] [PubMed]
  2. Wang, Y.; Fu, B.; Chen, L.; Lü, Y.; Gao, Y. Check dam in the loess plateau of china: Engineering for environmental services and food security. Environ. Sci. Technol. 2011, 45, 10298–10299. [Google Scholar] [CrossRef] [PubMed]
  3. Yuan, S.; Li, Z.; Li, P.; Xu, G.; Gao, H.; Xiao, L.; Wang, F.; Wang, T. Influence of check dams on flood and erosion dynamic processes of a small watershed in the loss plateau. Water 2019, 11, 834. [Google Scholar] [CrossRef]
  4. Ammar, A.; Riksen, M.; Ouessar, M.; Ritsema, C. Identification of suitable sites for rainwater harvesting structures in arid and semi-arid regions: A review. Int. Soil Water Conserv. Res. 2016, 4, 108–120. [Google Scholar] [CrossRef] [Green Version]
  5. Bitterman, P.; Tate, E.; Van Meter, K.J.; Basu, N.B. Water security and rainwater harvesting: A conceptual framework and candidate indicators. Appl. Geogr. 2016, 76, 75–84. [Google Scholar] [CrossRef]
  6. Ferreira, C.S.S.; Pereira, P.; Kalantari, Z. Human impacts on soil. Sci. Total Environ. 2018, 644, 830–834. [Google Scholar] [CrossRef]
  7. Banihabib, M.E.; Forghani, A. An assessment framework for the mitigation effects of check dams on debris flow. CATENA 2017, 152, 277–284. [Google Scholar] [CrossRef]
  8. Bombino, G.; Zema, D.A.; Denisi, P.; Lucas-Borja, M.E.; Labate, A.; Zimbone, S.M. Assessment of riparian vegetation characteristics in mediterranean headwaters regulated by check dams using multivariate statistical techniques. Sci. Total Environ. 2019, 657, 597–607. [Google Scholar] [CrossRef]
  9. Zema, D.A.; Bombino, G.; Denisi, P.; Lucas-Borja, M.E.; Zimbone, S.M. Evaluating the effects of check dams on channel geometry, bed sediment size and riparian vegetation in mediterranean mountain torrents. Sci. Total Environ. 2018, 642, 327–340. [Google Scholar] [CrossRef]
  10. Lenzi, M.A. Stream bed stabilization using boulder check dams that mimic step-pool morphology features in northern italy. Geomorphology 2002, 45, 243–260. [Google Scholar] [CrossRef]
  11. Boix-Fayos, C.; Barberá, G.G.; López-Bermúdez, F.; Castillo, V.M. Effects of check dams, reforestation and land-use changes on river channel morphology: Case study of the rogativa catchment (murcia, spain). Geomorphology 2007, 91, 103–123. [Google Scholar] [CrossRef]
  12. Castillo, V.M.; Mosch, W.M.; García, C.C.; Barberá, G.G.; Cano, J.A.N.; López-Bermúdez, F. Effectiveness and geomorphological impacts of check dams for soil erosion control in a semiarid mediterranean catchment: El cárcavo (murcia, spain). CATENA 2007, 70, 416–427. [Google Scholar] [CrossRef]
  13. Kalantari, N.; Rangzan, K.; Thigale, S.S.; Rahimi, M.H. Site selection and cost-benefit analysis for artificial recharge in the baghmalek plain, khuzestan province, southwest iran. Hydrogeol. J. 2009, 18, 761–773. [Google Scholar] [CrossRef]
  14. Lal, R.; Pimentel, D. Soil erosion: A carbon sink or source? Science 2008, 319, 1040–1042. [Google Scholar] [CrossRef] [PubMed]
  15. Addisu, S.; Mekonnen, M. Check dams and storages beyond trapping sediment, carbon sequestration for climate change mitigation, northwest ethiopia. Geoenviron. Disasters 2019, 6, 4. [Google Scholar] [CrossRef]
  16. Pan, H.; Page, J.; Zhang, L.; Chen, S.; Cong, C.; Destouni, G.; Kalantari, Z.; Deal, B. Using comparative socio-ecological modeling to support climate action planning (cap). J. Clean. Prod. 2019, 232, 30–42. [Google Scholar] [CrossRef]
  17. Wang, Y.; Chen, L.; Gao, Y.; Wang, S.; Lü, Y.; Fu, B. Carbon sequestration function of check-dams: A case study of the loess plateau in china. AMBIO 2014, 43, 926–931. [Google Scholar] [CrossRef] [PubMed]
  18. Kalantari, Z.; Santos Ferreira, C.S.; Page, J.; Goldenberg, R.; Olsson, J.; Destouni, G. Meeting sustainable development challenges in growing cities: Coupled social-ecological systems modeling of land use and water changes. J. Environ. Manag. 2019, 245, 471–480. [Google Scholar] [CrossRef] [PubMed]
  19. Wei, X.; Li, X.; Wei, N. Fractal features of soil particle size distribution in layered sediments behind two check dams: Implications for the loess plateau, china. Geomorphology 2016, 266, 133–145. [Google Scholar] [CrossRef]
  20. Piton, G.; Carladous, S.; Recking, A.; Tacnet, J.M.; Liébault, F.; Kuss, D.; Quefféléan, Y.; Marco, O. Why do we build check dams in alpine streams? An historical perspective from the french experience. Earth Surf. Process. Landf. 2016, 42, 91–108. [Google Scholar] [CrossRef]
  21. Lü, Y.; Sun, R.; Fu, B.; Wang, Y. Carbon retention by check dams: Regional scale estimation. Ecol. Eng. 2012, 44, 139–146. [Google Scholar] [CrossRef]
  22. Castillo, C.; Pérez, R.; Gómez, J.A. A conceptual model of check dam hydraulics for gully control: Efficiency, optimal spacing and relation with step-pools. Hydrol. Earth Syst. Sci. 2014, 18, 1705–1721. [Google Scholar] [CrossRef]
  23. Osti, R.; Egashira, S. Method to improve the mitigative effectiveness of a series of check dams against debris flows. Hydrol. Process. 2008, 22, 4986–4996. [Google Scholar] [CrossRef]
  24. Singh, J.P.; Singh, D.; Litoria, P.K. Selection of suitable sites for water harvesting structures in soankhad watershed, punjab using remote sensing and geographical information system (rs&gis) approach—A case study. J. Indian Soc. Remote Sens. 2009, 37, 21–35. [Google Scholar]
  25. Ahlmer, A.-K.; Cavalli, M.; Hansson, K.; Koutsouris, A.J.; Crema, S.; Kalantari, Z. Soil moisture remote-sensing applications for identification of flood-prone areas along transport infrastructure. Environ. Earth Sci. 2018, 77, 533. [Google Scholar] [CrossRef] [Green Version]
  26. Lenzi, M.A.; Comiti, F. Local scouring and morphological adjustments in steep channels with check-dam sequences. Geomorphology 2003, 55, 97–109. [Google Scholar] [CrossRef]
  27. Jozaghi, A.; Alizadeh, B.; Hatami, M.; Flood, I.; Khorrami, M.; Khodaei, N.; Ghasemi Tousi, E. A comparative study of the ahp and topsis techniques for dam site selection using gis: A case study of sistan and baluchestan province, iran. Geosciences 2018, 8, 494. [Google Scholar] [CrossRef]
  28. Karayalcin, I.I. The analytic hierarchy process: Planning, priority setting, resource allocation. Eur. J. Oper. Res. 1982, 9, 97–98. [Google Scholar] [CrossRef]
  29. Jamali, I.A.; Mörtberg, U.; Olofsson, B.; Shafique, M. A spatial multi-criteria analysis approach for locating suitable sites for construction of subsurface dams in northern pakistan. Water Resour. Manag. 2014, 28, 5157–5174. [Google Scholar] [CrossRef]
  30. Kalantari, Z.; Ferreira, C.S.S.; Koutsouris, A.J.; Ahlmer, A.-K.; Cerdà, A.; Destouni, G. Assessing flood probability for transportation infrastructure based on catchment characteristics, sediment connectivity and remotely sensed soil moisture. Sci. Total Environ. 2019, 661, 393–406. [Google Scholar] [CrossRef]
  31. Karlsson, C.S.J.; Kalantari, Z.; Mörtberg, U.; Olofsson, B.; Lyon, S.W. Natural hazard susceptibility assessment for road planning using spatial multi-criteria analysis. Environ. Manag. 2017, 60, 823–851. [Google Scholar] [CrossRef] [PubMed]
  32. GSI. Geology Survey of Iran (GSI). Available online: http://www.Gsi.Ir/main/lang_en/index.Html (accessed on 5 October 1997).
  33. Ladoni, M.; Alavipanah, S.K.; Bahrami, H.A.; Noroozi, A.A. Remote sensing of soil organic carbon in semi-arid region of iran. Arid Land Res. Manag. 2010, 24, 271–281. [Google Scholar] [CrossRef]
  34. Pathak, P.; Sudi, R.; Wani, S.P.; Sahrawat, K.L. Hydrological behavior of alfisols and vertisols in the semi-arid zone: Implications for soil and water management. Agric. Water Manag. 2013, 118, 12–21. [Google Scholar] [CrossRef]
  35. Rahmati, O.; Tahmasebipour, N.; Haghizadeh, A.; Pourghasemi, H.R.; Feizizadeh, B. Evaluating the influence of geo-environmental factors on gully erosion in a semi-arid region of iran: An integrated framework. Sci. Total Environ. 2017, 579, 913–927. [Google Scholar] [CrossRef] [PubMed]
  36. Rahmati, O.; Kornejady, A.; Samadi, M.; Deo, R.C.; Conoscenti, C.; Lombardo, L.; Dayal, K.; Taghizadeh-Mehrjardi, R.; Pourghasemi, H.R.; Kumar, S.; et al. Pmt: New analytical framework for automated evaluation of geo-environmental modelling approaches. Sci. Total Environ. 2019, 664, 296–311. [Google Scholar] [CrossRef]
  37. Pontius, R.G.; Schneider, L.C. Land-cover change model validation by an roc method for the ipswich watershed, massachusetts, USA. Agric. Ecosyst. Environ. 2001, 85, 239–248. [Google Scholar] [CrossRef]
  38. Tien Bui, D.; Pradhan, B.; Nampak, H.; Bui, Q.-T.; Tran, Q.-A.; Nguyen, Q.-P. Hybrid artificial intelligence approach based on neural fuzzy inference model and metaheuristic optimization for flood susceptibilitgy modeling in a high-frequency tropical cyclone area using gis. J. Hydrol. 2016, 540, 317–330. [Google Scholar] [CrossRef]
  39. Cerdan, O.; Govers, G.; Le Bissonnais, Y.; Van Oost, K.; Poesen, J.; Saby, N.; Gobin, A.; Vacca, A.; Quinton, J.; Auerswald, K.; et al. Rates and spatial variations of soil erosion in europe: A study based on erosion plot data. Geomorphology 2010, 122, 167–177. [Google Scholar] [CrossRef]
  40. Khosravi, K.; Pham, B.T.; Chapi, K.; Shirzadi, A.; Shahabi, H.; Revhaug, I.; Prakash, I.; Tien Bui, D. A comparative assessment of decision trees algorithms for flash flood susceptibility modeling at haraz watershed, northern iran. Sci. Total Environ. 2018, 627, 744–755. [Google Scholar] [CrossRef]
  41. Tien Bui, D.; Hoang, N.-D.; Martínez-Álvarez, F.; Ngo, P.-T.T.; Hoa, P.V.; Pham, T.D.; Samui, P.; Costache, R. A novel deep learning neural network approach for predicting flash flood susceptibility: A case study at a high frequency tropical storm area. Sci. Total Environ. 2019. [Google Scholar] [CrossRef]
  42. Costache, R.; Tien Bui, D. Spatial prediction of flood potential using new ensembles of bivariate statistics and artificial intelligence: A case study at the putna river catchment of romania. Sci. Total Environ. 2019, 691, 1098–1118. [Google Scholar] [CrossRef] [PubMed]
  43. De Reu, J.; Bourgeois, J.; Bats, M.; Zwertvaegher, A.; Gelorini, V.; De Smedt, P.; Chu, W.; Antrop, M.; De Maeyer, P.; Finke, P.; et al. Application of the topographic position index to heterogeneous landscapes. Geomorphology 2013, 186, 39–49. [Google Scholar] [CrossRef]
  44. Kopecký, M.; Čížková, Š. Using topographic wetness index in vegetation ecology: Does the algorithm matter? Appl. Veg. Sci. 2010, 13, 450–459. [Google Scholar] [CrossRef]
  45. Papaioannou, G.; Vasiliades, L.; Loukas, A. Multi-criteria analysis framework for potential flood prone areas mapping. Water Resour. Manag. 2014, 29, 399–418. [Google Scholar] [CrossRef]
  46. Pei, T.; Qin, C.-Z.; Zhu, A.X.; Yang, L.; Luo, M.; Li, B.; Zhou, C. Mapping soil organic matter using the topographic wetness index: A comparative study based on different flow-direction algorithms and kriging methods. Ecol. Indic. 2010, 10, 610–619. [Google Scholar] [CrossRef]
  47. Pourali, S.H.; Arrowsmith, C.; Chrisman, N.; Matkan, A.A.; Mitchell, D. Topography wetness index application in flood-risk-based land use planning. Appl. Spat. Anal. Policy 2014, 9, 39–54. [Google Scholar] [CrossRef]
  48. Conrad, O.; Bechtel, B.; Bock, M.; Dietrich, H.; Fischer, E.; Gerlitz, L.; Wehberg, J.; Wichmann, V.; Böhner, J. System for automated geoscientific analyses (saga) v. 2.1.4. Geosci. Model Dev. 2015, 8, 1991–2007. [Google Scholar] [CrossRef]
  49. Wang, L.; Liu, H. An efficient method for identifying and filling surface depressions in digital elevation models for hydrologic analysis and modelling. Int. J. Geogr. Inf. Sci. 2006, 20, 193–213. [Google Scholar] [CrossRef]
  50. Beven, K.J.; Kirkby, M.J. A physically based, variable contributing area model of basin hydrology/un modèle à base physique de zone d’appel variable de l’hydrologie du bassin versant. Hydrol. Sci. Bull. 1979, 24, 43–69. [Google Scholar] [CrossRef]
  51. Michielsen, A.; Kalantari, Z.; Lyon, S.W.; Liljegren, E. Predicting and communicating flood risk of transport infrastructure based on watershed characteristics. J. Environ. Manag. 2016, 182, 505–518. [Google Scholar] [CrossRef]
  52. Mokarrama, M.; Hojati, M. Landform classification using a sub-pixel spatial attraction model to increase spatial resolution of digital elevation model (dem). Egypt. J. Remote Sens. Space Sci. 2018, 21, 111–120. [Google Scholar] [CrossRef]
  53. Rodríguez-Caballero, E.; Cantón, Y.; Chamizo, S.; Afana, A.; Solé-Benet, A. Effects of biological soil crusts on surface roughness and implications for runoff and erosion. Geomorphology 2012, 145–146, 81–89. [Google Scholar]
  54. Nellemann, C.; Reynolds, P.E. Predicting late winter distribution of muskoxen using an index of terrain ruggedness. Arct. Alp. Res. 1997, 29, 334–338. [Google Scholar] [CrossRef]
  55. Guisan, A.; Weiss, S.B.; Weiss, A.D. Glm versus cca spatial modeling of plant species distribution. Plant Ecol. 1999, 143, 107–122. [Google Scholar] [CrossRef]
  56. Moore, I.D.; Wilson, J.P. Length-slope factors for the revised universal soil loss equation: Simplified method of estimation. J. Soil Water Conserv. 1992, 47, 423–428. [Google Scholar]
  57. Burrough, P.A.; McDonnell, R.A. Principles of Geographical Information Systems; Oxford University Press: Oxford, NY, USA, 1998. [Google Scholar]
  58. Mojaddadi, H.; Pradhan, B.; Nampak, H.; Ahmad, N.; Ghazali, A.H.B. Ensemble machine-learning-based geospatial approach for flood risk assessment using multi-sensor remote-sensing data and gis. Geomat. Nat. Hazards Risk 2017, 8, 1080–1102. [Google Scholar] [CrossRef]
  59. Kalantari, Z.; Nickman, A.; Lyon, S.W.; Olofsson, B.; Folkeson, L. A method for mapping flood hazard along roads. J. Environ. Manag. 2014, 133, 69–77. [Google Scholar] [CrossRef]
  60. Strahler, A.N. Quantitative analysis of watershed geomorphology. Trans. Am. Geophys. Union 1957, 38, 913. [Google Scholar] [CrossRef]
  61. Mhiret, D.A.; Dagnew, D.C.; Assefa, T.T.; Tilahun, S.A.; Zaitchik, B.F.; Steenhuis, T.S. Erosion hotspot identification in the sub-humid ethiopian highlands. Ecohydrol. Hydrobiol. 2019, 19, 146–154. [Google Scholar] [CrossRef]
  62. Thompson, C.; Croke, J. Geomorphic effects, flood power, and channel competence of a catastrophic flood in confined and unconfined reaches of the upper lockyer valley, southeast queensland, australia. Geomorphology 2013, 197, 156–169. [Google Scholar] [CrossRef]
  63. Chenini, I.; Mammou, A.B.; El May, M. Groundwater recharge zone mapping using gis-based multi-criteria analysis: A case study in central tunisia (maknassy basin). Water Resour. Manag. 2009, 24, 921–939. [Google Scholar] [CrossRef]
  64. Nyssen, J.; Veyret-Picot, M.; Poesen, J.; Moeyersons, J.; Haile, M.; Deckers, J.; Govers, G. The effectiveness of loose rock check dams for gully control in tigray, northern ethiopia. Soil Use Manag. 2006, 20, 55–64. [Google Scholar] [CrossRef]
  65. Saaty, T.L. Fundamentals of the analytic hierarchy process. In The Analytic Hierarchy Process in Natural Resource and Environmental Decision Making; Schmoldt, D.L., Kangas, J., Mendoza, G.A., Pesonen, M., Eds.; Springer: Dordrecht, The Netherlands, 2001; pp. 15–35. [Google Scholar]
  66. Mu, E.; Pereyra-Rojas, M. Understanding the analytic hierarchy process. In Practical Decision Making: An Introduction to the Analytic Hierarchy Process (ahp) Using Super Decisions v2; Springer International Publishing: Cham, Switzerland, 2017; pp. 7–22. [Google Scholar]
  67. Saaty, T.L. A scaling method for priorities in hierarchical structures. J. Math. Psychol. 1977, 15, 234–281. [Google Scholar] [CrossRef]
  68. Mandrekar, J.N. Receiver operating characteristic curve in diagnostic test assessment. J. Thorac. Oncol. 2010, 5, 1315–1316. [Google Scholar] [CrossRef] [PubMed]
  69. Gokceoglu, C.; Sonmez, H.; Nefeslioglu, H.A.; Duman, T.Y.; Can, T. The 17 march 2005 kuzulu landslide (sivas, turkey) and landslide-susceptibility map of its near vicinity. Eng. Geol. 2005, 81, 65–83. [Google Scholar] [CrossRef]
  70. Tien Bui, D.; Hoang, N.-D.; Nguyen, H.; Tran, X.-L. Spatial prediction of shallow landslide using bat algorithm optimized machine learning approach: A case study in lang son province, vietnam. Adv. Eng. Inform. 2019, 42, 100978. [Google Scholar] [CrossRef]
  71. Degiorgis, M.; Gnecco, G.; Gorni, S.; Roth, G.; Sanguineti, M.; Taramasso, A.C. Classifiers for the detection of flood-prone areas using remote sensed elevation data. J. Hydrol. 2012, 470–471, 302–315. [Google Scholar] [CrossRef]
  72. Conforti, M.; Pascale, S.; Robustelli, G.; Sdao, F. Evaluation of prediction capability of the artificial neural networks for mapping landslide susceptibility in the turbolo river catchment (northern calabria, italy). CATENA 2014, 113, 236–250. [Google Scholar] [CrossRef]
  73. Chung, C.-J.F.; Fabbri, A.G. Validation of spatial prediction models for landslide hazard mapping. Nat. Hazards 2003, 30, 451–472. [Google Scholar] [CrossRef]
  74. Wang, G.; Qin, L.; Li, G.; Chen, L. Landfill site selection using spatial information technologies and ahp: A case study in beijing, china. J. Environ. Manag. 2009, 90, 2414–2421. [Google Scholar] [CrossRef]
  75. Moeinaddini, M.; Khorasani, N.; Danehkar, A.; Darvishsefat, A.A.; zienalyan, M. Siting msw landfill using weighted linear combination and analytical hierarchy process (ahp) methodology in gis environment (case study: Karaj). Waste Manag. 2010, 30, 912–920. [Google Scholar] [CrossRef] [PubMed]
  76. Arnette, A.; Zobel, C.; Bosch, D.; Pease, J.; Metcalfe, T. Stakeholder ranking of watershed goals with the vector analytic hierarchy process: Effects of participant grouping scenarios. Environ. Model. Softw. 2010, 25, 1459–1469. [Google Scholar] [CrossRef]
  77. Voinov, A.; Gaddis, E.J.B. Lessons for successful participatory watershed modeling: A perspective from modeling practitioners. Ecol. Model. 2008, 216, 197–207. [Google Scholar] [CrossRef]
  78. Yasser, M.; Jahangir, K.; Mohmmad, A. Earth dam site selection using the analytic hierarchy process (ahp): A case study in the west of iran. Arab. J. Geosci. 2012, 6, 3417–3426. [Google Scholar] [CrossRef]
  79. Alatawi, S.; Abushand, E. Dam site selection using remote sensing techniques and geographical information system to control flood events in tabuk city. J. Waste Water Treat. Anal. 2015, 6. [Google Scholar] [CrossRef]
Figure 1. (a) Elevation map of the Poldokhtar watershed and its location in the west of Iran, (b) a Google Earth image of the study area taken in 2018.
Sustainability 11 05639 g001
Figure 2. Photographs showing the severity of the flash flood that occurred in April 2019: (a) a flooded school and (b) a flooded part in Poldokhtar city (these figures were obtained from the Water Resources Company of Lorestan).
Sustainability 11 05639 g002
Figure 3. Excerpt script in programming for the site selection software (SSS).
Sustainability 11 05639 g003
Figure 4. View of the layout and steps in the SSS.
Sustainability 11 05639 g004
Figure 5. Maps showing the values of the eight considered geomorphometric and topo-hydrological factors within the study area. (a) topographic wetness index (TWI), (b) terrain ruggedness index (TRI), (c) topographic position index (TPI), (d) sediment transport index (STI), (e) stream power index (SPI), (f) slope, (g) drainage density (DD), and (h) stream order (SO).
Sustainability 11 05639 g005
Figure 6. Example of a hierarchy of criteria and site alternatives in site selection using the analytic hierarchy process (AHP) method.
Sustainability 11 05639 g006
Figure 7. Suitability map of the study area and (a) and (b) of rivers within it, showing the suitability of areas (four classes) for the construction of check dams.
Sustainability 11 05639 g007
Figure 8. Map showing specific suitable sites for the construction of check dams.
Sustainability 11 05639 g008
Figure 9. Accuracy assessment of potential sites for check dams using the receiver operating characteristic (ROC) curve method.
Sustainability 11 05639 g009
Table 1. Assigned and normalized scores for classes of each thematic factor.
FactorClassesAssigned Score (S)Normalized Score (NS)
TRI< 2010.07
20–4020.13
40–6030.20
60–8040.27
> 8050.33
TPI< −5050.33
−50 to (–20)40.27
−20 to 1030.20
10–4020.13
> 4010.07
STI< 0.9510.07
0.95–120.13
1–1.2530.20
> 1.2540.27
SPI< 0.510.07
0.5–120.13
1–230.20
> 240.27
Slope< 1010.07
10–2520.13
25–4030.20
40–5540.27
> 5550.33
DD< 0.210.07
0.2–0.420.13
0.4–0.6030.20
> 0.6040.27
TWI< 510.07
5–1020.13
10–1530.20
15–2040.27
> 2050.33
SO100
250.33
340.27
430.20
520.13
610.07
TRI, terrain ruggedness index; TPI, topographic position index; STI, sediment transport index; SPI, stream power index; DD, drainage density; TWI, topographic wetness index; SO, stream order.
Table 2. Basic scale for pairwise comparison of the importance of factors [67].
Intensity of ImportanceDefinition
1Equal importance
2Equal to moderate importance
3Moderate importance
4Moderate to strong importance
5Strong importance
6Strong to very strong importance
7Very strong importance
8Very to extremely strong importance
9Extreme importance
Table 3. Pairwise comparison matrix of the eight geomorphometric and topo-hydrological factors and calculation of normalized weight by the analytical hierarchy process (AHP) method.
FactorSlopeSPISTISODDTRITWITPINormalized Weight (NW)
Slope123557890.32
SPI1/213456780.26
STI1/31/31345670.17
SO1/51/41/3133560.1
DD1/51/51/41/313450.07
TWI1/71/61/51/31/31340.04
TRI1/81/71/61/51/41/3120.02
TPI1/91/81/71/61/51/41/210.02
SPI, stream power index; STI, sediment transport index; SO, stream order; DD, drainage density; TRI, terrain ruggedness index; TWI, topographic wetness index; TPI, topographic position index.
Table 4. Area of suitability classes for the construction of check dams within the Poldokhtar catchment.
No.ClassArea (ha)Area (%)
1Low18,676.867.1
2Medium6468.0323.2
3High2020.687.3
4Very high658.622.36

