Mapping Urban Park Cultural Ecosystem Services: A Comparison of Twitter and Semi-Structured Interview Methods


1
USDA Forest Service, Northern Research Station, New York, NY 10007, USA
2
Urban & Community Forester, Hawaiʿi Department of Land and Natural Resources, Division of Forestry & Wildlife, Honolulu, HI 96813, USA
*
Author to whom correspondence should be addressed.
Sustainability 2019, 11(21), 6137; https://doi.org/10.3390/su11216137
Submission received: 1 August 2019
/
Revised: 26 September 2019
/
Accepted: 21 October 2019
/
Published: 4 November 2019
(This article belongs to the Special Issue Urban Green Spaces, Urban Forestry, Health and Wellbeing, Planning and Governance)
Abstract
:Understanding the benefits received from urban greenspace is critical for planning and decision-making. The benefits of parks can be challenging to measure and evaluate, which calls for the development of novel methods. Crowdsourced data from social media can provide a platform for measuring and understanding social values. However, such methods can have drawbacks, including representation bias, undirected content, and a lack of demographic data. We compare the amount and distribution of park benefits elicited from (1) tweets on Twitter about Prospect Park, Brooklyn, New York (n = 451) with park benefits derived from (2) broad (n = 288) and (3) directed (n = 39) questions on two semi-structured interview protocols for park users within Prospect Park. We applied combined deductive and inductive coding to all three datasets, drawing from the Millennium Ecosystem Assessment’s (MEA) cultural ecosystem services (CES) framework. All three methods elicited an overlapping set of CES, but only the Twitter dataset captured all 10 MEA-defined CES. All methods elicited social relations and recreation as commonly occurring, but only the directed question interview protocol was able to widely elicit spiritual values. We conclude this paper with a discussion of tradeoffs and triangulation opportunities when using Twitter data to measure CES and other urban park benefits.
1. Introduction
Globally, urban parks are increasingly used as populations in cities grow. City residents rely on parks and green spaces for physical, mental, and social well-being [1,2,3]. Often, parks are the only or main source of green space for urban dwellers [4,5]. Haase et al. note that urban greenspaces are “deeply situated in the functioning of society” [6]. As such, assessing benefits that parks provide to people is critical to ensuring both urban park management that addresses people’s needs and a broader quality of life in cities. Often, assessments are limited in their analysis of greenspace characteristics as they relate to human health and well-being, which can minimize or eliminate social factors from quantitative assessments and associated decision-making on urban greenspace management [7]. While there are similarities across cities around attitudes towards ecosystem service provision, park use patterns vary significantly across cities, making a city’s context, such as park availability, quality, and residents’ perception and preferences for cultural ecosystem services (CES) crucial for urban planning [8].
New advances in technology are enabling a revolution in data availability for assessing CES. Traditional social science methods for assessing CES include interviews, surveys, participant observation, and focus groups—they have high reliability and validity but are time intensive and typically result in only a sample of parks assessed. In a review of human–environment urban green space studies, Kabisch et al. identified that most studies focused on a single park and applied surveys as the dominant methodology [9]. With the advent of ‘big data’, social media can provide crowdsourced, geotagged data about people’s experiences with and interactions in parks that enable us to study park usership in new ways [10,11]. Methods are needed to harness and triangulate these newly available data that maximize reliability and validity.
To address this need to assess social media as a data source, this paper combines interview and Twitter data to examine the tradeoffs of these methods in eliciting CES and other park benefits. We address two research questions: (1) what CES are reported in a large urban park in New York City and (2) what opportunities do text-based social media offer for identifying CES, when contrasted with and combined with on-site interviews. We also examine the nuances of interview-based content analysis through exploring directed and broader questions around identifying CES. The paper focuses on Prospect Park, Brooklyn, New York (USA) as a study site, but has implications for all urban greenspace where park users are on social media. We selected Prospect Park for this research because (1) its managers are interested in understanding park use and meaning in the park, including CES and (2) it is a well-visited urban park with a variety of natural and landscaped features that is surrounded by neighborhoods that are socioeconomically diverse in nature.
1.1. Background
1.1.1. Social Media Analysis in the Social Sciences
Crowdsourcing data is an emerging methodology for the social sciences, offering large datasets with extensive spatial coverage. New approaches are being developed for collecting and analyzing these datasets [12]. For example, Mitchell et al. applied an automated content analysis of 80 million tweets to examine how happiness could vary across locales, noting social media has the potential to estimate real-time levels and changes in population-scale measures [13]. However, crowdsourcing approaches offer methodological challenges, such as incomplete information, data noise, and issues with representativeness, consistency, reliability, and ethics [14]. Established social science methods have already addressed these issues of representativeness, validity, and reliability in how data are collected and analyzed [15,16]. New research efforts have evaluated crowdsourcing methods against these issues, noting the potential for population bias, behaviors specific to a particular social media platform and proprietary algorithms, and the potential for proxy population mismatches, whereby the set of individuals commenting on social media are not representative of the population they are assumed to represent [17]. When examining the spatial distribution of crowdsourced tweets across the United States, Malik et al. found that geotagged tweets were more likely to occur in areas that are more urban, further East, or on a coast, and that have a high median income and high Asian, Black or Hispanic/Latino populations [18]. Not all social media posts originate from local users though. Johnson et al. found that only 75% of geotagged social media from Twitter, Flickr and Swarm were from local users, with more rural areas and areas with older demographics having less local social media than elsewhere [19].
By applying data from social media, researchers can investigate residents’ use of urban space [19]. Social media have also been applied to counting visitor use in protected areas [20] and urban parks [10]. Tenkanen et al. noted a difference among platforms, with Instagram being a better match with actual visitor counts than Flickr and Twitter—they also caution social media only be applied in well-visited parks [20]. With an expansive, spatially-explicit dataset, Hemstead et al. were able to investigate park usership as it relates to a variety of neighborhood factors across all parks in New York City, rather than a sample available from field work [10]. Roberts applied Twitter to understand urban greenspaces, noting that Twitter data identified the range of events occurring in greenspaces and the diversity of how people use these spaces [21]. Kovacs-Györi et al. applied automated sentiment analysis to geotagged tweets over time for multiple urban parks in the UK, finding “people tweeted mostly in parks 3–4 km away from their center of activity and they were more positive than elsewhere while doing so” [22]. The potential exists for extending such analyses to examine values and benefits associated with use of urban greenspaces, through content analysis of social media platforms.
1.1.2. Cultural Ecosystem Services
Since their initial delineation in the Millennium Ecosystem Assessment (MEA) [23], cultural ecosystem services (CES) have become an increasingly fruitful area of research. The biophysical features of the environment and associated processes are easier to measure than the less tangible benefits that people derive [24]. The MEA identified 10 types of CES (Table 1) and conceptual relationships with other ecosystem services and human well-being—subsequent research has focused on refining these concepts and relationships. In the UK National Ecosystem Assessment, Haines-Young and Potschin defined cultural ecosystem services as “nonmaterial, nonconsumptive outputs of ecosystems that affect the physical and mental states of people” [25]. Fischer and Eastwood have pointed to a need to consider identities and capabilities of people that interact with the environment to co-produce CES, as this aspect is less explored in standard ecosystem services assessments [26]. In a recent review, Blicharska et al. identified a framework for understanding CES that involves the consideration of rigor in identifying CES, identifying the ecosystem elements that underpin CES, the beneficiaries of CES and how they value the benefits delivered by CES, as well as how CES may vary in space and time [27]. Additionally, there is emerging literature on relational values as a way of framing cultural ecosystem services [28,29] including reframing as nature’s contributions to people [30]. For example, in Hawaii, workshops identified a preference for relational values between indigenous people and places rather than concepts such as services or benefits [31].
The most common way of evaluating CES is a mixed methods approach, combining surveys and interviews [32]. Church et al. suggest incorporating a range of methods is the most effective way to capture as much information as possible [33]. One such approach was undertaken by Gould et al., where they combined qualitative interviews with a specially derived protocol—such inductive approaches enable respondents to articulate individual values and convey their relative importance in their own words [34]. Bertram and Rehdanz also applied an inductive approach, using a survey to uncover CES as benefits [8]. Through such inductive approaches, additional links between the landscape and wellbeing can be captured, beyond the CES identified in the MEA [35].
Spatiality needs to be considered when evaluating CES. The scale of analysis can identify synergies in ecosystem services at broader scales that may mask tradeoffs observed at local scales [36]. CES are more spatially aggregated than other services [37,38]. Also, the question of the appropriate spatial scale for a cultural service exists—some services like spiritual values may be less tied to a specific landscape feature than values like aesthetics [39]. Most CES, aside from bequest values, require interactions with humans, and human-generated benefits can be derived from human-modified ecosystems, such as urban areas [40]. Urban greenspace users also tend to value the most familiar and accessible areas [41]. When comparing workshop and survey-based participatory mapping data of landscape values, Brown et al. found little spatial concurrence between the two, possibly because of the limited sample size of the workshop data [42]. At the same time, Brown et al. point to mixed-methods participatory mapping (qualitative interviews and Internet survey) as offering triangulation of datasets to demonstrate convergence in construct meaning, spatial location, and consistency in values in populations sampled [43].
Emerging work has identified that cultural ecosystem services can occur in bundles, or co-occurring groups of CES. In stakeholder interviews of natural resource managers and those with livelihoods dependent upon ocean resources, people usually mentioned an array of services rather than a single service, value, or benefit [44]. In examining CES through participatory mapping in Germany, Pleininger et al. found two CES groupings: recreation (e.g., recreation, walking, swimming, social relations) and cognitive meaning (e.g., place attachment, inspiration, aesthetics, spiritual values) [39]. Riechers et al. found CES to be perceived through bundles and that CES bundles can be negatively associated with each other [45]. Additional work has found tradeoffs between provisioning, regulating, and cultural ecosystem services. Bundle analysis can identify areas with exceptionally desirable or undesirable sets of ecosystem services [46]. Care must be taken when considering the tradeoffs of cultural ecosystem services, as CES are perceived differently by different people and a single CES may be considered irreplaceable, rendering a tradeoff analysis inappropriate. Considering CES as bundles helps avoid planning for individual ecosystem services in isolation, which can have unintended negative effects on other ecosystem services [39].
Recent efforts at measuring cultural ecosystem services in urban parks have identified some trends and issues around this topic. A review of CES studies in urban greenspaces finds a current emphasis on identifying CES [47], but Rall et al. [48] note the potential to understand the effects of urban greenspace attributes and Dickinson and Hobbs [41] point to how sociocultural diversity in cities may influence CES co-production. Inductive approaches have led to identification of additional CES beyond those defined in the MEA [34]. Researchers in New York City conducted park user interviews, finding many cultural ecosystem services, like spiritual values, social relations, recreation, and place attachment could be elicited through an inductive approach [47]. Deductive approaches have led to the ability to identify preferences and ranking of a set of CES. Rall et al. applied a deductive survey methodology to urban greenspaces in Berlin, asking survey respondents to pinpoint the presence of a set list of CES on a map, finding spatial patterns to CES along an urban-rural gradient, with the density of perceived CES higher in the inner city and certain CES more mentioned in the inner city [48].
Below, we build upon this literature and identify research gaps to examine social media and interview methodologies in eliciting CES. We describe our study area and methods, then present tabular and map-based results, and conclude with a discussion of the tradeoffs present among these methods when considering capturing CES in an urban greenspace setting.
2. Materials and Methods
2.1. Study Area
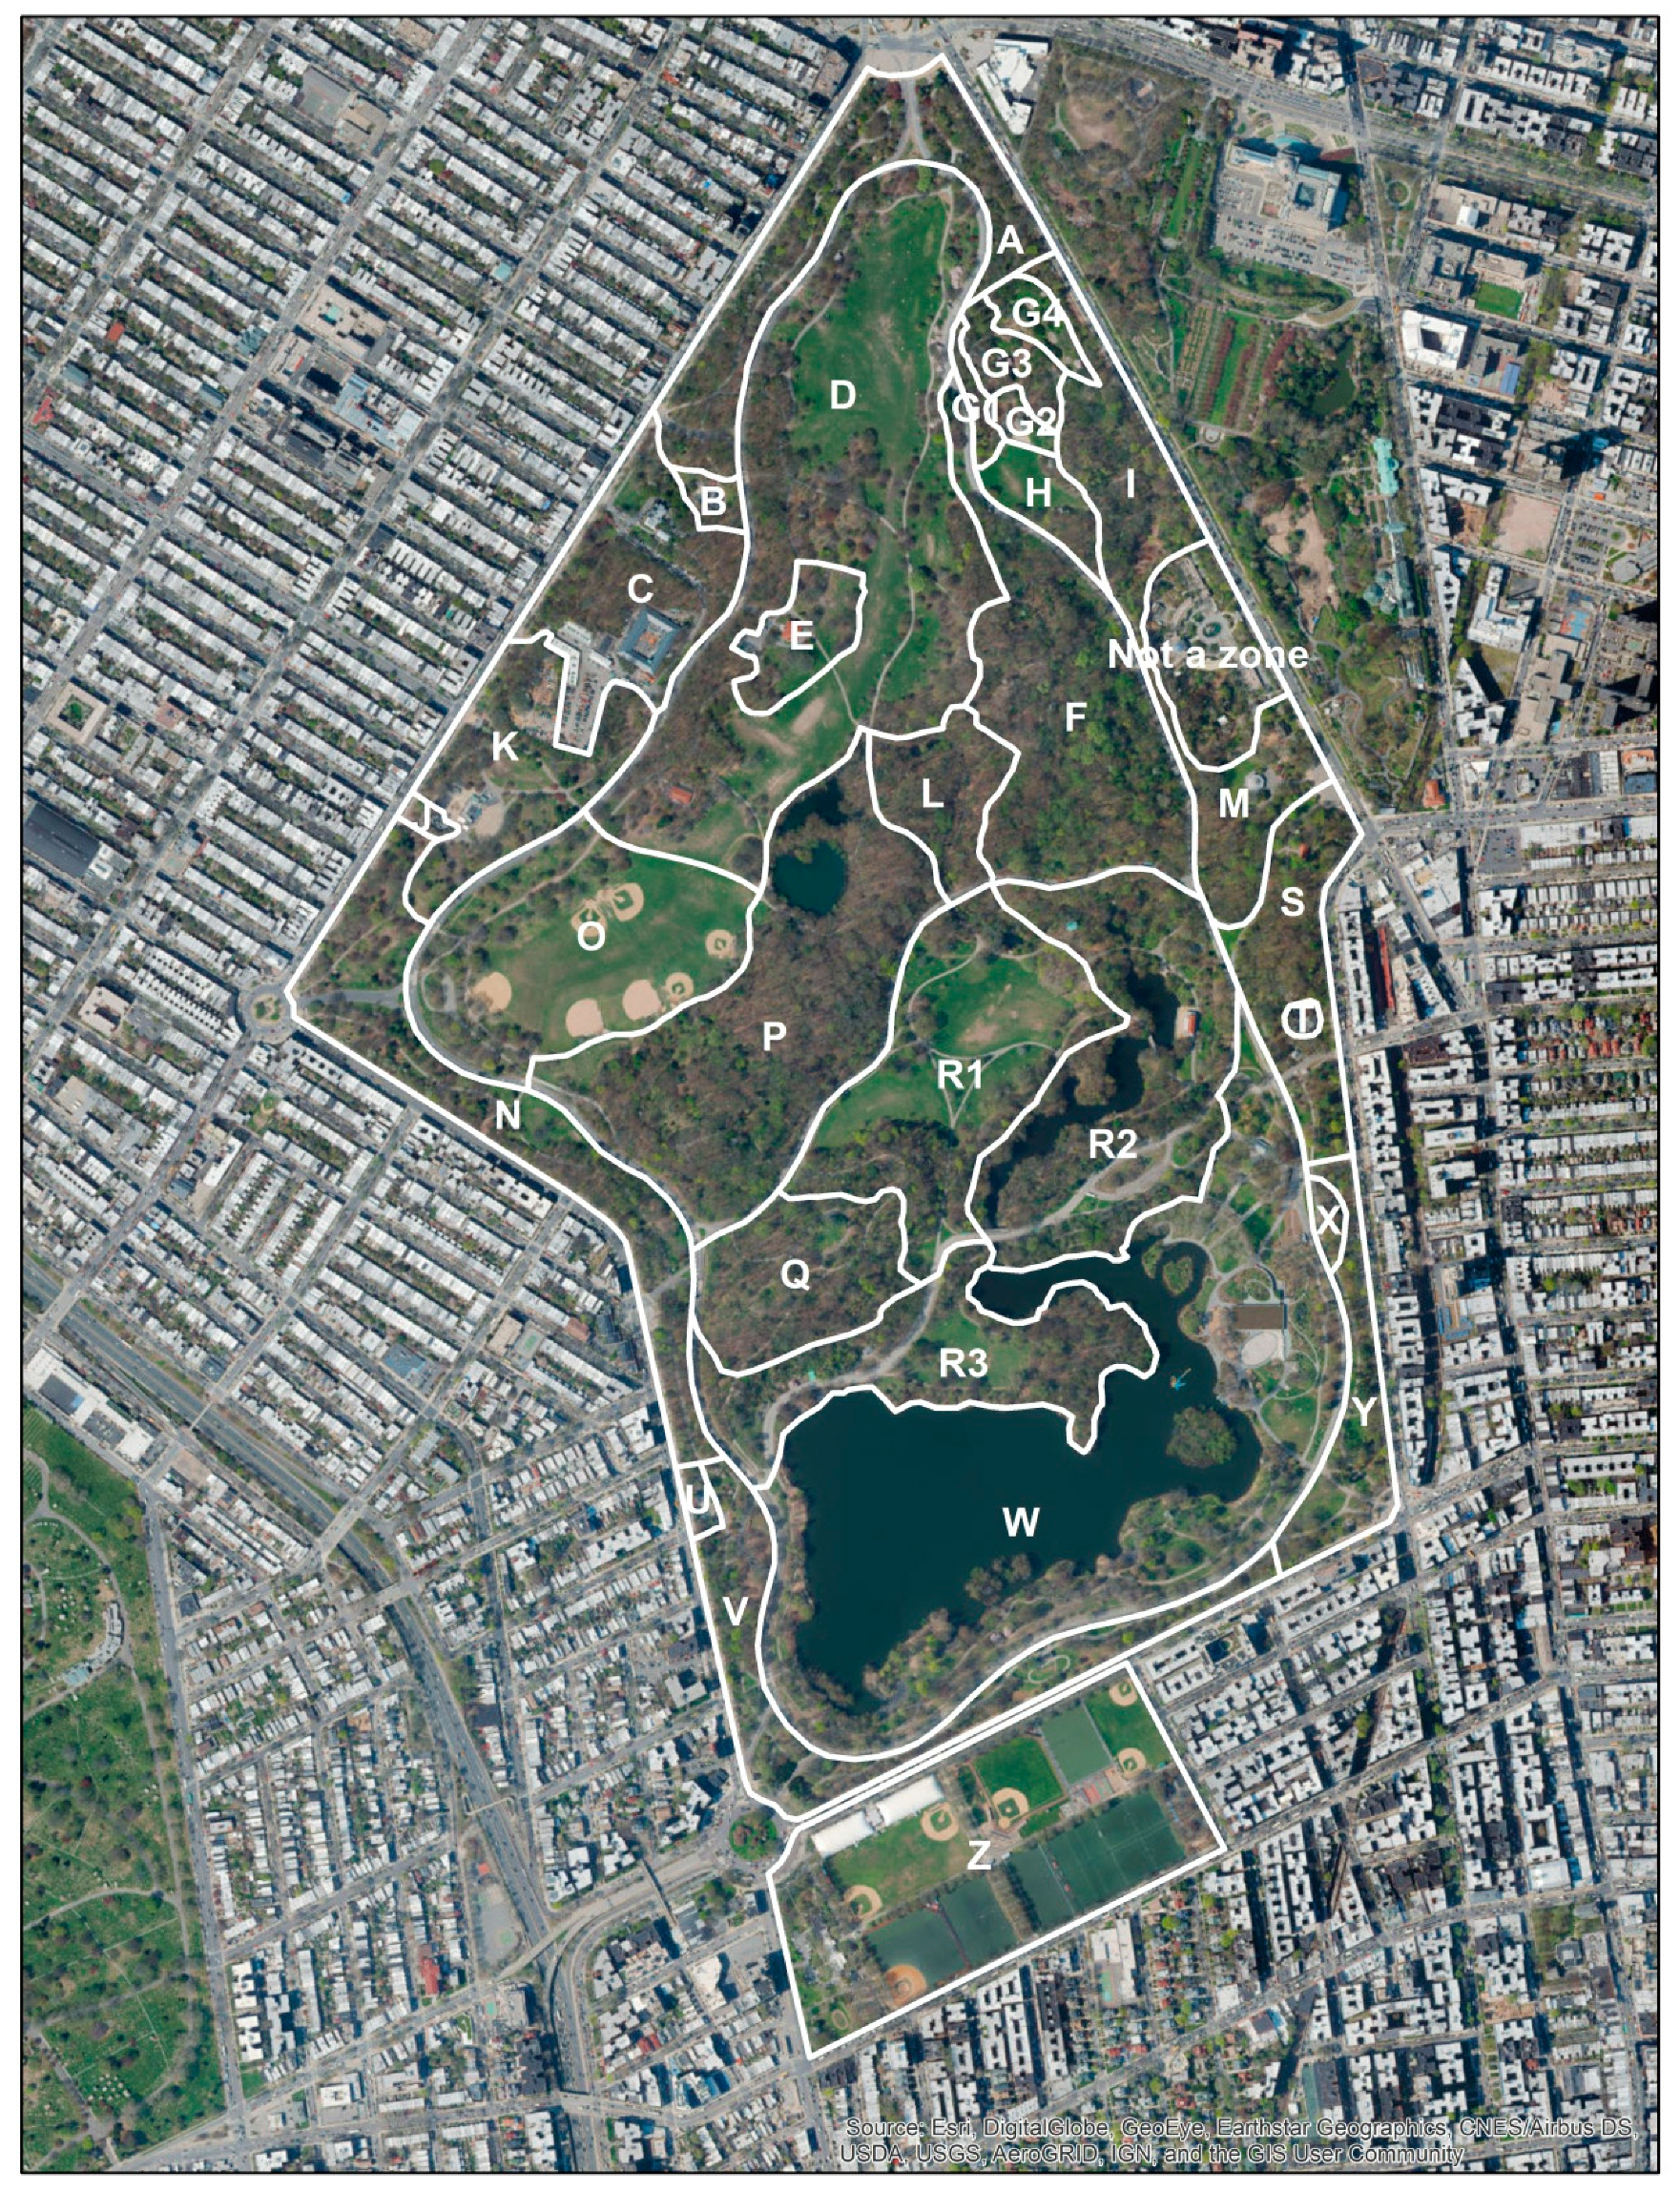
The selected study area was Prospect Park and its nearby surroundings in Brooklyn, New York City (Figure 1). Prospect Park receives over 10 million visitors a year [49]. It is the second-largest park in Brooklyn (526 acres; 213 ha), and, like Central Park, was designed by Frederick Law Olmsted and Calvert Vaux. It serves as Brooklyn’s flagship park and is co-managed by NYC Department of Parks and Recreation (NYC Parks) and the non-profit organization Prospect Park Alliance (PPA). The park contains wooded areas, a 90-acre (36-ha) lake, large open grassy areas, including the Long Meadow, numerous paved trails and a loop road open to bikes, pedestrians, and parks vehicles. Programming in the park is led by NYC Parks and PPA, and includes nature and sports recreation, concerts, and cultural festivals. Informal events coordinated by other organizations regularly make use of the park as a public space, including camps, running, cycling, and exercise clubs, parent groups, and civic organizations.
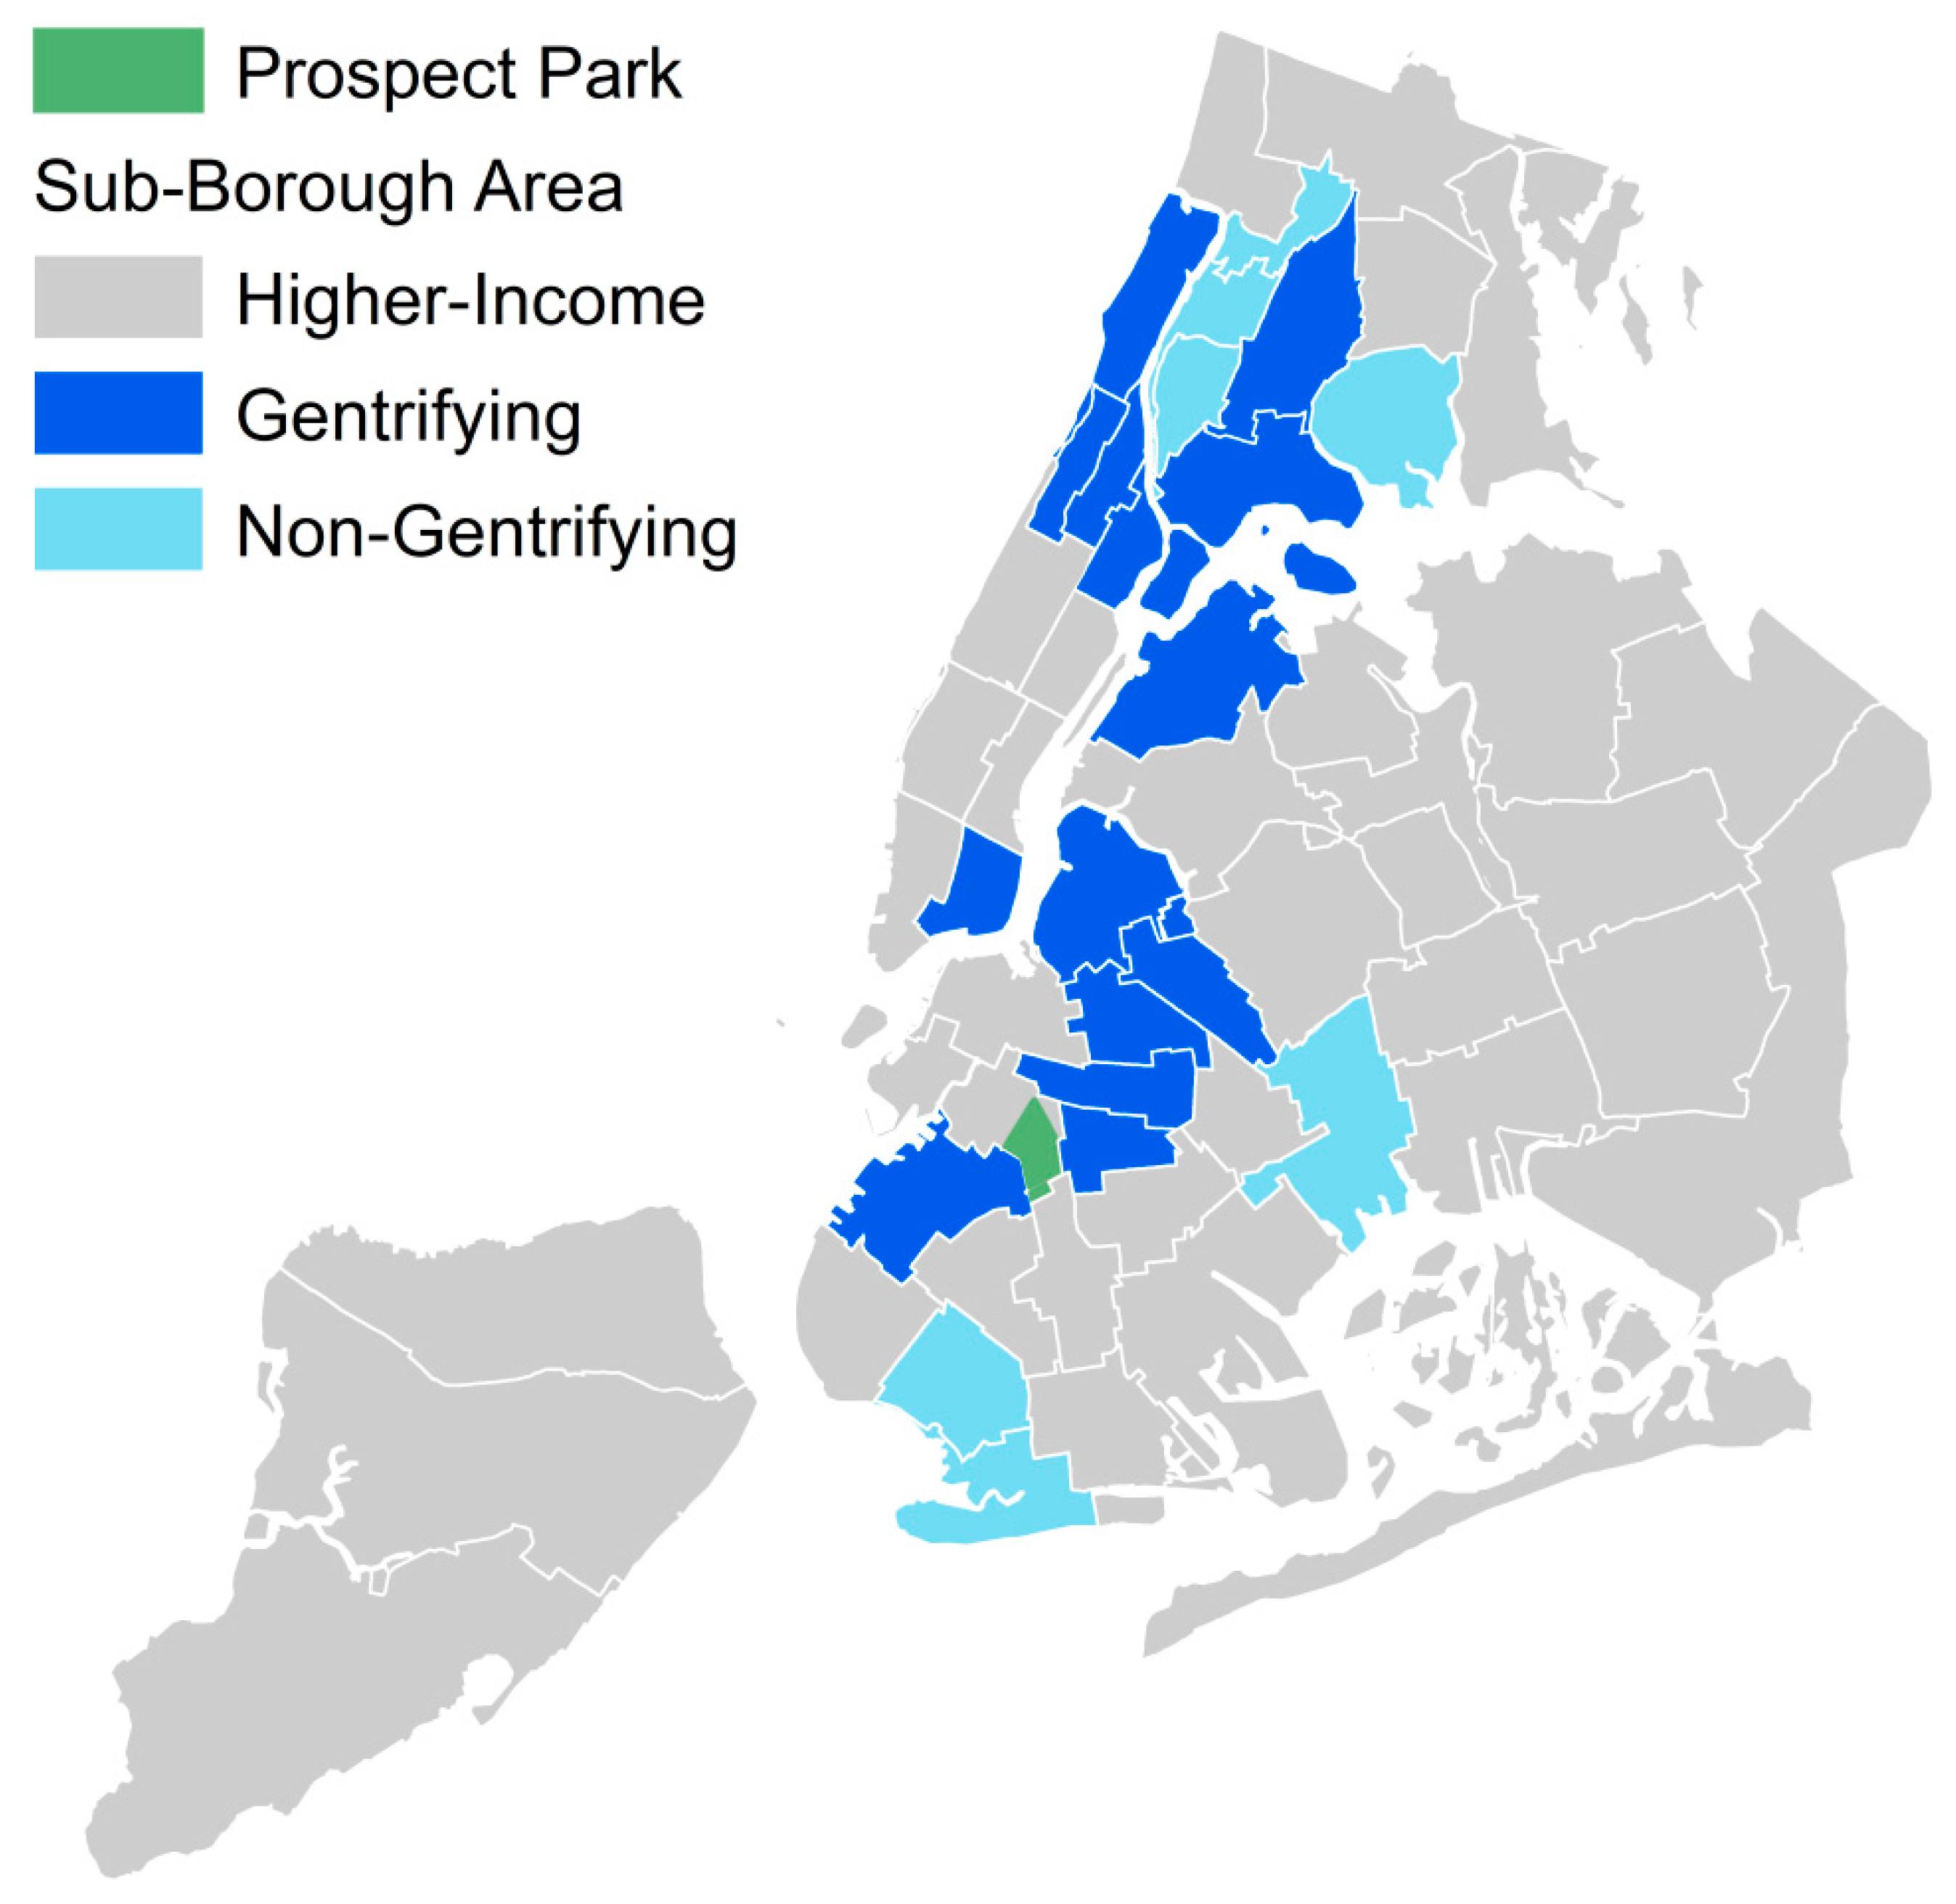
Neighborhoods surrounding Prospect Park are predominantly residential and diverse in race, income, and lifestyle—gentrification and neighborhood turnover has occurred or is occurring in most of these neighborhoods in recent decades (Figure 2, [50]). As CES are co-created between people and their environment [32], this diversity in residents surrounding Prospect Park may influence the diversity of CES present in Prospect Park. Nearby greenspaces include the adjacent Brooklyn Botanic Garden (52 acres; 21 ha), Green-Wood Cemetery (478 acres; 193 ha), and small pocket parks.
2.2. Data Collection
Twitter data were collected from July 29 to August 8, 2016 on a weekly basis. Data were collected using the tweetR package in R version 3.3.3 [51] using both streaming and rest application programming interfaces (APIs) to collect tweets that included the words “Prospect Park” and/or used the Prospect Park Alliance handle “@ProspectPark”. Data were then compiled into a single dataset and duplicate tweets were removed. For analysis, only tweets with geospatial coordinates within 0.5 miles (800 m) of Prospect Park were retained; all tweets lacking geospatial data were excluded.
Interview data were also collected in two ways: in a protocol with a broad, open-ended question (Supplemental Materials, S1) and in a protocol with a direct, open-ended question (Supplemental Materials, S2). In summer 2016, 288 randomized interviews were collected through Prospect Park [5,47], alongside systematic counts of people and their activities over the course of three visits. The 2016 interview protocol included a broad, open-ended question, “Why do you come to Prospect Park today?” and was based on a social assessment protocol used in past studies [47]. In summer 2017, 39 randomized interviews were collected throughout Prospect Park to elicit park benefits. In both instances, interviews were randomized by selecting every third person passing by, or every tenth person in more visited zones of the park. The 2017 interview protocol, with a direct, open-ended question, modified the 2016 interview protocol to specifically elicit park benefits through an open-ended, but directed question (“Does spending time in Prospect Park improve your day or life?”). Interviews also allowed for additional responses beyond specific questions and included other questions about the park. When applying each protocol, researchers conducted rapid interviews, each lasting from two to 10 minutes, with park users throughout the park. Researchers moved through predefined park “zones” at a consistent pace (Figure 1, Table 1). Zones were established prior to data collection by reviewing aerial imagery, discussing with land managers, and visiting the park, to establish sub-areas of the park that could more easily be sampled as a unit than the entire park [47]. A zone was selected by having a uniform land cover / land use (e.g., forest, lawn, playground).
2.3. Data Analysis
Working in EXCEL, individual tweets were qualitatively coded using a combination of deductive and inductive approaches. Tweets were coded on tweet text plus any additional information provided in linked photos or other links (e.g., check-in apps like Foursquare or Instagram). Two researchers, who also collected the interview data, began with a list of the cultural ecosystem services (CES) and associated definitions ([28], Table 2) and developed additional codes specifically relating to park benefits, in addition to the CES (Supplemental Materials, Table S1). Deductive codes included each of the MEA defined cultural ecosystem services [28], with more specific definitions and examples tailored to urban ecosystems, which include social, built, and natural components [52]. In this paper, we consider urban parks as integrated social, built, and natural systems that provide ecosystem services where it is not possible to fully isolate ecological aspects from social and built aspects of the urban ecosystem. Open-ended interview data were also analyzed qualitatively. Tweets and responses to interview questions were coded separately by two different researchers. Initial additional codes were compared and discussed with the larger research team, and discrepancies were examined using an iterative approach until consensus was reached among the coders, thereby enhancing reliability [53]. Interviews were also entered into an EXCEL spreadsheet and coded using the CES codes in Table 1 and any additional emergent codes identified from coding tweets previously (Table S1). For both tweets and interview text, multiple CES codes could be applied to the same text.
We aggregated Twitter and interview results to Prospect Park zones described in Figure 1 and Table 1 [5,47] and mapped the results spatially. We also developed a measure of CES diversity, by calculating the richness (e.g., number of different services) of CES within each zone, for each of the three data collection methods. We also assessed the co-occurrence of pairs of cultural ecosystem services for each of the three data collection methods, to examine the concept of bundling within an urban greenspace setting. In R [51], we ran a pairwise correlation among the three datasets, to identify whether spatial patterns of CES were in agreement across datasets. We then applied the cooccur package [54] in R [51] to the presence of the various CES within each park zone. This method identifies whether the presence/absence of each CES is statistically correlated with the presence/absence of each of the other nine CES considered in this study.
3. Results
3.1. Cultural Ecosystem Services Elicitation
From July 20 to August 8, 2016, 10,406 tweets were initially collected. After only retaining geotagged tweets and removing duplicates (n = 163) and tweets that did not specifically reference the park or outdoor surroundings (n = 72), 451 unique tweets were geotagged within 0.5 miles (0.8 km) of Prospect Park, Brooklyn, and subsequently coded for cultural ecosystem services. For this paper, we focus on the CES results, presented below, although we include emergent codes regarding park benefits in supplemental materials (Table S1). Of retained tweets, many linked to other social media platforms: 10.4% (n = 47) tweets linked to Foursquare Swarm check-ins and 74.3% (n = 335) tweets linked to Instagram photos. Retained geotagged tweets were predominately collected during daylight hours, although several tweets associated with cultural events and social interactions occurred during evening and night hours. Coding of tweets identified the presence of all CES in Prospect Park from the tweet dataset (n = 451). Randomized interviews with broad questions (n = 288) identified 8 out of 10 services, and with directed questions (n = 38) identified 6 out of 10 services (Table 3). For tweets and interview responses, multiple CES could be and were assigned to individual responses.
Tweets tended to be located near certain main entrances and the large, open interior spaces in the park, like the Long Meadow, which affect the spatial patterning and results of the Twitter method. Forested areas of the park had less Twitter activity. While the opportunity exists for full coverage of the park, people did not tweet in all areas of the park. In contrast, the interview methodology allowed for the full coverage of the park through interviewing individuals in each zone of the park. This is particularly evident for the broad interview question dataset where the protocol for a three-day coverage of interviews in each zone enabled coverage of the entire park.
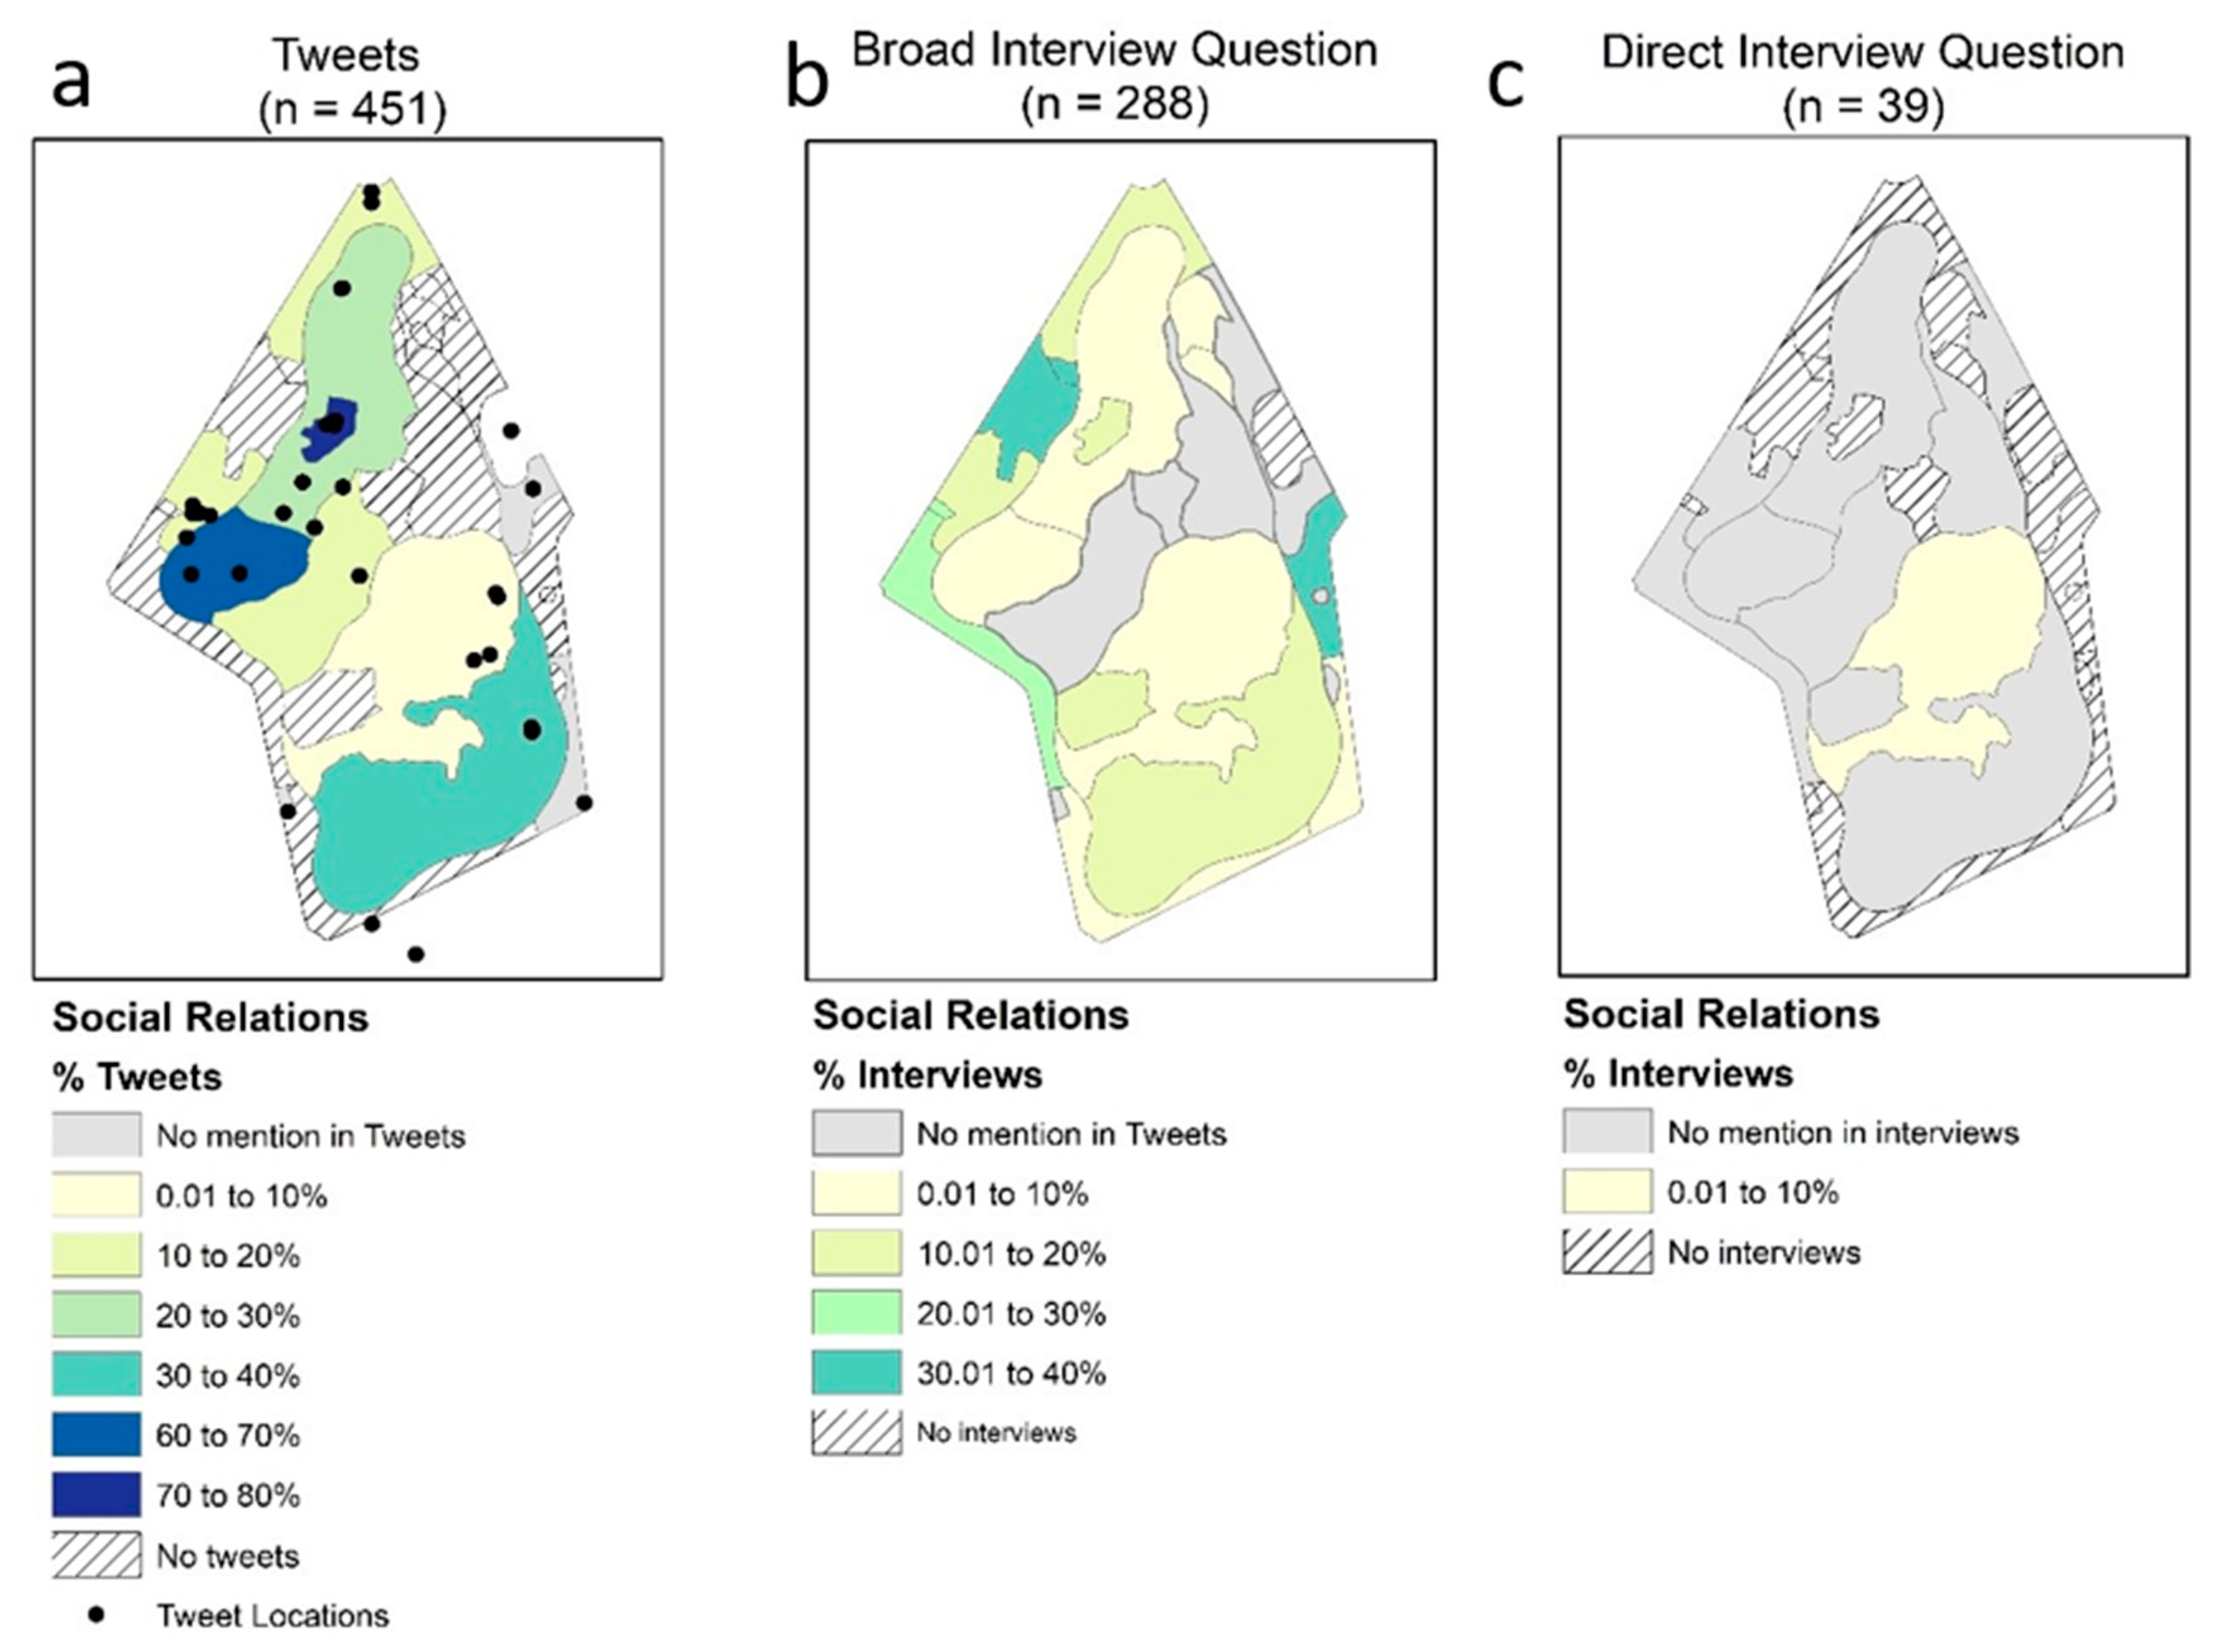
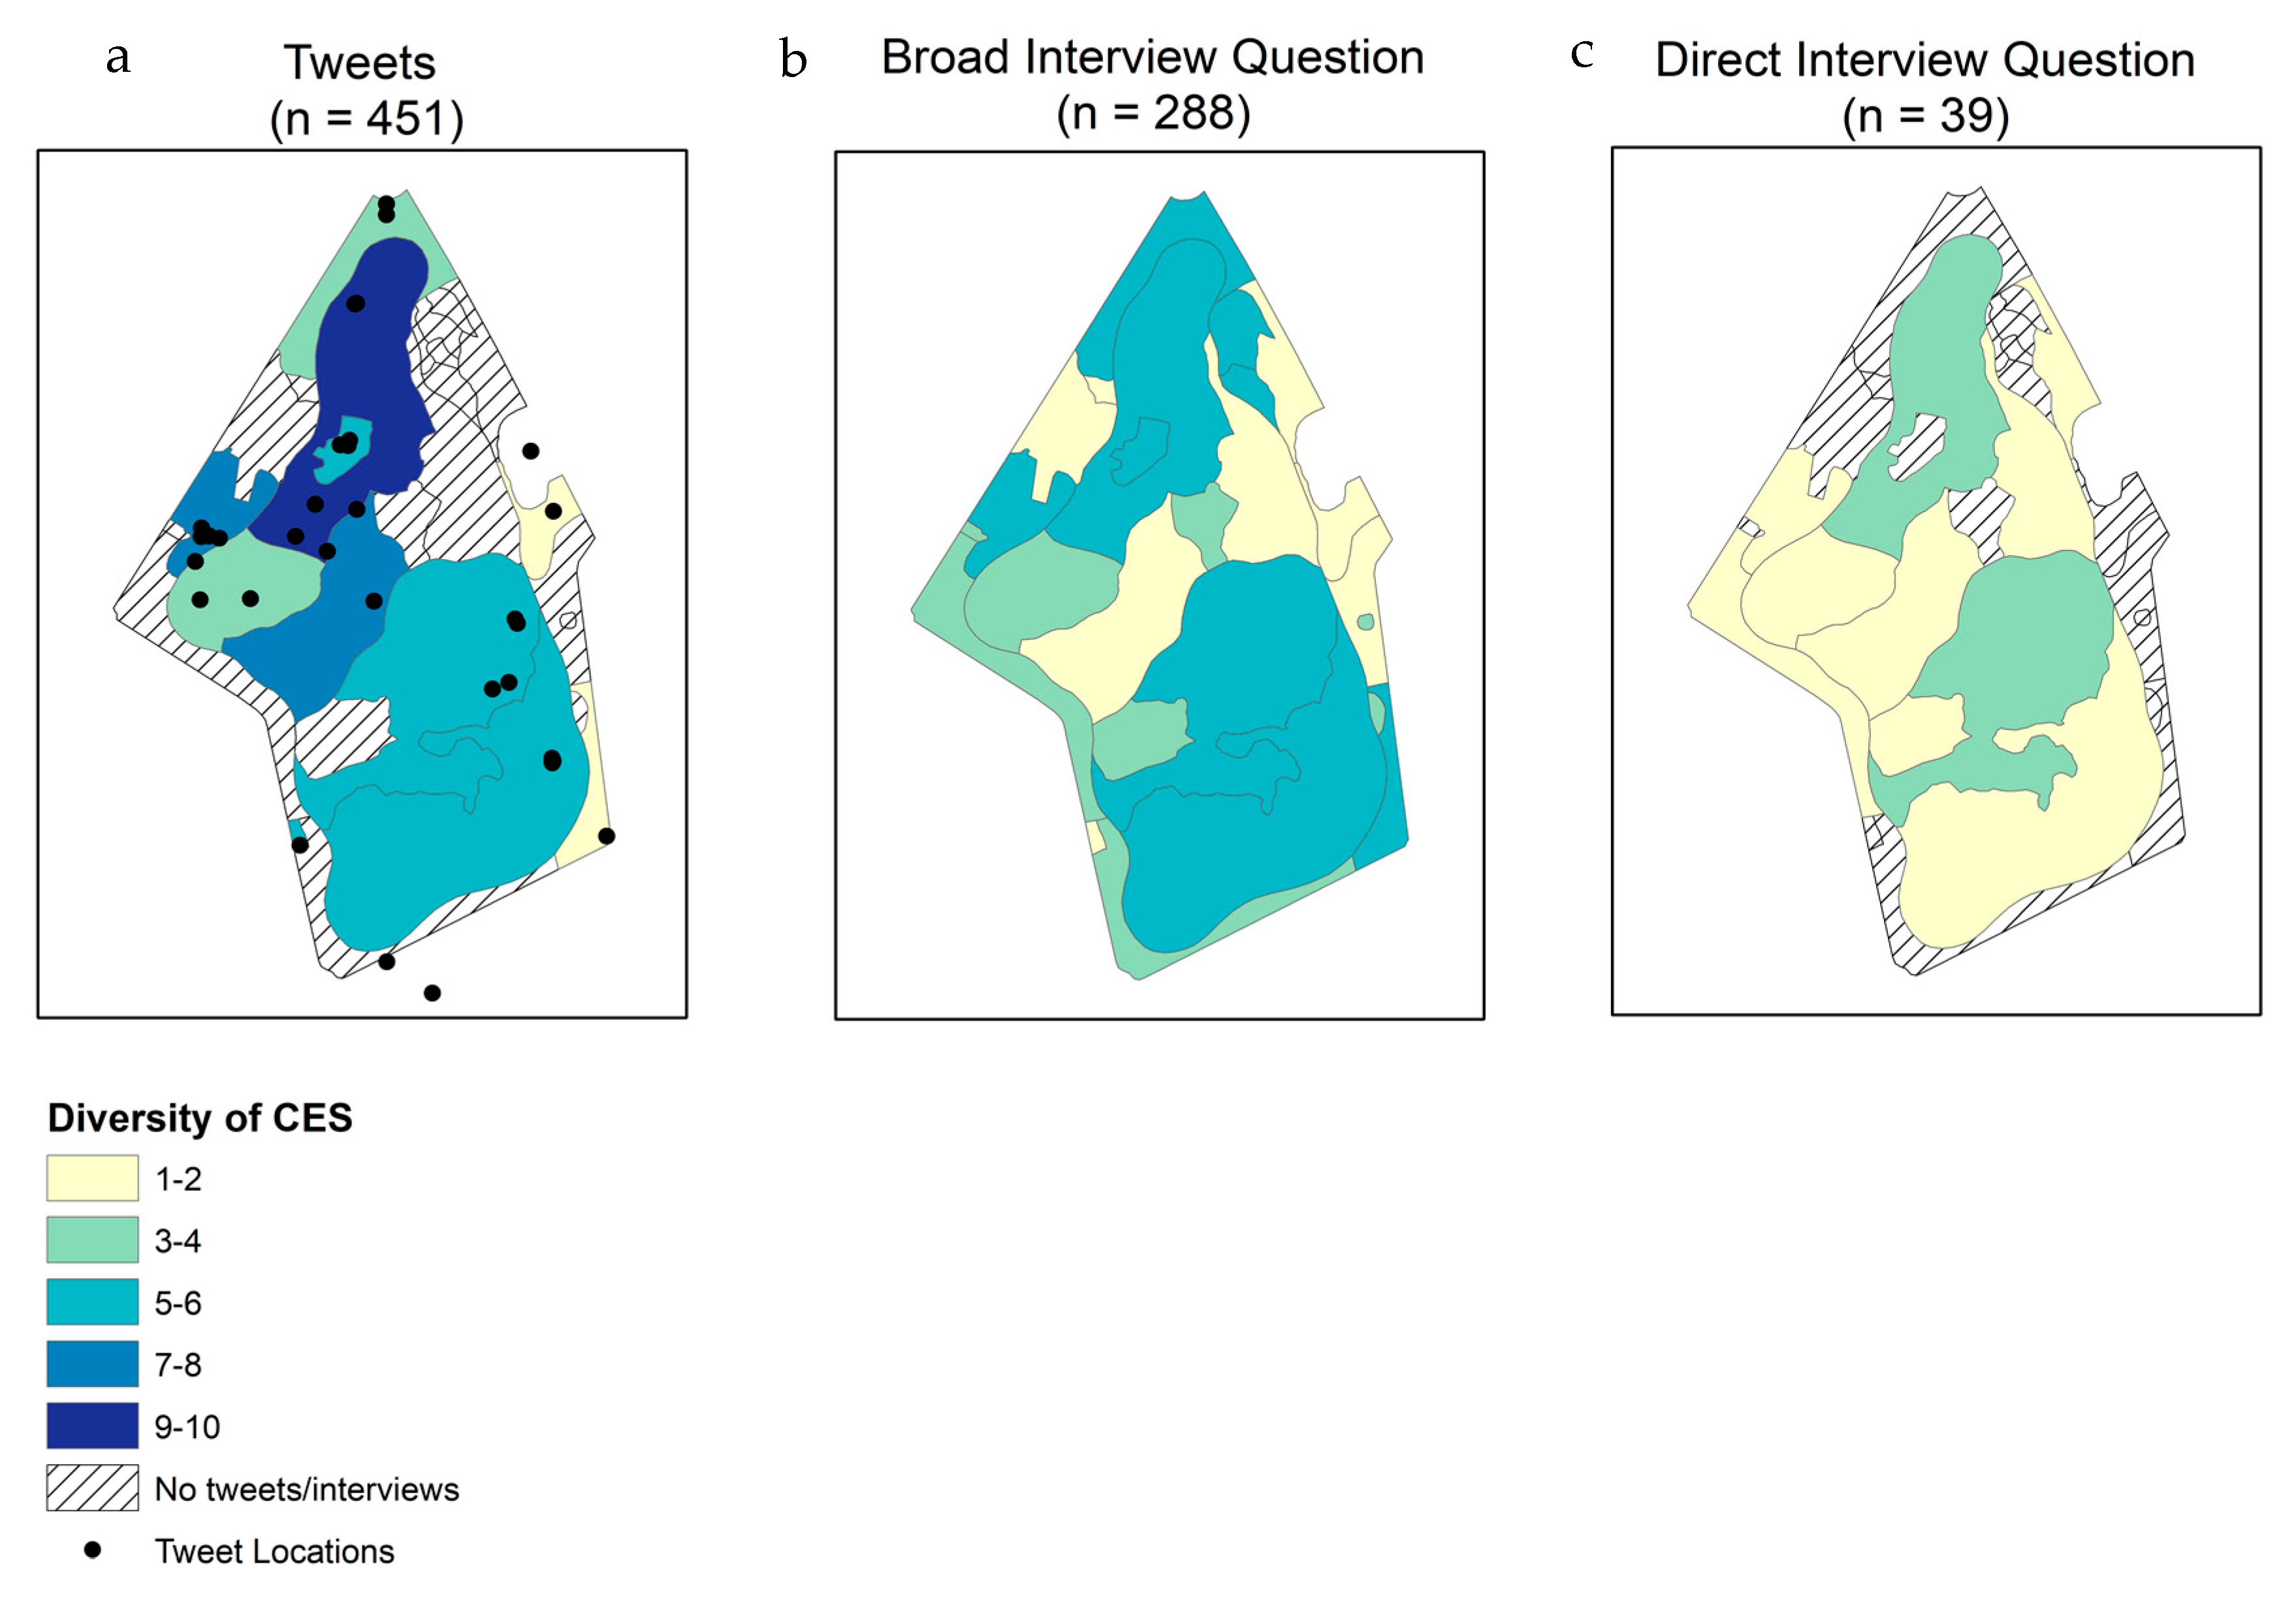
We also mapped the spatial distribution of the tweets, to observe the distribution of CES presence within zones of Prospect Park. In examining correlations of the number of people observed in the park during three days in July 2016 from the social assessment protocol [47] with the number of geotagged tweets collected between July and August 2016, we found a moderate correlation (Pearson’s correlation = 0.46, p = 0.02). With the number of individual zones within Prospect Park, spatial variability among the three methods was high, although some zones with high use (e.g., Long Meadow and Lakeside) had overlaps for all methods by individual CES. In pairwise correlations between counts of each CES by each method, we found no significant correlations, indicating no alignment in the spatial distribution between the interview and social media methods at the zone level. In addition to spatial variability, the three methods captured CES differently. Coded tweets captured all CES, but the directed question was best at eliciting spiritual values (Table 2). We present the most captured CES by Twitter (social relations, Figure 3) and by both broad and directed interview questions (recreation, Figure 4) spatially. We also present the richness of the CES by zone (Figure 5) for each of the methods. Below, we describe results for each of the individual cultural ecosystem services, as defined by the MEA [23].
3.1.1. Aesthetic Values
Aesthetic values were captured by all three methods, with tweets and broad question methods picking up a higher presence of this CES than the directed question (n = 1, 2.6%). Aesthetic values were present for the Long Meadow (zone D) for all three methods, but additionally, they were widely present in meadows and forested areas for tweets. Examples of text coded as aesthetic values are: “Pretty New York City sneaking up on me. @ Prospect Park” (tweet), “Beautiful place to relax, play” (broad interview question), and “yes...enjoy the beauty” (direct interview question).
3.1.2. Cultural Diversity
Cultural diversity was picked up by tweets and in one instance of the broad question; it was not part of the responses from the directed question. Identified tweets covered food and music-based events in Prospect Park, which are ephemeral and less likely to be captured by interviews. For tweets, it was present predominantly in the Long Meadow, Picnic House, Bandshell, and the Lakeside zones (zones D, E, K, and W, respectively). An example of a tweet coded as cultural diversity is a tweet commenting on a hip-hop concert: “Digable Planets: my personal soundtrack for basically all of 1993 (@ Celebrate Brooklyn!/ Prospect Park Bandshell)”.
3.1.3. Cultural Heritage
Cultural heritage was picked up by tweets and by one instance of the broad research question. For the interviews, each time cultural heritage was mentioned in the zone east of the Ravine and south of the natural playground (zone G). For tweets, the center of the park, including the Long Meadow, and the eastern side contained tweets coded as Cultural Heritage. Examples of text coded as cultural heritage are: “Just like Frederick hoped for. #Dawn in the meadow. #fredericklawolmsted #solitude” (tweet), “designed by [sic] central park architect, live here, beautiful and pretty, farmers market” (broad interview question).
3.1.4. Education
Education was infrequently mentioned in tweets and not identified in interview responses. All education focused tweets occurred in the Long Meadow. An example of a snippet of text coded as education is: “yes! on learning good consent @ Prospect Park”.
3.1.5. Inspiration
Like education, inspiration was also infrequently mentioned in tweets and not in interview responses. Inspiration tweets were infrequent and often co-coded with other CES, like spiritual values. Tweets contained inspiration themes were associated with the Long Meadow and the Lakeside portions in the southeastern area of the park. An example of a snippet of text coded as Inspiration (and also Spiritual Values) is: “Let go; let God. #faith @ Prospect Park”.
3.1.6. Knowledge Systems
Knowledge systems were only picked up by one tweet and by one broad question. In both cases, this CES was associated with the Long Meadow zone. An example of a snippet of text coded as a knowledge system is: “I love teaching outdoors; also I am an Herbalist and teach classes about herbs and other edible plants throughout the park (woods)”.
3.1.7. Recreation
Recreation was well identified by all three methods. It was the second most identified CES by tweet and the most identified CES by both types of interview questions. Recreation as a CES was found throughout Prospect Park—in the Long Meadow by all methods, in the ballfields, north entry, and Lakeside areas by tweets and broad questions. Examples of text coded as recreation are: "It’s ok we’re on a skate team." @ Lefrak Center At Lakeside Prospect Park” (tweet), “good place to bike since it’s closed to cars in the morning”. (broad interview question), and “definitely - walking, yoga and meditation, nice to see nature and seasons” (direct interview question).
3.1.8. Sense of Place
Sense of place as a CES was well-identified by the broad question interview responses—occurring in many places throughout the park. Drawing on twitter data, sense of place was identified at the entrances to the park, which raises questions about anticipation or memory as it relates to timing of tweets. For the direct question, the zones to the north of the lake were identified. An example of a snippet of text coded as sense of place are: “Going home (@ Prospect Park - Parkside - @nycparks in Brooklyn, NY)” (tweet), “It’s like my backyard, I’m close by” (broad interview question), and “nice to see fellow Brooklyners and New Yorkers - we are all together” (direct interview question).
3.1.9. Social Relations
‘Social relations’ was the most common theme for tweets and was well identified by the two interview methods. All three methods captured social relations for some of the larger zones of the park, the Long Meadow and Lakeside. The broad question elicited social relations along the edges of the park, which, along with other CESs, raises questions about users and the use of the park in the interior versus the edges. Tweets picked up social relations in the ballfields area and at the picnic house. Examples of text coded as social relations are: “#dadsrusannualcookout @ Prospect Park” (tweet), “friend brought her here - we live close by the park” (broad interview question), and “absolutely, nature, peace, exercise, fellow New Yorkers” (direct interview question).
3.1.10. Spiritual Values
Spiritual values were unique in that they were best elicited by the direct interview question. Tweets that were coded for spiritual values were uncommon—the broad interview question was also able to elicit spiritual values, but to a lesser extent than the direct question. Areas of the park associated with spiritual values were the Lakeside and southwest areas of the park (direct interview question), as well as the Vale of Cashmere (Zone G) in the northeast corner of the park, the Long Meadow, and the north entry to the park (broad interview question). An example of a snippet of text coded as spiritual values are: “Find peace and everything will fall into place. Good morning, Angels. @ Prospect Park” (tweet), “free yourself, meditate, build mind, park of relaxation, find life true nature, observe nature, what is it all about?” (broad interview question), and “think so, likes to walk and get away "clear my mind" (direct interview question).
3.2. Co-occurrence of Cultural Ecosystem Services
In addition to the presence of individual CESs, we also examined whether CESs were likely to co-occur with one another in the same area of space, but across park users. The sample size of the direct interview question (n = 39) limited our ability to reach conclusive results there. For the broad interview question, we found co-occurrences between aesthetic values and recreation (0.443 probability of co-occurrence, p = 0.035) and between aesthetic values and spiritual values (0.296 probability of co-occurrence, p = 0.021). Examining coded tweets, we found a series of overlaps between pairs of CES, suggesting the potential for larger sets of overlaps—however, the probabilities of co-occurrences, while significant, were all relatively low (below 11%, Table 4).
4. Discussion
In this paper, we examined multiple methods of eliciting cultural ecosystem services in urban greenspace in a spatialized fashion, to examine the presence, type, and distribution of CES in Prospect Park, Brooklyn, a flagship urban park located in a large city. Previously, work has focused on mapping cultural ecosystem services through photo-based social media [11,49,55], focus groups [56], participatory Geographic Information Systems (GIS) [43], interviews [34,47], and surveys [8,48]. Here, we add geotagged text-based social media as another method of capturing the presence of CES, specifically in an urban greenspace context. In this study, we found all cultural ecosystem services, as defined by the Millennium Ecosystem Assessment, were to some extent elicited through tweets, although certain types of cultural services, like aesthetics, social relations, and recreation, were better elicited by tweets than other CES. We find tweets both identified multiple CES per tweet and the presence of multiple CES in zones of Prospect Park. This finding supports a recent review that found social media data can reveal CES values’ plural and relational dimensions [57]. Tweets are public messages meant to be shared, with reception of the message read, interpreted, and commented upon by more people than a single interviewer, which may explain some differences between tweets and interviews in the type and proportions of CES elicited.
4.1. Cultural Ecosystem Services in Prospect Park
Previous work in urban parks has found no single experience or meaning of a park space [58]. Our results point to this diversity of experiences, through the identification of multiple CES distributed throughout Prospect Park. The predominant CES identified through our mixed-method research were social relations, recreation, sense of place, aesthetic values, and spiritual values. These results also align with previous field research in Prospect Park, which found a number of park benefits that relate to these concepts, including “appreciating nature/wildlife”, “place to recreate”, “Place to meet friends”, “Place memory”, “Relaxing/tranquil”, but also a mention of “Social diversity” [50]. Low et al. also reference the number of cultural festivals and the diverse people of color present on the east side of the park. We found tweets also identified the presence of cultural diversity and cultural heritage.
Previous work examining photo based social media platforms in European landscapes have also elicited multiple CES: (Recreation; Aesthetic landscape; Scientific and educational; Cultural heritage and identity; Spiritual and religious; and Inspiration) [11] and recreation, cultural heritage, social, and spiritual [59]. Our coding of tweets and associated photos (where present) and interviews find similar CES, but as our work focuses on an urban park in the United States, the underlying resource and the social context are very different.
The CES categories coded in this work align with other research on urban park use and meaning, such as Grahn and Stigsdotter’s perceived sensory dimensions of serene, space, nature, rich in species, refuge, culture, prospect, and social [60]. When directly asked for preferences for natural qualities, the social component was the lowest-ranked dimension in their study. Our work elicited the presence of CES but did not rank them. We found social relations to be one of the most-mentioned CES. Urban park research has pointed to the social aspects of urban greenspaces [61], with parks identified as places of social cohesion and interaction [62]. As CES are co-produced [63], the social context of a particular urban park will affect CES presence, abundance, and preferences. A comparison of urban greenspaces across countries could illuminate whether such social aspects of urban greenspace are specific to a particular park or are universally present.
4.2. Method Comparison of Cultural Ecosystem Services Elicitation in Urban Parks
We found that all CES were to some extent elicited through tweets, demonstrating that text-based social media content can be used to elicit CES presence and abundance in urban parks. Collecting social data through interviews and/or surveys involves a large effort for field-based data collection, whereas social media data can be collected in an automated fashion and more easily over time. We noted a large reduction in geotagged tweets with tweets lacking a spatial location, indicating not all social media users are captured by tweets included in spatial analyses.
We observed tradeoffs between methods of eliciting CES. Crowdsourcing methods, like content analysis of Twitter social media data, offer the opportunity to collect data without potential biases in responses introduced by interactions with an interviewer [64]. However, open-ended content with a character limit does not offer the opportunity for rich textual descriptions of place and relationships with place. Our interviews were rapid and implemented by many individuals, limiting this opportunity as well, but the more directed question appeared to elicit certain CES in a way that the open-ended tweets and broad questions about park experience did not. Spiritual values were better elicited through a directed interview question, suggesting that more in-depth data collection may be needed for such held values. Spirituality is also highly personal, so researchers may not be able to fully recognize the spiritual nature of someone’s tweet, even if the individual was expressing spiritual values. Individuals experiencing spiritual connections may not be likely to share such expressions on social media. Spiritual values are less frequently captured by photos posted on social media [65]. Inspiration, as defined by the MEA, may be co-created in a place, but it also may be asynchronous and be derived after an interaction with a place, through the creation of art, music, or other cultural products. Thus, tweets may not adequately capture such co-created services that have temporal lag, whereas an interview question can refer to much longer times in the past. Additionally, because tweets are public, some social media users may be hesitant to identify negative views, which could introduce bias into preference elicitation.
Three CESs were challenging to elicit from all methods: knowledge systems, education, and cultural heritage. All these CES are created through social interactions, not only by a single individual, yet elicitation methods in this study have focused on individual-based methods. Further work is needed to understand and measure such collectively-generated CES. Richards and Friess have also noted that cultural heritage, like existence value and spiritual values, do not require a physical interaction between place and visitors, so may be infrequently captured by photos posted on social media [65].
4.3. Spatial Patterns of Cultural Ecosystem Services in Urban Parks
Our results suggest that CESs are highly localized, even within a single park. Quantitative analysis did not identify significant correlations in the distribution of CES among methods, although spatial patterns in recreation and CES could be observed for both tweets and the broad interview method. We note that the detailed interview method lacks a sample size to enable a robust spatial comparison. This may be due in part to sample size in at least some of the zones, as well as the population each method drew from, as individuals tweeting were not the same individuals interviewed in the park. This lack of agreement at the zone level suggests that, for some CES, Twitter data can serve as an independent dataset in aggregate, but triangulation with other methods may be advisable when examining fine-scale patterns, to ensure that interpretations of the data are conservative, replicable, and valid. Even with the aggregation of specific point locations from Twitter data to larger zones used in the interviews, we still see this lack of agreement. Our findings regarding triangulation align with previous research of CES that recommends mixed-method approaches in both spatial (Brown [43]) and aspatial (Church [33]) contexts. Both land use land cover and edge/interior locations in a park qualitatively appear to interact with elicited CES, whereby (1) open areas, sports-focused areas, and forested areas show variation in the presence and distribution of CES and (2) interior locations have higher abundances of CES than park edges. This may be because of variation in the environment, but also variation in access, who is using what part of the park, and when a person uses social media (i.e., during or after an experience). Observing the distribution of tweets, they occurred primarily in the interior of the park or at certain entrances to the park. With most geotagged tweets linking to specific park images and/or social media check-ins (76.7%), we have confidence that most geotagged tweets in the study are deliberately tagged to a specific location. Less understood is what motivates social media users to post tweets in the location they select—future work could explore this through focus groups or surveys. Sub-park level resolution is useful for within park management but can also be aggregated to the park level for cross-park comparison. Our findings highlight potential new directions to advance CES mapping, whereby CES can be assessed at multiple spatial scales, by park location, and in interaction with other variables available as GIS datasets, such as land use/land cover.
This work also finds some support for CES bundling occurring in an urban park setting and builds on the work of Plieninger et al., Bertram and Rehdanz, and Rall et al. [8,39,48]. We identified correlations between aesthetic values and both recreation and spiritual values when examining two separate datasets, suggesting a co-occurrence of these CES. This may suggest managing for one type of CES can simultaneously provide other, separate CES.
4.4. Towards Method Building
Our work suggests tradeoffs in each type of method. Rapid interviews were better at capturing both spiritual and recreation values, while tweets captured the full range of CES. Because tweets and other social media datasets are easier to collect over longer periods, they appear better at capturing cultural diversity and cultural heritage occurring in an urban park setting, particularly as related to specific cultural events and programming. The nature of tweets also tends to refer to specific moments or events, whereas interview responses which often generalize across multiple experiences in a park. In comparing directed and broad questions, directed questions may capture CESs more valued or prioritized by interviewees, while open questions and tweets may better capture the diversity of CES. Directed questions also captured well-being in addition to CES (see Table S1), likely because of the core framing of the question. The inclusion of such questions in future work would allow for a better understanding of the linkages between CES and well-being.
Twitter data and rapid interviews as data collection methods offer differences in time investment and the ability and need to evaluate data for reliability and validity. The collection of interview data requires field visits and staff, whereas social media datasets can be collected in an automated fashion using software scripts. The coding of rapid interview texts is similar in effort to coding social media text due to the brief nature of each—more in-depth interviews would provide greater context and understanding of CES, but would require even more field work time, as well as coding time per individual interview. At the same time, the larger number of social media data points requires a larger coding effort, with some texts being ambiguous. We did find most geotagged tweets (76.7%) in our study to reference other social media and/or include photographs, which offered more context for interpreting individual tweets. We also found the text associated with these more visual media provided useful context for interpreting why a photo was selected. Interview data, because they are collected in a randomized fashion, ensure the population represented is that of all park users within a window of time. With social media data, the population represented is social media users that visit parks. However, social media users are rapidly increasing—70% of urban dwellers make use of social media in the United States [66].
For our analyses, we applied more intensive manual coding approaches, however, with classification approaches and associated validation, this methodology could be automated and subsequently scaled to larger social media datasets [67,68]. Going forward, intensive methods like focus groups or interviews could be used to calibrate a social media dataset to either derive codes or validate codes and patterns in the data.
Examining CES in relationship to park user characteristics is a critical next step in understanding the co-production of CES in urban parks. Previously, gender and age [69] and activity type [70] were found to affect CES preferences. Understanding these relationships between demographics and CES could be created through an increased understanding of the demographics of social media users or through examining interview results in relation with demographic data, including race/ethnicity, income, and educational level. Additional relationships between CES and individuals’ characteristics like familiarity with technology should also be examined.
We suggest that the triangulation of social media text analysis with other methods could allow for the representation of all cultural ecosystem services as well as a deeper understanding of more difficult to capture held values [62]. Understanding such values is critical for supporting management approaches that meet urban residents’ needs [68]. At the same time, there are limitations to methods focused solely on elicitation. Lacking the ability to elicit preference and prioritization, such as through freelist rankings [56], social media data enable us to see where on the landscape CES are co-produced, but not the extent to which these CESs matter to city dwellers.
5. Conclusions
While this study focused on a single urban park, our work has implications for future research and monitoring of urban park benefits. Our comparison of tweets and rapid interview texts identified tradeoffs and synergies between elicitation methods. Future work could examine photographs and automated measures of CES presence against manually coded qualitative datasets, to examine how such a method could be automated to extend across larger spatial and temporal scales. Such scaling up of this study could allow for the identification of generalizable patterns of CES across urban greenspaces in a park system or across cities. Such data would enable researchers to better understand the co-production of CES in urban green spaces and enable management for socio-cultural benefits of urban green spaces. Additionally, examining CES in relationship to demographics of park users is a critical next step in understanding the co-production of CES in urban parks, as the diversity of individuals’ experiences and values shape how they interact with a place. Given the uneven nature of social media use, even in cities where its use is highest, triangulation with interview data may be a creative and productive solution to expand our understanding of the distribution of CES in urban green spaces across space and time.
Supplementary Materials
The following are available online at https://www.mdpi.com/2071-1050/11/21/6137/s1, Table S1: Emergent themes, as open coded from geotagged tweets and broad and directed questions for Prospect Park, Brooklyn, S 1: Broad Question Protocol, S 2: Directed Question Protocol.
Author Contributions
Conceptualization, M.L.J., L.K.C., E.S.S. and H.L.M.; Formal analysis, M.L.J. and L.K.C.; Investigation, M.L.J. and E.S.S.; Methodology, M.L.J., L.K.C., E.S.S. and H.L.M.; Project administration, M.L.J.; Visualization, M.L.J.; Writing – original draft, M.L.J.; Writing – review & editing, L.K.C., E.S.S. and H.L.M.
Funding
This research received no external funding.
Acknowledgments
We thank NYC Urban Field Station intern Charlotte Strickland and The Nature Conservancy’s Healthy Trees, Healthy Cities program, for their assistance with data collection and analysis. We also thank Prospect Park Alliance staff, including Sue Donoghue, Christian Zimmerman, and Susan Sharer, and NYC Parks and the Natural Area Conservancy for their collaboration and support of the social assessment.
Conflicts of Interest
The authors declare no conflict of interest.
References
- Smith, L.M.; Case, J.L.; Smith, H.M.; Harwell, L.C.; Summers, J.K. Relating ecosystem services to domains of human well-being: Foundation for a US index. Ecol. Indic. 2013, 28, 79–90. [Google Scholar] [CrossRef]
- Larson, L.R.; Jennings, V.; Cloutier, S.A. Public parks and wellbeing in urban areas of the United States. PLoS ONE 2016, 11, e0153211. [Google Scholar] [CrossRef]
- Svendsen, E.S.; Campbell, L.K.; McMillen, H.L. Stories, shrines, and symbols: Recognizing psycho-social-spiritual benefits of urban parks and natural areas. J. Ethnobiol. 2016, 36, 881–908. [Google Scholar] [CrossRef]
- Grose, M.J. Changing relationships in public open space and private open space in suburbs in south-western Australia. Landsc. Urban Plan. 2009, 92, 53–63. [Google Scholar] [CrossRef]
- Campbell, L.K.; Svendsen, E.S.; Sonti, N.F.; Johnson, M.L. A social assessment of urban parkland: Analyzing park use and meaning to inform management and resilience planning. Environ. Sci. Policy 2016, 62, 34–44. [Google Scholar] [CrossRef]
- Haase, D.; Frantzeskaki, N.; Elmqvist, T. Ecosystem services in urban landscapes: Practical applications and governance implications. Ambio 2014, 43, 407–412. [Google Scholar] [CrossRef] [PubMed]
- Plieninger, T.; Bieling, C.; Fagerholm, N.; Byg, A.; Hartel, T.; Hurley, P.; López-Santiago, C.A.; Nagabhatla, N.; Oteros-Rozas, E.; Raymond, C.M.; et al. The role of cultural ecosystem services in landscape management and planning. Curr. Opin. Environ. Sustain. 2015, 14, 28–33. [Google Scholar] [CrossRef] [Green Version]
- Bertram, C.; Rehdanz, K. The role of urban green space for human well-being. Ecol. Econ. 2015, 120, 139–152. [Google Scholar] [CrossRef] [Green Version]
- Kabisch, N.; Qureshi, S.; Haase, D. Human–environment interactions in urban green spaces—A systematic review of contemporary issues and prospects for future research. Environ. Impact Assess. Rev. 2015, 50, 25–34. [Google Scholar] [CrossRef]
- Hamstead, Z.A.; Fisher, D.; Ilieva, R.T.; Wood, S.A.; McPhearson TKremer, P. Geolocated social media as a rapid indicator of park visitation and equitable park access. Comput. Environ. Urban Syst. 2018, 72, 38–50. [Google Scholar] [CrossRef]
- Clemente, P.; Calvache, M.; Antunes, P.; Santos, R.; Cerdeira, J.O.; Martins, M.J. Combining social media photographs and species distribution models to map cultural ecosystem services: The case of a Natural Park in Portugal. Ecol. Indic. 2019, 96, 59–68. [Google Scholar] [CrossRef]
- Mayr, P.; Weller, K. Think before you collect: Setting up a data collection approach for social media studies. In The SAGE Handbook of Social Media Research Methods; SAGE: Thousand Oaks, CA, USA, 2017; p. 107. [Google Scholar]
- Mitchell, L.; Frank, M.R.; Harris, K.D.; Dodds, P.S.; Danforth, C.M. The geography of happiness: Connecting twitter sentiment and expression, demographics, and objective characteristics of place. PLoS ONE 2013, 8, e64417. [Google Scholar] [CrossRef] [PubMed]
- Liu, J.; Li, J.; Li, W.; Wu, J. Rethinking big data: A review on the data quality and usage issues. ISPRS J. Photogramm. Remote Sens. 2016, 115, 134–142. [Google Scholar] [CrossRef]
- Bickman, L.; Rog, D.J. (Eds.) The SAGE Handbook of Applied Social Research Methods; Sage Publications: Thousand Oaks, CA, USA, 2008. [Google Scholar]
- Vaske, J.J. Survey Research and Analysis: Applications in Parks, Recreation and Human Dimensions; Venture Pub: Glossop, UK, 2008. [Google Scholar]
- Ruths, D.; Pfeffer, J. Social media for large studies of behavior. Science 2014, 346, 1063–1064. [Google Scholar] [CrossRef]
- Malik, M.M.; Lamba, H.; Nakos, C.; Pfeffer, J. Population bias in geotagged tweets. In Proceedings of the Ninth International AAAI Conference on Web and Social Media, Oxford, UK, 26–29 May 2015. [Google Scholar]
- Boy, J.D.; Uitermark, J. How to study the city on Instagram. PLoS ONE 2016, 11, e0158161. [Google Scholar] [CrossRef]
- Tenkanen, H.; Di Minin, E.; Heikinheimo, V.; Hausmann, A.; Herbst, M.; Kajala, L.; Toivonen, T. Instagram, Flickr, or Twitter: Assessing the usability of social media data for visitor monitoring in protected areas. Sci. Rep. 2017, 7, 17615. [Google Scholar] [CrossRef]
- Roberts, H.V. Using Twitter data in urban green space research: A case study and critical evaluation. Appl. Geogr. 2017, 81, 13–20. [Google Scholar] [CrossRef]
- Kovacs-Györi, A.; Ristea, A.; Kolcsar, R.; Resch, B.; Crivellari, A.; Blaschke, T. Beyond spatial proximity—Classifying parks and their visitors in London based on spatiotemporal and sentiment analysis of Twitter data. Int. J. Geo-Inf. 2018, 7, 378. [Google Scholar] [CrossRef]
- Millenium Ecosystem Assessment (MEA). Ecosystems and Human Well-Being: Synthesis; Island Press: Washington, DC, USA, 2005. [Google Scholar]
- Tratalos, J.A.; Haines-Young, R.; Potschin, M.; Fish, R.; Church, A. Cultural ecosystem services in the UK: Lessons on designing indicators to inform management and policy. Ecol. Indic. 2016, 61, 63–73. [Google Scholar] [CrossRef] [Green Version]
- Haines-Young, R.; Potschin, M. Common International Classification of Ecosystem Services (CICES): Consultation on Version 4, August-December 2012, EEA Framework Contract No EEA/IEA/09/003. 2013.
- Fischer, A.; Eastwood, A. Coproduction of ecosystem services as human–nature interactions—An analytical framework. Land Use Policy 2016, 52, 41–50. [Google Scholar] [CrossRef]
- Blicharska, M.; Smithers, R.J.; Hedblom, M.; Hedenås, H.; Mikusiński, G.; Pedersen, E.; Sandström, P.; Svensson, J. Shades of grey challenge practical application of the cultural ecosystem services concept. Ecosyst. Serv. 2017, 23, 55–70. [Google Scholar] [CrossRef]
- Chan, K.M.; Balvanera, P.; Benessaiah, K.; Chapman, M.; Díaz, S.; Gómez-Baggethun, E.; Gould, R.; Hannahs, N.; Jax, K.; Klain, S.; et al. Opinion: Why protect nature? Rethinking values and the environment. Proc. Natl. Acad. Sci. USA 2016, 113, 1462–1465. [Google Scholar] [CrossRef] [PubMed]
- Rawluk, A.; Ford, R.; Anderson, N.; Williams, K. Exploring multiple dimensions of values and valuing: A conceptual framework for mapping and translating values for social-ecological research and practice. Sustain. Sci. 2019, 14, 1–14. [Google Scholar] [CrossRef]
- Díaz, S.; Pascual, U.; Stenseke, M.; Martín-López, B.; Watson, R.T.; Molnár, Z.; Hill, R.; Chan, K.M.; Baste, I.A.; Brauman, K.A.; et al. Assessing nature’s contributions to people. Science 2018, 359, 270–272. [Google Scholar] [CrossRef] [PubMed]
- Pascua, P.A.; McMillen, H.; Ticktin, T.; Vaughan, M.; Winter, K.B. Beyond services: A process and framework to incorporate cultural, genealogical, place-based, and indigenous relationships in ecosystem service assessments. Ecosyst. Serv. 2017, 26, 465–475. [Google Scholar] [CrossRef]
- Pröpper, M.; Haupts, F. The culturality of ecosystem services. Emphasizing process and transformation. Ecol. Econ. 2014, 108, 28–35. [Google Scholar] [CrossRef]
- Choudhry, K.Z.; Coles, R.; Qureshi, S.; Ashford, R.; Khan, S.; Mir, R.R. A review of methodologies used in studies investigating human behaviour as determinant of outcome for exposure to ‘naturalistic and urban environments’. Urban For. Urban Green. 2015, 14, 527–537. [Google Scholar] [CrossRef]
- Church, A.; Fish, R.; Haines-Young, R.; Mourato, S.; Tratalos, J.; Stapleton, L.; Willis, C. UK National Ecosystem Assessment Follow-On; 2014. Work Package Report 5: Cultural ecosystem services and indicators; UNEP-WCMC: Cambridge, UK; LWEC: Naperville, IL, USA.
- Gould, R.K.; Klain, S.C.; Ardoin, N.M.; Satterfield, T.; Woodside, U.; Hannahs, N.; Daily, G.C.; Chan, K.M. A protocol for eliciting nonmaterial values through a cultural ecosystem services frame. Conserv. Biol. 2015, 29, 575–586. [Google Scholar] [CrossRef]
- Bieling, C.; Plieninger, T.; Pirker, H.; Vogl, C.R. Linkages between landscapes and human well-being: An empirical exploration with short interviews. Ecol. Econ. 2014, 105, 19–30. [Google Scholar] [CrossRef] [Green Version]
- Hauck, J.; Görg, C.; Varjopuro, R.; Ratamäki, O.; Maes, J.; Wittmer, H.; Jax, K. “Maps have an air of authority”: Potential benefits and challenges of ecosystem service maps at different levels of decision making. Ecosyst. Serv. 2013, 4, 25–32. [Google Scholar] [CrossRef]
- Queiroz, C.; Meacham, M.; Richter, K.; Norstrom, A.V.; Andersson, E.; Norberg, J.; Peterson, G. Mapping bundles of ecosystem services reveals distinct types of multifunctionality within a Swedish landscape. Ambio 2015, 44, 89–101. [Google Scholar] [CrossRef] [PubMed] [Green Version]
- Allan, J.D.; Smith, S.D.; McIntyre, P.B.; Joseph, C.A.; Dickinson, C.E.; Marino, A.L.; Biel, R.G.; Olson, J.C.; Doran, P.J.; Rutherford, E.S.; et al. Using cultural ecosystem services to inform restoration priorities in the Laurentian Great Lakes. Front. Ecol. Environ. 2015, 13, 418–424. [Google Scholar] [CrossRef] [Green Version]
- Plieninger, T.; Dijks, S.; Oteros-Rozas, E.; Bieling, C. Assessing, mapping, and quantifying cultural ecosystem services at community level. Land Use Policy 2013, 33, 118–129. [Google Scholar] [CrossRef] [Green Version]
- Jones, L.; Norton, L.; Austin, Z.; Browne, A.L.; Donovan, D.; Emmett, B.A.; Grabowski, Z.J.; Howard, D.C.; Jones, J.P.G.; Kenter, J.O.; et al. Stocks and flows of natural and human-derived capital in ecosystem services. Land Use Policy 2016, 52, 151–162. [Google Scholar] [CrossRef]
- Dickinson, D.C.; Hobbs, R.J. Cultural ecosystem services: Characteristics, challenges and lessons for urban green space research. Ecosyst. Serv. 2017, 25, 179–194. [Google Scholar] [CrossRef]
- Brown, G.; Donovan, S.; Pullar, D.; Pocewicz, A.; Toohey, R.; Ballesteros-Lopez, R. An empirical evaluation of workshop versus survey PPGIS methods. Appl. Geogr. 2014, 48, 42–51. [Google Scholar] [CrossRef]
- Brown, G.; Strickland-Munro, J.; Kobryn, H.; Moore, S.A. Mixed methods participatory GIS: An evaluation of the validity of qualitative and quantitative mapping methods. Appl. Geogr. 2017, 79, 153–166. [Google Scholar] [CrossRef]
- Klain, S.C.; Satterfield, T.A.; Chan, K.M. What matters and why? Ecosystem services and their bundled qualities. Ecol. Econ. 2014, 107, 310–320. [Google Scholar] [CrossRef]
- Riechers, M.; Barkmann, J.; Tscharntke, T. Diverging perceptions by social groups on cultural ecosystem services provided by urban green. Landsc. Urban Plan. 2018, 175, 161–168. [Google Scholar] [CrossRef]
- Raudsepp-Hearne, C.; Peterson, G.D.; Bennett, E.M. Ecosystem service bundles for analyzing tradeoffs in diverse landscapes. Proc. Natl. Acad. Sci. USA 2010, 107, 5242–5247. [Google Scholar] [CrossRef] [Green Version]
- Rall, E.; Bieling, C.; Zytynska, S.; Haase, D. Exploring city-wide patterns of cultural ecosystem service perceptions and use. Ecol. Indic. 2017, 77, 80–95. [Google Scholar] [CrossRef]
- Prospect Park Alliance. Prospect Park Alliance Website. 2019. Available online: https://www.prospectpark.org/learn-more/ (accessed on 3 March 2019).
- Richards, D.R.; Tunçer, B. Using image recognition to automate assessment of cultural ecosystem services from social media photographs. Ecosyst. Serv. 2018, 31, 318–325. [Google Scholar] [CrossRef]
- R Core Team. R: A Language and Environment for Statistical Computting; R Foundation for Statistical Computing: Vienna, Austria, 2017; Available online: https://www. R-project.org (accessed on 3 July 2016).
- Machlis, G.E.; Force, J.E.; Burch, W.R. The human ecosystem. 1. The human ecosystem as an organizing concept in ecosystem management. Soc. Nat. Resour. 1997, 10, 347–367. [Google Scholar] [CrossRef]
- Neuman, W.L. Social Research Methods: Qualitative and Quantitative Approaches, 5th ed.; Allyn and Bacon: Boston, MA, USA, 2003. [Google Scholar]
- Griffith, D.M.; Veech, J.A.; Marsh, C.J. Cooccur: Probabilistic species co-occurrence analysis in R. J. Stat. Softw. 2016, 69, 1–17. [Google Scholar] [CrossRef]
- Cerveny, L.K.; Biedenweg, K.; McLain, R. Mapping meaningful places on Washington’s Olympic Peninsula: Toward a deeper understanding of landscape values. Environ. Manag. 2017, 60, 643–664. [Google Scholar] [CrossRef]
- Levine, J.; Muthukrishna, M.; Chan, K.M.; Satterfield, T. Sea otters, social justice, and ecosystem-service perceptions in Clayoquot Sound, Canada. Conserv. Biol. 2017, 31, 343–352. [Google Scholar] [CrossRef]
- Calcagni, F.; Maia, A.T.A.; Connolly, J.J.T.; Langemeyer, J. Digital co-construction of relational values: Understanding the role of social media for sustainability. Sustain. Sci. 2019. [Google Scholar] [CrossRef]
- Loukaitou-Sideris, A. Urban form and social context: Cultural differentiation in the uses of urban parks. J. Plan. Educ. Res. 1995, 14, 89–102. [Google Scholar] [CrossRef]
- Oteros-Rozas, E.; Martín-López, B.; Fagerholm, N.; Bieling, C.; Plieninger, T. Using social media photos to explore the relation between cultural ecosystem services and landscape features across five European sites. Ecol. Indic. 2018, 94, 74–86. [Google Scholar] [CrossRef]
- Grahn, P.; Stigsdotter, U.K. The relation between perceived sensory dimension of urban green space and stress restoration. Landsc. Urban Plan. 2010, 94, 264–275. [Google Scholar] [CrossRef]
- Chiesura, A. The role of urban parks for the sustainable city. Landsc. Urban Plan. 2004, 68, 129–138. [Google Scholar] [CrossRef]
- Peters, K.; Elands, B.; Buijs, A. Social interactions in urban parks: Stimulating social cohesion? Urban For. Urban Green. 2010, 9, 93–100. [Google Scholar] [CrossRef] [Green Version]
- Dietz, T.; Fitzgerald, A.; Shwom, R. Environmental values. Annu. Rev. Environ. Resour. 2005, 30, 335–372. [Google Scholar] [CrossRef]
- Davis, R.E.; Couper, M.P.; Janz, N.K.; Caldwell, C.H.; Resnicow, K. Interviewer effects in public health surveys. Health Educ. Res. 2009, 25, 14–26. [Google Scholar] [CrossRef] [PubMed] [Green Version]
- Richards, D.R.; Friess, D.A. A rapid indicator of cultural ecosystem service usage at a fine spatial scale: Content analysis of social media photographs. Ecol. Indic. 2015, 53, 187–195. [Google Scholar] [CrossRef]
- Duggan, M.; Brenner, J. The Demographics of Social Media Users, 2012; Pew Research Center’s Internet & American Life Project: Washington, DC, USA, 2013; Volume 14. [Google Scholar]
- Hopkins, D.J.; King, G. A method of automated nonparametric content analysis for social science. Am. J. Political Sci. 2010, 54, 229–247. [Google Scholar] [CrossRef]
- Grimmer, J.; Stewart, B.M. Text as data: The promise and pitfalls of automatic content analysis methods for political texts. Political Anal. 2013, 21, 267–297. [Google Scholar] [CrossRef]
- De Lange, E.; Woodhouse, E.; Milner-Gulland, E.J. Approaches used to evaluate the social impacts of protected areas. Conserv. Lett. 2016, 9, 327–333. [Google Scholar] [CrossRef]
- Scopelliti, M.; Carrus, G.; Adinolfi, C.; Suarez, G.; Colangelo, G.; Lafortezza, R.; Panno, A.; Sanesi, G. Staying in touch with nature and well-being in different income groups: The experience of urban parks in Bogotá. Landsc. Urban Plan. 2016, 148, 139–148. [Google Scholar] [CrossRef]
Figure 1.
Prospect Park, Brooklyn, divided into zones by land use/land cover.

Figure 2.
Prospect Park and surrounding gentrifying neighborhoods [50].
Figure 2.
Prospect Park and surrounding gentrifying neighborhoods [50].

Figure 3.
Distribution of social relations cultural ecosystem service within Prospect Park zones, by the data collection method (a) Twitter, (b) broad interview question, and (c) direct interview question.
Figure 3.
Distribution of social relations cultural ecosystem service within Prospect Park zones, by the data collection method (a) Twitter, (b) broad interview question, and (c) direct interview question.

Figure 4.
Distribution of recreation cultural ecosystem service within Prospect Park zones, by the data collection method (a) Twitter, (b) broad interview question, and (c) direct interview question.
Figure 4.
Distribution of recreation cultural ecosystem service within Prospect Park zones, by the data collection method (a) Twitter, (b) broad interview question, and (c) direct interview question.

Figure 5.
Richness of cultural ecosystem services within Prospect Park zones, by the data collection method (a) Twitter, (b) broad interview question, and (c) direct interview question.
Figure 5.
Richness of cultural ecosystem services within Prospect Park zones, by the data collection method (a) Twitter, (b) broad interview question, and (c) direct interview question.


Table 1.
Prospect Park zones with associated land use land cover categories (shading of rows indicate broad categories of built (no shading), landscaped (light shading), and natural areas (darker shading).
Table 1.
Prospect Park zones with associated land use land cover categories (shading of rows indicate broad categories of built (no shading), landscaped (light shading), and natural areas (darker shading).
| Zone | Zone Name | Land Use Land Cover |
|---|---|---|
| A | Grand Army Plaza entrance & surrounding area | Entrance/forested with trails |
| B | Third Street Playground | Playground |
| C | Litchfield Villa & Garage | Building |
| D | Long Meadow | Open meadow with trees |
| E | Picnic House & BBQ Area | Building |
| F | Midwood | Forested with trails |
| G | Vale of Cashmere | Forested with trails |
| H | Nellie’s Lawn | Open meadow with trees |
| I | Aralia Grove | Forested with trails |
| J | Harmony Playground | Playground |
| K | Bandshell & BBQ areas | Open meadow with trees |
| L | Ravine | Forested with trails |
| M | Children’s Corner | Playground |
| N | Bartel-Pritchard entrance & surrounding area | Entrance/forested with trails |
| O | Softball fields | Ballfields |
| P | Quaker Hill & Pools | Forested with trails / locked area |
| Q | Lookout Hill | Forested with trails |
| R | Nethermead / Breeze Hill & Boathouse | Open meadow and forested with trees |
| S | Lincoln Road entrance & surrounding area | Entrance/forested with trails |
| T | Lincoln Road Playground | Playground |
| U | Vanderbilt Street Playground | Playground |
| V | Park Circle entrance & surrounding area | Entrance/forested with trails |
| W | Lakeside | Lakeside with trails |
| X | Imagination Playground | Playground |
| Y | Parkside Ave entrance & surrounding area | Entrance/forested with trails |
Table 2.
Cultural ecosystem services and definitions [23].
Table 2.
Cultural ecosystem services and definitions [23].
| Cultural Ecosystem Service | MEA Definition | Theme Definition and Examples |
|---|---|---|
| Cultural diversity | The diversity of ecosystems is one factor influencing the diversity of cultures. | Tweets or interviews referring to cultural events and gatherings, such as concerts, dance performances and cultural festivals occurring in public greenspace were coded as cultural diversity. |
| Knowledge systems (traditional and formal) | Ecosystems influence the types of knowledge systems developed by different cultures. | Tweets or interviews referring to drawing upon a body of knowledge were coded as knowledge systems. |
| Educational values | Ecosystems and their components and processes provide the basis for both formal and informal education in many societies | Tweets or interviews referring to educational events or educational groups were coded as educational values. |
| Inspiration | Ecosystems provide a rich source of inspiration for art, folklore, national symbols, architecture, and advertising. | Tweets or interviews referring to creating or being inspired by what is observed in the Park (natural features, built features such as architecture and sculpture, and/or cultural interactions and events). |
| Aesthetic values | Many people find beauty or aesthetic value in various aspects of ecosystems, as reflected in the support for parks, scenic drives, and the selection of housing locations. | Tweets or interviews referring to views, beauty, or other visual aspects of urban greenspace were coded as aesthetic values. |
| Social relations | Ecosystems influence the types of social relations that are established in particular cultures. Fishing societies, for example, differ in many respects in their social relations from nomadic herding or agricultural societies. | Tweets or interviews referring to social interactions were coded as social relations. |
| Sense of place | Many people value the “sense of place” that is associated with recognized features of their environment, including aspects of the ecosystem. | Tweets or interviews referring to interactions with specific places, animals or plants, or natural or built features were coded as sense of place. |
| Cultural heritage values | Many societies place high value on the maintenance of either historically important landscapes (“cultural landscapes”) or culturally significant species. | Tweets or interviews referring to park history or popular cultural experiences in the park were coded as cultural heritage values. |
| Spiritual and religious values | Many religions attach spiritual and religious values to ecosystems or their components. | Tweets or interviews referring to refuge, solitude, and spiritual and religious experiences. |
| Recreation | People often choose where to spend their leisure time based in part on the characteristics of the natural or cultivated landscapes in a particular area. | Tweets or interviews referring to nature or sports-based recreation were coded as recreation. |
Table 3.
Cultural ecosystem services, as coded from geotagged tweets and broad and directed questions for Prospect Park, Brooklyn.
Table 3.
Cultural ecosystem services, as coded from geotagged tweets and broad and directed questions for Prospect Park, Brooklyn.
| Cultural Ecosystem Service | Tweets | % | Broad | % | Directed | % |
|---|---|---|---|---|---|---|
| Social relations | 105 | 23.3% | 28 | 9.7% | 4 | 10.3% |
| Recreation | 97 | 21.5% | 42 | 14.6% | 22 | 56.4% |
| Sense of place | 62 | 13.7% | 22 | 7.6% | 1 | 2.6% |
| Aesthetic values | 44 | 9.8% | 33 | 11.5% | 1 | 2.6% |
| Cultural diversity | 36 | 8.0% | 1 | 0.3% | 1 | 2.6% |
| Cultural heritage | 21 | 4.7% | 1 | 0.3% | 0 | 0.0% |
| Spiritual values | 18 | 4.0% | 22 | 7.6% | 15 | 38.5% |
| Inspiration | 18 | 4.0% | 0 | 0.0% | 0 | 0.0% |
| Education | 3 | 0.7% | 0 | 0.0% | 0 | 0.0% |
| Knowledge systems | 1 | 0.2% | 1 | 0.3% | 0 | 0.0% |
| Total | 451 | 100.0% | 288 | 100.0% | 39 | 100.0% |
Table 4.
Probability of co-occurrence of cultural ecosystems in coded tweets aggregated to zones in Prospect Park1.
Table 4.
Probability of co-occurrence of cultural ecosystems in coded tweets aggregated to zones in Prospect Park1.
| Aesthetic Values | Cultural Diversity | Cultural Heritage | Education | Inspiration | Knowledge Systems | Sense of Place | Recreation | Social Relations | Spiritual Values | |
|---|---|---|---|---|---|---|---|---|---|---|
| Aesthetic Values | 0.039 *** | 0.047 *** | 0.047 *** | 0.078 ** | 0.086 *** | 0.078 ** | ||||
| Cultural Diversity | 0.039 *** | 0.049 * | 0.054 ** | 0.049 *** | ||||||
| Cultural Heritage | 0.047 *** | 0.035 *** | 0.059 ** | 0.064 ** | ||||||
| Education | 0.064 *** | 0.059 ** | ||||||||
| Inspiration | 0.047 *** | 0.035 *** | ||||||||
| Knowledge Systems | ||||||||||
| Sense of Place | 0.078 ** | 0.049 * | 0.059 ** | 0.107 *** | 0.098 *** | |||||
| Recreation | 0.086 *** | 0.054 ** | 0.064 ** | 0.064 *** | 0.107 *** | 0.107 *** | 0.032 ** | |||
| Social Relations | 0.078 ** | 0.049 *** | 0.059 ** | 0.098 *** | 0.107 *** | |||||
| Spiritual Values | 0.032 ** |
*** p < 0.001, ** p < 0.01, * p < 0.05.
© 2019 by the authors. Licensee MDPI, Basel, Switzerland. This article is an open access article distributed under the terms and conditions of the Creative Commons Attribution (CC BY) license (http://creativecommons.org/licenses/by/4.0/).
Share and Cite
MDPI and ACS Style
Johnson, M.L.; Campbell, L.K.; Svendsen, E.S.; McMillen, H.L. Mapping Urban Park Cultural Ecosystem Services: A Comparison of Twitter and Semi-Structured Interview Methods. Sustainability 2019, 11, 6137. https://doi.org/10.3390/su11216137
AMA Style
Johnson ML, Campbell LK, Svendsen ES, McMillen HL. Mapping Urban Park Cultural Ecosystem Services: A Comparison of Twitter and Semi-Structured Interview Methods. Sustainability. 2019; 11(21):6137. https://doi.org/10.3390/su11216137
Chicago/Turabian StyleJohnson, Michelle L., Lindsay K. Campbell, Erika S. Svendsen, and Heather L. McMillen. 2019. "Mapping Urban Park Cultural Ecosystem Services: A Comparison of Twitter and Semi-Structured Interview Methods" Sustainability 11, no. 21: 6137. https://doi.org/10.3390/su11216137
Note that from the first issue of 2016, this journal uses article numbers instead of page numbers. See further details here.