Article

Eco-Environmental Risk Evaluation for Land Use Planning in Areas of Potential Farmland Abandonment in the High Mountains of Nepal Himalayas

1
Institute of Mountain Hazards and Environment, Chinese Academy of Sciences, Chengdu 610041, China
2
University of Chinese Academy of Sciences (UCAS), Beijing 100049, China
3
Wanzhou Key Regional Ecology and Environment Monitoring Station of Three Gorges Project Ecological Environmental Monitoring System, Wanzhou 404020, China
4
National Society for Earthquake Technology-Nepal, Kathmandu Lalitpur, P.O. Box 13667, Nepal
5
Central Department of Geography, Tribhuvan University, University Campus, Kirtipur, P.O. Box 44613 Nepal
*
Authors to whom correspondence should be addressed.
Sustainability 2019, 11(24), 6931; https://doi.org/10.3390/su11246931
Submission received: 2 November 2019 / Revised: 28 November 2019 / Accepted: 3 December 2019 / Published: 5 December 2019

Abstract

:
Land use change, especially that due to farmland abandonment in the mountains of Nepal, is being seen as a major factor contributing to increasing eco-environmental risk, undesirable changes in the socio-cultural landscape, biodiversity loss, and reduced capacity of the ecosystem to provide key services. This study aims to: i) evaluate eco-environmental risk for one of the high mountain river basins, the Dordi river basin in Nepal, that has a growing potential of farmland abandonment; and ii) develop a risk-based land use planning framework for mitigating the impact of risk and for enhancing sustainable management practices in mountain regions. We employed a multi-criteria analytic hierarchy process (AHP) to assign risk weightage to geophysical and socio-demographic factors, and performed spatial superposition analysis in the model builder of a geographic information system (GIS) to produce an eco-environmental risk map, which was subjected to a reliability check against existing eco-environmental conditions by ground truthing and using statistical models. The result shows that 22.36% of the basin area has a high level of risk. The very high, extreme high, moderate, and low zones accounted 17.38%, 7.93%, 28.49%, and 23.81%, respectively. A high level of eco-environmental risk occurs mostly in the north and northwest, but appears in patches in the south as well, whereas the level of moderate risk is concentrated in the southern parts of the river basin. All the land use types, notably, forest, grassland, shrub land, and cultivated farmland, are currently under stress, which generally increases with elevation towards the north but is also concentrated along the road network and river buffer zones where human interference with nature is the maximum. The risk map and the framework are expected to provide information and a scientific evidence-base for formulating and reasonable development strategies and guidelines for consensus-based utilization and protection of eco-environmental resources in the river basin. As an awareness raising tool, it also can activate social processes enabling communities to design for and mitigate the consequences of hazardous events. Moreover, this risk assessment allows an important link in understanding regional eco-environmental risk situation, land use, natural resources, and environmental management.

1. Introduction

The Nepal mountains are characterized by a richly diverse ecological and socio-cultural landscape, and have been shaped by traditional land use activities [1,2,3]. The land management systems in practice have developed over the years in accordance with the prevailing environmental factors, including topography, climate, relief, soil, and proximity to roads and settlements [4]. In particular, cultivated farmland is located in the most fertile gentle slopes at a lower elevation, whereas forest and grassland are scattered, mostly occupying the steep slopes that are relatively farther from the villages. Thus, a balance between people, settlement, farmland, forest, and grassland was achieved in the traditional land use practice. This practice contributed to the ecological and environmental diversity in the mountains and to the socio-cultural values of the landscape. However, recent farmland abandonment has triggered the process of land degradation as well as deterioration of mountain ecosystem services [5,6,7,8]. The resulting patterns have also led to the problems of soil erosion and siltation of rivers and reservoirs, which in turn have increased the frequency and severity of landslides, debris flow, rock falls, and sinkhole formation [9,10]. Therefore, in order to manage the ever-increasing risk and to promote sustainable mountain development and eco-environmental protection, proper eco-environmental risk-based land use planning is essential [11].
Eco-environmental risk is the likelihood of harmful consequences occurring as a result of exposure to biological, physical, chemical, and social stressors [12]. The risk can exert harmful or fatal effects on humans and the natural environment [13]. Thus, eco-environmental risk assessment (ERA) is performed to identify, analyze, and evaluate risk to the environment, ecosystem services, living organisms, and human beings [14]. It has been applied in many fields including environmental sciences and health sciences. In particular, in 1987, the eco-environmental risk assessment (ERA) emerged as a way to assess the likelihood of adverse effects to ecosystems rather than only to human health [15]. Since then, ERA has been applied to evaluate eco-environmental risks to ecosystems and thus identify opportunities for regulating sustainable land use [16]. Surrogate information contributing to the distribution of risks across the mountain ecosystem such as topographic condition (elevation, slope, and aspect), types of land use, rainfall, geology, soil, and socio-economic condition, road distance, and settlement location are considered to develop risk assessment processes [17]. Mainly the risk analysis consists of characterizing both the exposure and effects to the environment [18]. Such understanding and mapping are important especially for eco-environmentally fragile mountainous regions, where the relationship between the natural and human built-up environment is crucial for sustainable land use [19,20].
A variety of approaches and methods are available and used to evaluate and identify eco-environmental risks [21,22]. These were designed from diverse contexts and performed at different spatial and temporal scales [23,24]. For example, Liu et al. conducted and viewed eco-environmental risk from the perspective of watershed management [25] and agricultural activities [26]. These were carried out using a geographic information system (GIS), remote sensing or a combination of both, accompanied with field evaluation [27], and sometimes coupled with other environmental models or methods [28]. These techniques are cost-effective, easily-compared, time-efficient, and ideal for mapping and monitoring the trends of eco-environmental degradation and spatial changes [29,30]. Among the methods, the analytical hierarchy process (AHP) remains the most common and widely used multi-criteria decision aid (MCDA) method to date and has appeared in many research reports [31,32,33]. It can be used on risk assessment accounting or for overlaying for a multitude of criteria such as soil, climate, vegetation, and their sub-criteria [34]. Subjective opinions from decision makers (DMs), stakeholders, and experts in a given field also can be used in this method [35]. Moreover, the AHP method allows the integration of qualitative and quantitative factors and can solve complex risk assessment problems where data and information are lacking or ambiguous [36]. We used this AHP method. With this background, the present study aims to: i) evaluate eco-environmental risk for one of the high mountain river basins in Nepal that has a growing potential for farmland abandonment; and ii) develop a risk-based land use planning framework for mitigating the impact of risk and for enhancing sustainable management practices in mountain regions. The study at first identifies and analyzes the role of different natural and social factors together with other interdependent factors that influence the eco-environmental risk processes to evaluate the level of risks. Based upon the risk assessed, we propose a draft framework of ERA-based land use planning considering the principles of best practices in sustainable land management. The risk-based land use planning thus prepared is expected to serve as a tool that can help local governance to improve economic opportunities and develop land use options that reconcile conservation and development objectives. The use of this framework thereby can activate social processes of decision making and consensus building among stakeholders on matters concerning the utilization and protection of local resources. The risk map also enables communities to design for and mitigate the consequences of hazardous events. Moreover, this risk assessment allows an important link in understanding regional eco-environmental risk situation, making land use, natural resources, and environmental management.

2. Materials and Methods
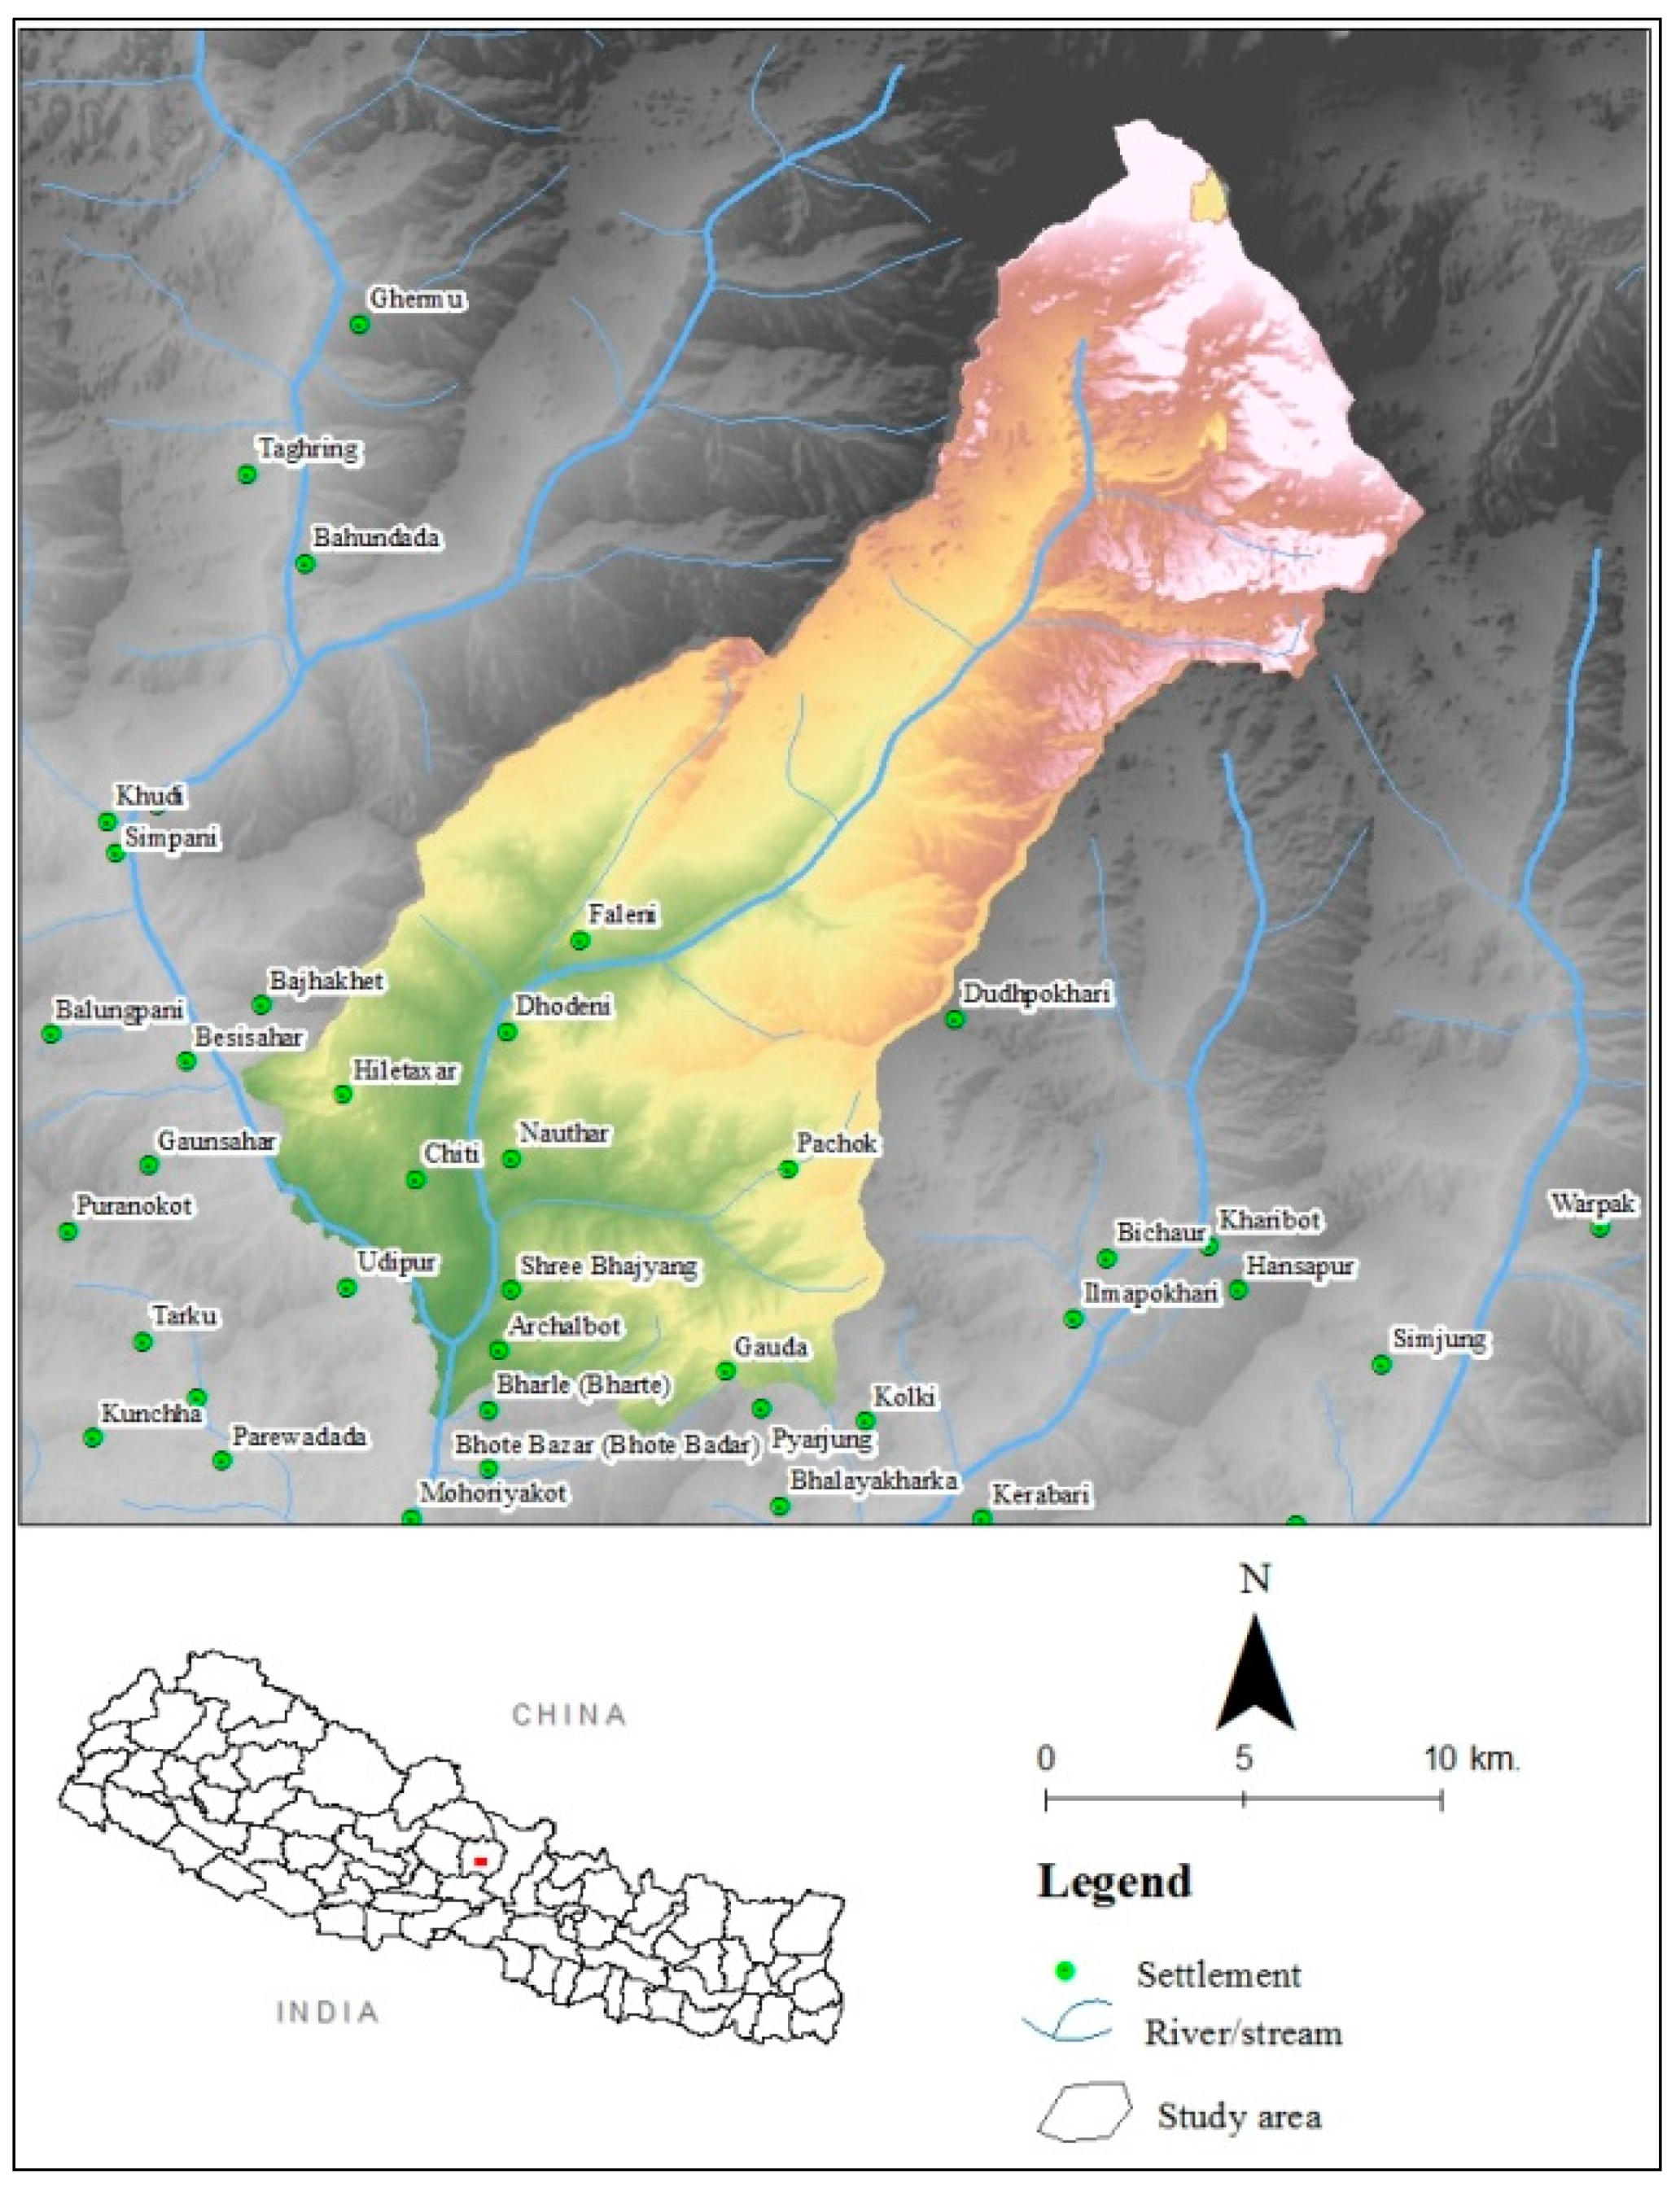
2.1. Study Area

The assessment was carried out in the Dordi river basin that lies in the high mountainous region of western Nepal. It is located within the coordinates of 28°8′ N–28°27′ N latitude, and 84°24′ E–84°42′ E longitude, along the southern faces of the Himalayan range, with elevations ranging from 546 m above mean sea level (ma.s.l.) to more than 7746 m a.s.l (see Figure 1). The basin covers a land area of 496 km2 approximately.
The region has a pleasant mountainous subtropical climate with concentrated monsoon rainfall during the period between June and September with an average rainfall of 2600 mm per year. Chir pine (Pinusrox burghii) and broad-leaf trees, such as Chilaune (Schimawal lichii), oak (Quercussemi carpifolia), sal (Shorearobusta), Schima Castanopsis, and Engelhardtia are the dominant vegetation types [37]. The basin has a long history of human habitation which has evolved the present day landscapes and land use patterns [37]. High altitude, steep slopes, undulating terrain as well as several major rivers and streams running north to south define the Dordi river basin which is sensitive to land use change and the ongoing risk processes. The rivers/streams are ephemeral in character with high flows when it rains, causing frequent flash floods. The basin was severely affected by the 2015 earthquake. Landslides, debris flow, and rock falls frequently occur over the basin. Many cultivated farmlands and settlements, especially those adjacent to the rivers and secondary streams face landslide hazards. Many landslides, debris flow, and ground settlements are directly associated with the abandonment of farmland terraces located on the hill slopes [6]. Additionally, gully formation, soil erosion, and siltation of soil on water bodies (river water, drinking water supply, and irrigation canal) are common. Moreover, river/stream bank cutting also poses a threat to houses and other assets along the bank of the Dordi River.
The main coping strategy of the communities is to rebuild, clean, and maintain the infrastructure after landslides, debris flow, rock falls or soil erosion events. Communities erected at places gabion walls for landslide or debris flow protection, but these are not entirely effective: most of the household respondents claimed that they have been affected by the geologic and hydrologic hazards several times every year. Due to this, some residents permanently migrated, leaving their farmlands uncultivated. The remaining residents are very worried about these eco-environmental hazards and concerned with the high probability of repeated landslides, debris flow, and soil erosion. While the people’s priority is to improve education, employment, and road development, their day-to-day concerns include mitigation of landslides, floods, and soil erosion. This kind of deterioration in the Dordi river basin arrested our attention and decision to conduct a systematic eco-environmental risk sensitivity mapping and assessment of associated risks, and to draft a risk-based land use planning framework that could assist in the peoples’ efforts to mitigate and control the problems caused by geologic, hydrological, and natural hazards, or those induced due to the abandonment of farmlands.

2.2. Data Collection and Processing

The dataset used for this study includes a series of geographic information prepared from satellite imagery, secondary data, and field observation. The dataset used includes elevation, slope, aspect, soil, geology, rainfall, existing land use, normalized difference vegetation index (NDVI), and distances from settlements to the nearest rivers/streams, road network, and settlement location. A digital elevation model (DEM) at 30 m resolution, prepared using data obtained from the geospatial data cloud (http://www.glovis.com) was used for elevation, slope, and aspect mapping. Soil type (scale = 1:1,000,000) and geology (scale = 1:50,000) maps were derived from the soil and terrain database for Nepal [38] and Department of Mines and Geology, Government of Nepal, respectively. Rainfall data were collected from the Hydrology and Meteorology Department of Nepal. They were interpolated by using the inverse distance weighting (IDW) method in ArcGIS 10.5 software. The positions of rivers/streams, road networks, and settlement locations were taken from the Department of Survey, Government of Nepal.
Land use/land cover map and NDVI were prepared from the open access Landsat 7 Enhanced Thematic Mapper Plus (30 m resolution, LANDSAT 7 ETM SLC-off, acquisition date: 22-08-2019) images. Two scenes of Landsat 7 ETM data (path 141, 142 and row 41) for August 2019 were downloaded from Geospatial Data Cloud (http://www.gscloud.cn; National Basic Science Data Sharing Service Platform, Chinese Academy of Sciences, Beijing, China). A false color image map produced by the computer software ArcGIS Desktop 10.5, version 10.5.0.6491 (Esri ® ArcMapTM 380 New York Street Redlands, California 923738100 USA) was then analyzed for different land units. These thematic factors were converted into raster data with 30 × 30 m resolution (WGS_1984_Universal Transverse Mercator System, false easting = 500,000, central meridian = 84, sale factor = 0.9996 and Datum – D_WGS_1984) in an ArcGIS 10.5 environment.

2.3. Selection of Criteria and Construction of Assessment Indicator System
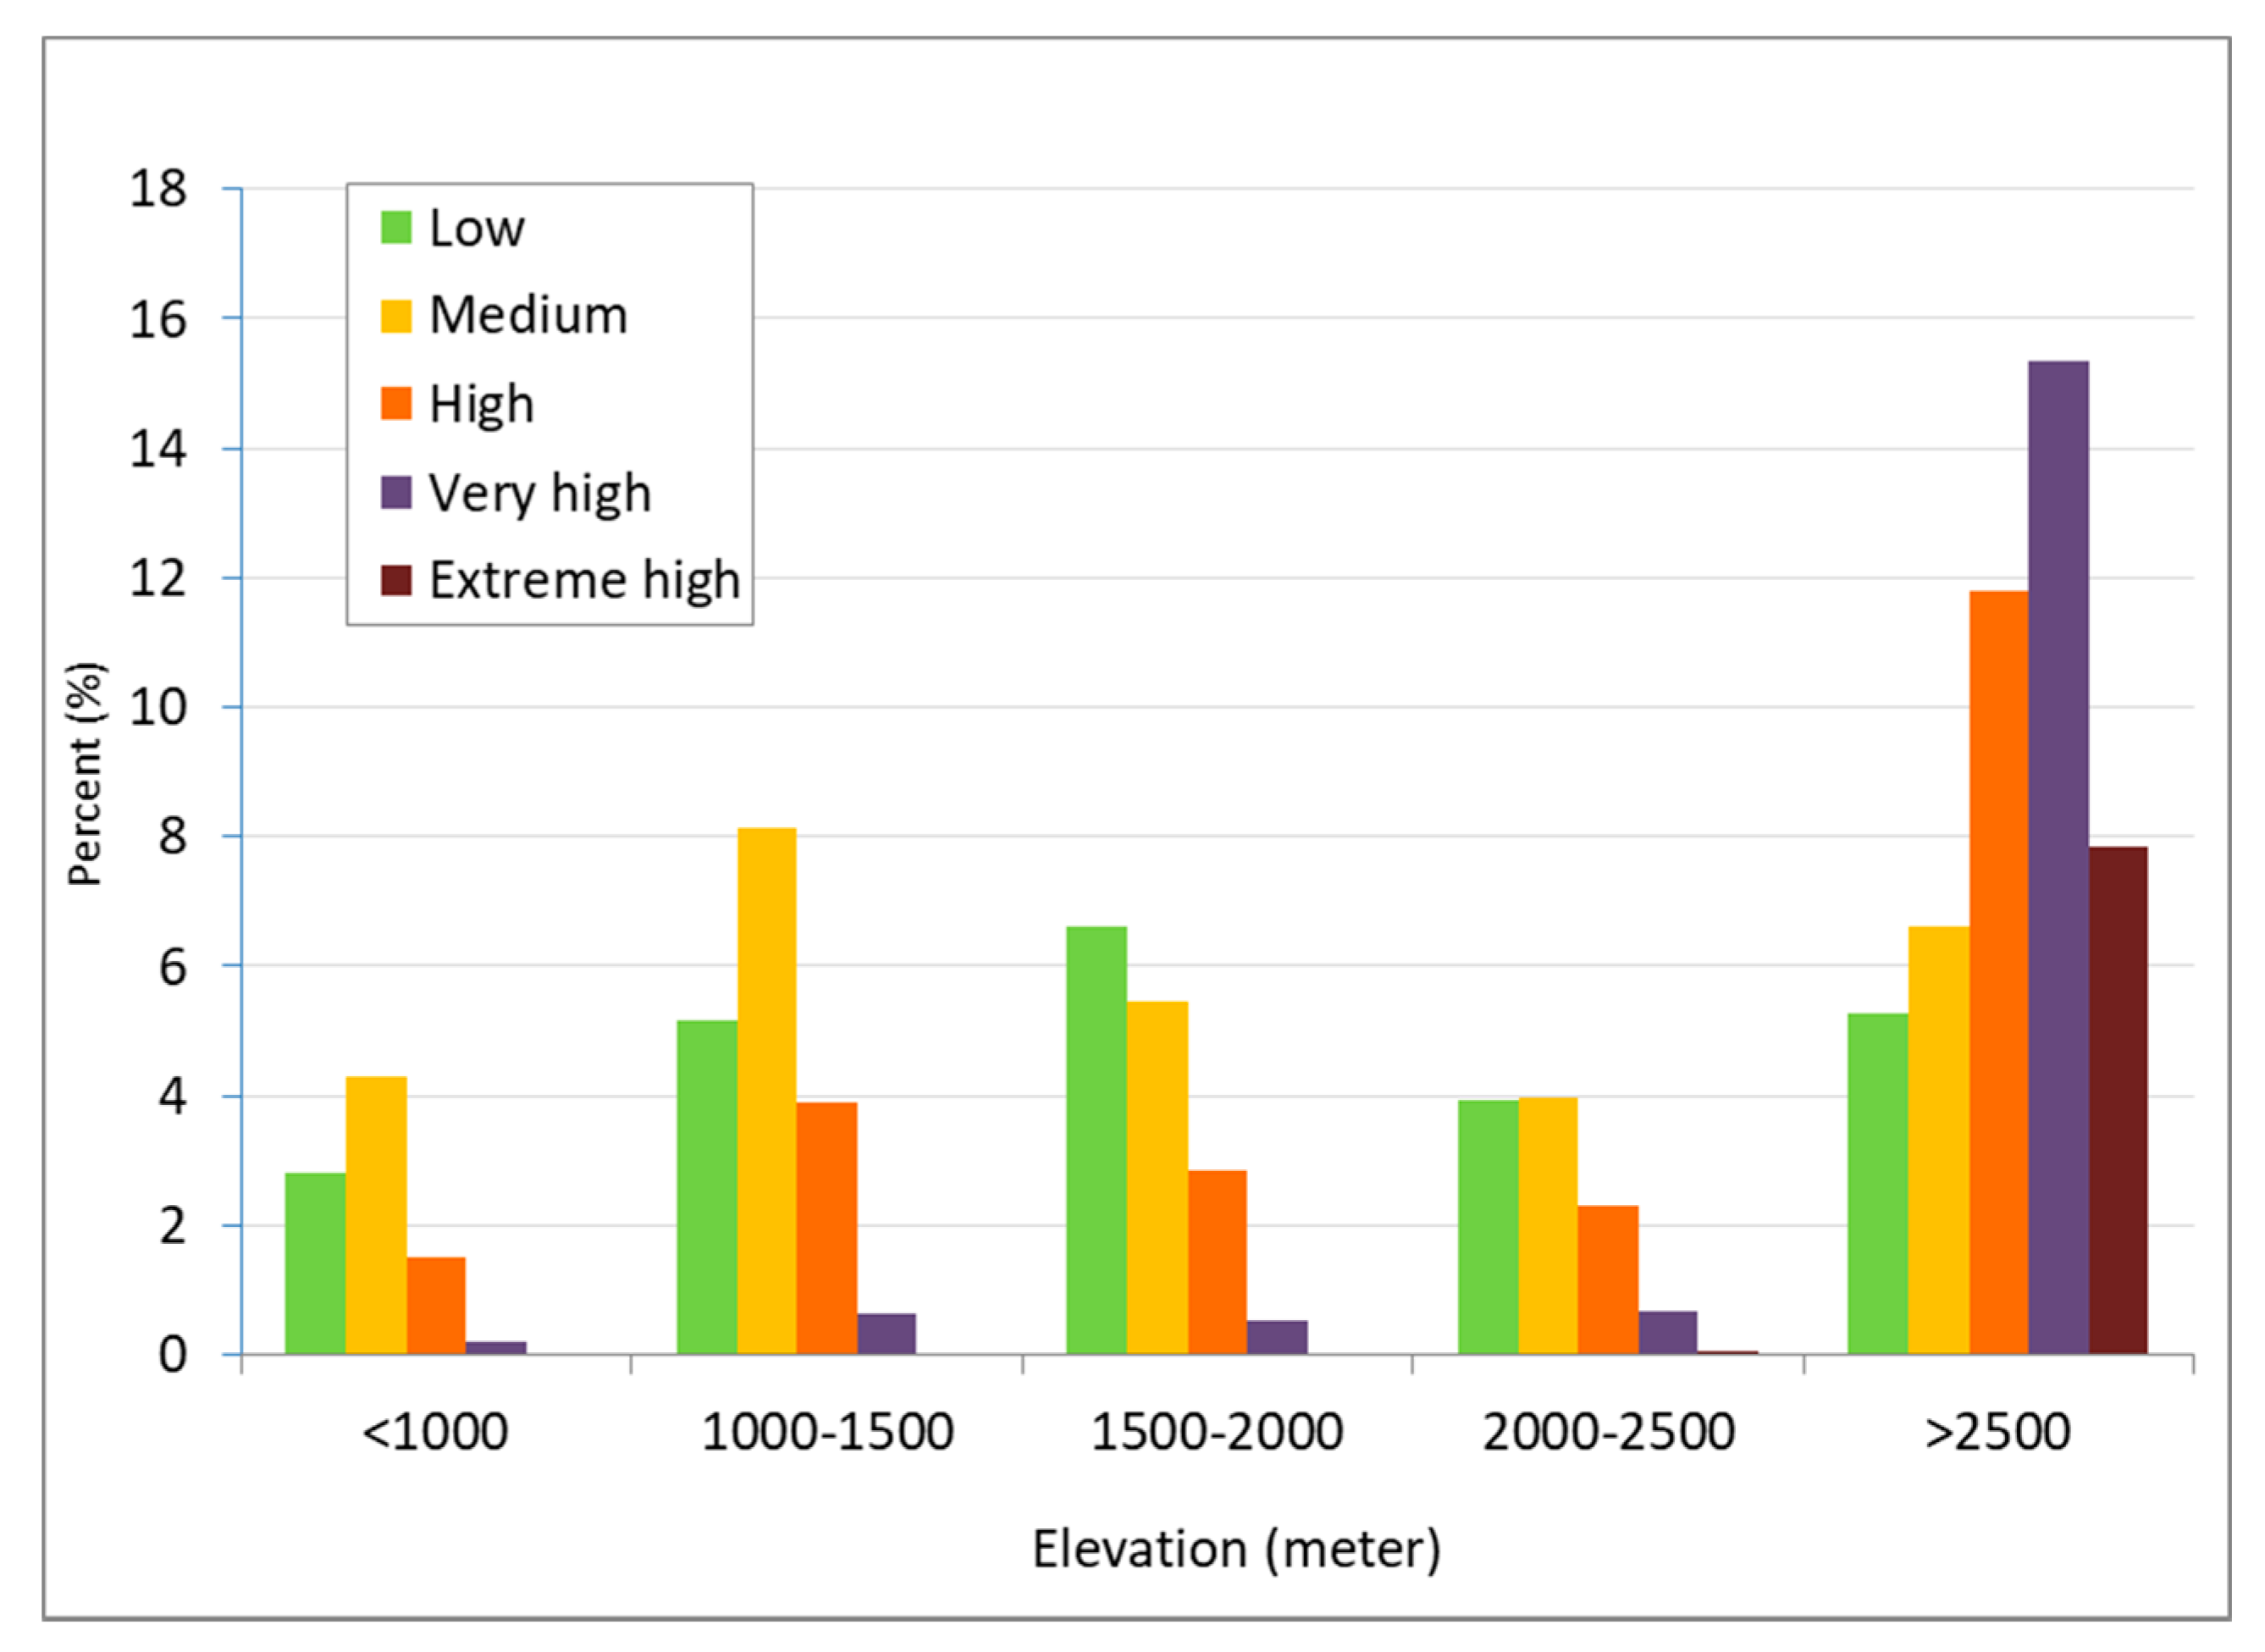
We adopted eleven criteria including topographic characteristics (elevation, slope, and aspect), soil, geology, rainfall, rivers/streams, existing land use/land cover, normalized difference vegetation index, and socio-economic conditions such as distance to roads and settlements, which revealed the major natural and built-up environments of the river basin. The description of all the criteria and their sub-criteria are described in the following paragraphs.

2.3.1. Elevation

A topographic characteristic, elevation has potent influence on land use, surface runoff, as well as development and distribution of accidental events such as landslides and debris flow [39,40]. The elevation directly reflects the terrain ruggedness. In this study, the elevation variation was generated from the digital elevation model and classified into classes as: (i) <1000, (ii) 1000–1500, (iii) 1500–2000, (iv) 2000–2500, and (v) >2500.

2.3.2. Slope

Slope gradient mainly controls the infiltration of groundwater into subsurface and surface flow. In general, steeper slopes result in a faster speed of flow and are not suitable for the maintenance of eco-environmental conditions [41]. In this study, the slope angles were generated from the digital elevation model, and classified into five classes: flat to gentle slope (<15°), moderate slope (15°–25°), fairly moderate slope (25°–35°), steep slope (35°–45°), and very steep slope (>45°).

2.3.3. Aspect

Topographic aspect determines the maximum slope of the terrain surface as well as the relative amounts of sunshine and atmospheric moisture it receives [42]. In this study, the topographic aspects were generated from the digital elevation model, and classified into classes: (i) north (N), (ii) northeast (NE), (iii) east, (iv) southeast (SE), (v) south (S), (vi) southwest (SW), (vii) west (W), (viii) northwest (NW), and (ix) flat.

2.3.4. Geology

Geological formation plays an important role in the production of loose materials on the slope by weathering and slope movements such as landslide, debris flow, etc. [43]. The river basin geology is mainly composed of easily weathered weak rocks such as shale and phyllite of Ranimatta formation that produce loose clayey soils, moderately hard slates of Ghanapokhara formation, and granite and augen gneiss of Ulleri formation, that give rise to gravelly soil; whereas the hard quartzite of the Naudanda formation produces sandy or boundary slopes not very suitable for vegetative growth [37,44].

2.3.5. Soil

Soil structures play an important role in the definition of land use and land cover, as well as in the production on the slope of loose materials by weathering and slope movements [38,43]. The soil types in the basin include red soil, sandy, cobbly, loamy, loamy-boulder, and loamy-skeletal, that have been classified into: (i) chromic cambisols, (ii) eutric cambisols, (iii) eutric regosols, (iv) gelic laptosols, (v) gleyic cambisols, and (vi) humic Cambisols [37].

2.3.6. Rainfall

Rainfall is a critical factor for constituting the natural environment as well as the energy bases of ecosystem services (e.g., agricultural land, forests, rivers, etc.) [45]. When the energy transmission and transformation of rainfalls are not in accordance with other environmental factors in time and space, it will lead to ecological degradation [46]. On one hand, lack of precipitation disturbs the entire ecosystem with strong erosion along the numerous tributaries on the other; strong rainfall induces heavy soil erosion, giving rise to geological hazards such as landslips and mudslides. Therefore, eco-environmental risk bears strong and positive correlations between rainfall concentrations. Here, we used the inverse distance weighting (IDW) interpolation method to generate a rainfall map that was classified into five classes: (i) <2613 mm/year, (ii) 2613–2614 mm/year, (iii) 2614–2615 mm/year, (iv) 2615–2616 mm/year, and (v) >2616 mm/year.

2.3.7. Land Use/Land Cover (LULC)

Land use/land cover is one of the most important forms of eco-environmental landscape that serves as also the source of hazardous events in mountain regions [47]. In general, the forest area provides stability to the slope and it is widely accepted that vegetation cover has a positive influence on slope stability [48]. Geological hazards get triggered frequently in the barren mountains and abandoned farmlands [7]. In this study, the land use/cover was mapped into eight classes: (i) agricultural land, (ii) forest, (iii) grass land, (iv) bare land, (v) shrub land, (vi) water body, and (vii) snow/glacier. Agriculture land referred to land used for growing crops, even if it was cultivated every year. Forest is referred to as any vegetated land that is dominated by trees or shrubs. Grassland is defined as any land used to grow grasses for the purpose of grazing. Shrub land is categorized when forest does not entirely apply.

2.3.8. Normalized Difference Vegetation Index (NDVI)

NDVI is an important in that it measures the ground vegetation condition. The vegetation cover condition directly affects and even determines the eco-environmental conditions such as the amount of primary biological production, ecological carrying capacity, and soil erosion [49]. The higher the NDVI value, the healthier the vegetation; while a lower NDVI value represents less or no vegetation. Theoretically, NDVI values range from −1 to 1. In practice, extreme negative values represent water, values around zero represent bare soil, and values over 0.6 represent dense green vegetation. Here, NDVI values have been divided into five classes: (−0.17)–(0.02), (−0.02)–0.10, 0.10–0.20, 0.20–0.29, and 0.29–0.50.

2.3.9. Distance to Rivers/Streams

The hydrological system with rivers, streams, ponds, and natural springs as its components has importance not only because it assists in draining rain water but also because it can induce landslides, debris flow, and flooding [50]. Most of the time, the occurrence of flooding is related to the distribution of the drainage system. Concave stream banks usually host soil fall or landslides. In this study, a map for distance to river and streams was prepared using the buffer distance analysis (BDA) method, and classified into five classes: (i) close (<50 m), (ii) nearby (50–100 m), (iii) distant (100–200 m), (iv) little distance (200–500 m), and (v) far (>500 m).

2.3.10. Distance to Road Networks

Road networks and mountain slopes are important factors that influences the geomorphic processes affecting the surrounding eco-environment [51]. Road construction often leads to high runoff coefficients and soil losses from mountainous slope surfaces. In this study, motorable earthen roads were considered for network, and a distance map was prepared using the buffer distance analysis (BDA) method. These were classified into five classes: (i) close (<50m), (ii) nearby (50–100 m), (iii) nearby distant (100–200 m), (iv) far (200–500), and (v) more far (>500 m).

2.3.11. Distance to Settlements

Population density, settlement distribution, and socio-economic activities acting separately or interacting together influence the regional eco-environmental quality [52]. In particular, human activities such as grazing, mining, and soil digging are associated with the location of settlements, that can accelerate surface geomorphic processes indicating geomorphic hazards [53,54,55,56]. This study considered a settlement as one that includes at least five buildings located in a cluster. Digital thematic distances from each settlement were prepared in the form of a map using the buffer distance analysis (BDA) interpolation method. These were classified into three classes: (i) close (<1000 m), (ii) nearby (1000–2000 m), (iii) nearby distant (2000–3000 m), and far (>3000).

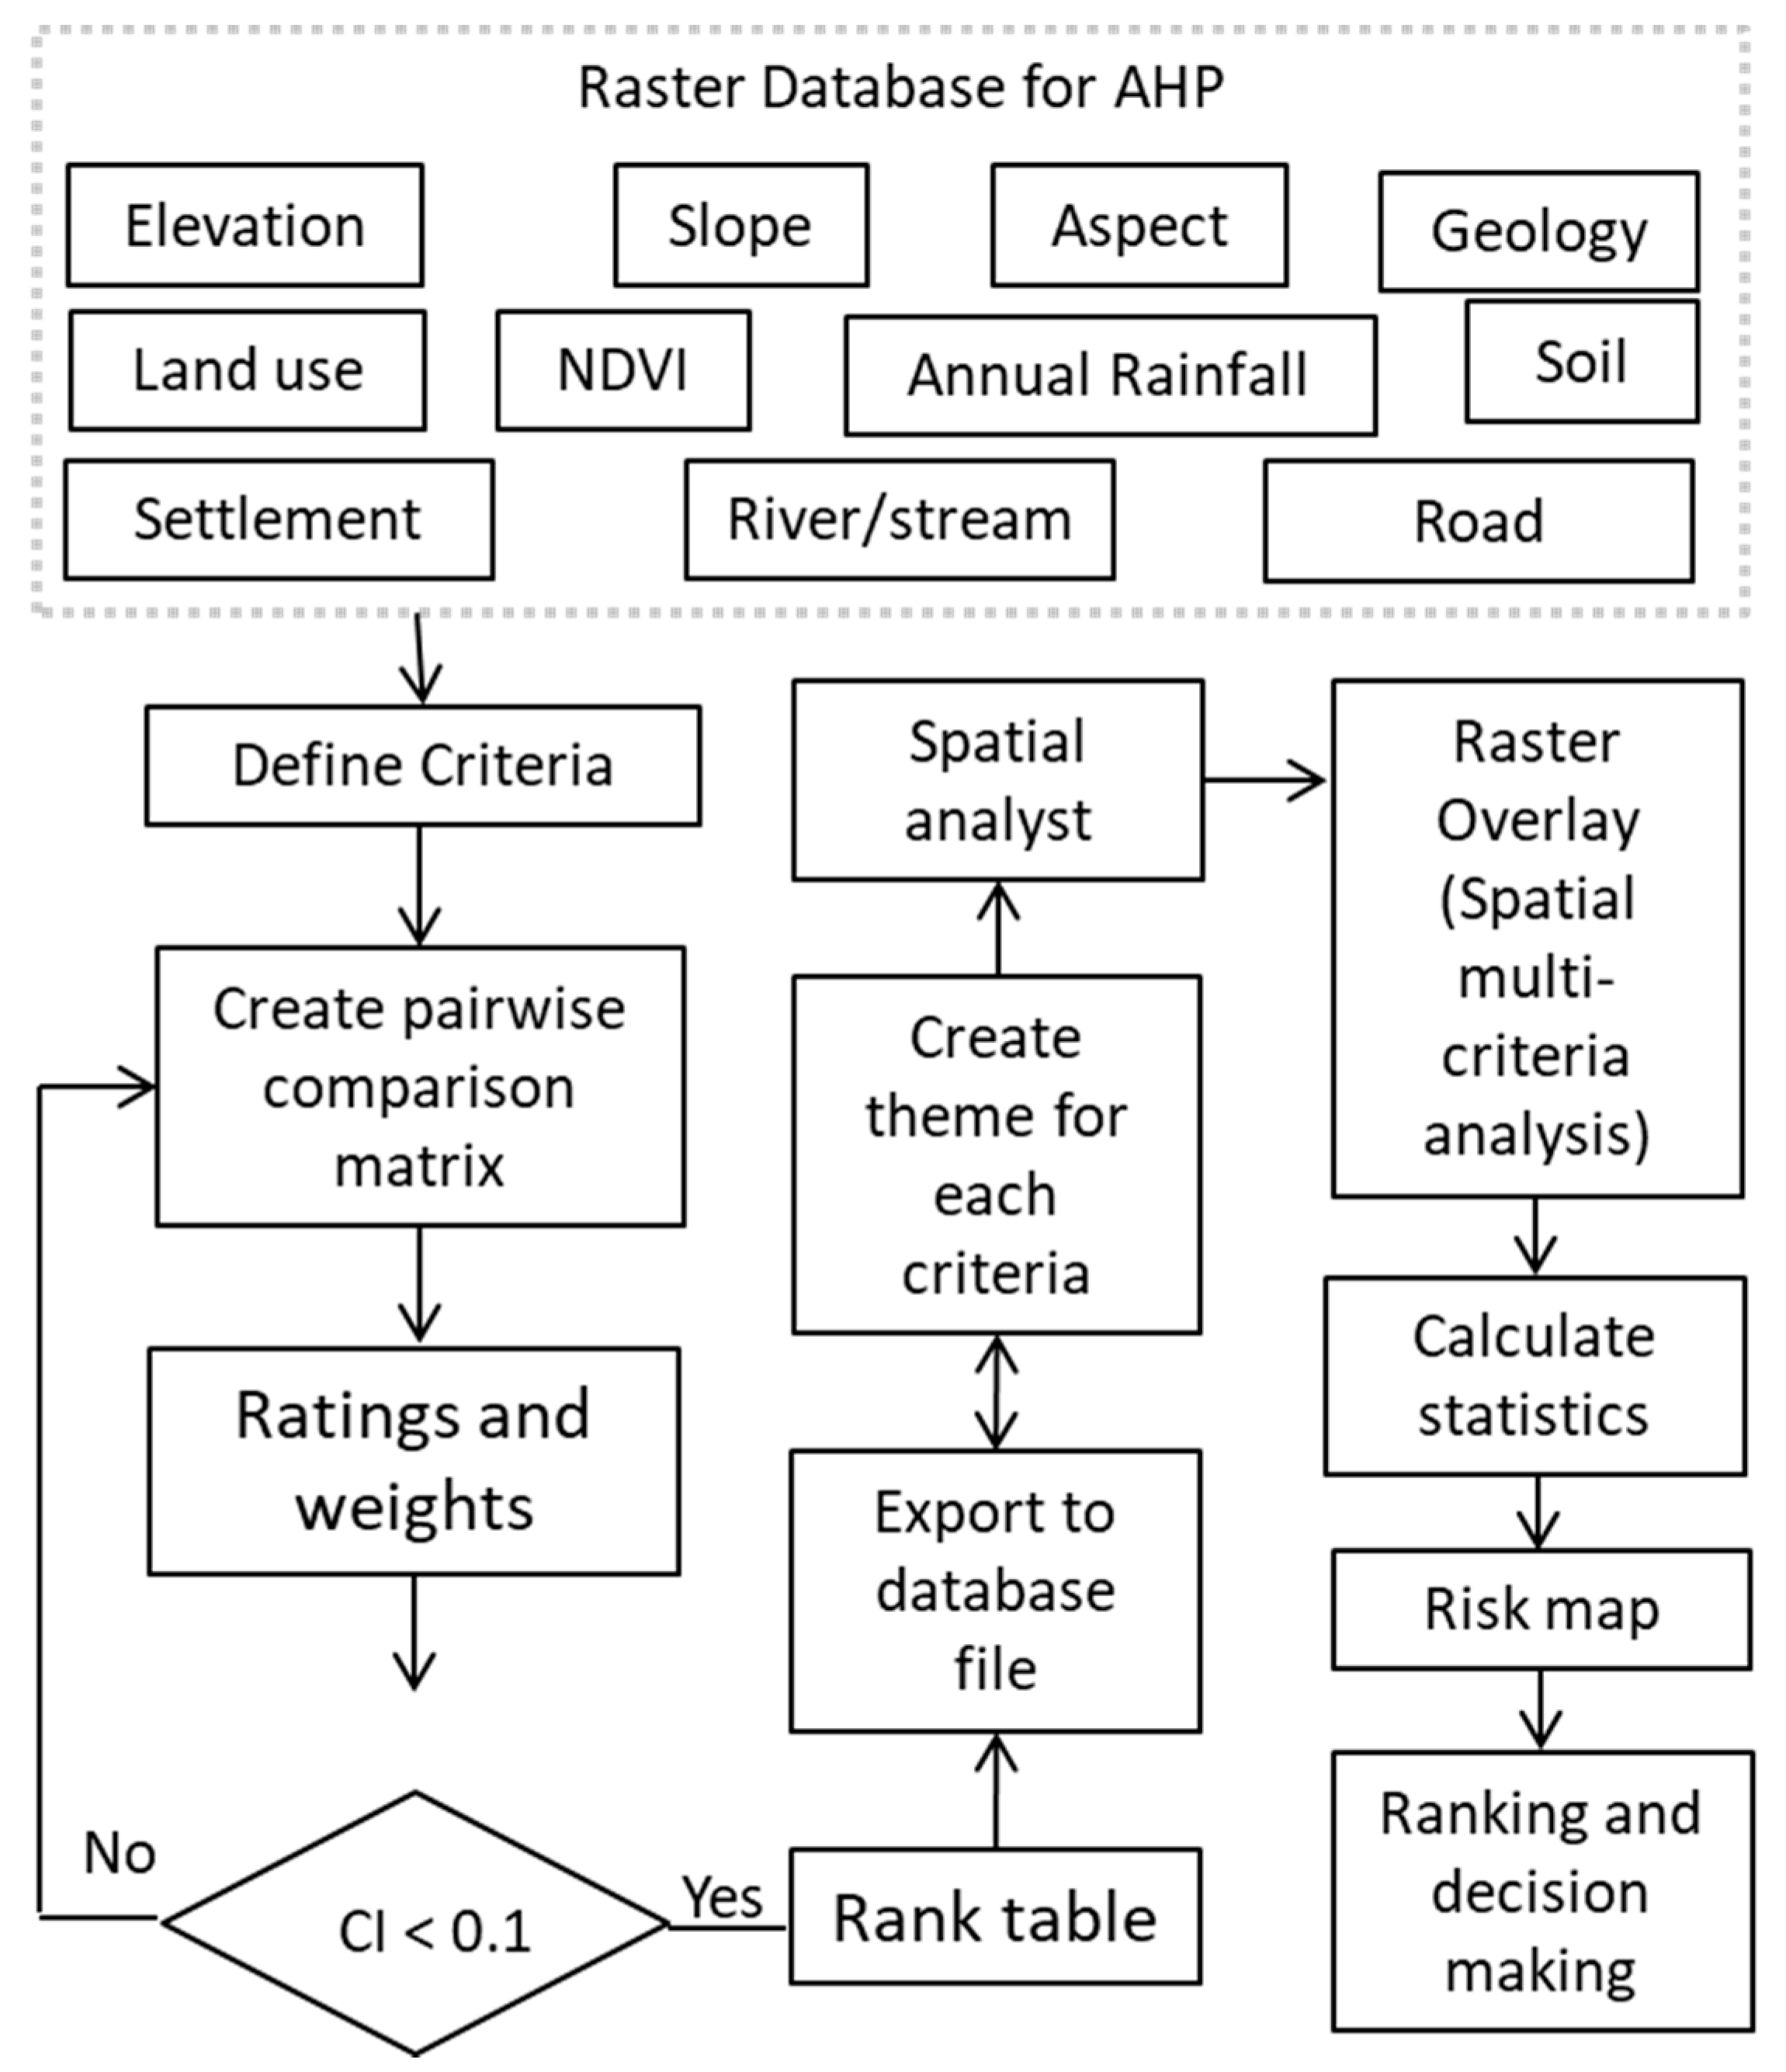
2.4. Determining Relative Importance of the Different Criteria

Each of the criteria was weighted according to its relative contribution to eco-environmental risk and quality. A pairwise comparison matrix based on the AHP method was used to determine the weight of each criterion (see Figure 2). A numerical value from 1 to 9 was assigned, indicating how many times a criterion was more important or how dominant one criterion was over another criterion. This was determined based upon a consensus of five experts (1 geologist, 2 geographers, 1 soil scientist, and 1 environmental scientist) experienced and well-versed in the relative influence of each criterion on eco-environmental risk, land use, ecosystem health, and ecological quality [57]. Specifically, higher weights were given to higher elevations while lower elevations were assigned lower weights for the elevation factor: steeper hill slopes received higher weightage values. Similarly, higher weights were given to north, northwest, and northeast aspects because northern aspects are mostly devoid of vegetation or have scant vegetation in the basin. For land use types, bare land was given a high weight because of its high influence on geomorphic processes; grassland and scrub were given medium weights as grasses become prone to landslides and other events, thus becoming medium susceptible to environmental hazards (e.g., landslides, debris flow). The forest classes were given less weight because forests hinder environmental hazards. The major rock type of the area was rated according to their relative importance for landslides and debris flow. Accordingly, proximity to rivers/streams, road networks, and settlements was assigned higher scores. It was assumed that the possibility of a landslide and other geomorphological processes was more frequently near streams because of undercutting.
After assigning values to all thematic layers, the validity of comparisons was evaluated through the consistency ratio (CR).
Consistency   ratio   ( CR )   =   C o n s i s t e n c y   i n d e x   ( C I ) R a n d o m   i n d e x   ( R I )
where CI is the consistency index, expressed as,
Consistency   index   ( CI )   =   λ max n n 1
where λmax is the largest eigenvalue and n is the number of the criteria. RI is the random consistency index value. Table 1 shows the values for the RI of the matrix dimensions of 1–15. In general, the acceptable value of CR depends on the size of the matrix (0.1 for matrices n ≥5). If the CR value is equal to or less than the specified value, this indicates that the evaluation within the matrix is acceptable and close to ideal values. However, if the CR is higher than the acceptable value, an evaluation process is needed to be improved [60]. Here, the CR of the matrix that derived from criteria weights is 0.1, which is equal to <0.1, indicating the judgment is consistent, and the calculated weights can be used (Table S1).

2.5. Risk Calculation and Classification of Results

The eco-environmental risk was calculated by overlaying weightage value of each criterion for all unit areas. The defined criteria of elevation, slope, aspect, geology, soil, land use/land cover, NDVI, annual rainfall, distance from rivers/streams, roads, and settlements, were imported into different GIS layers at first, then arranged as the input of a model builder module of ArcGIS 10.5. This model enables running workflows containing a sequence of geo-processing tools to obtain assessment results efficiently. Secondly, all these criteria were incorporated using the raster calculator function in ArcGIS employing the following linear additive model:
Eco environmental   risk   index   ( ERI )   =   j = 1 n W j w i j
where Wj is the weight value of causative criteria’s j, wij is the weight value of class i of each causative criterion’s j, and n is the number of the causative factor.
The resulting ERI map has categories according to expert opinions as there are no general rules to categorize such continuous data automatically [61]. In this study, the resulting ERI map is classified into five levels, namely, low, moderate, high, very high, and extreme high risk zones according to the methods of natural breaks classification. The definition of risk level is shown in Table 2.

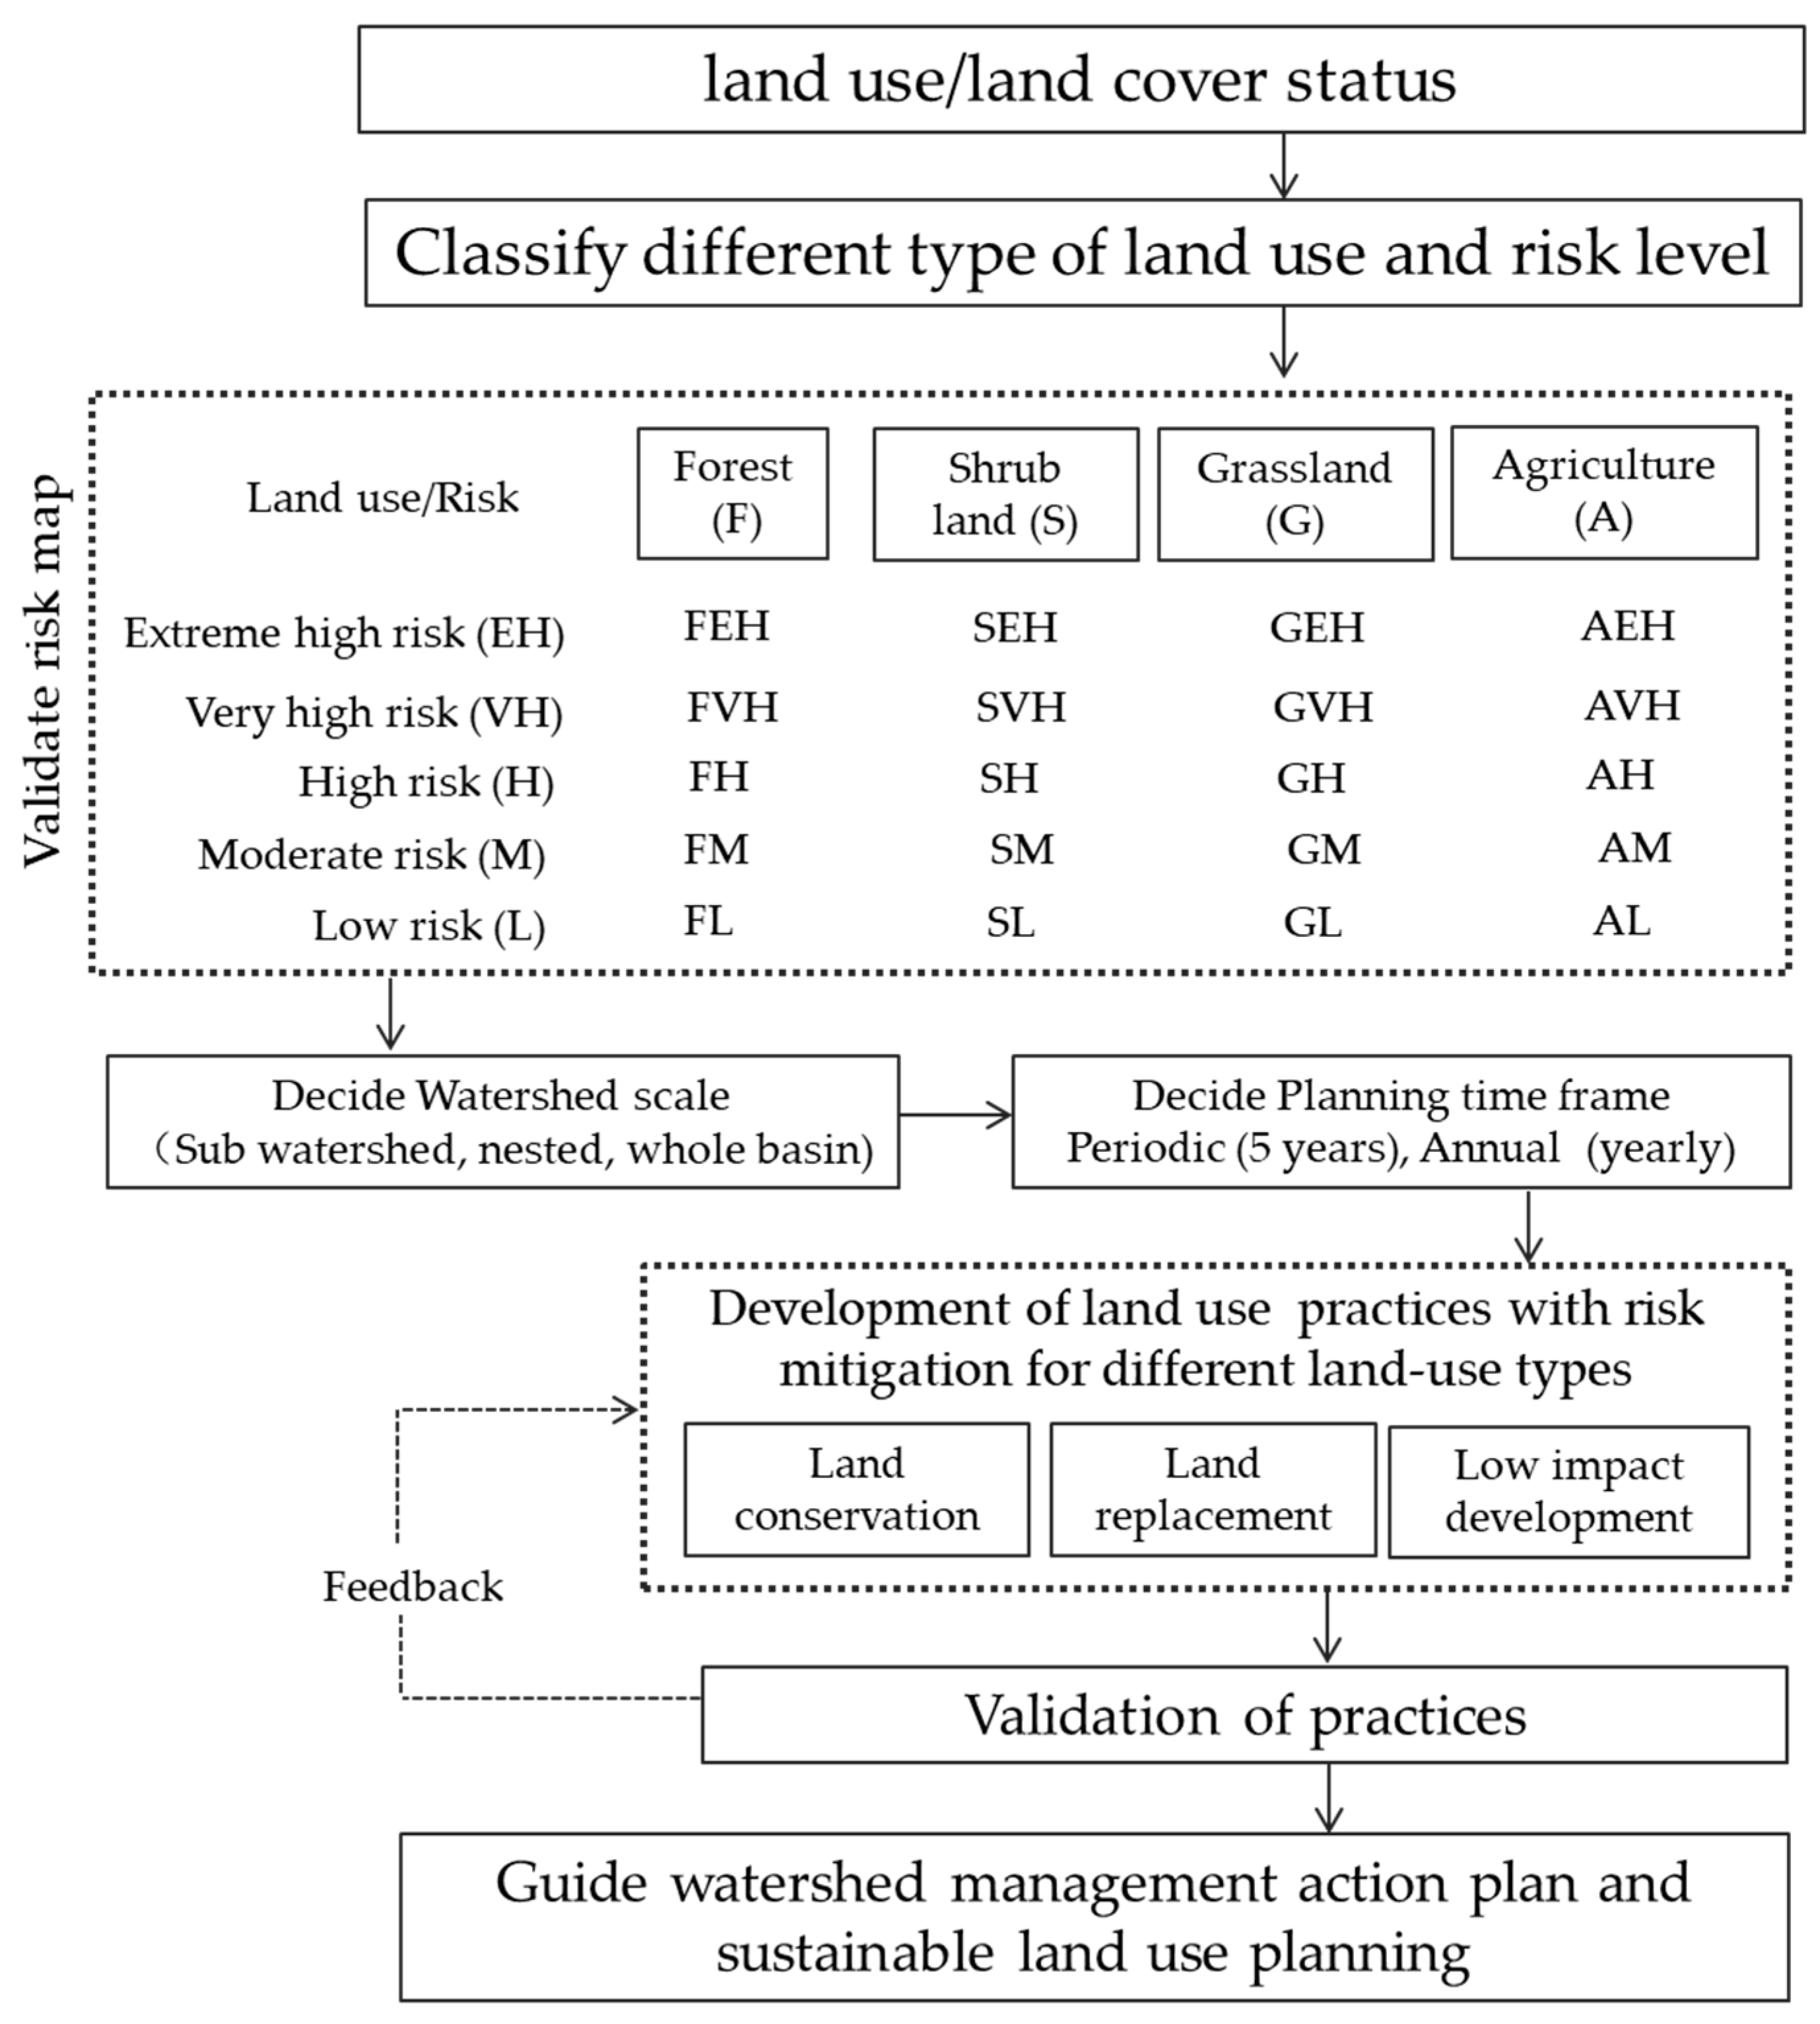
2.6. Development of aFramework for Land Use Planning

We developed a framework for land use planning (LUP) that provides an important scientific basis for supporting the strategies of ecological construction, regional development, and planning of management options. LUP integrates the conditions in the five categories of risks (extreme high, very high, high, moderate, and low) with four categories of land use types: forest, shrub land, grassland, agricultural farmland (see Figure 3). In this way, 20 land use types, for example forest with high risk (FH) and agricultural land with low risk (AL), were categorized. Secondly, all these categories were assigned into four different types of scenarios, namely, (i) restricted areas, (ii) priority control areas, (iii) control areas, and (iv) monitored areas. For the different level of scenarios, we provide important information to support the strategy of ecological construction and risk mitigation measures, including land conservation, land replacement, and low impact development (LID) practices. Land conservation measures serve to prevent human disturbances (protecting land of agricultural significance, protecting natural capital from encroachment), and land replacement (e.g., rehabilitation and/or avoidance of sites) serves to eliminate risk sources in eco-environmentally sensitive areas or transfer the sources to other sites. Low impact practices include protection of the quality and quantity of natural resources and minimization of land degradation establishing appropriate buffers between socio-economic development activities such as road network facilities, permeable pavements, and storage tanks, which can control risks related to surface runoff at their source through natural processes of infiltration, detention, storage, and purification. As the last step, land-use measures were validated, or adjusted as required, to ensure that environmental concerns were effectively addressed.

3. Results and Discussions

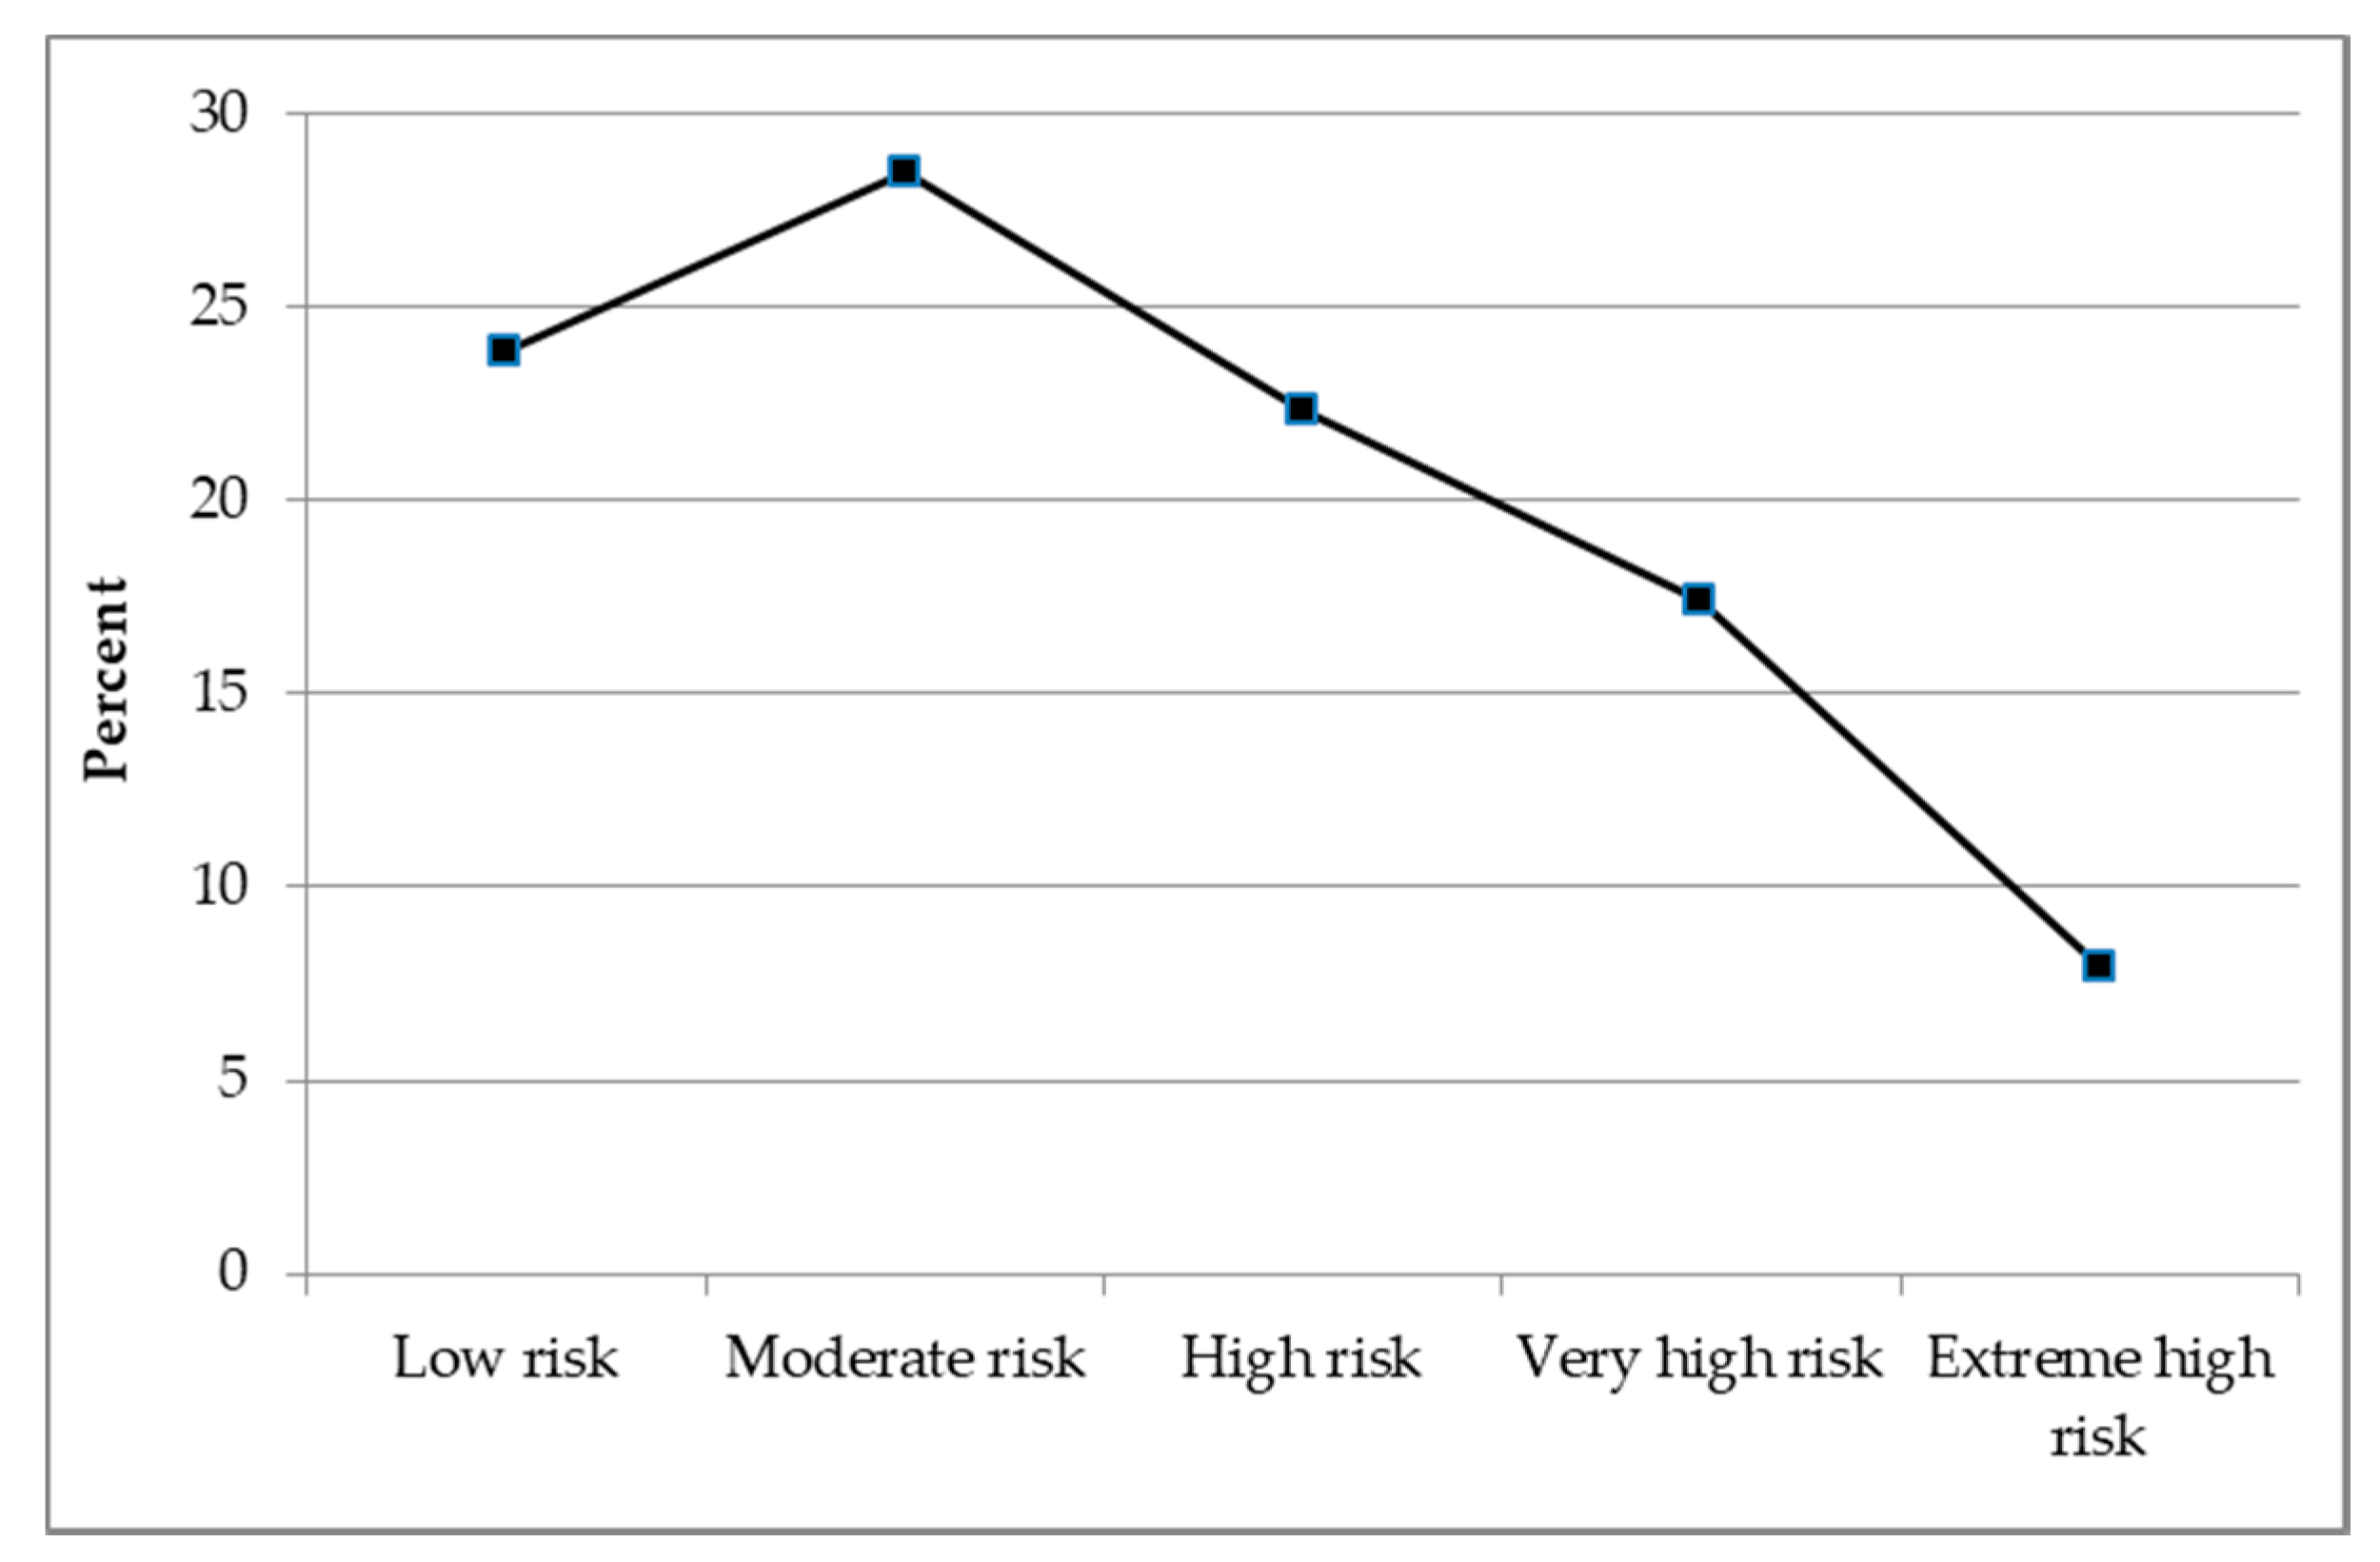
3.1. Spatial Distribution of Eco-Environmental Risk

The spatial distribution of eco-environmental risk levels for the Dordi river basin were calculated, using the level of calculated risk at each grid number multiplied by the grid area. An area of 111.10 km2, accounting for 22.36% of the total Dordi river basin, belongs to the high level of risk. Approximately 86.35 km2 (17.38%) and 39.43 km2 (7.93%) belong to very high level of risk and extreme high level of risk, respectively. This means that nearly half (>47.67%) of the total basin area is highly risky. The low and moderate zones accounted for 23.81% (118.29km2) and 28.49% (141.51km2), respectively (Table 3). A high level of eco-environmental risk occurs mostly in the north and northwest, but appears in patches in the south as well, whereas the level of moderate risk is concentrated in the southern parts of the river basin. Areas with a lower level of risk are scattered throughout the basin. In general, the risk is relatively light in center parts and heavy in northern parts (see Figure 4).
The eco-environmental risk level also closely correlates with altitude: high and very high levels of risk are mostly distributed in areas with an elevation above 2500 m. The extreme level of risk is distributed entirely above the elevation of 2500 m, whereas the moderate and light levels are mostly distributed in the lower elevation range of 1000 and 2500 m (see Figure 5 and Figure 6). It is interesting to note that all land use types contain all categories of risk, albeit in different proportions. Of the total 207.2 km2 of forest, 44.17% represent low risk, 34.50% moderate risk, and 21.31% of the high risk, very high, and extreme high risk. The high risk characteristics of these areas can be attributed both to their importance in providing ecosystem services and to their locations at higher elevations and steep slopes especially for the forest reserves. Shrub lands occupy12.88 km2 area, of which 77.12% is at high risk. The grass land use type is widely distributed in the study area, but 80.42% of its area is in high risk zones, mostly around the forest as well as in the buffer zones of the river. Additionally, one-fourth of the cultivated farmlands are at high risk mainly along the road network and river buffer zones. Table 4 provides the details.
Eco-environmental risk map especially for the high, very high, and extreme high areas requires verification [62]. The best way to physically validate the research findings is by conducting field observations, which is rather a difficult job logistics-wise [63]. However, this can be done on the basis of field information and past geo-meteorological events (e.g., landslides, rock falls, debris flows, etc.) [64]. In this study, we observed that the large number of eco-environmental risks such as landslides, debris flow, rock falls, and gully formation processes are clearly marked in the areas of abandoned farmlands and/or in the areas of high, very high, and extreme high areas of eco-environmental risk zones.
A large number of landslides, debris flows, and rock falls were observed along the bank of the river stream, and in areas influenced by development infrastructure constructions such as road networks, irrigation canals, water supply and hydropower project, and on the abandoned farmlands [6]. Sometimes landslides were observed spreading out in adjacent agricultural fields. Slope land plants in several places were severely affected by landslides, debris flows, and rock falls; sometimes these were destroyed heavily, exacting an adverse effect on the ecological and environmental conditions of the region. In all such locations, soil is exposed with an increasing extent of risk of soil erosion. These hazards also affect the fertility of the soil and may cause habitat destruction for wild animals to a large extent. Landslides were found in conditions of poor soil structure and poor vegetation resulting in high risk to nearby villages. A very large newly triggered landslide was observed in the slope uphill of Basnetgaun and Hiletaksar road. This slide was due to severe undercutting of the slope by the road construction in hill slopes covered by thin grasses and some trees. Another large debris flow with a wide debris fan was situated at the uphill slope of the settlement called Hile. Construction, poor vegetation, and the presence of soft weathered mudstone and sandstone were the main causes of this slide. An old rotational slide was also observed along the bank of the river and stream (see Figure 7). Although the entire slope is covered by moderately dense forest, the landslide scars are still visible. This slide occurred due to river incision. We checked the risk map prepared against all these conditions and found that the map reflected the realities on the ground. We conclude that our eco-environmental risk map represents the ground conditions and, therefore can be used as a scientific basis to guide land use planning in the study area.
The eco-environmental risk map was also validated using mathematical and statistical tools such as computation of geological hazards (e.g., landslides), density, and success rate curve [65]. In particular, the geological hazard density of each risk level, a ratio of observed landslide occurrences in a respective risk, gives the overall quality of the eco-environmental risk map [66]. Our results of such treatments are given in Table 5; landslide density for the extreme high risk zone is 0.0796, which is distinctly larger than for other risk zones. The landslide densities for very high, high, moderate, and low level of risk zones are respectively 0.0299, 0.0207, 0.0090, and 0.0033. These results show that there is gradual decrease in landslide density from the extreme high to low risk zones and there is also considerable separation in landslide density values between the different risk zones. A similar kind of success rate (85.3%) was found for one of the landslide susceptibility mappings conducted along the Dordi river basin [67]. This finding indicates that the eco-environmental risk increases with increasing elevation, which could reflect the harsh eco-environmental conditions at higher elevations which is in accordance with similar conclusions arrived at by other researchers in other countries such as China [17], Ethiopia [68], and Slovenia [69]. The study clearly indicates that landslides are frequently occurring natural hazards especially in high and very high risk areas that lead to massive destruction of life and property and sometimes lead to large-scale landscape transformations. Therefore, such concurrence of results from both methodologies allows concluding that the calculated eco-environmental risk map and classified risk zones are found to be in good agreement with occurrences of hazardous processes.

3.2. Land Use Planning Framework

We implemented a land use planning framework combining the risk zones with the existing four major land use types. This created 20 conditions that we assigned alphabetic nomenclature that appears as a matrix in Figure 8. A logical reasoning then followed: classification with nomenclatures such as “EFH, SEH, GEH, AEH, FVH, SVH, GVH, AVH” were considered as “restricted areas”. These zones are extremely eco-sensitive and vulnerable to natural and human disturbances. The eco-environmental conditions are severely polluted, and the ecosystems are crippled. In particular, risks in these areas are considered as unacceptable and thus require corrective actions.
The high risk zones with nomenclatures of “FH, SH, GH, AH” are assigned as “priority control areas”. These zones are highly eco-sensitive and vulnerable to natural and human disturbances. Therefore, development activities in these zones should be strictly restricted by the principal functional orientation. By taking ecological and resourceful advantage, the land use in such “priority control areas” should focus on the (i) development of ecological forestry, (ii) promotion of biodiversity, natural beauty, and physical endowments, (iii) promotion of suitable eco-tourism development, and (iv) preservation of cultural and natural heritages, while constructing an ecological tourism demonstration that could serve as world class tourist destinations with green tourism products and services.
The moderate risk land areas “FM, SM, GM, AM” areas are classified as “control areas” which are envisioned as optimized development zones in ecological planning. Development orientation of these areas should be adjusted to alleviate the impacts of production and construction on the ecological environment and act as a buffer for human activities. Specially in high altitudes, management should be transformed into ecological construction as integrative water protection and the establishment of a shelter belt for preventing land desertification and soil erosion and developing ecological agriculture. Suggested actions in these areas include low impact development (LID) practices and conservation of forest and farmland. LID-based land use practices such as strict control of industrial environmental pollution, and the presence or increase of vegetation coverage, restoration of lakes from farmland, and control of water loss and soil erosion are the chief tasks in ecological construction.
In the zones of low risk scenarios “FL, SL, GL, AL” are assigned as “monitoring” areas. Risks are acceptable and thus socio-economic development actions are optional. The ecosystem has a lower sensitivity degree to outside interferences, and the land resources and environment can support the demands of exploitation and construction. Thus, all areas of human settlement development that can be devoted to major infrastructure and utility systems can be developed. However, the important restrictive factor, that is shortage of water resources in the river basin, should be taken into full consideration in economic and social activities insistently, and the water-saving construction system is in urgent need of construction. In the southern and riverbed plain area, there is a favorable natural condition with a pleasant subtropical humid climate, fertile soil condition, and plentiful wetland resource. The modern agricultural production system should be developed considering timely ecological restoration to prevent destruction of landscapes and large areas of water loss and soil erosion.
Further, the areas suggested for monitoring can be divided into two classes namely, farmlands and built-up areas. The settlements of Tillar, Ramchokbesi, Basnetgaun, Hile, Majhgaun, Chisapani, Tiwari danda, Karki Danda, Nauthar, and Sera are potentially the most important bases for the socio-economic development of the whole Dordi river basin. These areas are suitable primarily for the residential portion of the built-up environment. Thus the emphasis should be made to ensure the following achievements: (a) integration of activities within and among settlements and efficient production and movement of people and commodities, and (b) access of the population to housing, education, health care, recreation, transportation and communication, sanitation, and basic utilities such as water, power, waste disposal, and other services. However, farmlands of these prefectures are highly threatened by abandonment. Thus, in areas where water is available for irrigation, trees, shrubs, and grass belts should be planted as barrier fences or small plots in order to reduce the rate of desertification and reclamation of lost lands.
In the mountainous regions of Nepal, there are mainly four types of land use, forest, shrub land, grassland, and farmland, that contain many valuable areas of conservation, despite significant transformations to the landscape [70]. Primarily, the vegetation barrier could break the wind velocity preventing sands from blowing laterally up the slope land. These infrastructures form a network of natural and semi-natural areas, such as existing forests and plantations; they enhance ecosystem health and resilience, minimizing natural disaster risks, including lowering surface water runoff which reduces the risk of flooding, connecting habitats, and mitigating mountain disaster effects; they also contribute to biodiversity conservation in an integrated manner, improving flora and fauna, and human well-being. They can also protect farmlands, conserve water and soils, and provide wood for fuel. In addition, green infrastructure offers a promising way to integrate biodiversity and ecosystem services in the mountain landscape. However, maintaining and enhancing these areas requires a policy objective from Nepalese governments at all levels of the governing system [71]. Therefore, this study incorporated forests, shrubs, grasslands, and farmlands at the land use planning stage.
The current conservation areas in the greater mountain areas are in place for a range of historical reasons, including their scenic and recreational values, their non-suitability for various land use, the influence of lobby groups, and the tenure of the land. Since the Third Five-Year Plan (1965–1970), the Nepalese governments have established a holistic approach to managing watershed resources that integrate forestry, agriculture, pasture, and water management, with an objective of sustainable management of natural resources. This approach seeks to promote interactions among multiple stakeholders within and between the upstream and downstream locations of a watershed. However, these experiences suggest that these ideals of watershed management do not appear to be strongly linked with the eco-environmental risk assessment and/or developed solely for conservation values [72]. Regarding the eco-environmental risk level, we categorized these four land use types as restricted areas, priority control areas, control areas, and monitoring areas. This can be used to assess the efficacy of current conservation areas and to identify land that is more likely to protect areas. Comparison of different risk scenarios and a mechanism for a constant dialogue between policymakers, practitioners, and communities at the landscape level would help in linking the upstream and downstream ecology to improve the livelihoods of the local people and sustainable watershed resource management.

4. Conclusions and Recommendations

This study evaluates eco-environmental risk conditions for the Dordi river basin located in the high mountains of the Nepalese Himalayas, produces a risk map, and develops a land planning framework. The proposed land use planning framework can help to achieve better outcomes for preventing further eco-environmental changes and loss of biodiversity. This can be used as a scientific basis to carry forward plans and enforce them, and/or for mobilizing public participation in land and to create a political leverage to support the planning processes. Likewise, the maps produced by this research may also help in facilitating improved collaboration between agencies responsible for land use planning, environmental management, and the private sector and non-governmental organization (NGO/INGOs) who work on various aspects of community development, serving as a common understanding of the situation. In addition, the land use planning tools demonstrated in this study can serve land managers and conservationists as a sophisticated analytical tool beyond simple rules of thumb. It can be used for designing and implementing the much-needed innovative financial incentives, and for discouraging risk-prone development. Moreover, this risk assessment allows an important link in understanding regional eco-environmental risk situation, making land use, natural resources, and environmental management. However, the analysis presented here does have limitations: reasonable data for the specific task of interest are not available in Nepal. For this study, the risk distribution maps were derived from secondary data on elevation, slope, aspect, soil, geology, land use, NDVI, rainfall, distance to river, settlements, and roads, and using expert opinions and field visits. More detailed field-surveyed data could yield better granularity and accuracy. Nonetheless, the results convincingly allow us to make the following suggestions to the national and local governmental authorities to take steps for the effective and practical application to the recovery of the local ecosystem.
-
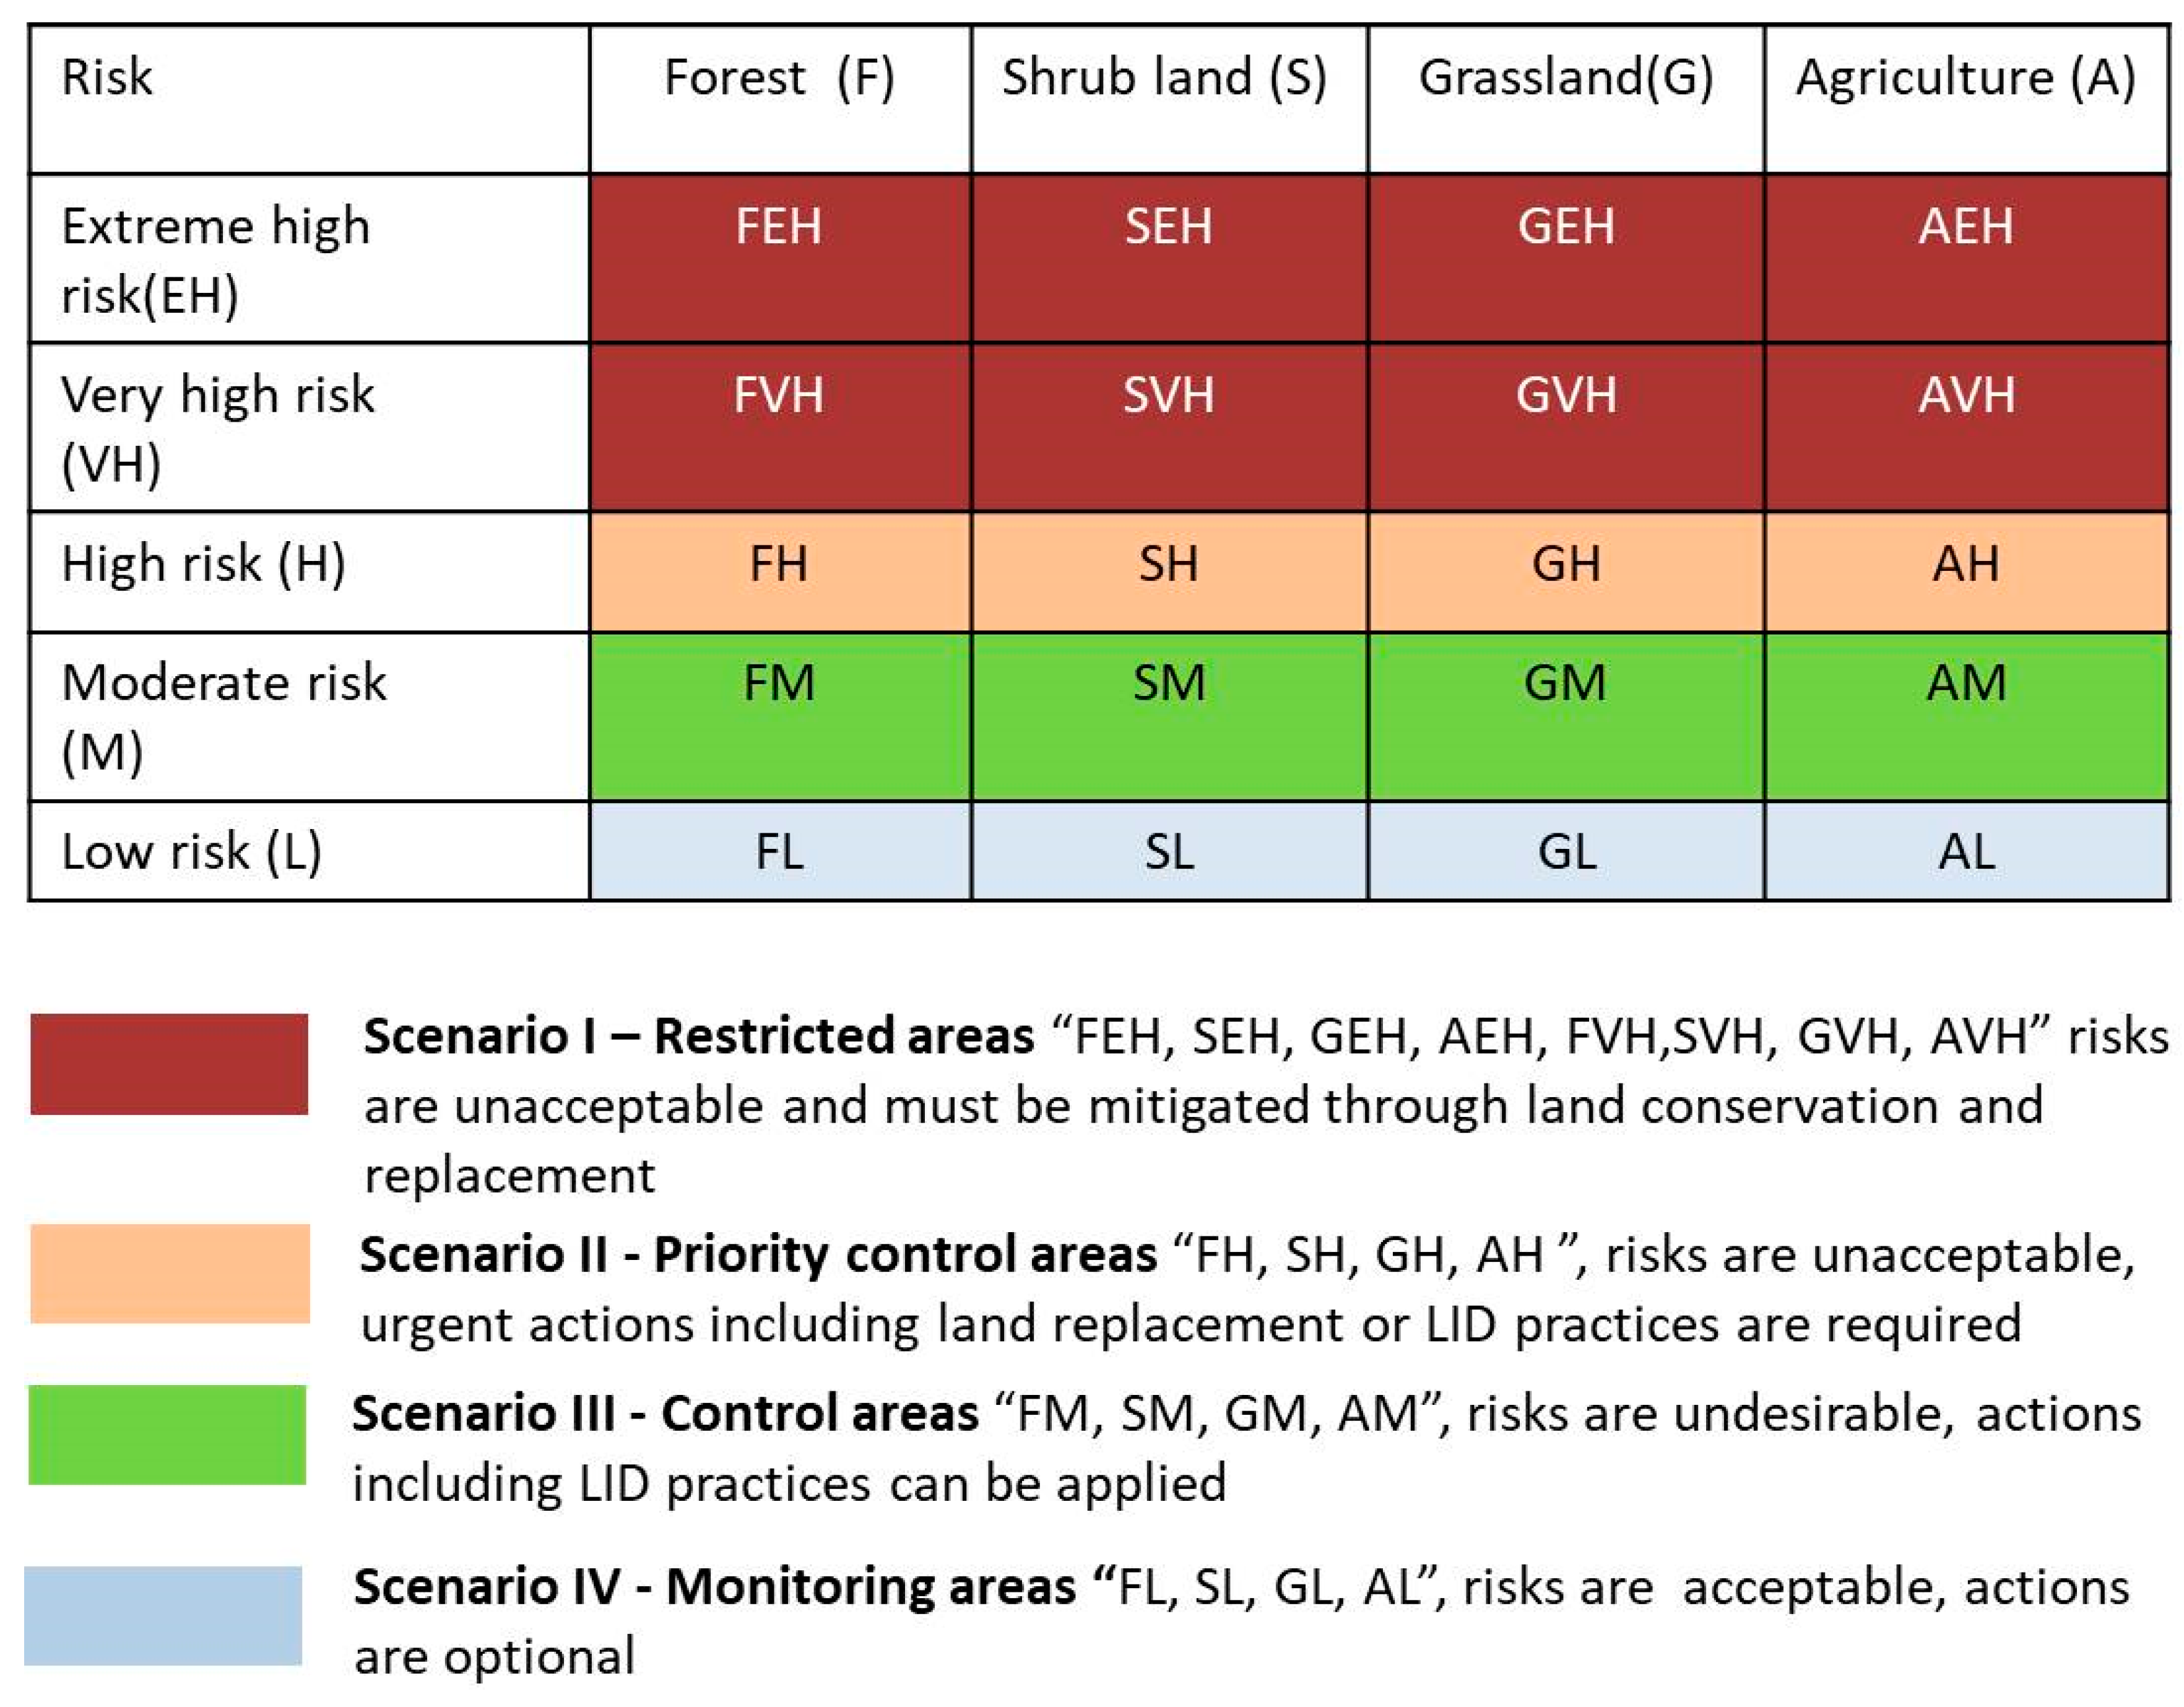
Region of strict protection: the region where eco-environmental risk is high, very high, and extreme is identified as the region of strict protection. This area constitutes nearly half (48%) of the basin. Considering the status of the area, all the development activities must be effectively monitored by the local government authority, and a proper reclamation plan for ecological recovery should be immediately put in place. Comprehensive strategy for combating hazard risks should be implemented. Also, human activities should be reduced as much as possible and eco-restoration activities should be initiated immediately.
-
Region of priority control: area under moderate and low risk constitutes more than half (52%) of the total area. It is suggested for focal protection. In this region the improved implementation of conservation measures is needed. This can be achieved by providing alternative sources of income to local people. Active participation of the local people in eco-restoration is recommended. Awareness of these trade-offs can underpin effective land use allocation that promotes sustainable land management and multifunctional land system through the efficient supply of multiple ecosystem services.

Supplementary Materials

The following is available online at https://www.mdpi.com/2071-1050/11/24/6931/s1, Table S1: AHP method, pairwise comparison matrix and normalized principal eigenvector for eco-environmental risk assessment criteria’s, and for the classes within each criterion.

Author Contributions

Conceptualization, S.C.; field survey conduction, S.C.; data curation, S.C.; writing—original draft preparation, S.C.; writing—review and editing, S.C., YW, A.M.D., and N.R.K.; supervision, Y.W., A.M.D., and N.R.K.; design guidance, A.M.D., N.R.K., P.X., K.Y., Q.L., Y.L., and M.L.; discussion, A.M.D., N.R.K., P.X., K.Y., Q.L., Y.L., and M.L.

Funding

This research was funded by the 135 Strategic Program of the Institute of Mountain Hazards and Environment, Chinese Academy of Science, grant number SDS–135-1703; International talent program of the Chinese Academy of the Sciences, grant number 2019 VCA 0026; and the Chinese Academy of Sciences-the World Academy of Sciences (CAS-TWAS) Presidents Fellowship program for international PhD study.

Acknowledgments

We are extremely grateful to the Central Department of Geography (CDG) and National Society for Earthquake Technology (NSET), for sharing their valuable dataset and review of the manuscript. The authors are grateful for the constructive comments from the editor and anonymous reviewers.

Conflicts of Interest

The authors declare no conflicts of interest.

References

  1. Latocha, A. Land-use changes and longer-term human–environment interactions in a mountain region (Sudetes Mountains, Poland). Geomorphology 2009, 108, 48–57. [Google Scholar] [CrossRef]
  2. Huber, R.; Rigling, A.; Bebi, P.; Brand, F.S.; Briner, S.; Buttler, A.; Elkin, C.; Gillet, F.; Grêt-Regamey, A.; Hirschi, C.; et al. Sustainable land use in mountain regions under global change: Synthesis across scales and disciplines. Ecol. Soc. 2013, 18, 36. [Google Scholar] [CrossRef] [Green Version]
  3. Awasthi, K.; Sitaula, B.K.; Singh, B.R.; Bajacharaya, R.M. Land-use change in two Nepalese watersheds: GIS and geomorphometric analysis. Land Degrad. Dev. 2002, 13, 495–513. [Google Scholar] [CrossRef]
  4. Paudel, G.S.; Thapa, G.B. Changing farmers’ land management practices in the hills of Nepal. Environ. Manag. 2001, 28, 789–803. [Google Scholar] [CrossRef]
  5. Paudel, B.; Gao, J.; Zhang, Y.; Wu, X.; Li, S.; Yan, J. Changes in cropland status and their driving factors in the Koshi River basin of the Central Himalayas, Nepal. Sustainability 2016, 8, 933. [Google Scholar] [CrossRef] [Green Version]
  6. Chaudhary, S.; Wang, Y.; Khanal, N.; Xu, P.; Fu, B.; Dixit, A.; Yan, K.; Liu, Q.; Lu, Y. Social Impact of Farmland Abandonment and Its Eco-Environmental Vulnerability in the High Mountain Region of Nepal: A Case Study of Dordi River Basin. Sustainability 2018, 10, 2331. [Google Scholar] [CrossRef] [Green Version]
  7. Khanal, N.; Watanabe, T. Abandonment of Agricultural Land and Its Consequences: A Case Study in the Sikles Area, Gandaki Basin, Nepal Himalaya. Mt. Res. Dev. 2006, 26, 32–40. [Google Scholar] [CrossRef] [Green Version]
  8. Jamshidi, R.; Dragovich, D.; Webb, A.A. Distributed empirical algorithms to estimate catchment scale sediment connectivity and yield in a subtropical region. Hydrol. Process. 2014, 28, 2671–2684. [Google Scholar] [CrossRef]
  9. Anache, J.A.; Flanagan, D.C.; Srivastava, A.; Wendland, E.C. Land use and climate change impacts on runoff and soil erosion at the hillslope scale in the Brazilian Cerrado. Sci. Total Environ. 2018, 622, 140–151. [Google Scholar] [CrossRef]
  10. García-Ruiz, J.M.; Lana-Renault, N. Hydrological and erosive consequences of farmland abandonment in Europe, with special reference to the Mediterranean region–A review. Agric. Ecosyst. Environ. 2011, 140, 317–338. [Google Scholar] [CrossRef]
  11. Lin, W.-T.; Lin, C.; Tsai, J.; Huang, P. Eco-environmental changes assessment at the Chiufenershan landslide area caused by catastrophic earthquake in Central Taiwan. Ecol. Eng. 2008, 33, 220–232. [Google Scholar] [CrossRef]
  12. Walker, R.; Landis, W.; Brown, P. Developing a regional ecological risk assessment: A case study of a Tasmanian agricultural catchment. Hum. Ecol. Risk Assess. 2001, 7, 417–439. [Google Scholar] [CrossRef]
  13. Enete, I.; Alabi, M.; Adoh, E. Evaluation of eco-environmental vulnerability in Efon Alaye using remote sensing and Geographic Information System (GIS) techniques. J. Sustain. Dev. Afr. 2010, 12, 199–212. [Google Scholar]
  14. Jin, X.; Jin, Y.; Mao, X. Ecological risk assessment of cities on the Tibetan Plateau based on land use/land cover changes—Case study of Delingha City. Ecol. Indic. 2019, 101, 185–191. [Google Scholar] [CrossRef]
  15. Suter, G.W. Endpoints for regional ecological risk assessments. Environ. Manag. 1990, 14, 9–23. [Google Scholar] [CrossRef] [Green Version]
  16. Nandy, S.; Singh, C.; Das, K.K.; Kingma, N.C.; Kushwaha, S.P.S. Environmental vulnerability assessment of eco-development zone of Great Himalayan National Park, Himachal Pradesh, India. Ecol. Indic. 2015, 57, 182–195. [Google Scholar] [CrossRef]
  17. Dai, X.; Li, Z.; Lin, S.; Xu, W. Assessment and zoning of eco-environmental sensitivity for a typical developing province in China. Stoch. Environ. Res. Risk Assess. 2012, 26, 1095–1107. [Google Scholar] [CrossRef]
  18. Jones, R.N. An environmental risk assessment/management framework for climate change impact assessments. Nat. Hazards 2001, 23, 197–230. [Google Scholar] [CrossRef]
  19. Chambers, R. Sustainable Livelihoods: An Opportunity for the World Commission on Environment and Development; Institute of Development Studies, University of Sussex: Brighton, UK, 2011. [Google Scholar]
  20. Giri, S.; Qiu, Z. Understanding the relationship of land uses and water quality in Twenty First Century: A review. J. Environ. Manag. 2016, 173, 41–48. [Google Scholar] [CrossRef] [Green Version]
  21. Wang, X.; Zhong, X.H.; Liu, S.Z.; Liu, J.G.; Wang, Z.Y.; Li, M.H. Regional assessment of environmental vulnerability in the Tibetan Plateau: Development and application of a new method. J. Arid Environ. 2008, 72, 1929–1939. [Google Scholar] [CrossRef]
  22. Shao, H.; Sun, X.; Wang, H.; Zhang, X.; Xiang, Z.; Tan, R.; Chen, X.; Xian, W.; Qi, J. A method to the impact assessment of the returning grazing land to grassland project on regional eco-environmental vulnerability. Environ. Impact Assess. Rev. 2016, 56, 155–167. [Google Scholar] [CrossRef]
  23. Tian, P.; Li, J.; Gong, H.; Pu, R.; Cao, L.; Shao, S.; Shi, Z.; Feng, X.; Wang, L.; Liu, R.; et al. Research on Land Use Changes and Ecological Risk Assessment in Yongjiang River Basin in Zhejiang Province, China. Sustainability 2019, 11, 2817. [Google Scholar] [CrossRef] [Green Version]
  24. Tran, L.T.; O’Neill, R.V.; Smith, E.R. Spatial pattern of environmental vulnerability in the Mid-Atlantic region, USA. Appl. Geogr. 2010, 30, 191–202. [Google Scholar] [CrossRef]
  25. Liu, J.; Li, Y.; Zhang, B.; Cao, J.; Cao, Z.; Domagalski, J. Ecological risk of heavy metals in sediments of the Luan River source water. Ecotoxicology 2009, 18, 748–758. [Google Scholar] [CrossRef] [PubMed]
  26. Galic, N.; Schmolke, A.; Forbes, V.; Baveco, H.; van den Brink, P.J. The role of ecological models in linking ecological risk assessment to ecosystem services in agroecosystems. Sci. Total Environ. 2012, 415, 93–100. [Google Scholar] [CrossRef] [Green Version]
  27. Pradhan, B.; Lee, S. Landslide risk analysis using artificial neural network model focussing on different training sites. Int. J. Phys. Sci. 2009, 4, 1–15. [Google Scholar]
  28. Wang, B.; Yu, G.; Huang, J.; Wang, T.; Hu, H. Probabilistic ecological risk assessment of OCPs, PCBs, and DLCs in the Haihe River, China. Sci. World J. 2010, 10, 1307–1317. [Google Scholar] [CrossRef] [Green Version]
  29. Anjaneyulu, Y.; Manickam, V. Environmental Impact Assessment Methodologies; BS Publications: Hyderabad, India, 2011. [Google Scholar]
  30. Skidmore, A. Environmental Modelling with GIS and Remote Sensing; CRC Press: Boca Raton, FL, USA, 2003. [Google Scholar]
  31. Tie, Y.; Tang, C. Application of AHP in single debris flow risk assessment. Chin. J. Geol. Hazard Control 2006, 4, 79–84. [Google Scholar]
  32. Wong, J.K.; Li, H. Application of the analytic hierarchy process (AHP) in multi-criteria analysis of the selection of intelligent building systems. Build. Environ. 2008, 43, 108–125. [Google Scholar] [CrossRef]
  33. Ying, X.; Zeng, G.; Chen, G.; Tang, L.; Wang, K.; Huang, D. Combining AHP with GIS in synthetic evaluation of eco-environment quality—A case study of Hunan Province, China. Ecol. Model. 2007, 209, 97–109. [Google Scholar] [CrossRef]
  34. Ishizaka, A.; Labib, A. Analytic hierarchy process and expert choice: Benefits and limitations. Or Insight 2009, 22, 201–220. [Google Scholar] [CrossRef] [Green Version]
  35. Aryafar, A.; Yousefi, S.; Ardejani, F.D. The weight of interaction of mining activities: Groundwater in environmental impact assessment using fuzzy analytical hierarchy process (FAHP). Environ. Earth Sci. 2013, 68, 2313–2324. [Google Scholar] [CrossRef]
  36. Malczewski, J.; Rinner, C. Multicriteria Decision Analysis in Geographic Information Science; Springer: New York, NY, USA, 2015. [Google Scholar]
  37. LRMP. Land Capability Map; Land Resource Mapping Project: Kathmandu, Nepal, 1986. [Google Scholar]
  38. Dijkshoorn, J.; Huting, J. Soil and Terrain Databse for Nepal (1.1 million); ISRIC—World Soil Information: Wageningen, The Netherlands, 2009. [Google Scholar]
  39. Needelman, B.A.; Gburek, W.J.; Petersen, G.W.; Sharpley, A.N.; Kleinman, P.J.A. Surface runoff along two agricultural hillslopes with contrasting soils. Soil Sci. Soc. Am. J. 2004, 68, 914–923. [Google Scholar] [CrossRef]
  40. Gritzner, M.L.; Marcus, W.A.; Aspinall, R.; Custer, S.G. Assessing landslide potential using GIS, soil wetness modeling and topographic attributes, Payette River, Idaho. Geomorphology 2001, 37, 149–165. [Google Scholar] [CrossRef]
  41. Deoja, B.; Dhital, M.R.; Thapa, B.; Wagner, A. Mountain Risk Engineering Handbook: Vol I; International Centre for Integrated Mountain Development (ICIMOD): Kathmandu, Nepal, 1991. [Google Scholar]
  42. Li, Z.-W.; Zeng, G.; Zhang, H.; Yang, B.; Jiao, S. The integrated eco-environment assessment of the red soil hilly region based on GIS—A case study in Changsha City, China. Ecol. Model. 2007, 202, 540–546. [Google Scholar] [CrossRef]
  43. El-Ramly, H.; Morgenstern, N.; Cruden, D. Probabilistic slope stability analysis for practice. Can. Geotech. J. 2002, 39, 665–683. [Google Scholar] [CrossRef]
  44. Dhital, M.R. Geology of the Nepal Himalaya: Regional Perspective of the Classic Collided Orogen; Springer: New York, NY, USA, 2015. [Google Scholar]
  45. Bangash, R.F.; Passuello, A.; Sanchez-Canales, M.; Terrado, M.; López, A.; Elorza, F.J.; Ziv, G.; Acuña, V.; Schuhmacher, M. Ecosystem services in Mediterranean river basin: Climate change impact on water provisioning and erosion control. Sci. Total Environ. 2013, 458, 246–255. [Google Scholar] [CrossRef]
  46. Oluwasemire, K.; Alabi, S. Ecological impact of changing rainfall pattern, soil processes and environmental pollution in the Nigerian Sudan and northern Guinea savanna agro-ecological zones. Niger. J. Soil Environ. Res. 2004, 5, 23–31. [Google Scholar] [CrossRef]
  47. Promper, C.; Puissant, A.; Malet, J.; Glade, T. Analysis of land cover changes in the past and the future as contribution to landslide risk scenarios. Appl. Geogr. 2014, 53, 11–19. [Google Scholar] [CrossRef]
  48. Nisbet, T. The role of forest management in controlling diffuse pollution in UK forestry. For. Ecol. Manag. 2001, 143, 215–226. [Google Scholar] [CrossRef]
  49. Pettorelli, N.; Ryan, S.; Mueller, T.; Bunnefeld, N.; Jędrzejewska, B.; Lima, M.; Kausrud, K. The Normalized Difference Vegetation Index (NDVI): Unforeseen successes in animal ecology. Clim. Res. 2011, 46, 15–27. [Google Scholar] [CrossRef]
  50. Collins, A.L.; Walling, D.E. Documenting catchment suspended sediment sources: Problems, approaches and prospects. Prog. Phys. Geogr. 2004, 28, 159–196. [Google Scholar] [CrossRef]
  51. Nuissl, H.; Haase, D.; Lanzendorf, M.; Wittmer, H. Environmental impact assessment of urban land use transitions—A context-sensitive approach. Land Use Policy 2009, 26, 414–424. [Google Scholar] [CrossRef]
  52. Cui, E.; Ren, L.; Sun, H. Evaluation of variations and affecting factors of eco-environmental quality during urbanization. Environ. Sci. Pollut. Res. 2015, 22, 3958–3968. [Google Scholar] [CrossRef]
  53. Marston, R.A.; Miller, M.M.; Devkota, L.P. Geoecology and mass movement in the Manaslu-Ganesh and Langtang-Jugal himals, Nepal. Geomorphology 1998, 26, 139–150. [Google Scholar] [CrossRef]
  54. Barnard, P.L.; Owen, L.A.; Sharma, M.C.; Finkel, R.C. Natural and human-induced landsliding in the Garhwal Himalaya of northern India. Geomorphology 2001, 40, 21–35. [Google Scholar] [CrossRef]
  55. Devkota, K.C.; Regmi, A.D.; Pourghasemi, H.R.; Yoshida, K.; Pradhan, B.; Ryu, I.C.; Dhital, M.R.; Althuwaynee, O.F. Landslide susceptibility mapping using certainty factor, index of entropy and logistic regression models in GIS and their comparison at Mugling–Narayanghat road section in Nepal Himalaya. Nat. Hazards 2013, 65, 135–165. [Google Scholar] [CrossRef]
  56. Cao, Y.; Wu, Y.; Zhang, Y.; Tian, J. Landscape pattern and sustainability of a 1300-year-old agricultural landscape in subtropical mountain areas, Southwestern China. Int. J. Sustain. Dev. World Ecol. 2013, 20, 349–357. [Google Scholar] [CrossRef]
  57. Landis, W.G.; Wiegers, J.K. Ten years of the relative risk model and regional scale ecological risk assessment. Hum. Ecol. Risk Assess. 2007, 13, 25–38. [Google Scholar] [CrossRef]
  58. Saaty, T.L. How to make a decision: The analytic hierarchy process. Eur. J.Oper. Res. 1990, 48, 9–26. [Google Scholar] [CrossRef]
  59. Saaty, T.L. A scaling method for priorities in hierarchical structures. J.Math. Psychol. 1977, 15, 234–281. [Google Scholar] [CrossRef]
  60. Saaty, T.L. Decision making with the analytic hierarchy process. Int. J.Serv. Sci. 2008, 1, 83–98. [Google Scholar] [CrossRef] [Green Version]
  61. Ayalew, L.; Yamagishi, H.; Ugawa, N. Landslide susceptibility mapping using GIS-based weighted linear combination, the case in Tsugawa area of Agano River, Niigata Prefecture, Japan. Landslides 2004, 1, 73–81. [Google Scholar] [CrossRef]
  62. Kwak, B.K.; Kim, J.H.; Park, H.; Kim, N.G.; Choi, K.; Yi, J. A GIS-based national emission inventory of major VOCs and risk assessment modeling: Part II—quantitative verification and risk assessment using an air dispersion model. Korean J.Chem. Eng. 2010, 27, 121–128. [Google Scholar] [CrossRef]
  63. Roslee, R.; Mickey, A.C.; Simon, N.; Norhisham, M.N. Landslide susceptibility analysis (LSA) using weighted overlay method (WOM) along the Genting Sempah to Bentong Highway, Pahang. Malays. J. Geosci. 2017, 1, 13–19. [Google Scholar] [CrossRef]
  64. Tehrany, M.S.; Pradhan, B.; Jebur, M.N. Flood susceptibility analysis and its verification using a novel ensemble support vector machine and frequency ratio method. Stoch. Environ. Res. Risk Assess. 2015, 29, 1149–1165. [Google Scholar] [CrossRef]
  65. Nandi, A.; Shakoor, A. A GIS-based landslide susceptibility evaluation using bivariate and multivariate statistical analyses. Eng. Geol. 2010, 110, 11–20. [Google Scholar] [CrossRef]
  66. Zou, Q.; Cui, P.; Zhang, J.; Xiang, L. Quantitative evaluation for susceptibility of debris flow in upper Yangtze River basin. Environ. Sci. Technol. 2012, 35, 159–163. [Google Scholar]
  67. Pokhrel, P.; Pathak, D. Landslide susceptibility mapping of southern part of Marsyangdi River basin, West Nepal using logistic regression method.international journal of geomatics and geosciences. Int. J. Geomat. Geosci. 2010, 7, 24–32. [Google Scholar]
  68. Seid, A.; Gadisa, E.; Tsegaw, T.; Abera, A.; Teshome, A.; Mulugeta, A.; Herrero, M.; Argaw, D.; Jorge, A.; Kebede, A.; et al. Risk map for cutaneous leishmaniasis in Ethiopia based on environmental factors as revealed by geographical information systems and statistics. Geospat. Health 2014, 8, 377–387. [Google Scholar] [CrossRef]
  69. Komac, M. A landslide susceptibility model using the analytical hierarchy process method and multivariate statistics in perialpine Slovenia. Geomorphology 2006, 74, 17–28. [Google Scholar] [CrossRef]
  70. Cowell, R.; Lennon, M. The utilisation of environmental knowledge in land-use planning: Drawing lessons for an ecosystem services approach. Environ. Plan. C Gov. Policy 2014, 32, 263–282. [Google Scholar] [CrossRef] [Green Version]
  71. Nagendra, H.; Karmacharya, M.; Karna, B. Evaluating forest management in Nepal: Views across space and time. Ecol. Soc. 2005, 10, 24. [Google Scholar] [CrossRef]
  72. Pandit, B.H.; Wagley, M.P.; Neupane, R.P.; Adhikary, B.R. Watershed management and livelihoods: Lessons from Nepal. J. For. Livelihood 2007, 6, 67–75. [Google Scholar]
Figure 1. Location map of the study area.
Sustainability 11 06931 g001
Figure 2. Determining criteria weight in the analytic hierarchy process (AHP) model. NDVI: normalized difference vegetation index; CI: consistency index.
Sustainability 11 06931 g002
Figure 3. A framework for guiding land use practices.
Sustainability 11 06931 g003
Figure 4. Eco-environmental risk map of Dordi river basin.
Sustainability 11 06931 g004
Figure 5. Distribution of the eco-environmental risk.
Sustainability 11 06931 g005
Figure 6. Distribution of eco-environmental risk in relation to altitude.
Sustainability 11 06931 g006
Figure 7. Occurrence of landslides with or without abandoned farmland in Dordi river basin; (a) A large landslide near the settlement of Chiti; (b) debris flow near Basnetgaun; (c) landslide occurrence along the road of Hile-Nauthar; (d) large landslides at Basnetgaun-Hile road. Source: field survey, 2018.
Sustainability 11 06931 g007
Figure 8. Land use planning framework combining land uses and risk level.
Sustainability 11 06931 g008
Table 1. Random consistency index [58,59].
n123456789101112131415
RI000.580.901.121.241.321.411.451.491.511.531.561.571.59
Table 2. Eco-environmental risk classification in the Dordi river basin.
Risk classificationEco-environmental risk index(ERI)Character description
Low risk>0.15The eco-environmental system is stable including strong risk resistance, fertile soil, relatively low altitude, and great vegetation coverage.
Moderate risk0.15–0.20The eco-environmental system is relatively stable including risk resistance, fertile soil, relatively low altitude, and better vegetation coverage.
High risk0.20–0.25The eco-environmental system is relatively unstable including relatively poor risk resistance, relatively barren soil, and relatively complicated vegetation types.
Very high risk0.25–0.30The eco-environmental system is unstable including poor risk resistance, barren soil, and few vegetation types.
Extreme high risk>30The eco-environmental system is extremely unstable including poor risk resistance, relatively high altitude, barren soil, and sparse vegetation that are mainly hardy plants.
Table 3. Area and proportion of eco-environmental risk in the Dordi river basin.
Risk levelERINumber of GridArea (km2)Percentage
Low risk<0.15112,762118.2923.81
Moderate risk0.15–0.20134,889141.5128.49
High risk0.20–0.25105,900111.1022.36
Very high risk0.25–0.3082,31186.3517.38
Extreme high risk>0.3037,59039.437.93
Table 4. Extent of risk on different land use type.
Land useForestShrub landGrasslandAgriculture
Area (km2)207.2 (46.20%)12.88(2.88%)61.16 (13.64%)71.25 (15.89%)
Low (km2)91.53 (44.17%)0.41(3.25%)0.18 (0.30%)14.53(20.39%)
Medium(km2)71.49 (34.50%)2.52(19.62%)11.78(19.27%)38.33(53.80%)
High(km2)38.29 (18.47%)5.96(46.30%)24.63(40.28%)15.48(21.73%)
Very high(km2)5.81(2.80%)3.72(28.91%)20.19(33.02%)2.87(4.03%)
Extreme high (km2)0.067 (0.03%)0.24(1.90%)4.35(7.11%)0.02(0.03%)
Table 5. Observed geological hazard density in the different risk zones of the eco-environmental risk map.
Eco-environmental risk zonesAreaHazard areaLandslide density
(km2)(%)(km2)(%)
Low risk118.2923.810.404.110.0033
Moderate risk141.5128.491.2813.170.0090
High risk111.1022.362.3123.770.0207
Very high risk86.3517.382.5926.640.0299
Extreme high risk39.437.933.1432.300.0796

