Article

Mapping Bioenergy Supply and Demand in Selected Least Developed Countries (LDCs): Exploratory Assessment of Modern Bioenergy’s Contribution to SDG7

by
Dilip Khatiwada
1,*,
Pallav Purohit
2 and
Emmanuel Kofi Ackom
3
1
Division of Energy Systems, Department of Energy Technology, School of Industrial Engineering and Management, KTH Royal Institute of Technology, Brinellvägen 68, 100 44 Stockholm, Sweden
2
Air Quality and Greenhouse Gases (AIR) Program, International Institute for Applied Systems Analysis (IIASA), Schlossplatz 1, A-2361 Laxenburg, Austria
3
UNEP DTU Partnership, UN City Campus, Department of Technology, Management and Economics, Denmark Technical University (DTU), Marmorvej 51, 2100 Copenhagen, Denmark
*
Author to whom correspondence should be addressed.
Sustainability 2019, 11(24), 7091; https://doi.org/10.3390/su11247091
Submission received: 23 October 2019 / Revised: 4 December 2019 / Accepted: 7 December 2019 / Published: 11 December 2019
(This article belongs to the Special Issue Modern Bioenergy for Sustainable Development)

Abstract

:
Bioenergy can play an important role in achieving the agreed United Nations Sustainable Development Goals (SDGs) and implementing the Paris Agreement on Climate Change, thereby advancing climate goals, food security, better land use, and sustainable energy for all. In this study, we assess the surplus agricultural residues availability for bioelectricity in six least developed countries (LDCs) in Asia and Africa, namely Bangladesh, Lao-PDR, and Nepal in Asia; and Ethiopia, Malawi, and Zambia in Africa, respectively. The surplus agricultural residues have been estimated using residue-to-product ratio (RPR), agricultural residues lost in the collection, transportation and storage, and their alternative applications. We use a linear regression model to project the economic potential of bioelectricity. The contribution of bioelectricity for meeting the LDCs’ electricity requirements is estimated in a time frame between 2017 and 2030. Our results reveal that the surplus biomass feedstock available from the agriculture sector could provide the total current electricity demand in Malawi alone, followed by Nepal (45%), Bangladesh (29%), Lao People’s Democratic Republic (Lao-PDR) (29%), Ethiopia (27%), and Zambia (13%). This study also explores the complementarity and synergies of bioelectricity, SDG7, and their interlinkages with other SDGs. Findings from the study show that providing access to sustainable energy in the LDCs to meet the SDG7 by 2030 might be a challenge due to limited access to technology, infrastructure, and finance. Site-specific investigations on how much agricultural residues could be extracted in an environmentally benign manner for bioelectricity and increased investment in the bioenergy sector are key potential solutions in a myriad of options required to harness the full energy potential in the LDCs.

Graphical Abstract

1. Introduction

Access to modern and reliable energy sources is a prerequisite for improving living standards and promoting economic development. In 2015, the United Nations (UN) adopted the 2030 Agenda of Sustainable Development, which includes a set of 17 Sustainable Development Goals (SDGs). SDG7 aims at securing modern, affordable, and sustainable energy for all, thereby increasing the share of renewable energy (RE) in the global energy mix [1]. One in seven people still lacks electricity, and most of them live in rural areas of the developing world [2]. Energy is the main contributor (60%) of the global greenhouse gas (GHG) emissions (climate change impact), and more than 40% of the world’s population rely on unhealthy and polluting fuels for cooking [2]. These are mainly low-income countries that do not have access to modern energy where the majority of the population lives in rural areas.
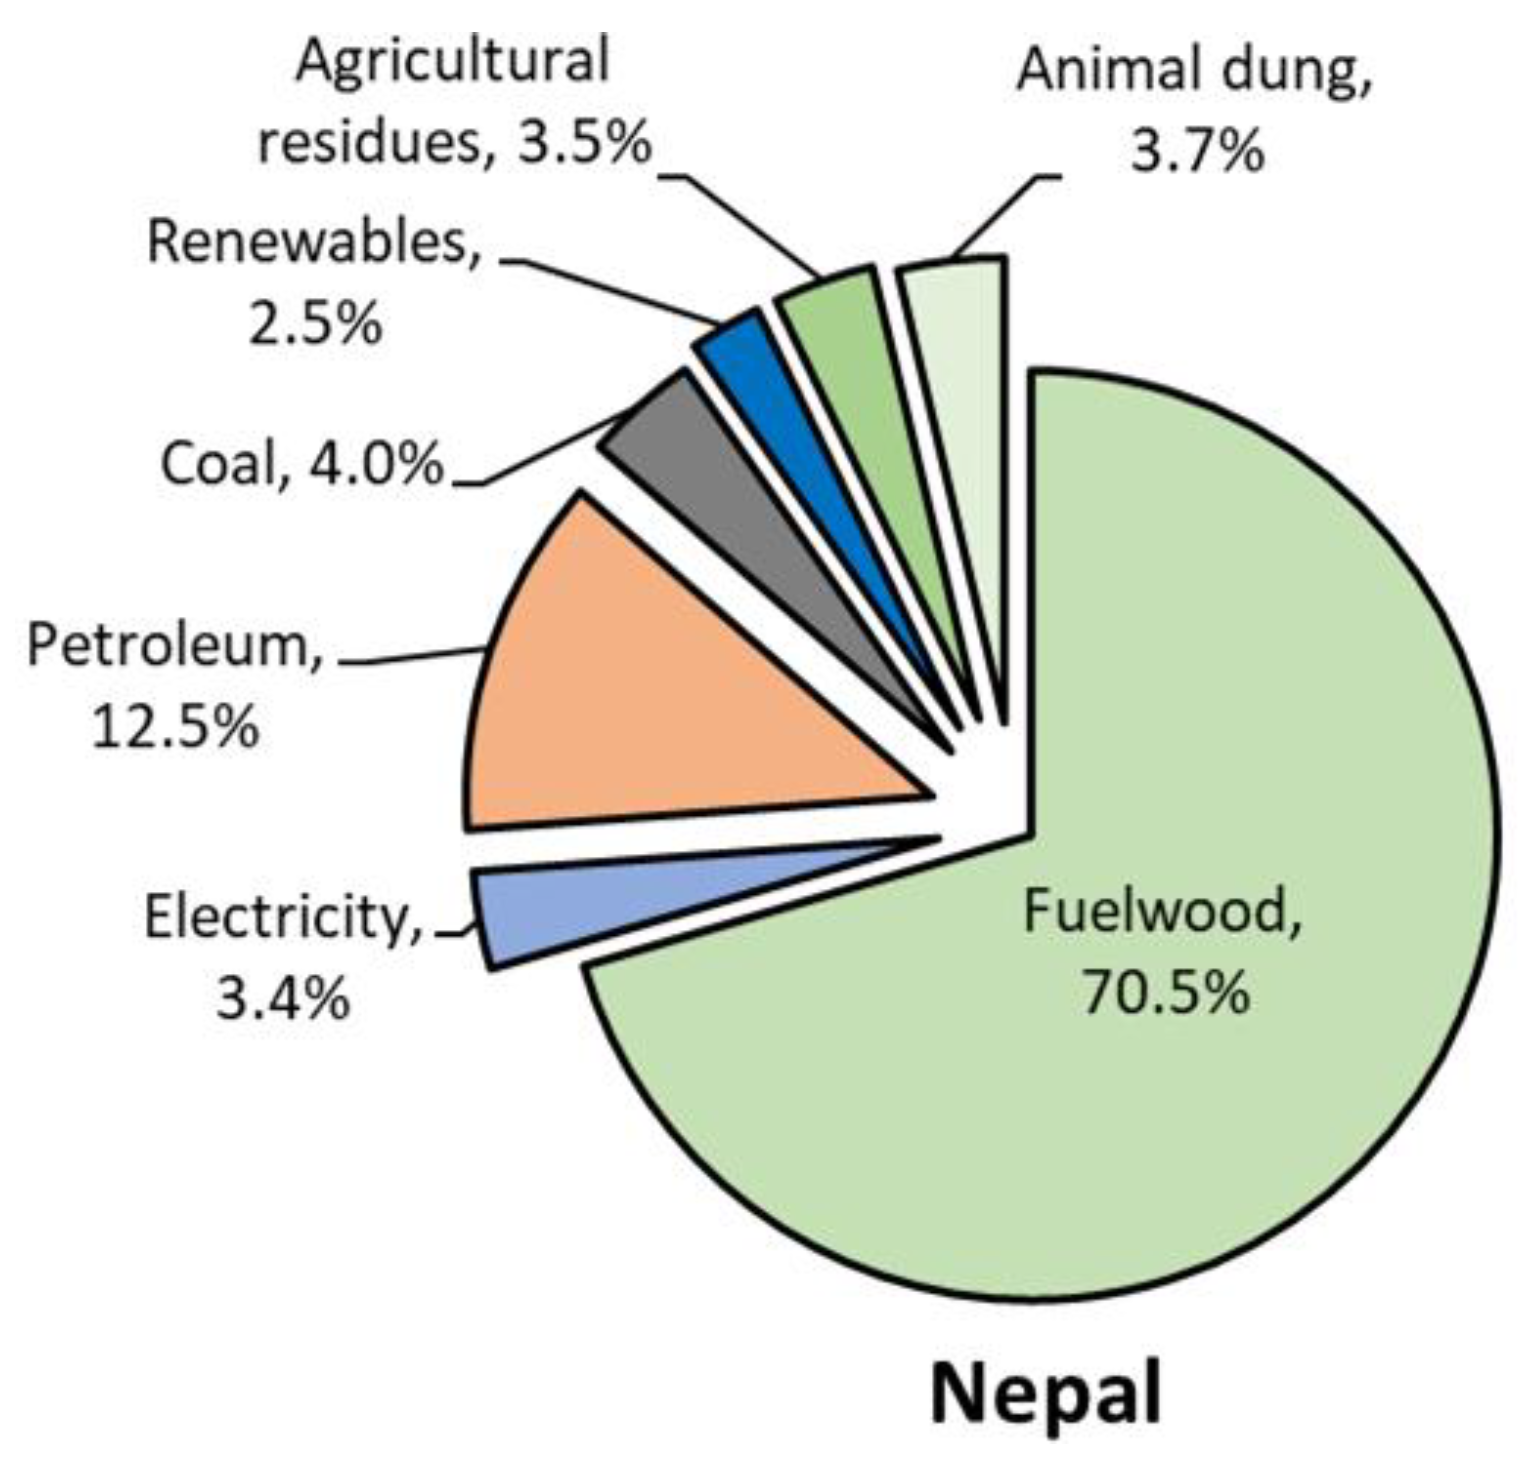
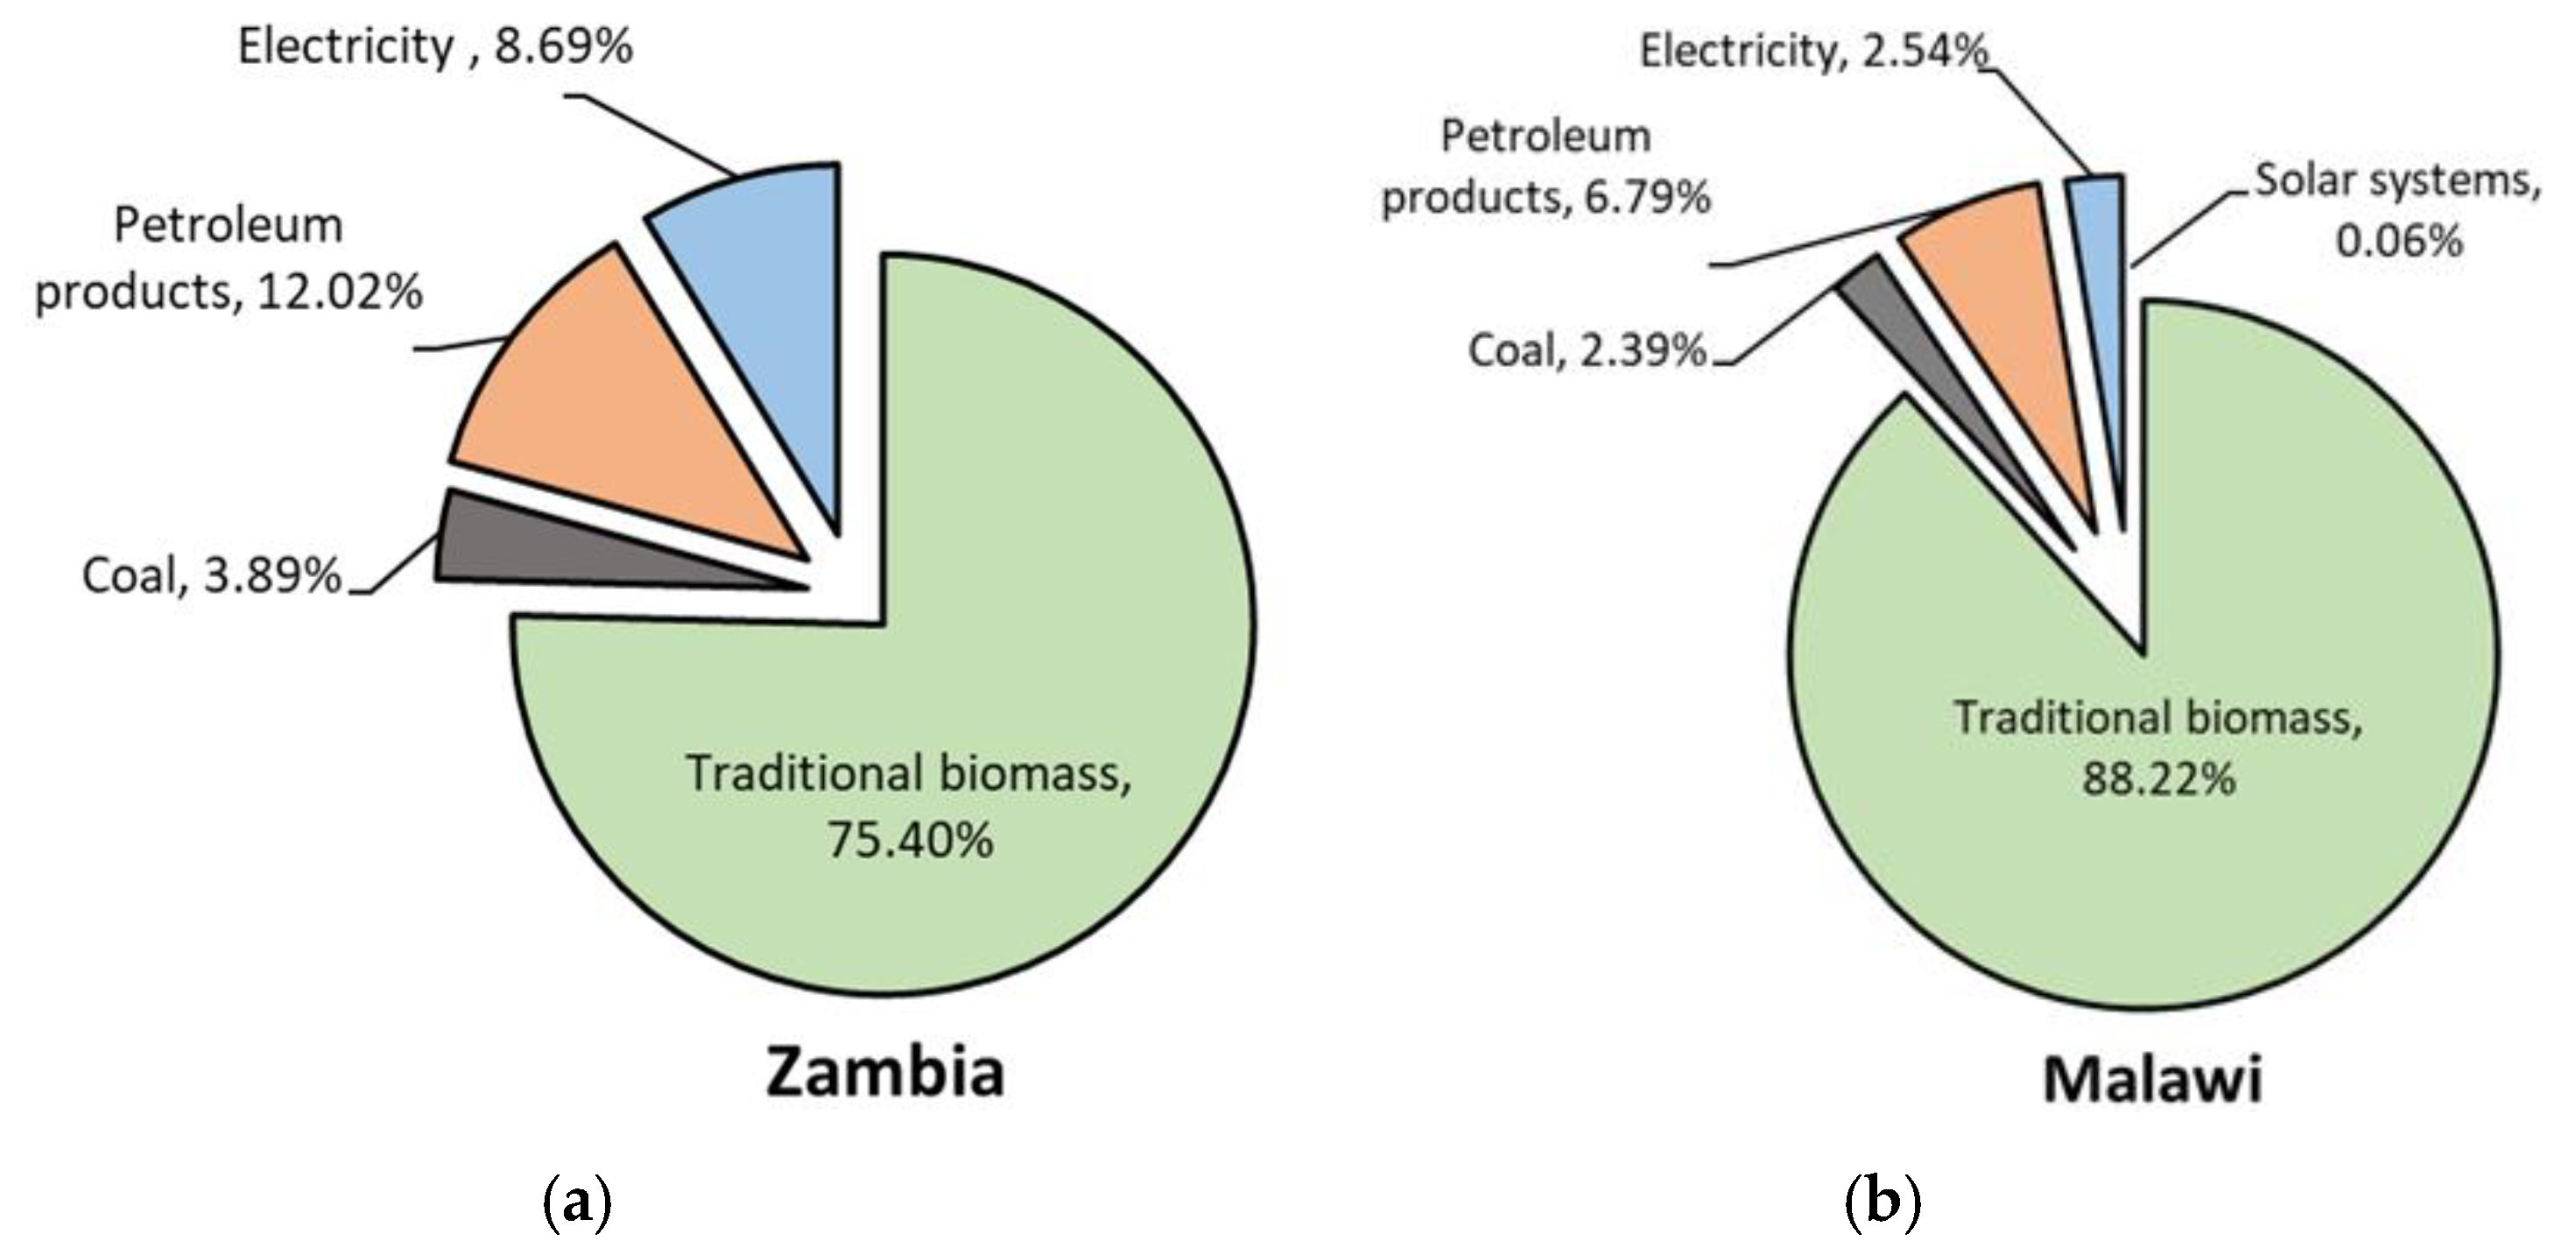
Biomass (fuelwood, agricultural residues, and dung) is the main traditional energy source in the least developed countries (LDCs) and it is utilized inefficiently for cooking and heating purposes [3]. The LDCs are characterized by low income (Gross National Income (GNI) per capita), low level of human capital or human assets (health and education), and they are exposed to economic vulnerability (e.g., high population growth, geographic remoteness, natural disasters, etc.) [
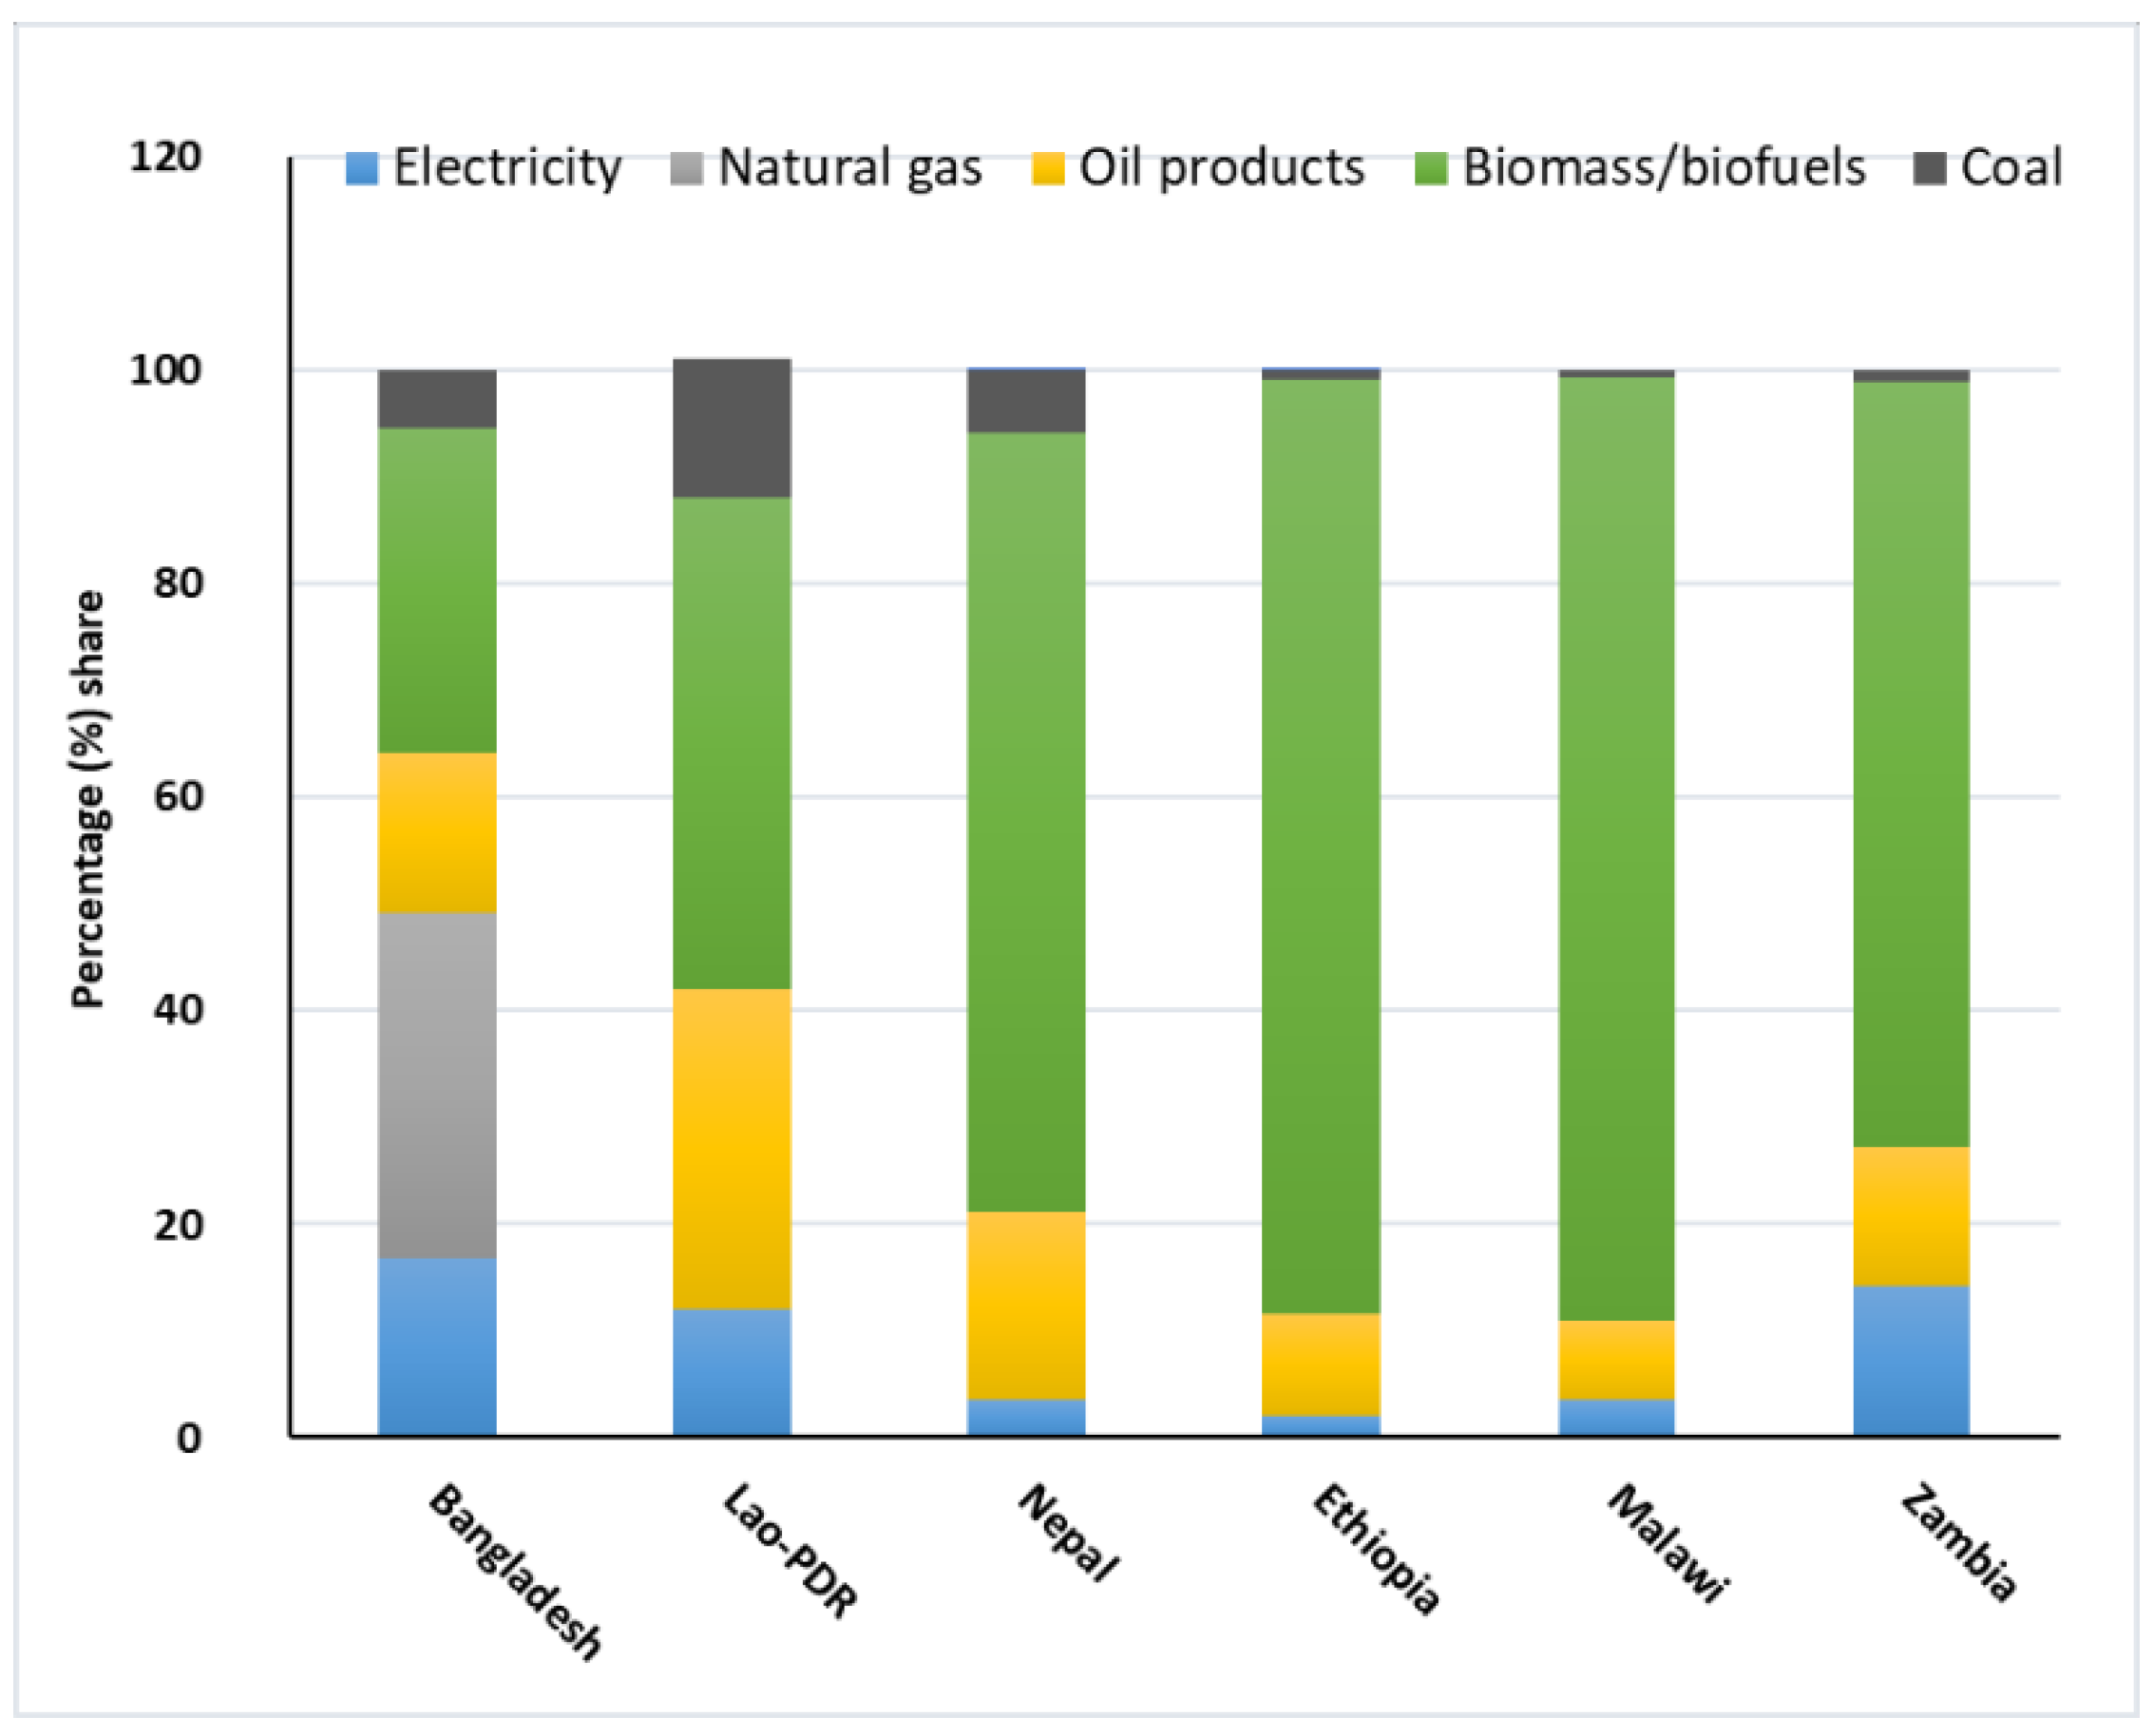
4]. The LDCs have a less diversified energy mix with traditional biomass accounting for 59% of the total primary energy supply (TPES) [3]. Despite the large share of traditional biomass in the primary energy matrix, the majority is combusted inefficiently. This, coupled with population growth, results in increased demands for more biomass (especially from the forest), thereby leading to deforestation. Additionally, the use of traditional biomass for cooking, especially in poorly ventilated facilities, results in indoor air pollution, lung diseases, injuries, and in severe cases, even death [5,6,7]. The bloc of LDCs also import a significant amount of petroleum (oil) products [8,9,10].
In this article, we assess the modern bioenergy potential for electrification, obtained from agricultural residues in the selected LDCs in Asia and Sub-Saharan Africa (SSA). Out of 47 LDCs globally, three representative countries in Asia: Bangladesh, Lao People’s Democratic Republic (Lao-PDR), and Nepal; and three from SSA: Ethiopia, Malawi, and Zambia, are considered. Except for Bangladesh, the rest of the countries are land-locked (see Figure S1). Bangladesh has the highest population density (i.e., 1115 capita per square km), while Zambia has the least population density, with only 23 capita per square km. The majority of people live in rural areas and agriculture is one of the key contributors to the Gross Domestic Product (GDP) in their respective countries. Ethiopia, Lao-PDR, and Bangladesh have more than 6% GDP growth rate during the past decade [11], while the economic growth rates of Nepal, Malawi, and Zambia are not stable [12] (Figure S2).
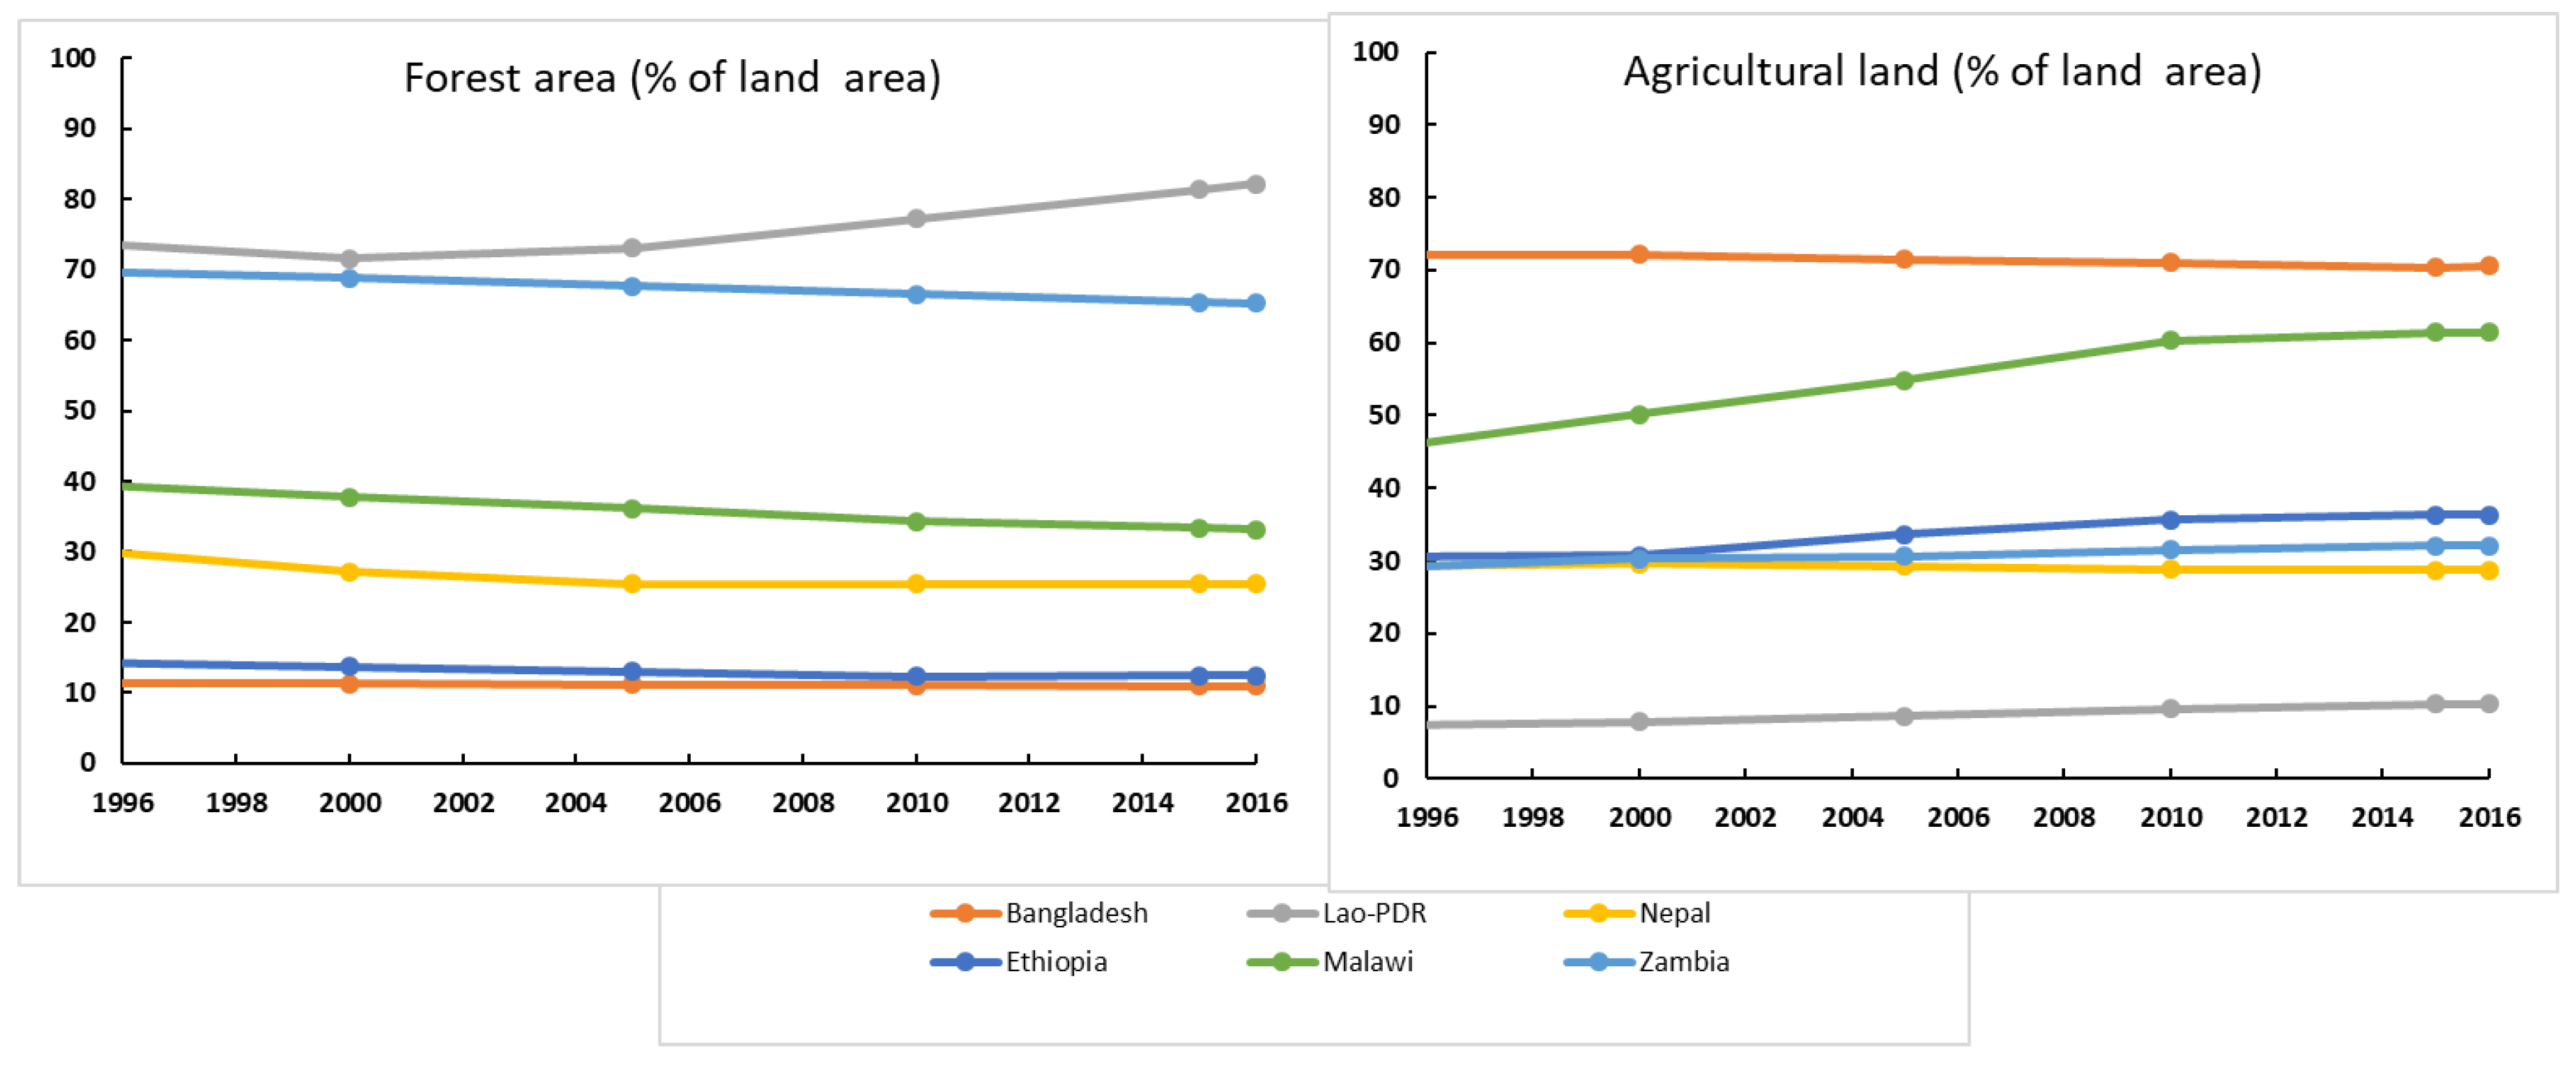
Low-income countries are typically agrarian economies and the agriculture sector offers the highest employment rate, for example, 72% in Malawi, 70% in Nepal, and 40% in Bangladesh [13]. They produce plenty of agricultural commodities/crops. As a result, there are agricultural residues in farms and co-products in agro-industries that could be utilized for energy generation. Per capita electricity consumption of the selected LDCs is far below the world average, i.e., 3150 kWh in 2017. For example, Zambia has the highest per capita electricity consumption (i.e., 730 kWh/capita) while Ethiopia has the lowest (i.e., 90 kWh/capita) among the selected LDCs in 2017 [10].
However, relatively few studies have explored bioenergy potential comparatively in a cluster of the selected LDCs in Asia and Africa. Huda et al. [14] have presented the prospects and technologies related to the biomass energy in Bangladesh. Halder et al. [15] assessed the biomass energy resources and related technologies and practices in Bangladesh. Toth et al. [16] investigated the use of agroforestry and fuelwood in Malawi. Shane et al. [17] assessed the bioenergy potential from biomass in Zambia. In Nepal, Gurung and Oh [18] reviewed the conversion of traditional biomass into modern bioenergy systems (improved cooking stoves and biogas). Khatiwada et al. [19] evaluated power generation from sugarcane biomass in Nepal. Ackom et al. [20] assessed the biomass resource potential in Cameroon from sustainably extracted agricultural and forest residues. Sasaki et al. [21] estimated the woody biomass and bioenergy potentials in Southeast Asia, including Lao-PDR. The Least Developed Countries Report 2017 presents the energy status of LDCs [3]. However, an exploratory assessment of modern bioenergy’s contribution to SDG7, considering agricultural biomass/residues in the LDCs, has not been done yet.
The primary objective of this study is to assess agricultural residues availability and their potential for bioelectricity in the studied LDC countries in Africa and Asia. The contribution of bioelectricity for meeting SDG7 in their respective countries is analyzed. Bioelectricity potential from the major crops such as rice, maize, wheat, sugarcane, cassava, and potatoes is investigated. The paper investigates four interrelated questions: (i) How much is the supply of agricultural residues for energy production (i.e., mapping bioenergy supply and demand) in the selected LDCs?; (ii) How can bioelectricity help achieve SDG7?; (iii) How can bioelectricity be developed in LDCs in synergies with other SDGs?; and (iv) how can we create an enabling environment for the sustainable deployment of bioelectricity derived from environmentally benign agricultural residues in the selected LDCs? The contrasting cases in terms of diverse topography, population/demography, natural resources, development plans, and national priorities provide knowledge contribution for the studied countries and possibly other nations with similar biomass resources and circumstances. This study also provides important insights on the untapped agricultural biomass and informs relevant stakeholders (agro-industries, development partners, and policymakers) in realizing the full potential of renewable electricity in synergy with agricultural and rural development, climate change mitigation, etc. This paper is structured as follows: first Section 1, the introduction, provides the background and sets the rationale for the study. In Section 2, we contextualize the access to clean and modern energy services. The need for modernizing bioenergy and the status of SDG7 are also presented in Section 2. Section 3 assesses the sources of electricity generation and future projection of electricity demand up to 2030. Section 4 provides a framework for estimating the gross and net agricultural residue availability for bioelectricity. The technical and economic potential of agricultural residues for biomass power generation is also presented in Section 4. Section 5 investigates the bioelectricity potential in the selected LDCs under different scenarios towards meeting SDG7. It explores the complementarity and synergism of bioelectricity, SDG7 and their interlinkages with other SDGs. Finally, concluding remarks are made in order to find a way forward to achieve the SDG7 in the selected LDCs.

2. Energy and Development in the LDCs

2.1. Economy and Energy Profile

Energy plays a key role in the economic development of countries. The energy transition from traditional biomass to modern bioenergy is essential for industrial and economic growth [22,23]. The majority of LDCs do not have access to modern energy services and they are characterized by relatively low Human Development Index (HDI). The HDI—measure of health, education, and standard of living (GNI per capita)—is quite less for the selected LDCs, ranging from low human development countries, such as Ethiopia (0.46) and Malawi (0.48), to medium human development countries, such as Nepal (0.57), Bangladesh (0.61), Lao-PDR (0.60), and Zambia (0.59). The population has been continuously increasing in the selected LDCs, with average annual growth rates ranging from 1.0% (Nepal) to 2.9% (Zambia) during the past two decades (1998–2017); refer to Table 1. In spite of the rapid urbanization, the majority of the population lives in rural areas (Table 2). Energy consumption and GNI in the LDCs are low compared to developing and industrialized countries [11]. Table 1 provides the socio-economic metrics, energy, and related emissions of the six LDCs in Africa and Asia. Refer to Figure S3 which depicts the historic trend of urbanization and population growth in the selected LDCs.
Bangladesh has an average annual GDP growth rate of 7.8% since 1990 and its GDP per capita was US$1564 in 2017 [11]. Lao-PDR has remarkably achieved an annual economic growth rate of around 8% during the period 2000–2016 and its GDP per capita was US$2424.5 in 2017 [9,11]. Ethiopia has also made substantial progress in the economic development in the last decade with a 4-fold increase in GDP per capita [11]. However, the country still has a low GDP per capita (US$768 in 2017) [11]. Malawi has the lowest GDP per capita (US$356.5) even though there is an annual average growth of 3.1% in the last decade [11], refer to Figure S3.
Due to economic progress, urbanization, and rising population, energy supply and consumption have also increased in the LDCs. In Bangladesh, energy consumption increased by around 50% in the last decade (2006–2016) [10]. Nepal’s total primary energy supply increased by almost 40%, escalating the share of commercial energy (hydro and fossil oil) from 9.7% to 18.5% [10]. In Zambia, the TPES has increased by 3.6% annually from 7.78 million tonne oil equivalent (Mtoe) to 11.08 Mtoe between 2006 and 2016, whereas total final energy consumption (TFEC) has also grown by 3.7% in the last decade [10]. In Ethiopia, in spite of the continuous increase in the energy supply (3.5% annual increase in the last 10 years), TPES per capita has almost remained the same since 1990, with a value of 0.5 tonne oil equivalent (toe) per capita [10].
In Bangladesh, of the total TPES (i.e., 39.54 Mtoe), natural gas has the largest share with a contribution of 58.4%, followed by biomass/biofuels (23.9%), petroleum oil (13.3%), and coal (4.3%) [10]. Out of the total 5.58 Mtoe, coal, biomass, and hydroelectricity are the major sources of the TPES in Lao-PDR, with the corresponding shares of 32.3%, 29.0%, and 22.1%, respectively [9]. In Nepal, biomass, imported fossil (coal and oil products), and electricity are its main sources of the TPES (12.65 Mtoe in 2016). Commercial energy amounts to 18.5% of the total in the form of fossil fuels (15.6%) and electricity (2.9%) in the country [10]. In the LDCs, net energy imports (petroleum products) has drastically increased in the last decade [10], thereby spending a huge amount of foreign currency on the import of petroleum products. The import of petroleum products has increased from 1.75 Mtoe to 23.99 Mtoe in one decade (between 2006 and 2016) in Ethiopia [10]. Domestic (or residential) sector has the highest share in the TFEC, e.g., 92.7% in Ethiopia, 82.7% in Nepal, 65% in Zambia, and 58.5% in both Bangladesh and Lao-PDR. Energy is mainly used for cooking and lighting purposes. On the other hand, transport and industrial sectors have relatively low shares in the TFEC: Bangladesh (transport, 12.5%; industry, 28.9%), Nepal (transport, 10.1%; industry, 7.2%), Ethiopia (transport, 4.1%; industry, 3.2%), and Zambia (transport, 4.6%; industry, 30.4%) [10].
Agriculture is the major source of economic activity in the LDCs. Over 40% of the population in the selected LDCs is employed in this sector [11]. Table 2 shows the share of GDP in the economy, population employed in the agricultural sector, and rural population and land area in the LDCs. Around 80% of population live in rural areas in Nepal (80.7%), Ethiopia (79.7%), and Malawi (83.3%), whereas other LDCs also have the majority of the rural population: Bangladesh (64.1%), Lao-PDR (65.6%), and Zambia (57.0%). The agricultural sector provides up to 85% of employment in the LDCs (Table 2). In Nepal, the agricultural sector accounts for one-fourth of GDP’s contribution, whereas the industrial and service sector has 13.5% and 50.3%, respectively. Regardless of the countries’ large population employed in the sector, the contribution to the national GDP is relatively low. In Zambia, the agricultural sector merely contributed to the economy with a small share of 2.6%, while the population employed in the sector was 53.3%. This is mainly due to the lack of modernization, productivity (production/hectare), and efficiency of the agricultural sector. There are still many people in the LDCs who are living under the national poverty lines [11]. For example, poverty rate (population below US$1.90 a day) is 14.8% (Nepal), 26.7% (Ethiopia), and 71.4% (Malawi) (see Table 1).

2.2. Biomass in the Primary and Final Energy Consumption

As mentioned earlier, rural dwellers heavily rely on traditional fuels for cooking. Biomass and wastes are the key primary energy sources in the selected LDCs, notably Nepal, Ethiopia, Malawi, and Zambia. The shares (in the TPES) of biomass/biofuels were 23.5% (Bangladesh), 34.0% (Lao-PDR), 73.7% (Nepal), 87.7% (Ethiopia), 88.2% (Malawi), and 75.4% (Zambia). Refer to Table S1 for the TPES in the selected LDCs by fuel type.
In Lao-PDR, the use of biomass has drastically decreased from 78% to 34% between 2000 and 2015 [9], which is mainly due to the rapid expansion of hydropower plants and increased consumption of fossil fuels. In Nepal, traditional biomass has the largest share of the TFEC, amounting to 77.6%, followed by oil products (12.5%), coal (4%), and electricity (3.4%) in 2015 [28]. Figure 1 presents the share of fuel types in the total energy matrix in Nepal. Approximately 70% of the population use fuelwood for energy consumption, mainly for cooking [28]. These numbers denote the present low level of industrial and economic activities in the country.
In Ethiopia, the share of biomass and biofuels was 87.5% in the TFEC (by source) in 2017, followed by oil products (9.5%) [10]. It should be noted that Ethiopia has only 12.5% of forest land while 36.3% area was covered by agricultural land [11]. In Malawi and Zambia, traditional biomass remains the dominant source of primary energy (Figure 2). Zambia has a share of 75.4% of the traditional biomass in the TPES [10], whereas Malawi has a gigantic share of 88.22% [8]. It is noteworthy to mention that the share of biomass in the TPES is almost the same in the last ten years in Malawi and Zambia. Among the total TFEC, traditional biomass has a significant role in the LDCs (see Figure 3). Table S1 summarizes the share of the TPES in the selected LDCs by fuel source.

2.3. The Need for Modernizing Traditional Biomass Utilization

As mentioned in the previous section, the majority of people live in rural areas in the LDCs using traditional biomass fuel as a major source of energy. In the SSA, the share of biomass in the household energy consumption is around 90% [30]. The incomplete burning of biomass poses a severe health impact due to the release of small smoke particles and carbon monoxide (CO) [5,6]. Biomass burning is a significant air pollution source, with global, regional, and local impacts on air quality, public health, and climate [31]. Therefore, it is important to avoid an inefficient burning of biomass for cooking. Furthermore, the open burning of biomass (agricultural residues) in the field also causes air pollution, public health risk, and climate impacts [32,33]. There are also problems related to deforestation and land degradation while using excessive fuelwood for cooking.
The expansion of agricultural land and the high demand for fuelwood as fuel promote deforestation. Figure 4 shows the trend of agriculture and forestland in the selected LDCs. The farmland is increasing in all countries, and consequently, the forest cover is decreasing, except in Lao-PDR. Thus, traditional biomass shall have a considerable impact on the environment (i.e., deforestation and desertification) and public health (i.e., indoor air pollution). Modernization of bioenergy can add value to existing resources and serve to meet increasing energy demand, as well as create jobs and reduce poverty [34].
An improved cooking stove (ICS) can help improve burning efficiency and reduce health hazards, and it has a low rank in the energy ladder which describes the selection of fuel choices as per the variations in the economic status of the individual household [36,37]. A transition toward cleaner and more efficient forms of energy is achieved by moving up the energy ladder. Household incomes (economic well-being) and availability of cleaner fuels also play an important role in switching and/or diversifying energy services. We assume that there would be government incentives for promoting locally produced bioelectricity and rural households can afford to buy/utilize it. Bioelectricity from agricultural residues has the potential to contribute to resource efficacy, protection of forests, reduce GHG emissions, and protect human health or avoid indoor air pollution in rural areas of the LDCs.

2.4. Defining SDG7—State of Art and Perspectives and the Possible Role of Modern Bioenergy

The 2030 Agenda for Sustainable Development adopts 17 SDGs, which aim to end poverty, improve health and education quality, reduce inequality, enhance economic growth while mitigating climate change, and preserving ecosystem services, etc. Energy is a key enabler for several SDGs including economic development and social wellbeing. SDG7 (ensuring access to affordable, reliable, sustainable, and modern energy for all) has five targets and six indicators. The SDG7 targets and indicators are outlined in Table S3.
The SDG7 is strictly related to several other SDGs, notably climate change (SDG13), poverty eradication (SDG1), elimination of hunger (SDG2), gender equity (SDG5), health (SDG3), and clean water (SDG6). In this section, we present the progress of the selected LDCs in their efforts towards achieving SDG7—especially the targets 7.1 (7.1.1 and 7.1.2), 7.2, and 7.3. Targets 7.A and 7.B consider the means of implementation, mainly financing. Table 3 summarizes the current status of SDG7 in the selected LDCs.

2.4.1. Access to Electricity

There is significant progress globally in the access to electrification [38]. The recent report by World Bank shows that the global electrification rate reached 89%, with a resultant drop in the number of people without electricity to 840 million compared to 1 billion in 2016 and 1.2 billion in 2010 [38]. It is projected that only 8% of the world population will not have access to electricity in 2030 and 90% of them will be in SSA [38]. Around 97% of the urban population in the world has access to electricity, while only 76% of the rural population had access to electricity in 2017 [38]. Figure S4 presents the historic progress in the global electricity access since 1990.
Historically, the LDCs are characterized by a lower rate of electrification, and access to electricity is limited compared to the global average. Figure S4 shows the evolution of electricity access in the selected LDCs, SSA, and the world. It depicts that there is a rapid growth in electricity access to households in the studied Asian countries: Bangladesh, Lao-PDR, and Nepal.
As depicted in Figure S4, countries in Asia have a higher rate of electricity access compared to the countries in SSA. In spite of the progress made in the last years, Ethiopia, Zambia, and Malawi still have relatively low electrification access rates of 44%, 40%, and 13%, respectively (see Table 3). There is a huge disparity in access to electricity. The urban population in Nepal, Bangladesh, and Lao-PDR have almost 100% access to electricity, whereas rural people in Malawi surprisingly have very limited electricity access. The majority of the population lives in rural areas where the rate of electricity in rural areas is low. Only 4% and 14% of the rural population of Malawi and Zambia, respectively, had access to electricity in 2017 [38]. It is worthwhile to mention that electricity is mainly used for lighting. Access to electricity for productive uses such as irrigation and other agricultural activities can also help promote rural development in the LDCs. Therefore, it is important to electrify the rural population for economic development and social well-being.

2.4.2. Access to Clean Fuels for Cooking

As mentioned in Section 2.2, traditional biomass is the main source for cooking and heating in the LDCs. The use of traditional biomass and inefficient burning of biomass is often associated with negative consequences such as deforestation, indoor air pollution, ill-health (lung-related diseases), injuries, and sometimes death (Section 2.3). Table 3 presents the status of access to clean fuels in the LDCs. On a global scale, approximately 3 billion of the population did not have access to clean fuels and technologies in 2017, and the majority of the population resided in the LDCs [38]. Malawi (2%), Ethiopia (3%), Lao-PDR (6%) had the lowest access to clean fuels and technologies for cooking in 2017. At the current annual rate of progress, it would be difficult to meet the SDG7.1.2 (target of universal access to clean cooking) [38]. Thus, cleaner fuels and efficient cooking technologies should be promoted with innovative scale-up schemes (models) for multiple benefits [39].

2.4.3. Renewable Energy Share in the Total Final Energy Consumption (TFEC)

All six LDCs considered in this study have more than the world average of around 20% share of renewables in TFEC. Four LDCs including Ethiopia, Zambia, Malawi, and Nepal had the largest share of RE which was more than 75% in 2017 [38], also refer to Table 3. Bangladesh had a 34% RE share in the TFEC, which is the lowest among the six LDCs considered in the analysis, whereas the RE share in Ethiopia (91.1%) was the highest, followed by Zambia (88.5%), Nepal (79.2%), and Malawi (78.5%).

2.4.4. Energy Efficiency (Energy Intensity)

Energy intensity is a proxy indicator to measure energy efficiency at national levels, which is the ratio of the TPES to the GDP, measured at purchasing power parity (PPP) in constant 2011 US$. This indicates how much energy is used to produce one unit of economic output, and hence a lower ratio depicts that less energy is required to produce one unit of economic product. LDCs have shown the fastest decline in energy intensity compared to industrialized and developed countries. Table S6 shows the trend in primary energy intensity in the LDCs. The increased share of industries and consumption of commercial (modern) energy production by fuel type in the national economy have contributed to making significant progress in the energy intensity.

3. Source of Electricity Generation, Consumption Pattern, and Future Demand Projection

In this section, we present the source of electricity generation and consumption patterns in the selected LDCs. The future projection of electricity generation and demand is also presented.

3.1. Electricity Generation and Consumption Pattern in the LDCs

The major source of electricity generation in the LDCs analyzed in this study is largely hydropower, except in Bangladesh (Figure 5). Nepal, Lao-PDR, Ethiopia, and Zambia have abundant hydroelectricity potential. Nepal and Zambia have almost 100% hydropower share in their electricity mix. However, electricity is mainly produced from natural gas in Bangladesh, in contrast to other LDCs, while Lao-PDR, Ethiopia, and Malawi have a small share of electricity derived from oil products and other renewables.
In Bangladesh, the installed capacity of power generation was 12,540 MW in 2016, including 600 MW energy export and renewables [40]. At present, the public sector has a share of 53% of the installed capacity and the private sector add up to another 42% of the installed capacity, whereas the remaining demand is met through the imports. The country had generated 64,327 GWh of electricity in 2016 [10]. Out of this total production, natural gas carried the majority share with 82%, followed by fossil oil (15%). Renewables (hydro, solar, and wind) had only around 1% of the total production. As regards the total sectoral retail electricity consumption, domestic sector held the major share with a 50.2%, followed by the industry (35.5%), commercial, (9.3%), and agricultural sectors (3.1%) [40]. In Lao-PDR, the total installed power generation capacity was 6418 MW in which hydropower had a share of 70.7% and combustible fuels had a share of 29.3% in 2016 [41]. Out of the total electricity production of 16,302 GWh by source, hydropower contributed 86% and the remaining came from coal power [9]. In Lao-PDR, a major portion of the electricity produced is exported to neighboring countries, mainly to Thailand. The export of electricity accounted for around 75% of the total electricity generated in the country. Electricity from coal has been used for export purposes since 2013. When it comes to the domestic consumption of electricity, 4248 GWh was consumed in several sectors: the majority of the consumption in industries (41.1%), followed by households (37.6%), and service (20.4%) [41]. It should be noted that the country also imports electricity during the dry season when there is less production of electricity from hydropower plants [9]. Nepal had 1132 MW installed capacity of electricity (including isolated/grid-connected or hydro/thermal) in 2016 [28,42,43]. Isolated energy systems (i.e., micro-hydro and solar home systems) serve remote rural areas and constitute 5.5% (i.e., 62.2 MW) of the total installed capacity. Out of the total annual electricity demand of 6258 GWh, Nepal domestically produced 4476 GWh, while 2582 GWh was imported from India in 2017 [43]. In the national grid, electricity from diesel thermal plants has a negligible share due to high operation and maintenance costs. The residential sector was responsible for the largest share of electricity consumption (45.2%), followed by the industrial sector (36.0%). Over the last years, electricity demand has significantly increased, including the peak demand, i.e., the highest power demand that occurs over a certain period [43]. It should be noted that Nepal used diesel generators to provide electricity in urban centers during load shedding periods, leading to huge local air pollution in cities [44].
In Ethiopia, the total installed capacity of electricity generation was 4238 MW in 2016 [41]. Hydropower has the largest share of around 89.9% [41]. The rest is from renewables (7.81%, mainly wind and geothermal) and diesel power plants (2.34%). The country consumed 8802 GWh of electricity in 2016 [41]. Electricity consumption is mainly in urban households and small industries. The household/domestic sector used almost two-third of electricity and the remaining amount was utilized by industrial/commercial sectors. In Malawi, the total installed capacity for large hydropower was 345.5 MW, whereas 23.8 MW was from bagasse and small hydro in 2014 [45]. Net production of electricity in 2016 was 2058 GWh and the household sector was the main consumer (878 GWh, 55.7%) followed by industries (699 GWh, 44.3%) [41]. Zambia had the total installed capacity of 2829 MW in 2016: 84.3% from hydropower and 15.7% from combustible fossil fuels with the generation of 11,695 GWh of electricity in 2016 [41]. Hydropower dominates the total electricity generation with a share of 94.3%. The remaining electricity comes from coal and oil. Around 60% of the electricity is used in industry and the remaining 40% in the household sector. The country also imports electricity from the neighboring country depending upon the availability of water in rivers. For example, the country imported 1391 GWh of electricity in 2016 [41]. Recently, Zambia has experienced an extended load-shedding (power-cuts) in the country, reducing its electricity consumption by 30% in 2015 [46]. This is mainly due to low water levels in reservoirs and declining water flows in rivers [47]. The total installed power generation capacity by fuel type in the selected LDCs is presented in Figure 6.

3.2. Future Projection of Electricity Generation and Demand in the LDCs

For meeting the universal access to cleaner and renewable energy in the LDCs, there should be an increased generation of electricity supply. We have taken into account the respective countries’ plans and policies in order to project the electricity generation until 2030. Anticipated trends towards increased urbanization and industrialization, coupled with continued economic growth and population rise, would trigger the rise in electricity consumption in the LDCs. As the bloc of countries is also aiming to uplift their economies from the LDCs to medium-income countries, electricity is essential for this transition. To assess the electricity generation and peak load demand in the near future we have used the economic growth and electrification pattern of selected LDCs analyzed in this study. Figure 7 presents the electricity generation (TWh) and peak load demand (MW) in the selected LDCs until 2030, also refer to Table S7.
Bangladesh has increased its electricity demand at an annual average of 8.26% since 2000 [40]. For the projection, we use an annual growth rate of 7.85% in peak load, which is also aligned with the current trend [48]. Energy production and peak power would be 175,926 GWh and 29,264 MW, respectively, in 2030 (see Figure 7). As mentioned above, Lao-DPR’s net export of electricity was around 75% of the total production. Domestic electricity demand is also increasing—it has increased by a factor of thirteen from 2000 [9]. The increase is mainly in the household (domestic) and the industrial sector. According to the Lao-PDR’s demand forecast (2016–2030), it is estimated that there would be a 13.4% annual increase in electricity generation in the country [49]. Electricity generation would be 32,923 GWh by 2030 and the corresponding peak load is set at 5892 MW. The export of electricity is not considered in the projection.
Nepal Electricity Authority (NEA), the state-owned public company, is mainly responsible for carrying out load forecasting, the generation planning of the power system of Nepal. Peak demand has doubled from 722 MW in 2008 to 1444 MW in 2017 [43]. However, the generation of hydroelectricity has not sufficiently met the country’s increasing demand. The demand for electricity is expected to rapidly increase with an average annual growth rate of 12.48% due to the nation’s economic and industrial development [43]. Peak load is estimated to be 7542 MW with the total electricity generation amounting to 34,355 GWh in Nepal by 2030 (see Figure 7). Ethiopian Electric Power Corporation has projected the national electricity demand in the form of energy generation (GWh) and peak load (MW) from 2012 until 2037 in different scenarios [50]. For example, in the base case, the peak demand forecast grows from 2657 MW in 2015 to 14,372 MW by 2030. This represents an average annual growth rate of 12.3% in energy generation (GWh) and 10.3% in peak load (MW).
There are a few old studies and reports which investigate the trend and future projection of the electricity demand and generation in Malawi. Taulo et al. [8] undertook both short and long-term energy demand forecasts for Malawi using the Model for Analysis of Energy Demand (MAED) for the period of 1999–2011 and 2008–2030. The grid electricity demand has increased from 1032 GWh to 1888 GWh from 1999 to 2011, representing an average annual growth rate of 6% [8]. As per the UN report, the net production of electricity has increased from 1793 GWh to 1875 GWh between 2011 and 2016 with the corresponding 288 MW (2011) and 352 MW (2016) generation capacity in Malawi [41]. The peak load in Malawi was 323 MW in 2016 [51]. Electricity Supply Corporation of Malawi (ESCOM), a state-owned authority, is responsible for the supply and distribution of electricity in Malawi. The government of Malawi in 2010 estimated that the projected electricity demand would be 598 MW in 2015, 874 MW in 2020, 1193 MW in 2025, and 1597 MW in 2030 [8]. However, the demand has been unmet, leading to load shedding up to 12 hours a day. In this study, the projected installed capacity (peak load) of electricity generation is estimated to 1500 MW in 2030 (Figure 7), which is approximately a 10% annual increase from the current capacity of 352 MW 2016. The corresponding 8541 GWh would be generated by 2030, considering a capacity factor of 65% [52]. Zambia developed a Power Systems Development Master Plan in 2011 [52]. Energy demand forecasted by the government of Zambia shows that there would be a 4.1% increase in the electricity production until 2030, reaching the generation up to 21,481 GWh. The projected peak load was 4066 MW (in 2030) which is around 2.5 times higher than that of 1600 MW in 2008. While performing the estimation of electricity demand (GWh), we consider the given peak loads and load factors from Power Systems Development Master Plan, which lies between 68% and 74% [52].

4. Estimating the Bioelectricity: Methodological Approach and Data Sources

When it comes to assessment of bioelectricity from agricultural residues, this study looks at three interrelated questions: (i) what is the supply of biofuels (agricultural residues) in the selected LDCs?; (ii) what would be technical potential of supply of bioelectricity?; and (iii) what is the economic potential of the bioelectricity in the selected LDCs considered in this study? The first research question is more related to the availability of agricultural residues. Nevertheless, both the technical and economic potential of bioelectricity require a detailed technical evaluation of surplus biomass feedstock availability for energy applications.
The conversion of agricultural residues to biomass feedstock for electricity generation is developing as a potential form of bioenergy. Bioelectricity can be mainly produced through the combustion of lignocellulose feedstock which is obtained from biomass sources such as agricultural products and residues, plantation forests, sawmill residue, and native forests. In order to estimate the amount of agricultural residues that can be used for the production of bioelectricity, we use the methodology developed by Tripathi et al. [53] that was further improved by Purohit et al. [54] after taking into account the crop and its residue production, environmental constraints, and their competitive uses. The gross agricultural residue availability essentially depends upon the area under the crop, yield, and residue to product ratio for the crop. Therefore, the gross agricultural residue, GARi, availability for the ith crop in jth LDC can be estimated by using the following equation:
G A R i , j = i = j = 1 m , n ( A i , j Y i , j ) R P R i , j
where Ai,j and Yi,j respectively represent the area and yield of ith crop (i = 1, 2, 3, .... m crop) in the jth LDC (j = 1, 2, 3, .... n LDCs) and RPRi,j the residue to product ratio for ith crop in jth LDC.
The surplus agricultural residue available for bioelectricity can be evaluated by introducing certain restrictions on the GAR potential of the crop residues. It has been revealed that the competing uses of a particular crop residue and the harvesting practices have a remarkable influence on the availability of crop residues [55,56]. Moreover, a certain amount of crop residues is also required for retaining soil fertility [56,57,58,59].
Therefore, the surplus agricultural residue (SAR) availability of ith crop in jth LDC for energy applications can be estimated by using the following equation:
S A R i , j = ξ c e ( 1 ξ f o d d e r ) ( 1 ξ o t h ) i = j = 1 m , n ( A i , j Y i , j ) R P R i , j
where ξce represents the collection efficiency of agricultural residues, ξfodder the fraction of agricultural residues used for fodder applications, and ξoth the fraction of agricultural residues used for other applications (i.e., paper industry, cardboard industry, construction materials, etc.).
Finally, the bioelectricity potential is estimated as a product of the surplus agricultural residue availability (Mt) for biomass power and specific biomass consumption for electricity (kg/kWh). It should be noted that not all agricultural residues are easily accessible, available, or economically viable for energy production [60]. Several factors are required to help determine the extent to which agricultural residues can be extracted in an environmentally benign manner from any specific location [61]. This includes, for example, crop cutting height, crop yield, land slope, tillage, edaphic factors (i.e., soil type and soil fertility), weather, and wind patterns [20,62,63]. Based in part on the recommendation by OECD/IEA [64], this study adopts a rather conservative 20% extraction rate for agricultural residues (leaving the remaining 80% for soil nutrient recycling, ecosystem function, animal fodder, and other competing utilization). The authors recommend that further to their results, geospatial analysis of crop production and robust field studies in situ would be required to inform policymakers regarding the realistic potential of agricultural residues that can be extracted in an environmentally benign manner in any of the studied countries. Additionally, the study helps provide invaluable information on specific crop type(s) to concentrate edaphoclimatic investigations on residues for future bioelectricity production. As reported in Ackom et al. [20], such information is essential to help address both food security and modern energy needs (via bioelectricity from only 20% agricultural residues) in developing countries.
The historical crop production data of major crops by the LDCs considered in this study has been obtained from FAO-Statistics [13]. Table S8a presents the production of major crops by country in 2017 obtained from FAO-Statistics [13]. The specific ratios of residue-to-grain production of different crops are taken from publicly available literature, as shown in the supplemental Table S8b. To assess the technical potential of agricultural residue availability we assume that the gross residue available from the crop production is available for bioelectricity. For the year 2017, the total crop production was 72.9 Mt in Bangladesh, 20.6 Mt in Ethiopia, 15.9 Mt in Nepal, 9.9 Mt in Zambia, 18.2 Mt in Malawi, and 10.4 Mt in Lao-PDR, as shown in the supplement (Table S8a). The gross residue availability was estimated at 111 Mt in Bangladesh, 34 Mt in Ethiopia, 21 Mt in Nepal, 15 Mt in Lao-PDR, 13 Mt in Zambia, and 17 Mt in Malawi for 2017.
We use a linear regression model to estimate the area and production of major crops in the near future. It is a starting point for projecting the agricultural residues and their utilization. For the years 2018 and 2030, the projected crop productivity is based on the data from 2002 to 2017 [13]. We assume that the increase in food production and productivity would follow the trend (2002–2017) for another 10–15 years, i.e., until 2030. In addition, there would no drastic increase or change in agricultural practices and/or shift in agricultural commodities. 
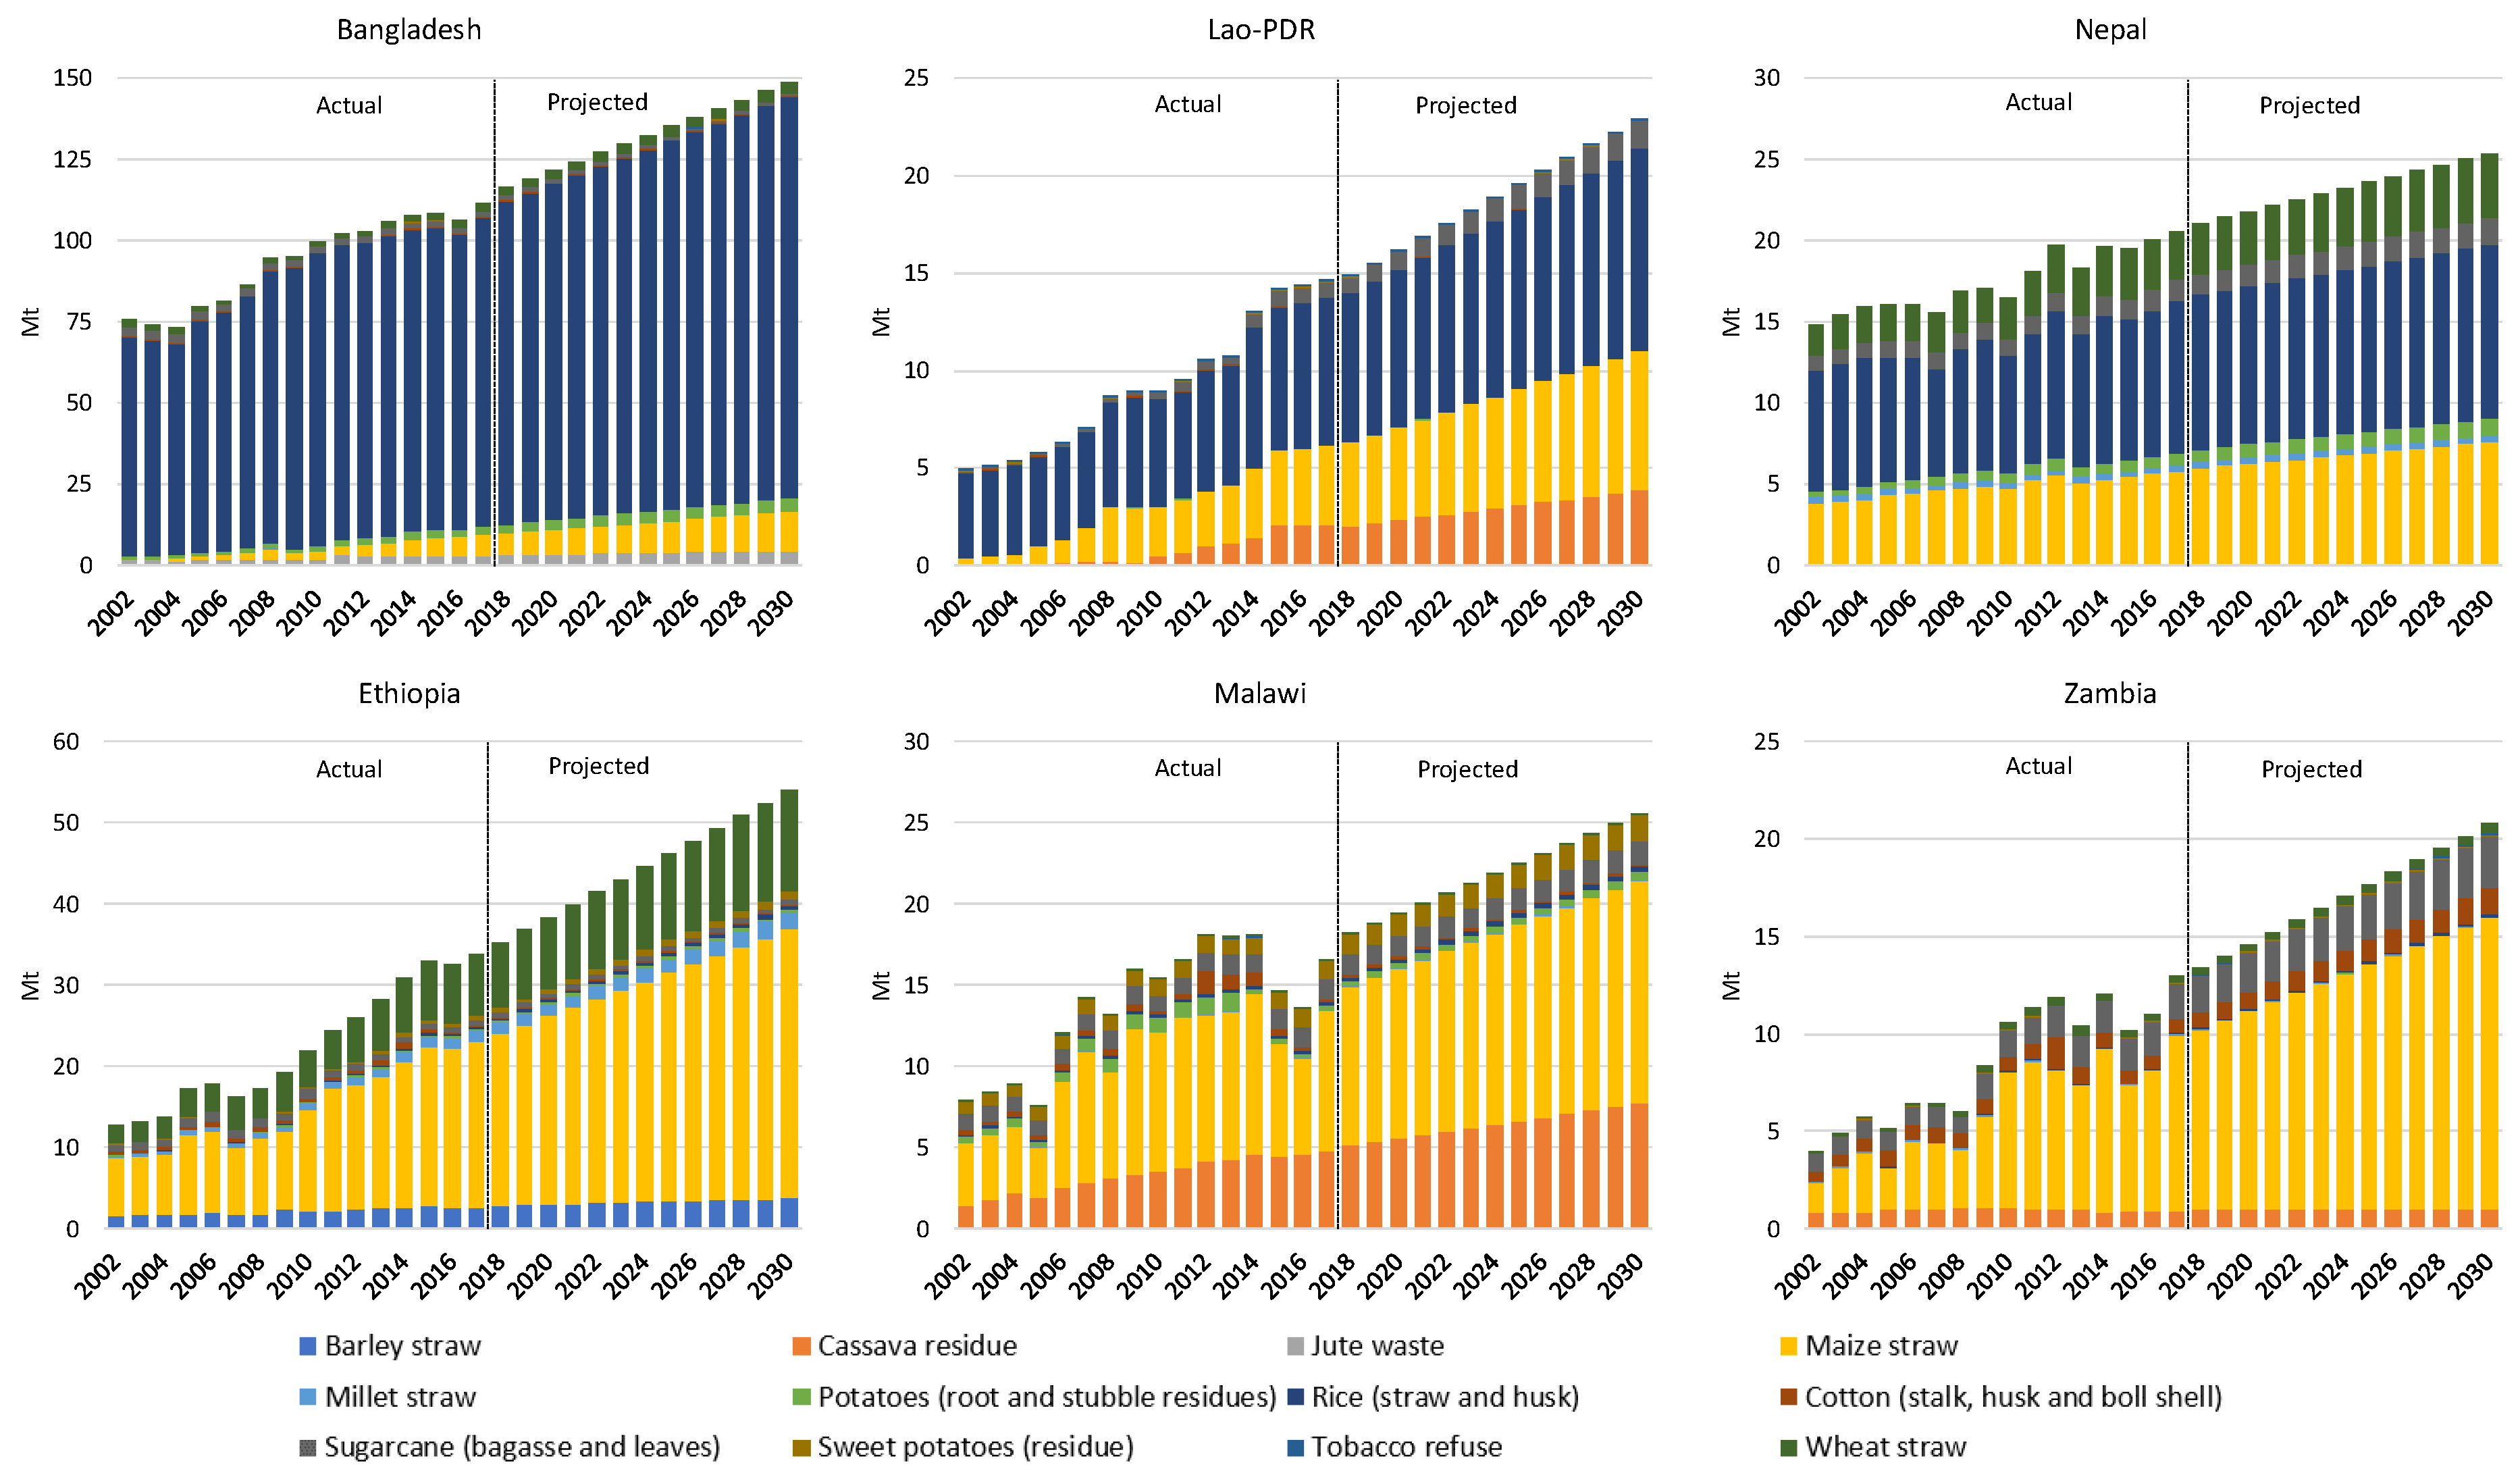
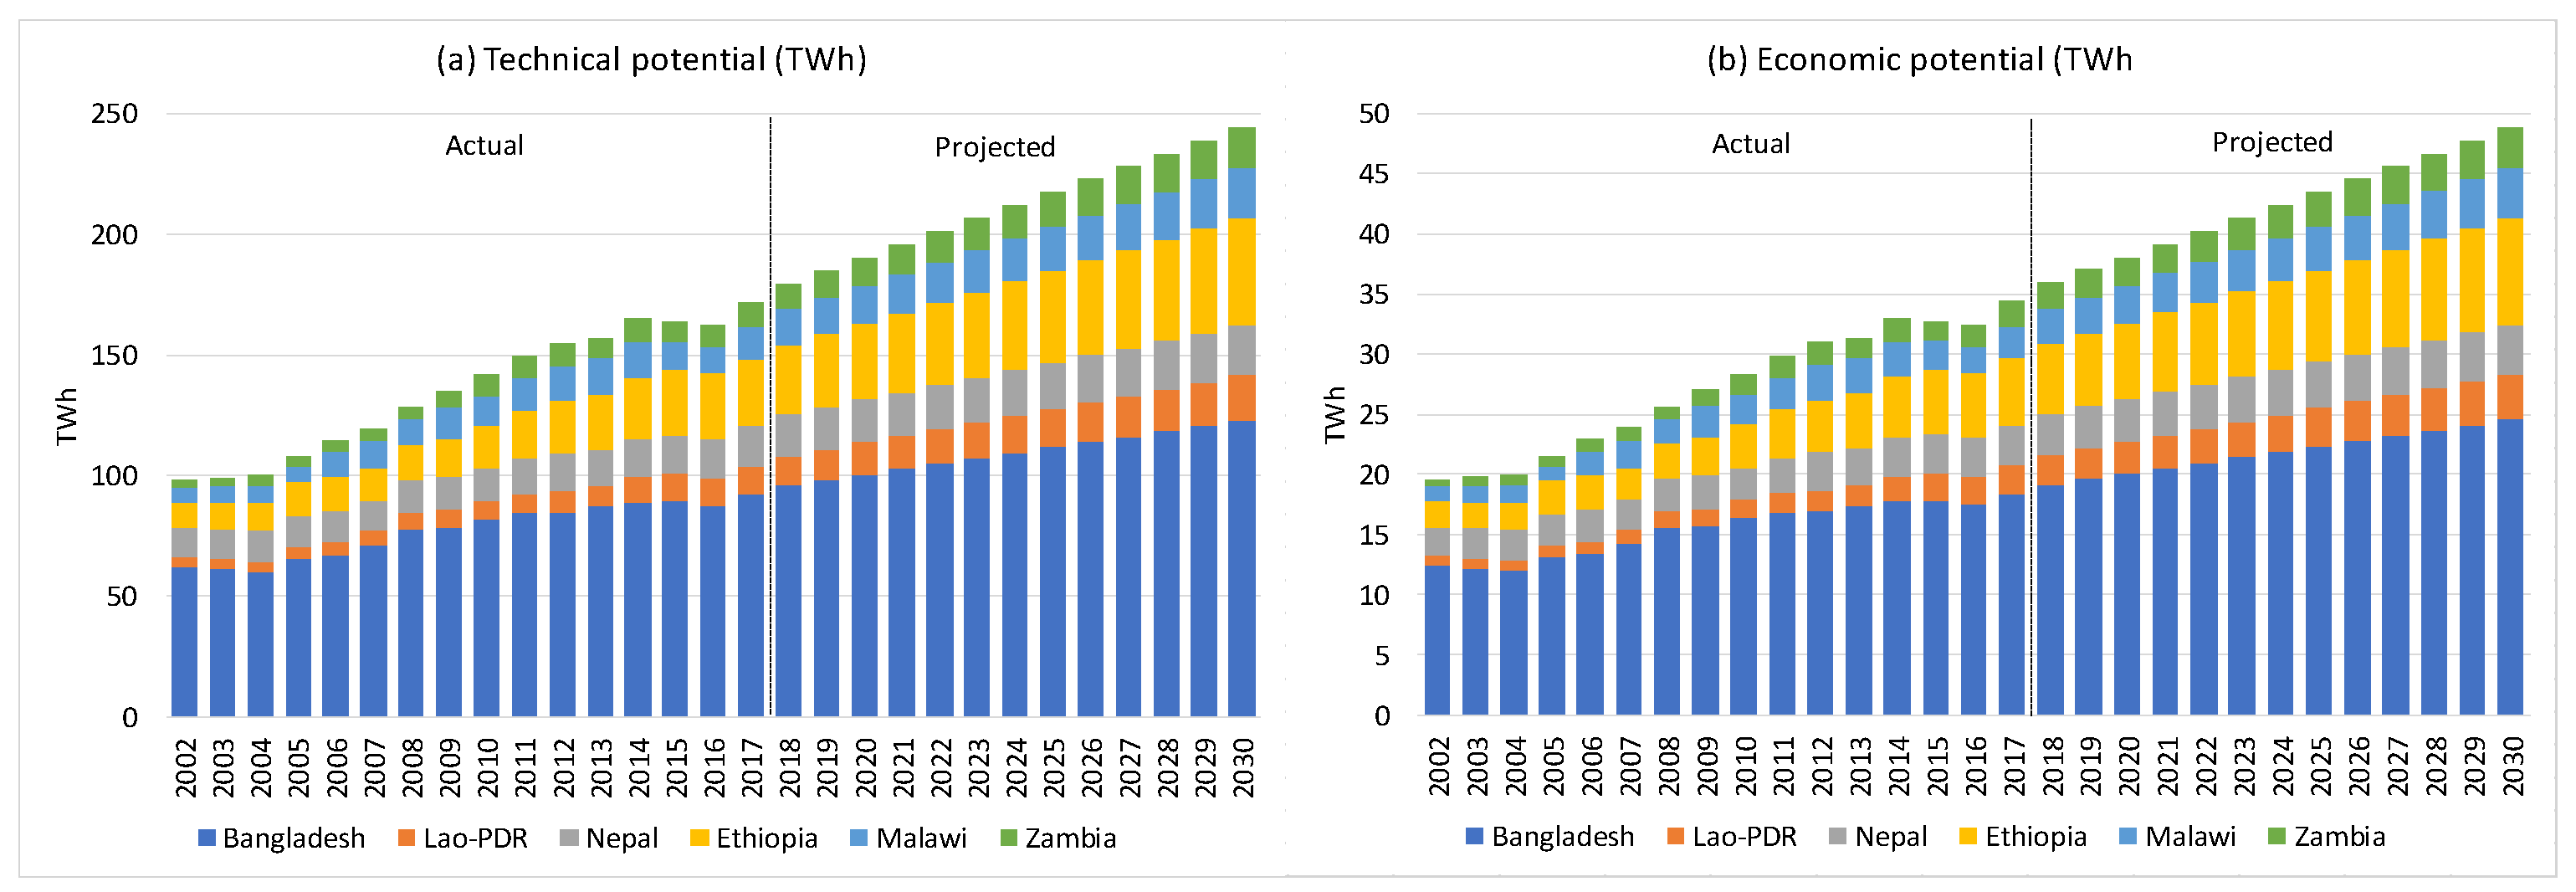
Figure 8 presents the historical and projected technical potential of agricultural residues by crop in the selected LDCs considered in this study. The annual technical potential of agricultural residue availability for bioelectricity and associated biomass power potential for six countries is presented in Table S9a of the supplementary information.
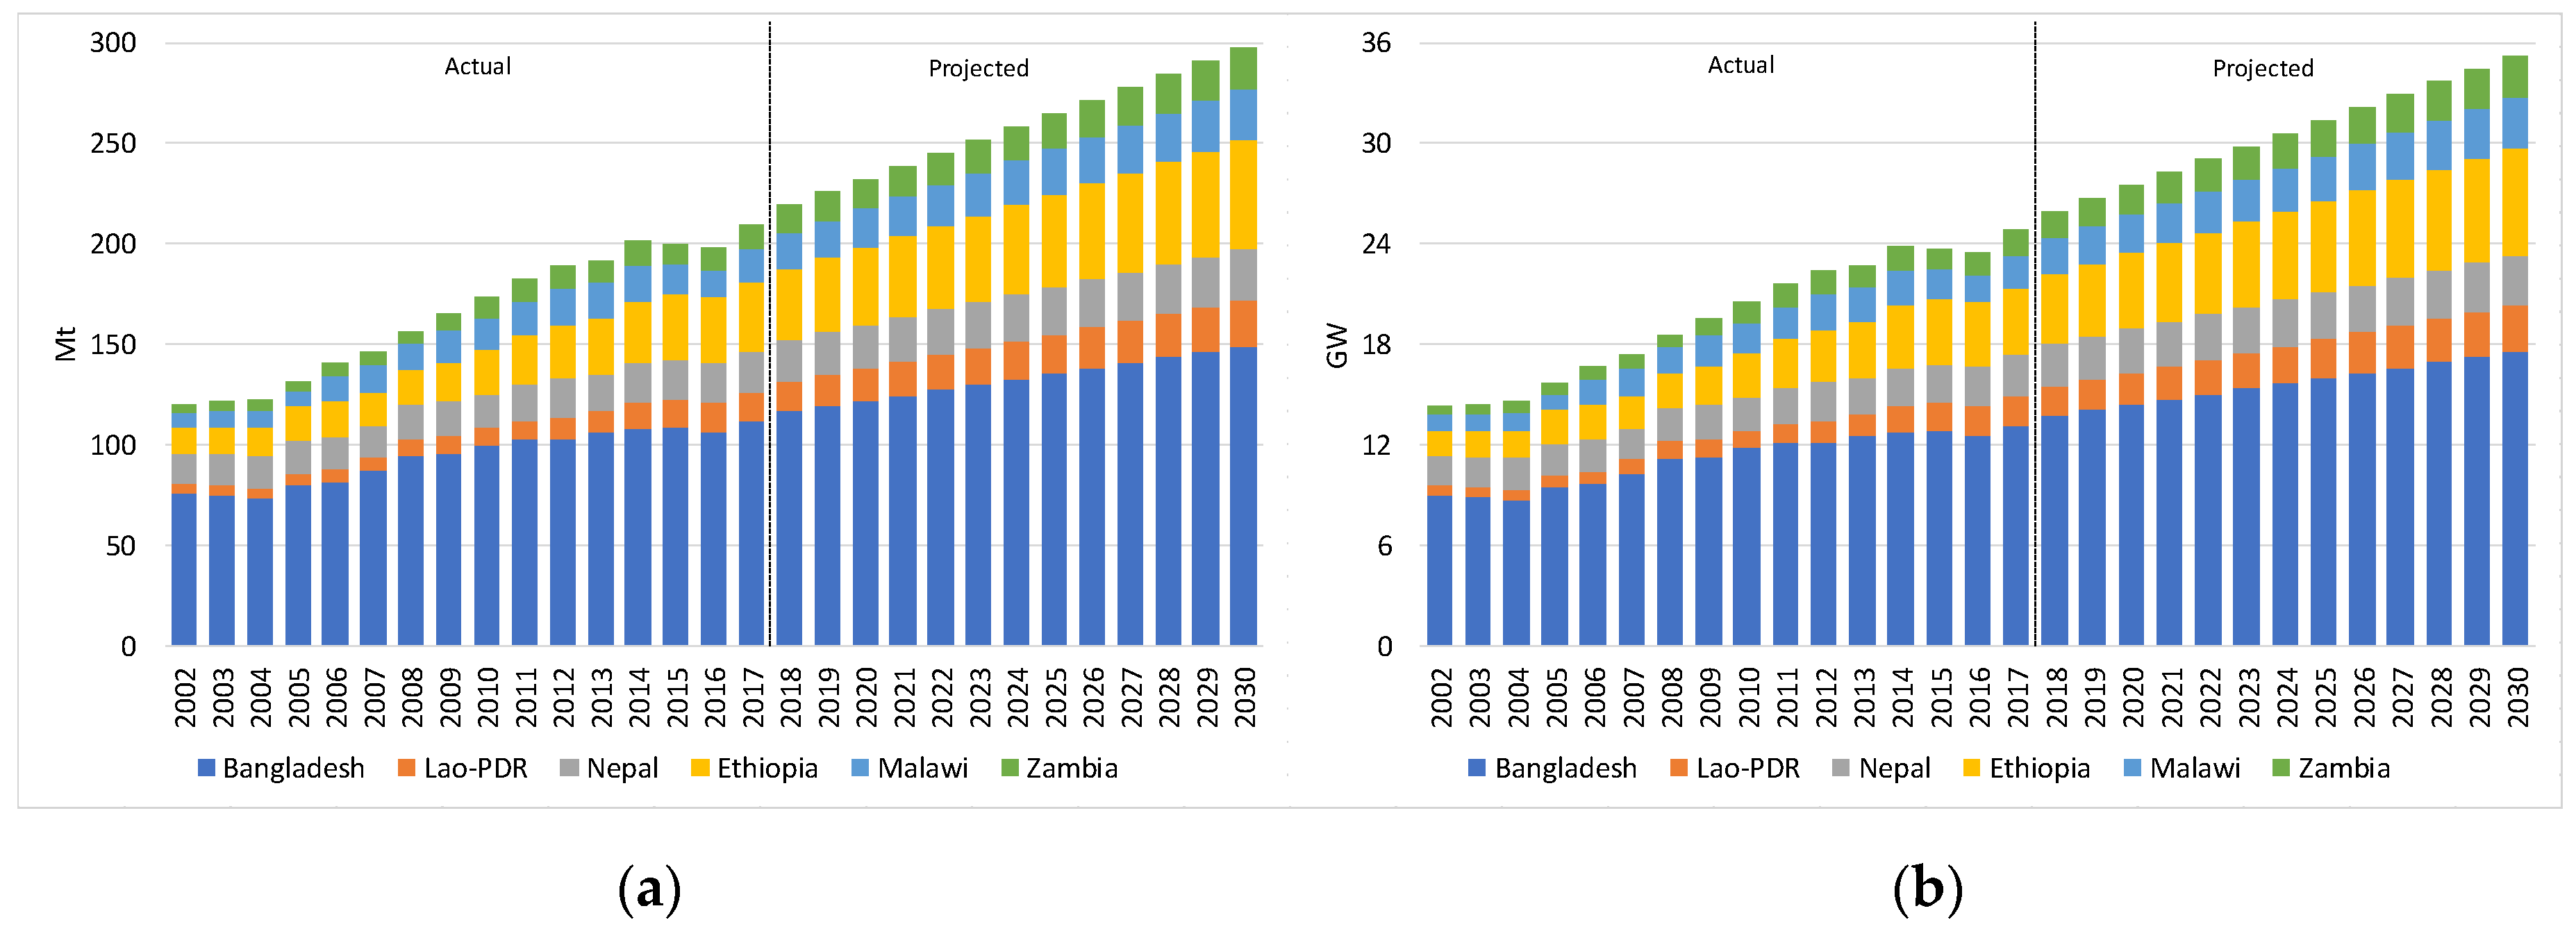
Figure 9 presents the technical potential of gross agricultural residue availability for biomass power generation in the selected LDCs considered in this study. The gross agricultural residue availability for energy applications is presented in the left panel whereas the technical potential of biomass power is shown in the right panel. The specific biomass consumption has been taken to be 1.21 kg/kWh with a capacity factor of 80% [65], whereas 1.6 kg/kWh specific bagasse consumption is assumed for bagasse-based co-generation units with a capacity factor of 53% [66]. For the base year 2017, the gross agricultural residue availability estimated at 111.4 Mt for Bangladesh is expected to increase 148.9 Mt by 2030. Using the assumptions on specific biomass/bagasse consumption, the technical potential of biomass power generation is estimated approximately at 13.2 and 17.6 GW, respectively, in 2017 and 2030. For Ethiopia, the gross agricultural residue availability estimated at 33.8 Mt in 2017 is expected to increase 54.1 Mt by 2030 (Figure 9). The associated technical potential of biomass power is estimated approximately at 4.0 and 6.4 GW, respectively, in 2017 and 2030. Similarly, in Lao-PDR, the gross agricultural residue availability estimated at 14.6 Mt in 2017 is expected to increase 22.9 Mt by 2030, whereas the technical potential of biomass power is estimated approximately at 1.7 and 2.7 GW, respectively, in 2017 and 2030. In Malawi, the gross agricultural residue availability estimated at 16.5 Mt in 2017 is expected to increase 25.5 Mt by 2030, whereas the technical potential of biomass power is estimated approximately at 2.0 and 3.0 GW, respectively, in 2017 and 2030 (Figure 9). In Nepal, the gross agricultural residue availability estimated at 20.6 Mt in 2017 is expected to increase 25.4 Mt by 2030, whereas the technical potential of biomass power is estimated approximately at 2.5 and 3.0 GW, respectively, in 2017 and 2030 (Figure 9). For Zambia, the gross agricultural residue availability estimated at 13.0 Mt in 2017 is expected to increase 20.8 Mt by 2030, whereas the technical potential of biomass power is estimated approximately at 1.6 and 2.5 GW, respectively, in 2017 and 2030 as shown in Figure 9 (see Table S9a).
The use of crop residues varies from region to region and depends on their calorific values, lignin content, density, palatability by livestock, and nutritive value. The residues of most of the cereals and pulses have fodder value. However, the woody nature of the residues of some crops restricts their utilization to fuel uses only. The dominant end uses of crop residues in the LDCs are as fodder for cattle, fuel for cooking, and thatch material for housing [17,67,68,69]. All the non-fodder, non-fertilizer agricultural residues with low moisture content can, in principle, be considered as feedstocks for energy applications. Approximately, 10% of the total amount of agricultural residues is lost in the collection, transportation, and storage, whereas another 15% of the total amount of agricultural residues is used in other competing applications [54]. A recent study by Purohit and Fischer [68] estimated that approximately 53% of the gross residue availability is used for fodder applications in India. Therefore, as mentioned above, to assess the economic potential of agricultural residues in the LDCs in this study we have assumed a conservative estimate of 20% of the gross residue availability (technical potential) used for energy applications. 
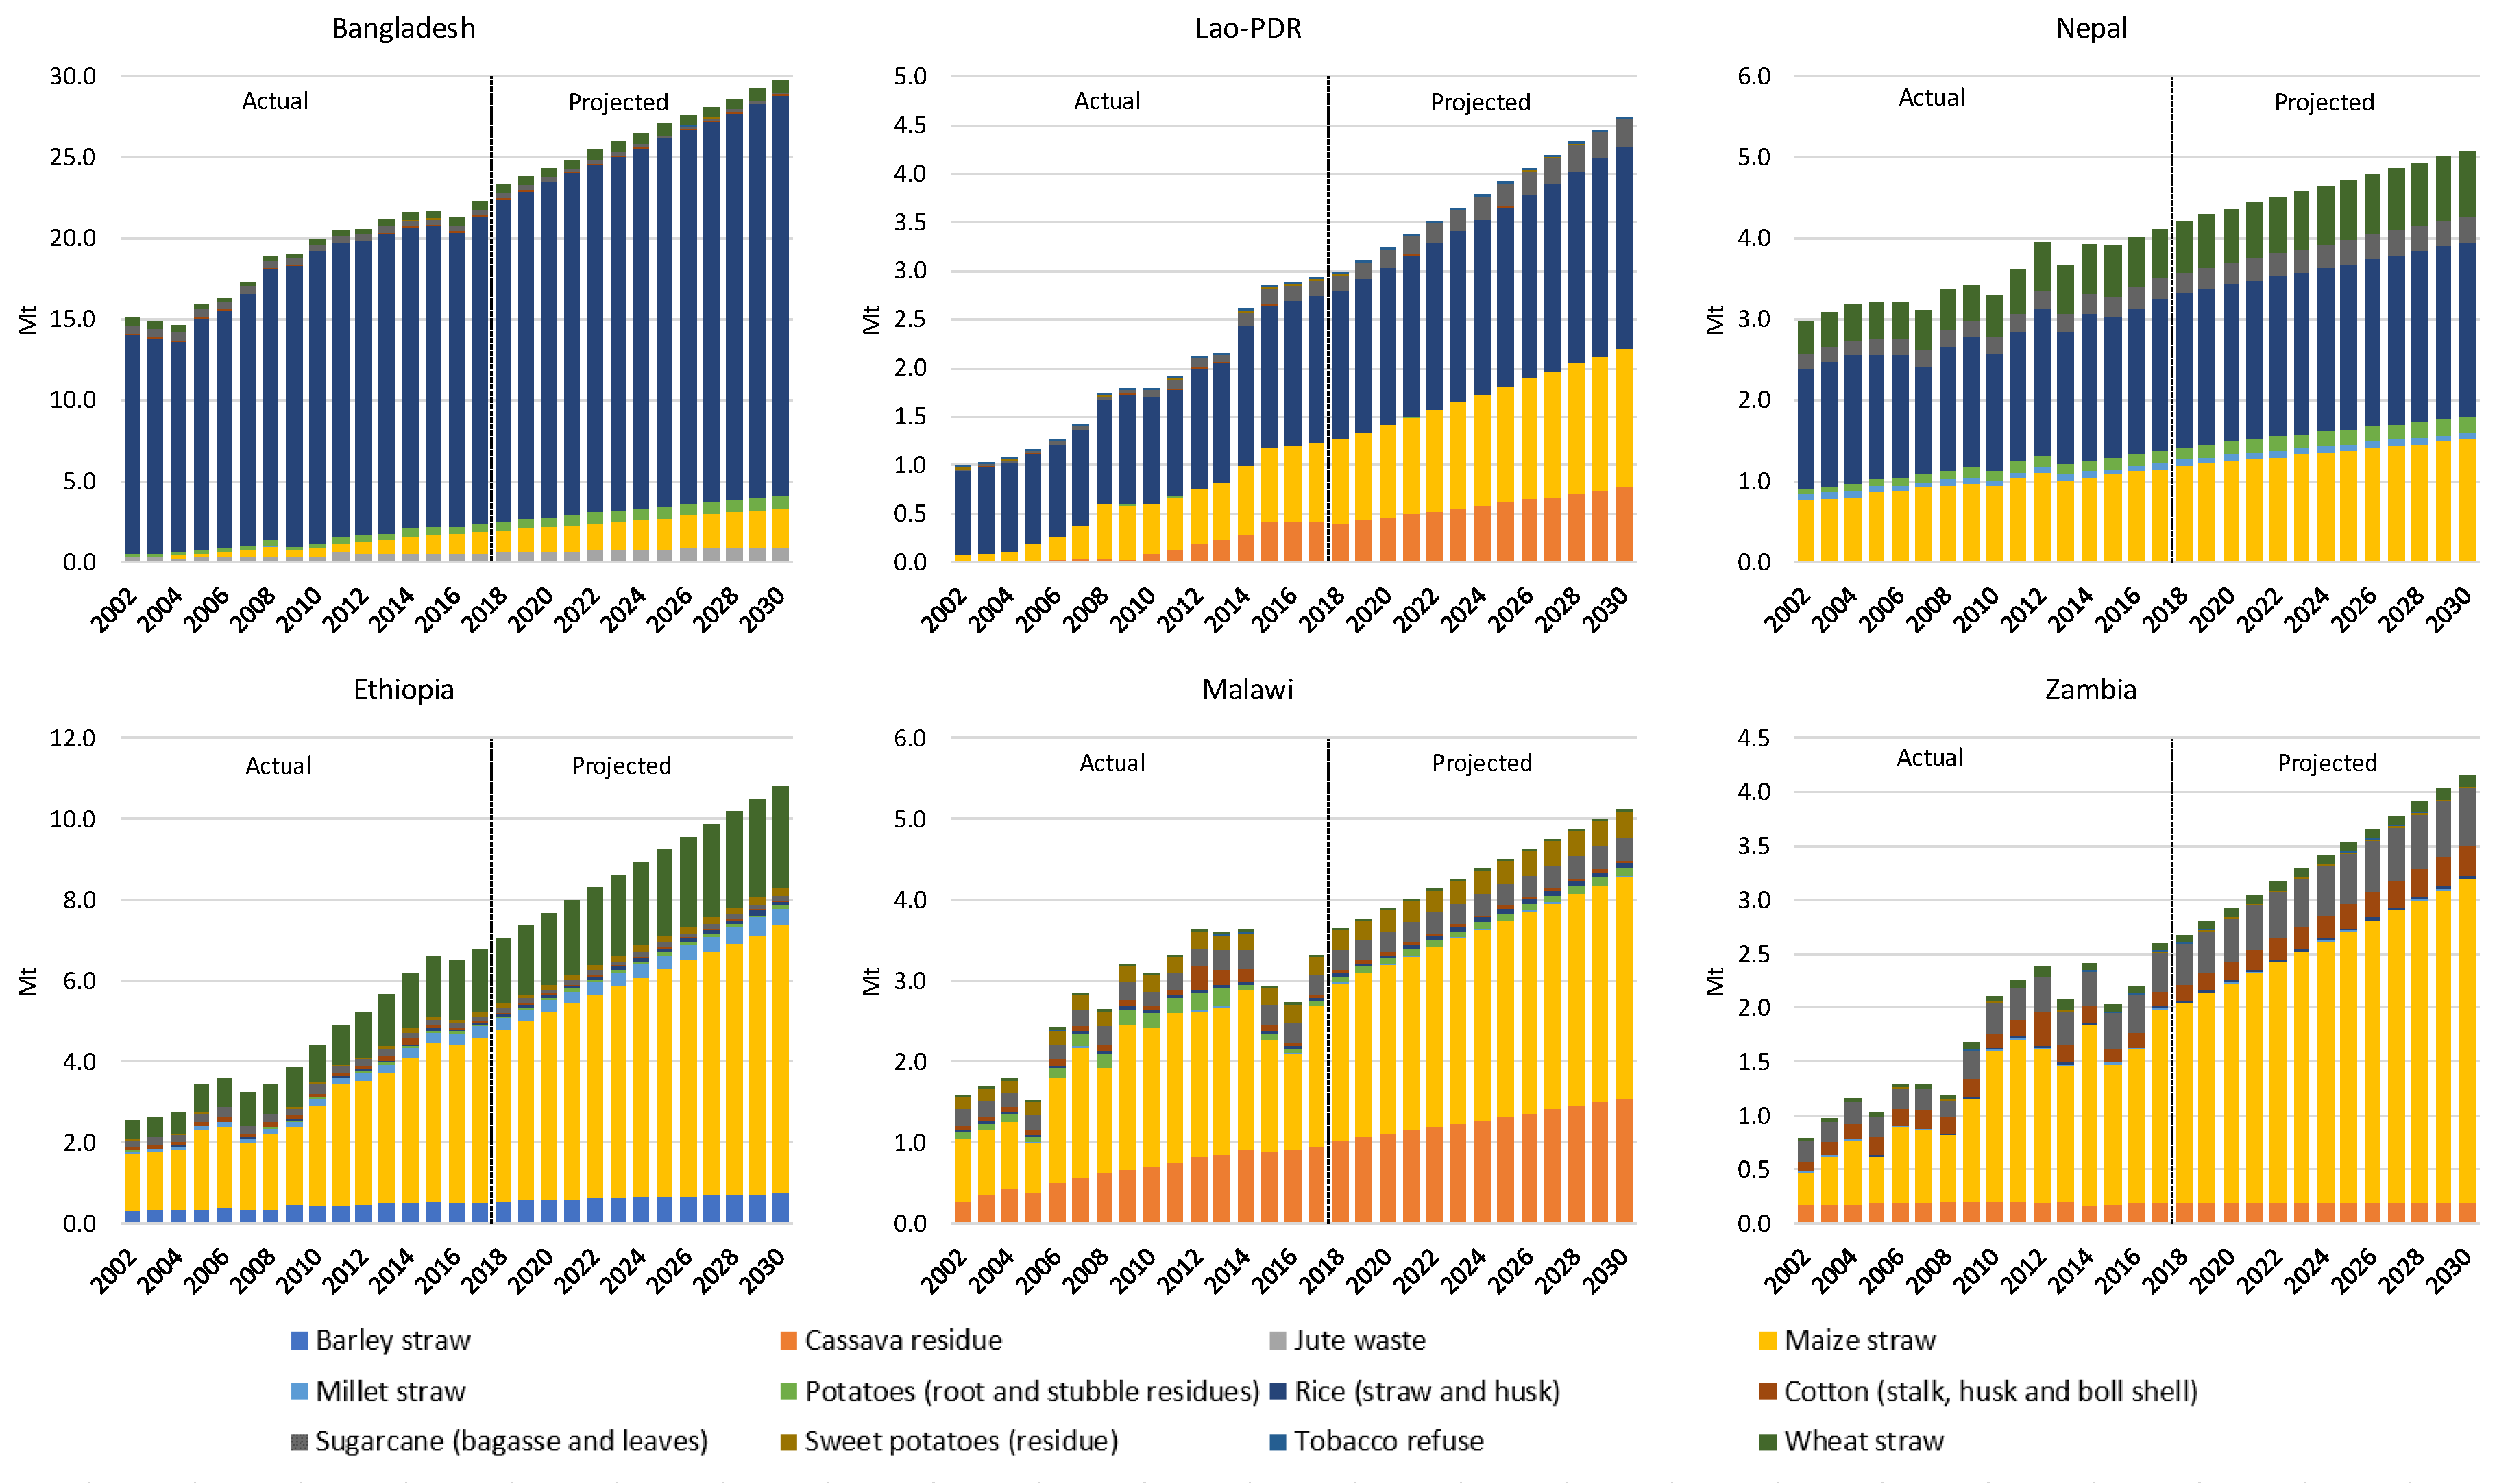
Figure 10 presents the historical and projected the economic potential of agricultural residues by crop in selected LDCs considered in this study. The annual economic potential based on surplus agricultural residue availability for bioelectricity and associated biomass power potential for six LDCs considered in this study is presented in Table S9b of the supplementary information.
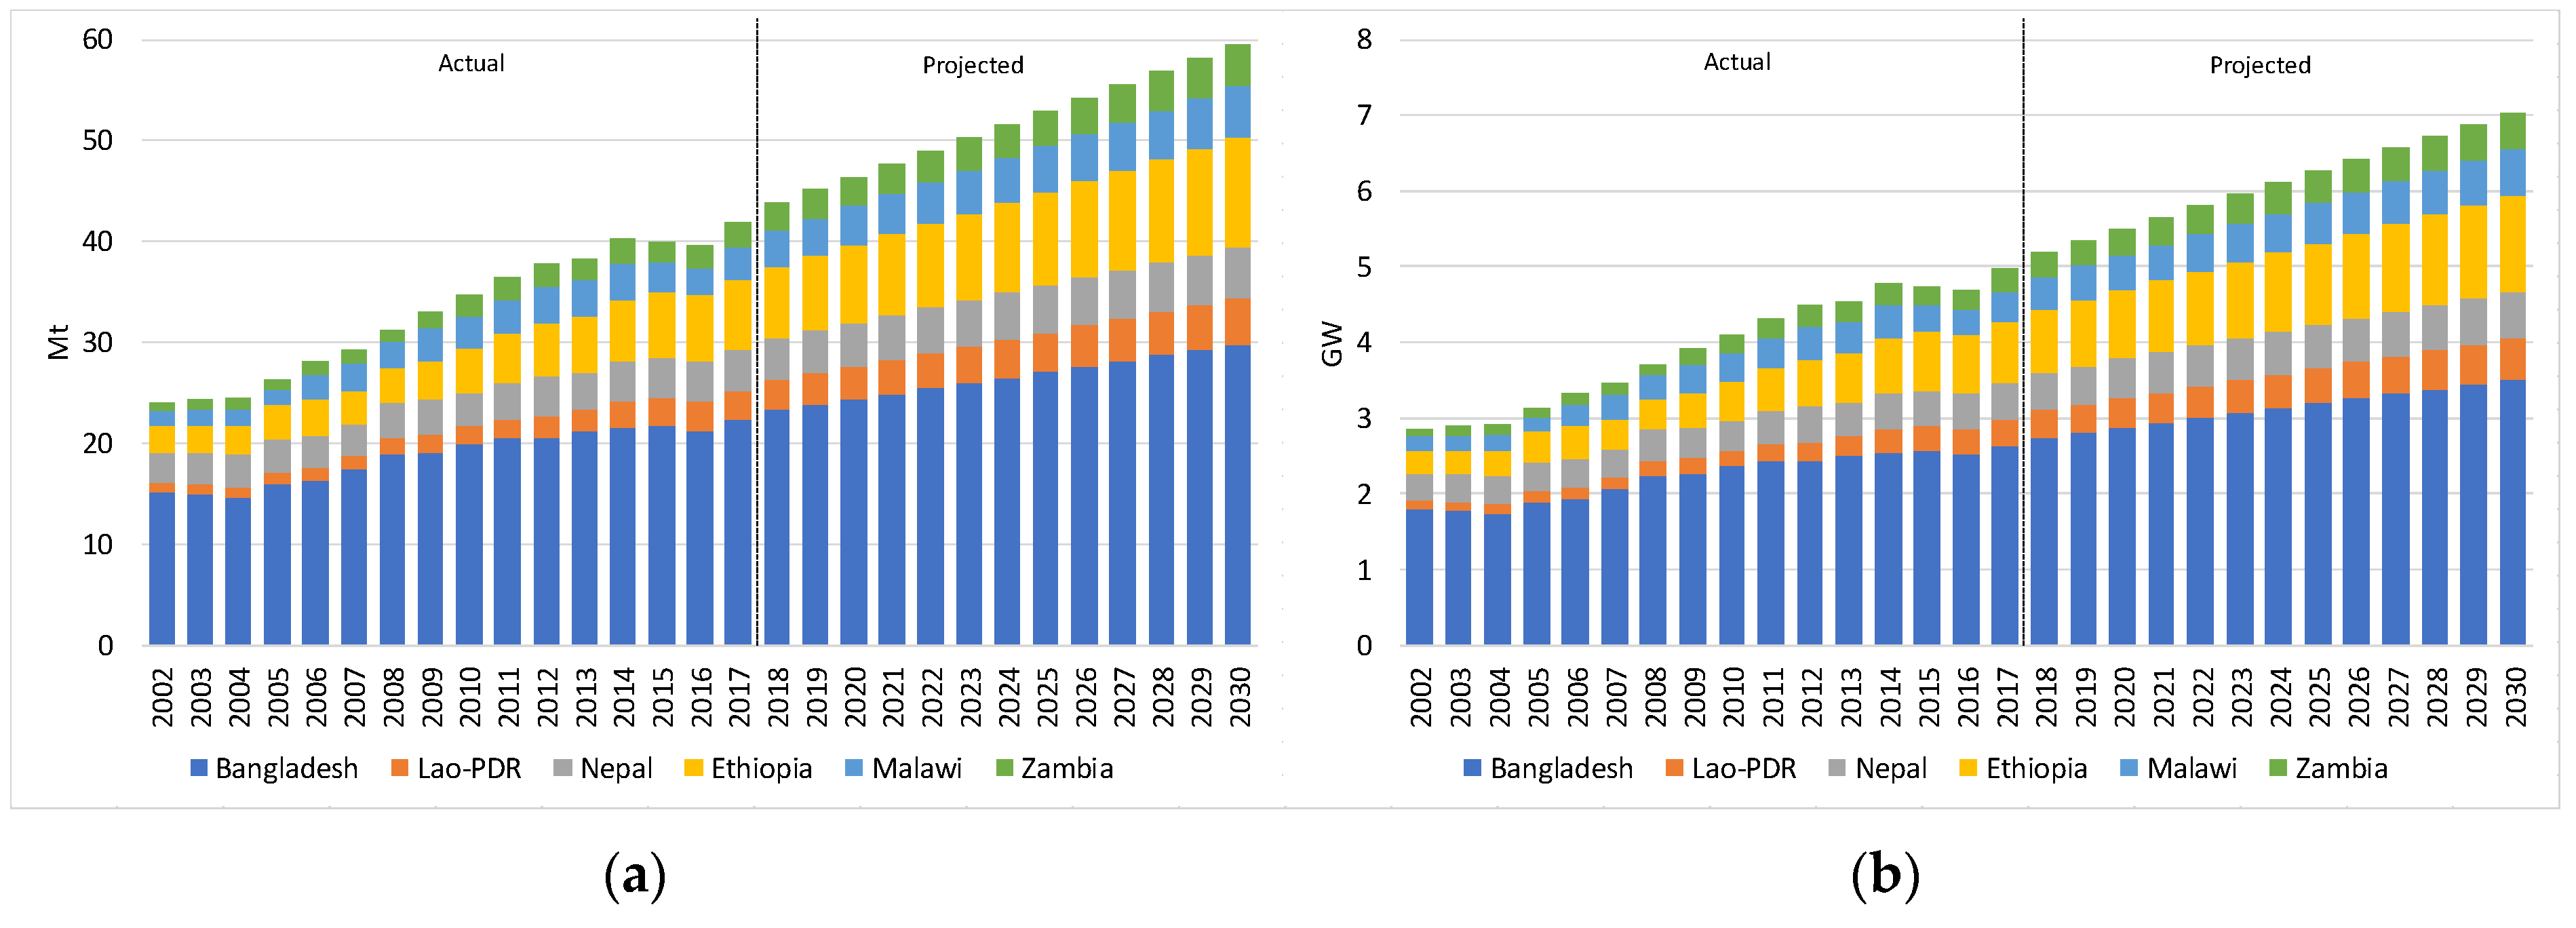
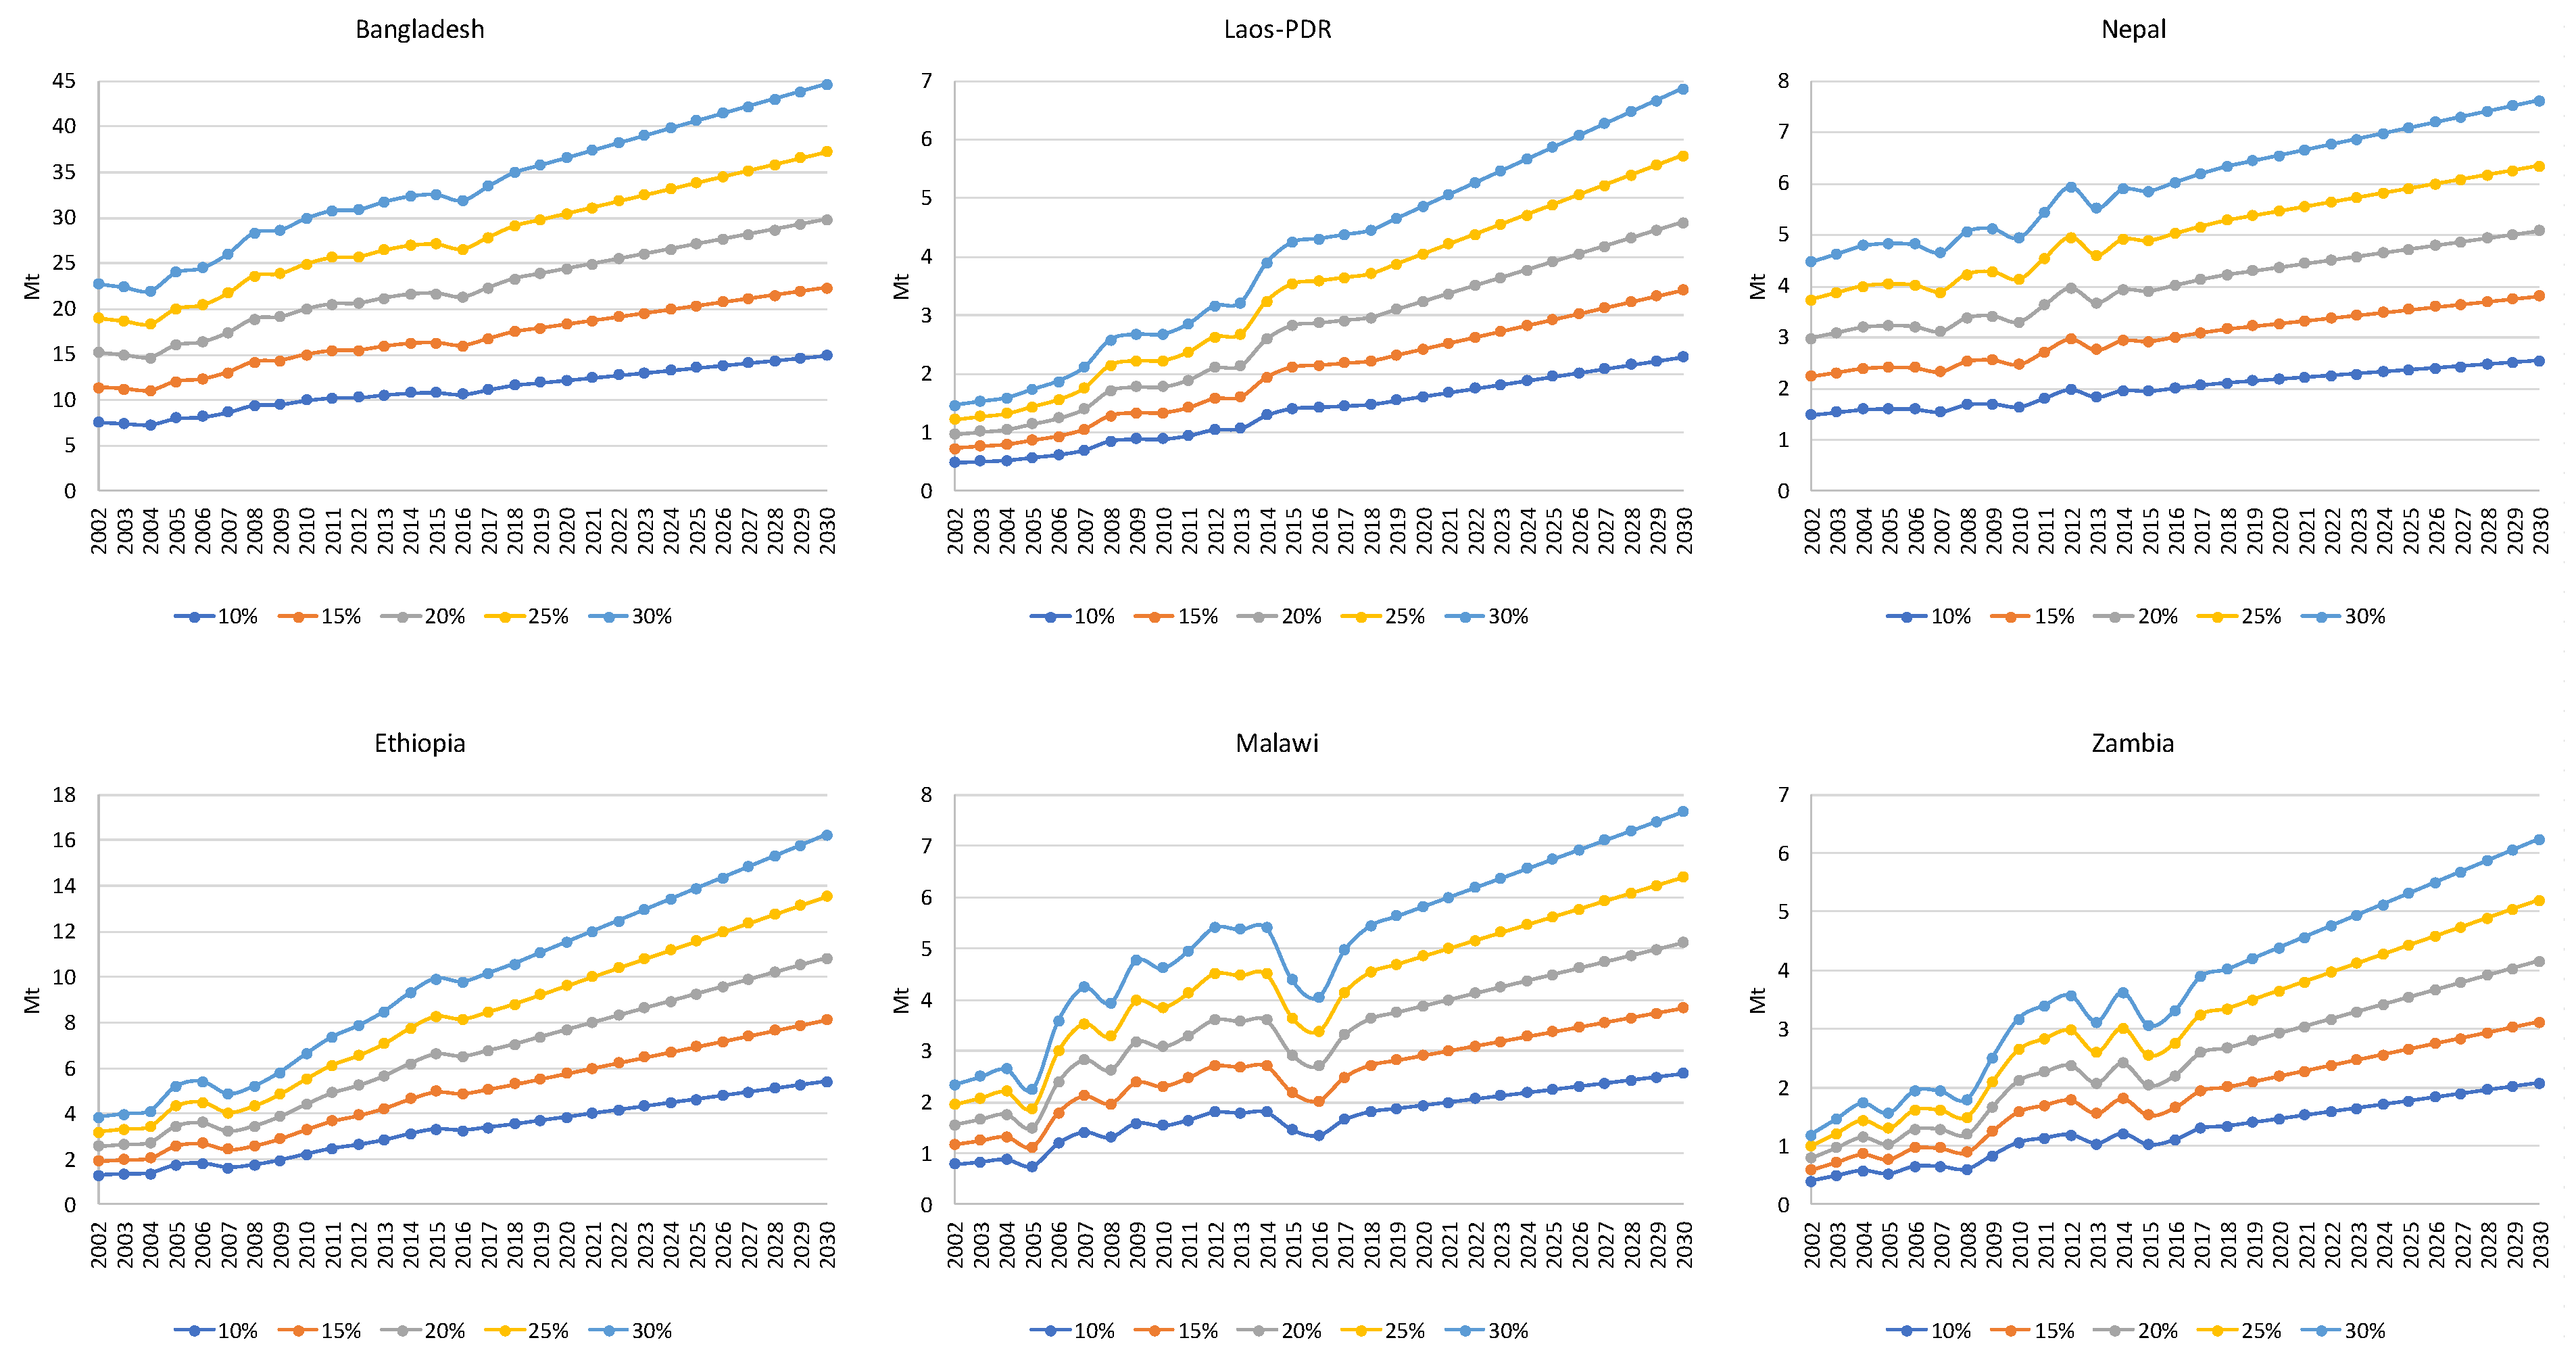
Figure 11 presents the economic potential of surplus agricultural residue availability for biomass power generation in the selected LDCs considered in this study. The surplus agricultural residue availability for energy applications is presented in the left panel whereas the economic potential of biomass power is shown in the right panel. For the base year 2017, the surplus agricultural residue availability was estimated at 22.3 Mt for Bangladesh is expected to increase 29.8 Mt by 2030. The economic potential of biomass power generation is estimated approximately at 2.6 and 3.5 GW, respectively, in 2017 and 2030. For Ethiopia, the surplus agricultural residue availability was estimated at 6.8 Mt in 2017 is expected to increase by 10.8 Mt by 2030. The associated technical potential of biomass power is estimated approximately at 0.8 and 1.3 GW, respectively, in 2017 and 2030. Similarly, in Lao-PDR the surplus agricultural residue availability was estimated at 2.9 Mt in 2017 is expected to increase approximately 4.6 Mt by 2030, whereas the technical potential of biomass power is estimated approximately at 0.3 and 0.5 GW, respectively, in 2017 and 2030. In Malawi, the surplus agricultural residue availability was estimated at 3.3 Mt in 2017 is expected to increase 5.1 Mt by 2030, whereas the technical potential of biomass power is estimated approximately at 0.4 and 0.6 GW, respectively, in 2017 and 2030. In Nepal, the surplus agricultural residue availability was estimated at 4.1 Mt in 2017 is expected to increase 5.1 Mt by 2030, whereas the technical potential of biomass power is estimated approximately at 0.5 and 0.6 GW, respectively, in 2017 and 2030. For Zambia, the surplus agricultural residue availability was estimated at 2.6 Mt in 2017 is expected to increase about 4.2 Mt by 2030, whereas the technical potential of biomass power is estimated approximately at 0.3 and 0.5 GW, respectively, in 2017 and 2030 as shown in Figure 11 (see Table S9b).
The prevailing practices of using agricultural residues for alternative applications (fuel, fodder, construction materials, cardboard industry, etc.) varied across the countries analyzed in this study. Therefore, we have carried out a sensitivity analysis to show the impact of using different shares of surplus agricultural residues on biomass availability for energy applications (Figure 12). As expected, surplus biomass feedstock availability and associated bioelectricity potential are highly sensitive to the collection, transportation, and storage losses, and other prevailing practices of agricultural residue used for several end-use applications across the countries analyzed in this study.

5. Electricity Supply and the Role of Bioelectricity for Meeting the SDG7

5.1. Technical and Economic Potential of Bioelectricity in the Selected LDCs

Using the input parameters and assumptions mentioned above (Section 4), Figure 13 presents the technical and economic potential (in TWh) of electricity generation based on gross (technical) and net (economic) agricultural residue availability in selected LDCs. Table S9c presents the technical and economic potential of agricultural residues for bioelectricity in the selected LDCs.
Table 4 presents the economic potential of biomass power (MW) and its contribution (% share) in peak power demand of the selected LDCs. In Malawi, bioelectricity contributed around 92% of the total installed capacity, followed by Nepal (30%), Bangladesh (24%), Lao-PDR (22%), Ethiopia (21%), and Zambia (12%) in 2017 (see Table 4). Table 5 provides the economic potential of bioelectricity (GWh) and its contribution to the total electricity demand of the selected LDCs. It is observed that in the base year 2017, bioelectricity obtained from surplus agricultural residues provided 110% of the total electricity demand in Malawi, followed by Nepal (45%), Bangladesh (29%), Lao-PDR (29%), Ethiopia (27%), and Zambia (13%). As expected, the share of bioelectricity will decrease in the near future primarily due to the rapidly increasing demand for electricity in the selected LDCs (see Table 5).

5.2. Achieving Universal Access to Electricity (SDG7.1) in the Rural Households in the LDCs

As mentioned above, access to electricity is critically important for economic development in the LDCs. SDG7.1 (Indicator 7.1.1) aims to achieve affordable, reliable, and modern electricity access at the household level by 2030 (see Table S3). Electricity consumption (kWh/capita) and HDI score (development indicators) are proportionally related, i.e., higher electricity consumption leads to the higher development and human welfare indicators [70,71]. Rural households in the LDCs lack electricity access and it is important to provide basic electricity services. This should be affordable since the households cannot spend a lot of their monthly expenditure on purchasing electricity [72]. The “Energy for All” initiative aims at providing electricity access at the initial level of 250 kWh per rural household [72]. Brecha [70,71] argues that access to sufficient amounts of electricity is a prerequisite for social well-being and proposes an electricity access threshold for meeting non-energy SDGs at 400 kWh per capita, i.e., less than this average per capita threshold may lead to the poor HDI score.
The World Bank developed a framework/matrix for measuring access to household supply [73] and the UNDP recently reflected on how the electricity consumption is related to the SDG1, SDG3, SDG4, SDG5 using the five tiers of access to electricity [74]. The first scenario or level of electricity consumption would be “Tier 1,” i.e., lighting and phone charging. The indicative consumption of electricity per household in the five tiers is presented in Table 6. If we consider lighting, phone charging, television, and medium power appliances, the total annual electricity consumption per household would be more than 365 kWh [73].
The average household size varies from 4–5 persons in the LDCs [75]. Table 7 provides the number of rural households in the LDCs and bioelectricity available for domestic uses. The study finds that bioelectricity can meet the Tier 3 electricity demand in the rural households (see Table 6 and Table 7), except in Ethiopia. Lao-PDR has the highest bioelectricity supply, i.e., 522 kWh/capita, which crosses the 400 kWh threshold for meeting the SDGs, followed by Zambia (211 kWh/capita), Malawi (183 kWh/capita), Bangladesh (179 kWh/capita), Nepal (151 kWh/capita), and Ethiopia (66 kWh/capita).

5.3. Strengthening Interlinkages: Modern Bioenergy, SDG7, and Other SDGs

As mentioned above, low-income countries in SSA and Asia are predominantly using traditional biomass in inefficient devices for cooking and heating purposes. Modern bioenergy has a potentially positive impact on the fulfillment of the SDGs, ranging from SDG7 (increase share of RE) to SDG13 (mitigation of climate change), SDG1 (no poverty) and SDG8 (on poverty and economic growth, e.g., by enhancing the competitiveness of agro-industries, thus contributing to job creation and social welfare). It is important to discuss the interlinkages between modern bioenergy production and targets of SDGs. Recently, Fritsche et al. [76] presented the interlinkages between the SDGs and the Sustainability Indicators for Bioenergy (GSI). Souza et al. [77] highlighted the role of bioenergy in a climate-changing world. Synergies on food security and bioenergy, improvement in resource efficiency, and integrated assessment of bioenergy systems are needed for meeting the SDGs. IRENA (International Renewable Energy Agency 2017) has highlighted the constructive role of bioenergy in achieving the agreed UN SDGs and implementing the Paris Agreement on Climate Change [78]. This includes climate goals (SDG13), food security (SDG2), better land use (SDG15), and clean and sustainable energy (SDG7). A holistic approach is required to evaluate the performance of bioenergy supply chains for meeting SDGs, including energy and food security, and socio-economic development.
Rural electrification based on biomass power would greatly contribute to the welfare of rural people. The implications are obviously lighting, (also TV and radio), education, health, productivity increase, and environment [79]. Kerosene lamps are widely used for lighting the households in low-income countries. Around 53% of the population still use kerosene or oil lamps for lighting purposes in SSA (WHO, 2016) as there is no access to electricity. Small particulate matters (PM) emissions would be emitted while burning the lamps and they are associated with severe indoor health risks [80,81]. Lam et al. [82] observed that reductions to fine particulate matter (PM2.5) resulting from reducing kerosene use for lighting in India could avert between 50 and 300 thousand adult DALYs (Disability Adjusted Life Years Lost) in 2030. Bioelectricity can help replace kerosene lamps, thereby improving indoor air quality and reducing associated health impacts and saving fossil fuel (kerosene).
When food systems are integrated with agricultural residues for energy production, there would be an increase in agricultural productivity and income of small-scale food producers (SDG2.3). As mentioned above, the open burning of agricultural residues would cause air pollution. Abandoned biomass residues are collected and utilized in agro-industries, such as sugarcane industries or rice mills, can help improve the competitiveness of agro-industries and the economic contribution of the agriculture sector would increase. Thus, biomass power would contribute to improving the productivity and incomes of small-scale food producers (SDG2.4).
If we use bioelectricity for productive use in SMEs (small and medium enterprises) or water pumping or to electricity in schools and hospitals for displacing diesel/back-up generator, there would be direct GHG savings in a range of 1.7 Mt (Lao-PDR) to 13.4 Mt (Bangladesh). Table 8 shows the potential diesel substitution and GHG emissions mitigation potential in the selected LDCs. Modern bioenergy contributes to reducing GHG emissions and brings added benefits [77]. Electricity supply might also contribute in increasing the crop yields (agricultural productivity) by irrigating farmlands using water-pumping schemes.

5.4. Bioelectricity: Complementarity with Hydropower and Synergy with Agro-Industries

Nepal has only harnessed around 1.3% (i.e., 1051 MW hydropower from the total potential 83,000 MW) hydropower potential mainly due to the high cost of constructing large power plants, the scattered population in rural areas, and associated grid extension costs in remote and mountainous topography [84]. Therefore, distributed or isolated electricity systems such as small micro-hydro, solar, and bio-power (electricity from biomass) might be one of the reliable alternative options for rural electrification. The Government of Nepal (GoN) has enacted policy instruments (subsidies and tax benefits) to promote the RE (especially micro-hydro and solar photovoltaic systems) which has provided electricity to more than 12% of the country’s population [42]. Most of the hydropower plants in Nepal are of run-of-rivers types [28,43]. This means that the water flow varies significantly between the wet and dry seasons. Therefore, electricity generation fluctuates and is highly seasonal. In the past, Nepal has faced an extended load-shedding [19], resulting in negative implications for economic development in the country. It is important to complement hydroelectricity by other sources of electricity. This not only helps to reduce the cost of electricity infrastructure but also to reduce the electricity imports and promote the rural development. Nepal has also planned to generate 220 MW of electricity from bioenergy by 2030 in its first NDC (Nationally Determined Contribution) report [85].
In Zambia, electricity generation has not increased in the last three years [41], mainly due to less water flows in rivers, leading to negative consequences on the nation’s economic growth. The country also imports electricity from the neighboring countries (such as Mozambique and South Africa) depending upon the availability of water in rivers. For example, the country has imported 1391 GWh electricity in 2016 [41]. As mentioned earlier, Zambia’s electricity supply is dominated by hydropower. Recently, Zambia has experienced an extended load-shedding (power-cuts) in the country, reducing its electricity consumption by 30% in 2015 [47]. This is mainly due to low water levels in reservoirs and declining water flows in rivers [46]. Thus, it is important to diversify electricity generation capacity for sustaining the current level of economic growth in order to meet SDGs.
In Malawi, electricity generation output reduced to 150 MW in December 2017, due to less water flow in the river, with more than two times reduction compared to its installed capacity [51]. This is to mention that 98% of this electricity comes from hydropower plants installed along the Shire River [45]. The installed capacity for electricity generation is lower than the demand. Thus, biomass-based electricity could enhance the security of electricity supply in Malawi. Furthermore, the household or domestic sector consumes a large amount of electricity and peak demand occurs in the morning and evening. For example, in Zambia the highest power demand (peak demand) happens between 7:00–10:00 a.m. and 4:00–9:00 p.m. [52]. Therefore, bioelectricity from agriculture residues can contribute to both baseload and peak-load power in the LDCs.
How much biomass power can contribute to meeting the existing domestic consumption and saving the import of electricity from the neighboring countries? Bioelectricity could cover 57% of the domestic energy consumption in Bangladesh, 90% in Ethiopia, and 43% in Zambia. Interestingly, bioelectricity is more than the domestic demand in Nepal, Lao-PDR, and Malawi (Table 9). On the other hand, imported electricity can be fully substituted by bioelectricity in Bangladesh, Lao-PDR, and Nepal.
Electricity production from agricultural residues would help in improving the economic competitiveness of agro-industries such as sugarcane mills and rice mills. Surplus electricity from the mills can be sold to the grid. This needs high attention from policymakers since agricultural productivity has been stagnating in many other developing countries and the sector’s contribution to GDP is decreasing across the LDCs analyzed in this study.

5.5. Realizing the Bioelectricity Potential—A Way Forward

There are several technologies for energy generation from biomass [19,65,86,87,88,89], mainly combustion (heat and power plants) and gasification (gasifier coupled with gas or diesel engine). Biomass combustion is a widely used technology for power generation from agricultural residues and biomass co-products [19]. Recently, electricity from biomass gasification has fast emerged for rural electrification using agricultural residues in developing countries [87]. Rice- and straw-based biomass power plants can be integrated with other electricity sources and the utility grid [90]. A few novel technologies on efficient conversion of biomass are being investigated [91], which may help in diversifying the energy systems using different pathways.
Biomass gasification generates producer gas (a mixture of combustible gas) which can be later combusted in a diesel engine (in dual mode) or cent percent (100%) gas engines for producing electricity. Thus, it is suitable for distributed or off-grid power for rural areas. We need to scrutinize several factors such as the price of biomass, investments, logistics costs, electricity price, environmental constraints, and regulatory uncertainties for making the biomass gasifiers cost-competitive [89,90,92,93].
Despite government policies on modernizing bioenergy in the LDCs, there is a lack of investments in biomass power projects. Therefore, governments should make efforts towards creating a favorable environment for electricity generation from agricultural residues, ranging from policy frameworks, financing, and business models. The utilization of agricultural residues for decentralized power generation could also provide financial incentives to the farmers if the pricing system for agricultural biomass is well designed. The involvement of local agencies and stakeholders (farmers, agro-industries, and investors) is also important in a successful implementation of efficient biomass power technologies. A synergetic approach with other sectors of the economy such as agriculture and industry would help in mobilizing the stakeholders and resources, especially investments.

6. Conclusions

Least Developed Countries (LDCs) still do not have full access to modern energy services (electricity and clean cooking fuel), especially in rural areas. The utilization of conservative and environmentally benign amounts of only 20% of surplus agricultural residues for bioelectricity could help complement the grid regarding baseload electricity supply as well as provision of the service to rural households via decentralized systems in developing countries. Bioelectricity can provide power to small and medium enterprises (e.g., agro-industries) and help in modernizing agricultural systems such as irrigation and tillage operation, thereby improving the agricultural yield.
Modern bioenergy would help in creating synergies with other sectors of the economy such as agriculture, industry, and rural development. The productive uses of bioelectricity in agro-industries can substitute backup fossil-based generators. Based on findings, surplus agricultural residues could provide the total current electricity demand in Malawi alone, followed by Nepal (45%), Bangladesh (29%), Lao-PDR (29%), Ethiopia (27%), and Zambia (13%). This study also explores the complementarity and synergies of bioelectricity, SDG7, and their interlinkages with other SDGs. Bioelectricity could potentially improve ambient air quality and improve public health (SDG3) and reduce GHG emissions (SDG13) as well. It is recommended that the transition to bioelectricity needs to be planned together with investment plans, infrastructure, linkages with other sustainable development goals (SDGs), and engagement with relevant stakeholders (investors and policymakers). The established positive link with the other SDGs would help expedite the process of transitions towards the effective use of bioelectricity in the LDCs.
Technologies for biomass to bioelectricity conversion are mature. As part of the global climate agenda for reducing GHG emissions, promotion of sustainable RE technologies, and universal access to electricity, international cooperation might be sought to attract financing for a successful implementation of bioelectricity projects. This will help promote clean electricity using local indigenous resources. Hence, the management of biomass logistics and financing options should be further explored while harnessing the bioelectricity potential. A systems approach in policy design and close cooperation with public and private sectors is needed together with the engagement of farmers and communities in energy planning at the local level. Therefore, bioelectricity holds the potential to provide a catalytic role in mobilizing efforts to create a new impulse in national economies in the studied LDCs and other developing countries.

Supplementary Materials

The following are available online at https://www.mdpi.com/2071-1050/11/24/7091/s1, Figure S1. LDCs analyzed in the present study; Figure S2. GDP growth rate in the selected LDCs; Figure S3. Population and urbanization pattern in the selected LDCs; Figure S4. Electricity access from 1990 to 2016 in the world, South Asia, SSA and selected LDCs; Table S1. Total Primary Energy Supply (TPES) in the LDCs by fuel source (in ktoe); Table S2. Land covered by agricultural and forest land (% of the country’s land area); Table S3. Targets and indicators for measuring SDG7; Table S4. Access to electricity—Indicator 7.1.1 in the rural and urban population in LDCs, 2000–2016, selected years; Table S5. Status of SDG7—Indicators: clean cooking (7.1.2), share of renewable energy (7.2.1) and primary energy intensity (7.3.1) in the LDCs (in 2016); Table S6. Primary energy Primary energy intensity (MJ per 2011 US$ PPP) in the selected LDCs; Table S7: Projection of peak load (load capacity) and electricity generation in the LDCs; Table S8a: Production of major crops by country in 2017; Table S8b: Residue to grain ratio for major crops in the LDCs; Table S9a: Technical potential of agricultural residues for bioelectricity; Table S9b: Economic potential of agricultural residues for bioelectricity; Table S9b: Economic potential of agricultural residues for bioelectricity; Table S9c: Technical and economic potential of agricultural residues for bioelectricity.

Author Contributions

Conceptualization, D.K., P.P., and E.K.A.; methodology, D.K., and P.P.; writing—original draft preparation, D.K., and P.P.; writing—review and editing, D.K., P.P., and E.K.A.

Funding

This research received no external funding.

Conflicts of Interest

The authors declare no conflict of interest.

Disclaimer

The opinions and recommendations expressed in this entry are those of the authors and do not necessarily reflect the views of KTH Royal Institute of Technology, International Institute for Applied Systems Analysis (IIASA) and/or UNEP DTU Partnership. The designations employed and the presentation of the material in this publication do not imply the expression of any opinion whatsoever on the part of KTH Royal Institute of Technology, International Institute for Applied Systems Analysis (IIASA) and/or UNEP DTU Partnership concerning the legal status of any country, territory, city, or area or of its authorities. References to different sources have been made in this document.

References

  1. UN (United Nations). About the Sustainable Development Goals—United Nations Sustainable Development. 2015. Available online: https://www.un.org/sustainabledevelopment/sustainable-development-goals/ (accessed on 24 September 2019).
  2. UNDP Goal 7: Affordable and Clean Energy. Available online: https://www.undp.org/content/undp/en/home/sustainable-development-goals/goal-7-affordable-and-clean-energy.html (accessed on 24 September 2019).
  3. UNCTAD. Chapter 2: Energy and inclusive economic structural transformation. In The Least Developed Countries Report 2017 (Transformational Energy Access); United Nations Conference on Trade and Development (UNCTAD): Geneva, Switzerland, 2017. [Google Scholar]
  4. UN (United Nations). LDC Identification Criteria & Indicators|Department of Economic and Social Affairs. 2019. Available online: https://www.un.org/development/desa/dpad/least-developed-country-category/ldc-criteria.html (accessed on 24 September 2019).
  5. Goldemberg, J.; Martinez-Gomez, J.; Sagar, A.; Smith, K.R. Household air pollution, health, and climate change: Cleaning the air. Environ. Res. Lett. 2018, 13, 030201. [Google Scholar] [CrossRef]
  6. Yip, F.; Christensen, B.; Sircar, K.; Naeher, L.; Bruce, N.; Pennise, D.; Lozier, M.; Pilishvili, T.; Loo Farrar, J.; Stanistreet, D.; et al. Assessment of traditional and improved stove use on household air pollution and personal exposures in rural western Kenya. Environ. Int. 2017, 99, 185–191. [Google Scholar] [CrossRef] [PubMed]
  7. Das, I.; Jagger, P.; Yeatts, K. Biomass cooking fuels and health outcomes for women in Malawi. HHS Public Access 2017, 25, 1032–1057. [Google Scholar] [CrossRef] [PubMed] [Green Version]
  8. Taulo, J.L.; Gondwe, K.J.; Sebitosi, A.B. Energy supply in Malawi: Options and issues. J. Energy South. Africa 2015, 26, 19–32. [Google Scholar] [CrossRef] [Green Version]
  9. Ministry of Energy and Mines. Lao PDR Energy Statistics 2018; Ministry of Energy and Mines: Vientiane, Lao People’s Democratic Republic (Lao PDR), 2018. [Google Scholar]
  10. IEA. “IEA Statistics” IEA—International Energy Agency. Available online: https://www.iea.org/statistics (accessed on 24 September 2019).
  11. World Bank. “World Bank Open Data—Statistics”. Available online: https://data.worldbank.org (accessed on 24 September 2019).
  12. UNCTAD. Statistical Tables on the Least Developed Countries—2017; United Nations Conference on Trade and Development (UNCTAD): Geneva, Switzerland, 2017. [Google Scholar]
  13. FAO-STAT. Crops: “FAO - Food and Agriculture Organization of the United Nations”. Available online: http://www.fao.org/faostat/en/#data/QC (accessed on 24 September 2019).
  14. Huda, A.S.N.; Mekhilef, S.; Ahsan, A. Biomass energy in Bangladesh: Current status and prospects. Renew. Sustain. Energy Rev. 2014, 30, 504–517. [Google Scholar] [CrossRef]
  15. Halder, P.K.; Paul, N.; Beg, M.R.A. Assessment of biomass energy resources and related technologies practice in Bangladesh. Renew. Sustain. Energy Rev. 2014, 39, 444–460. [Google Scholar] [CrossRef]
  16. Toth, G.G.; Nair, P.K.R.; Jacobson, M.; Widyaningsih, Y.; Duffy, C.P. Malawi’s energy needs and agroforestry: Impact of woodlots on fuelwood sales. Energy Sustain. Dev. 2019, 50, 101–108. [Google Scholar] [CrossRef]
  17. Shane, A.; Gheewala, S.H.; Fungtammasan, B.; Silalertruksa, T.; Bonnet, S.; Phiri, S. Bioenergy resource assessment for Zambia. Renew. Sustain. Energy Rev. 2016, 53, 93–104. [Google Scholar] [CrossRef]
  18. Gurung, A.; Oh, S.E. Conversion of traditional biomass into modern bioenergy systems: A review in context to improve the energy situation in Nepal. Renew. Energy 2013, 50, 206–213. [Google Scholar] [CrossRef]
  19. Khatiwada, D.; Seabra, J.; Silveira, S.; Walter, A. Power generation from sugarcane biomass—A complementary option to hydroelectricity in Nepal and Brazil. Energy 2012, 48, 241–254. [Google Scholar] [CrossRef]
  20. Ackom, E.K.; Alemagi, D.; Ackom, N.B.; Minang, P.A.; Tchoundjeu, Z. Modern bioenergy from agricultural and forestry residues in Cameroon: Potential, challenges and the way forward. Energy Policy 2013, 63, 101–113. [Google Scholar] [CrossRef]
  21. Sasaki, N.; Knorr, W.; Foster, D.R.; Etoh, H.; Ninomiya, H.; Chay, S.; Kim, S.; Sun, S. Woody biomass and bioenergy potentials in Southeast Asia between 1990 and 2020. Appl. Energy 2009, 86, S140–S150. [Google Scholar] [CrossRef] [Green Version]
  22. Kowsari, R. Three dimensional energy profile:: A conceptual framework for assessing household energy use. Energy Policy 2011, 39, 7505–7517. [Google Scholar] [CrossRef]
  23. Kander, A.; Stern, D.I. Economic growth and the transition from traditional to modern energy in Sweden. Energy Econ. 2014, 46, 56–65. [Google Scholar] [CrossRef] [Green Version]
  24. UNCTAD. Statistical Tables on the least Developed Countries (LDCs)—2018; UNCTAD: Geneva, Switzerland, 2018. [Google Scholar]
  25. UNDP. (United Nations Development Programme)|Human Development Reports. Available online: http://hdr.undp.org/en/composite/HDI (accessed on 24 September 2019).
  26. BP Statistical Review of World Energy. Available online: https://www.bp.com/en/global/corporate/energy-economics/statistical-review-of-world-energy/downloads.html (accessed on 16 October 2019).
  27. Global Carbon Atlas CO2 Emissions|Global Carbon Atlas. Available online: http://www.globalcarbonatlas.org/en/CO2-emissions (accessed on 10 August 2019).
  28. GoN Water and Energy Commission Secretariat. Electricity Demand Forecast Report (2015-2040); Government of Nepal (GoN): Kathmandu, Nepal, 2017. Available online: https://www.wecs.gov.np/uploaded/Electricity-Demand-Forecast-Report-2014-2040.pdf (accessed on 14 July 2019).
  29. UNDP. UNDP (United Nations Development Programme) Energy Profile of Malawi; UNDP: New York, NY, USA, 2016. [Google Scholar]
  30. IEA. Energy Access Outlook. 2017. Available online: https://www.iea.org/access2017/ (accessed on 24 September 2019).
  31. Chen, J.; Li, C.; Ristovski, Z.; Milic, A.; Gu, Y.; Islam, M.S.; Wang, S.; Hao, J.; Zhang, H.; He, C.; et al. Science of the total environment a review of biomass burning: Emissions and impacts on air quality, health and climate in China. Sci. Total Environ. 2017, 579, 1000–1034. [Google Scholar] [CrossRef] [PubMed] [Green Version]
  32. Bhuvaneshwari, S.; Hettiarachchi, H.; Meegoda, J. Crop residue burning in India: Policy challenges and potential solutions. Int. J. Environ. Res. Public Health 2019, 16, 832. [Google Scholar] [CrossRef] [PubMed] [Green Version]
  33. UNEP. Air Pollution in Asia and the Pacific: Science-Based Solutions; UNEP: Paris, France, 2019. [Google Scholar]
  34. Khatiwada, D. Assessing the Sustainability of Bioethanol Production in Different Development Contexts: A Systems Approach; KTH Royal Institute of Technology: Stockholm, Sweden, 2013; ISBN 9789175018232. [Google Scholar]
  35. FAOSTAT (land use indicator). Food and Agriculture Organization of the United Nations. 2019. Available online: http://www.fao.org/faostat/en/#data/EL (accessed on 24 September 2019).
  36. Van der Kroon, B.; Brouwer, R.; van Beukering, P.J.H. The energy ladder: Theoretical myth or empirical truth? Results from a meta-analysis. Renew. Sustain. Energy Rev. 2013, 20, 504–513. [Google Scholar] [CrossRef]
  37. Sovacool, B.K. Conceptualizing urban household energy use: Climbing the “Energy Services Ladder”. Energy Policy 2011, 39, 1659–1668. [Google Scholar] [CrossRef]
  38. World Bank. “Tracking SDG7—The Energy Progress Report”. Available online: https://trackingsdg7.esmap.org/countries (accessed on 15 October 2019).
  39. Quinn, A.K.; Puzzolo, E.; Dickinson, K.; Sturke, R.; Jack, D.W.; Mehta, S.; Shankar, A.; Sherr, K.; Rosenthal, J.P. An analysis of efforts to scale up clean household energy for cooking around the world. Energy Sustain. Dev. 2018, 46, 1–10. [Google Scholar] [CrossRef] [PubMed]
  40. BPDB. Annual Report 2016-17, Bangladesh Power Development Board; Government of Bangladesh: Dhaka, Bangladesh, 2017; Volume 80.
  41. UN-Stat United Nations, Statistics Division. Energy Statistics. Electricity Profiles. Available online: https://unstats.un.org/unsd/energystats/pubs/eprofiles/ (accessed on 25 September 2019).
  42. AEPC. Progress at a Glance: A Year in Review; AEPC: Patan, Kathmandu, Nepal, 2018. Available online: https://www.aepc.gov.np/uploads/docs/progress-at-glance-a-year-in-review-fy-207475-201718-1541497047.pdf (accessed on 15 October 2019).
  43. NEA. Nepal Electricity Authority. 2018. A Year in Review: Fiscal Year 2017/2018; NEA: Kathmandu, Nepal, 2018.
  44. The Himalayan Times Diesel Generator Emissions Making Valley Air More Toxic. Available online: https://thehimalayantimes.com/kathmandu/diesel-generator-emissions-making-valley-air-more-toxic/ (accessed on 14 October 2019).
  45. Zalengera, C.; Blanchard, R.E.; Eames, P.C.; Juma, A.M.; Chitawo, M.L.; Gondwe, K.T. Overview of the Malawi energy situation and A PESTLE analysis for sustainable development of renewable energy. Renew. Sustain. Energy Rev. 2014, 38, 335–347. [Google Scholar] [CrossRef] [Green Version]
  46. Sladoje, M. Lights Out: Zambia’s Electricity Crisis—IGC. Available online: https://www.theigc.org/blog/lights-out-zambias-electricity-crisis/ (accessed on 25 September 2019).
  47. Batidzirai, B.; Moyo, A.; Kapembwa, M. Willingness to Pay for Improved Electricity Supply Reliability in Zambia—A Survey of Urban Enterprises in Lusaka and Kitwe; University of Cape Town: Cape Town, South Africa, 2018. [Google Scholar]
  48. BPDB. 2018 Annual Report 2017-18, Bangladesh Power Development Board; Government of Bangladesh: Dhaka, Bangladesh, 2018.
  49. Ministry of Energy and Mines. Renewable Energy Data in Lao PDR. Available online: https://www.irena.org/eventdocs/Laos%20presentation.pdf (accessed on 16 May 2019).
  50. Ethiopian Electric Power Corporation (EEPC), Power Sector Development - Powering Africa 2014. Available online: https://pubs.naruc.org/pub.cfm?id=537C14D4-2354-D714-511E-CB19B0D7EBD9 (accessed on 10 July 2019).
  51. Johnson, O.; Muhoza, C.; Ogeya, M.; Lindstrom, A.; Granit, J.; Rosner, K. Powering Africa-Unlocking opportunities for energy development in Southern Africa; SEI Stockholm Enviroment Institute (SEI): Stockholm, Sweden, 2018. [Google Scholar]
  52. MEWD. Power System Development Master Plan for Zambia 2010-2030; Ministry of Energy and Water Development (MEWD): Lusaka, Zambia, 2011.
  53. Tripathi, A.K.; Iyer, P.V.R.; Kandpal, T.C.; Singh, K.K. Assessment of availability and costs of some agricultural residues used as feedstocks for biomass gasification and briquetting in India. Energy Convers. Manag. 1998, 39, 1611–1618. [Google Scholar] [CrossRef]
  54. Purohit, P.; Tripathi, A.K.; Kandpal, T.C. Energetics of coal substitution by briquettes of agricultural residues. Energy 2006, 31, 1321–1331. [Google Scholar] [CrossRef]
  55. Kumar, A.; Purohit, P.; Rana, S.; Kandpal, T.C. An approach to the estimation of the value of agricultural residues used as biofuels. Biomass Bioenergy 2002, 22, 195–203. [Google Scholar] [CrossRef]
  56. IARI. Crop Residues Management with Conservation Agriculture: Potential, Constraints and Policy Needs; Indian Agricultural Research Institute (IARI): New Delhi, India, 2012. [Google Scholar]
  57. Rasmussen, P.E.; Collins, H.P. Long-term impacts of tillage, fertilizer, and crop residue on soil organic matter in temperate semiarid regions. Adv. Agron. 1991, 45, 93–134. [Google Scholar]
  58. Lal, R. The role of residues management in sustainable agricultural systems. J. Sustain. Agric. 1995, 5, 51–78. [Google Scholar] [CrossRef]
  59. Vanlauwe, B.; Bationo, A.; Chianu, J.; Giller, K.E.; Merckx, R.; Mokwunye, U.; Ohiokpehai, O.; Pypers, P.; Tabo, R.; Shepherd, K.D.; et al. Integrated soil fertility management. Outlook Agric. 2010, 39, 17–24. [Google Scholar] [CrossRef] [Green Version]
  60. FAO/UNEP. A Decision Support Tool for Sustainable Bioenergy; FAO: Rome, Italy; UNEP: Nairobi, Kenya, 2010; Available online: http://www.fao.org/3/am237e/am237e00.pdf (accessed on 20 September 2019).
  61. Ackom, E.K. Sustainability standards for Canada’s bioethanol industry. Biofuels 2010, 1, 237–241. [Google Scholar] [CrossRef]
  62. Helwig, T.; Jannasch, R.; Samson, R.; DeMaio, A.; Caumartin, D. Agricultural biomass residue inventories and conversion systems for energy production in Eastern Canada; Resource Efficient Agricultural Production (REAP): Ste. Anne-de-Bellevue, QC, Canada, 2002. [Google Scholar]
  63. Lal, R. Crop residues as soil amendments and feedstock for bioethanol production. Waste Manag. 2008, 28, 747–758. [Google Scholar] [CrossRef]
  64. OECD/IEA. Sustainable Production of Second-Generation Biofuels, Potential and Perspective in Major Economies and Developing Countries; Information Paper; OECD: Paris, France; IEA: Paris, France, 2010. [Google Scholar]
  65. Purohit, P. Economic potential of biomass gasification projects under clean development mechanism in India. J. Clean. Prod. 2009, 17, 181–193. [Google Scholar] [CrossRef]
  66. Purohit, P.; Michaelowa, A. CDM potential of bagasse cogeneration in India. Energy Policy 2007, 35, 4779–4798. [Google Scholar] [CrossRef]
  67. Bandyopadhyay, S.; Shyamsundar, P.; Baccini, A. Forests, biomass use and poverty in Malawi. Ecol. Econ. 2011, 70, 2461–2471. [Google Scholar] [CrossRef] [Green Version]
  68. Purohit, P.; Fischer, G. Second-Generation Biofuel Potential in India: Sustainability and Cost Considerations; UNEP Riso Centre on Energy, Climate and Sustainable Development: Copenhagen, Denmark, 2014. [Google Scholar]
  69. Gabisa, E.W.; Gheewala, S.H. Potential of bio-energy production in Ethiopia based on available biomass residues. Biomass Bioenergy 2018, 111, 77–87. [Google Scholar] [CrossRef]
  70. Brecha, R.J. Threshold electricity consumption enables multiple sustainable development goals. Sustainability 2019, 11, 5047. [Google Scholar] [CrossRef] [Green Version]
  71. Brecha, R. Electricity access threshold for meeting non-energy SDG targets. Eur. J. Sustain. Dev. 2019, 8, 90–100. [Google Scholar] [CrossRef]
  72. Banerjee, S.G.; Bhatia, M.; Azuela, G.E.; Jaques, I.S.; Ashok, P.E.; Bushueva, I.; Angelou, N.; Inon, J.G. Global Tracking Framework. Sustain. Energy World Bank 2013, 3, 289. [Google Scholar]
  73. The World Bank Group. Beyond Connections: Energy Access Redefined; World Bank: Washington, DC, USA, 2015; pp. 1–244. [Google Scholar]
  74. Harmelink, M.; Beerepoot, M.; Puranasamriddhi, A. Energy Access Projects and SDG Benefits Energy Access Projects and Assessment of their Contribution to the Sustainable Development Goals; UNDP Discussion Paper; United Nations Development Programme: Bangkok, Thailand, 2018. [Google Scholar]
  75. United Nations. Household Size and Composition around the World; United Nations: San Francisco, CA, USA, 2017. [Google Scholar]
  76. Fritsche, U.R.; Eppler, U.; Fehrenbach, H.; Jürgen, G. Linkages between the Sustainable Development Goals (SDGs) and the GBEP Sustainability Indicators for Bioenergy (GSI); Technical Paper for the GBEP Task Force on Sustainability. Global Bioenergy Partnership (GBEP), 2018. Available online: http://iinas.org/tl_files/iinas/downloads/bio/IINAS_IFEU_2018_Linkages_SDGs_and_GSIs.pdf (access on 24 April 2019).
  77. Souza, G.M.; Ballester, M.V.R.; de Brito Cruz, C.H.; Chum, H.; Dale, B.; Dale, V.H.; Fernandes, E.C.M.; Foust, T.; Karp, A.; Lynd, L.; et al. The role of bioenergy in a climate-changing world. Environ. Dev. 2017, 23, 57–64. [Google Scholar] [CrossRef]
  78. IRENA. Bioenergy for Sustainable Development; IRENA: Abu Dhabi, UAE, 2016. [Google Scholar]
  79. RES4Africa Foundation Applying the water-energy-food nexus approach to catalyse transformational change in africa. 2019. Available online: https://www.res4africa.org/wp-content/uploads/2019/07/RES4Africa-Applying-the-water-energy-food-nexus-approach-to-catalyse-transformational-change-in-Africa.pdf (accessed on 25 August 2019).
  80. WHO. The Equation Is Simple. 2016. Available online: https://www.who.int/sustainable-development/LR-HAP-27May2016.pdf?ua=1 (accessed on 20 October 2019).
  81. Muyanja, D.; Allen, J.G.; Vallarino, J.; Valeri, L.; Kakuhikire, B.; Bangsberg, D.R.; Christiani, D.C.; Tsai, A.C.; Lai, P.S. Kerosene lighting contributes to household air pollution in rural Uganda. Indoor Air 2017, 27, 1022–1029. [Google Scholar] [CrossRef]
  82. Lam, N.L.; Pachauri, S.; Purohit, P.; Nagai, Y.; Bates, M.N.; Cameron, C.; Smith, K.R. Kerosene subsidies for household lighting in India: What are the impacts? Environ. Res. Lett. 2016, 11, 044014. [Google Scholar] [CrossRef]
  83. IPCC. IPCC Guidelines for National Greenhouse Gas Inventories; IPCC: Geneva, Switzerland, 2006. [Google Scholar]
  84. Bhandari, R.; Stadler, I. Electrification using solar photovoltaic systems in Nepal. Appl. Energy 2011, 88, 458–465. [Google Scholar] [CrossRef]
  85. GoN. 2016 Nepal’s First NDC; Government of Nepal (GoN): Kathmandu, Nepal, 2016; Volume 23, pp. 28–38.
  86. Cardoso, J.; Silva, V.; Eusébio, D. Techno-economic analysis of a biomass gasification power plant dealing with forestry residues blends for electricity production in Portugal. J. Clean. Prod. 2019, 212, 741–753. [Google Scholar] [CrossRef]
  87. Susanto, H.; Suria, T.; Pranolo, S.H. Economic analysis of biomass gasification for generating electricity in rural areas in Indonesia. In IOP Conference Series: Materials Science and Engineering; IOP Publishing: Bristol, UK, 2018. [Google Scholar]
  88. Sobamowo, G.M.; Ojolo, S.J. Techno-economic analysis of biomass energy utilization through gasification technology for sustainable energy production and economic development in Nigeria. J. Energy 2018, 2018, 1–16. [Google Scholar] [CrossRef] [Green Version]
  89. Bocci, E.; Sisinni, M.; Moneti, M.; Vecchione, L.; Di Carlo, A.; Villarini, M. State of art of small scale biomass gasification power systems: A review of the different typologies. Energy Procedia 2014, 45, 247–256. [Google Scholar] [CrossRef] [Green Version]
  90. Abdelhady, S.; Borello, D.; Shaban, A. Techno-economic assessment of biomass power plant fed with rice straw: Sensitivity and parametric analysis of the performance and the LCOE. Renew. Energy 2018, 115, 1026–1034. [Google Scholar] [CrossRef]
  91. Brigagão, G.V.; de Queiroz Fernandes Araújo, O.; de Medeiros, J.L.; Mikulcic, H.; Duic, N. A techno-economic analysis of thermochemical pathways for corncob-to-energy: Fast pyrolysis to bio-oil, gasification to methanol and combustion to electricity. Fuel Process. Technol. 2019, 193, 102–113. [Google Scholar] [CrossRef]
  92. Luu, L.Q.; Halog, A. Rice husk based bioelectricity vs. coal-fired electricity: Life cycle sustainability assessment case study in Vietnam. Procedia CIRP 2016, 40, 73–78. [Google Scholar] [CrossRef] [Green Version]
  93. Bhattacharyya, S.C. Viability of off-grid electricity supply using rice husk: A case study from South Asia. Biomass Bioenergy 2014, 68, 44–54. [Google Scholar] [CrossRef] [Green Version]
Figure 1. Distribution of energy consumption by fuel type (in 2015) in Nepal [28]. (Note: Total energy consumption was 500 PJ).
Sustainability 11 07091 g001
Figure 2. Total primary energy supply (TPES) by fuel types in (a) Zambia and (b) Malawi [8,10].
Sustainability 11 07091 g002
Figure 3. Total final energy consumption (TFEC) by fuel type in 2017 (for Bangladesh, Nepal, Ethiopia, and Zambia) [10], and in 2015 for Lao-PDR [9] and Malawi [8,29].
Sustainability 11 07091 g003
Figure 4. Land covered by agricultural and forest land (% of land area) [35], also refer to Table S2.
Sustainability 11 07091 g004
Figure 5. Composition of gross electricity production in the LDCs by fuel source, 2012–2014. Source: [24].
Sustainability 11 07091 g005
Figure 6. Installed power generation capacity by fuel type in the selected LDCs in 2016/2017; Authors’ illustration based on data from the following cited sources for Ethiopia, Malawi, Zambia, and Lao-PDR: [41]; for Nepal: [28,43], and for Bangladesh: [48].
Sustainability 11 07091 g006
Figure 7. Projection of electricity generation (TWh, primary y-axis) and peak power (MW, secondary y-axis) in the selected LDCs (source: authors’ compilation based on the results of projection). Also, Refer to Table S7.
Sustainability 11 07091 g007
Figure 8. Historical and projected technical potential of agricultural residues by crop in the selected LDCs.
Sustainability 11 07091 g008
Figure 9. Technical potential of agricultural residues for biomass power generation in the selected LDCs: (a) Agricultural residue availability for energy applications, (b) Biomass power generation potential.
Sustainability 11 07091 g009
Figure 10. Historical and projected economic potential of agricultural residues by crop in the selected LDCs.
Sustainability 11 07091 g010
Figure 11. Economic potential of agricultural residues for biomass power generation in the selected LDCs: (a) Agricultural residue availability for energy applications, (b) Biomass power generation potential.
Sustainability 11 07091 g011
Figure 12. Impact of using different shares of surplus agricultural residues on biomass availability for energy applications.
Sustainability 11 07091 g012
Figure 13. Technical and economic potential (in TWh) of electricity generation by surplus biomass obtained from the agriculture sector in the selected LDCs analyzed in this study.
Sustainability 11 07091 g013
Table 1. Socio-economic metrics, energy, and related emissions in the selected least developed countries (LDCs).
ParameterUnitBangladeshLao-PDRNepalEthiopiaMalawiZambiaReference Year(s)Source
Value
PopulationMillion159.77.027.6106.417.716.92017[11]
Average population growth rate (1998–2017), per year%1.31.61.02.82.82.91998–2017[11]
Gross domestic product (GDP)Billion US$249.716.924.981.76.325.92017[11]
GDP/population (current US$)GDP/capita15642425901.76835715352017[11]
Real GDP growth, (2009–2016, selected year)% (average 2009–2016)6.27.73.910.24.76.12009–2016[24]
%7.27.34.67.34.44.22017
Foreign direct investment inflowsMillions of US$2152813198358627710912017[24]
Poverty rate (population below US$1.90 a day)% of the total population1523152771582018[24]
Employment in the agricultural sector% of total employment3961726885532017[24]
Human development index0.610.600.580.460.480.592017[25]
Total primary energy supply (TPES)Mtoe39.54.812.641.04.111.12016[10]
Energy consumption/populationGJ/capita857632112017[26]
Net energy importsMtoe6.4N/A *2.94.1N/A *1.22016[10]
CO2 emissions from fossil energyMtCO288.02.09.013.01.44.72017[27]
CO2 emissions/populationt CO2/capita0.480.300.300.120.080.292014[11]
* N/A: No data is available.
Table 2. Share of Gross Domestic Product (GDP) in the economy, population, employment, and land covered by the agriculture sector.
ParametersBangladeshLao-PDRNepalEthiopiaMalawiZambiaReference YearSource
Share (%) of GDP in the economy
Agriculture, forestry, and fishing13.115.725.031.126.12.62017[11]
Industry28.531.513.427.314.436.3
Services53.041.650.336.552.454.1
Others5.411.211.35.17.17.0
Agriculture sector
% of total employment39.161.371.768.284.753.32017[24]
% of land area cover (2016)70.610.328.736.361.432.12016[11]
% of the total population in the rural area64.165.680.779.783.357.02017[11]
Table 3. Status of United Nations Sustainable Development Goal 7 (SDG7) in the selected LDCs.
SDG7 (Targets/Indicators)BangladeshLao-PDRNepal EthiopiaMalawi ZambiaReference Year
SDG7.1.1 Access to electricity
 of the total population (%)8894964413402017
 of the urban population (%)100100999758752017
 of the rural population (%)819195314142017
SDG7.1.2 Access to clean fuels for cooking (% of the population)1962932162017
SDG7.2 RE (% of TFEC)3452799279892016
SDG7.3 Energy efficiency (MJ per US$ PPP 2011)3.15.98.113.14.27.72016
Source: [38], Also refer to Table S3, Table S4, Table S5, Table S6.
Table 4. Total peak demand, biomass power potential, and its contribution (% share) in selected years.
YearTotal Peak Power (MW)Biomass Power Potential (MW)% Share of Biomass Power
BangladeshLao-PDRNepalEthiopiaMalawiZambiaBangladeshLaosNepalEthiopiaMalawiZambiaBangladeshLaosNepalEthiopiaMalawiZambia
201590361056129226573522504256433646478134824528.431.935.929.498.99.8
201694791349146831563882574251334147877032326526.525.332.524.483.110.3
201710,9581608164437484272647263434749179939431124.021.629.921.392.311.8
202013,7462723263862795712893287938551990746135120.914.119.714.480.812.1
202520,05643954519998992534013196465562109253442515.910.612.410.957.712.5
203029,2645892754214,372150040663514545604127760749912.09.38.08.940.512.3
Source: authors’ own estimates.
Table 5. Electricity demand, bioelectricity potential, and its contribution (% share) in the total electricity demand, selected years.
YearElectricity Demand (GWh)Economic Potential of Bioelectricity (GWh)% share of Bioelectricity
BangladeshLao-PDRNepalEthiopiaMalawiZambiaBangladeshLaosNepalEthiopiaMalawiZambiaBangladeshLao-PDRNepalEthiopiaMalawiZambia
201552,1935212633514,637199715,35517,8522306317754382367161434.244.250.137.2118.510.5
201657,2766789691217,415220815,78417,5012340326753572187174830.634.547.330.899.011.1
201762,6788188749020,720243216,23118,3582378335855672687206929.329.044.826.9110.512.7
202079,53314,37812,01834,906324917,74020,0922636355363193154233325.318.329.618.197.113.1
2025118,28824,05720,58553,132526820,85522,3393182384376183659282918.913.218.714.369.513.6
2030175,92632,92334,35573,709854124,93324,5883728413289174165332614.011.312.012.148.813.3
Source: authors’ own estimates.
Table 6. Multi-tier matrix for household electricity consumption.
ParticularsTier 1Tier 2Tier 3Tier 4Tier 5
Tier CriteriaTask lighting + phone chargingTier 1 + Television + Fan (if needed)Tier 2 + any medium-power appliancesTier 3 + any high-power appliancesTier 4 + any very high-power appliances
Annual consumption levels (kWh)≥4.5≥73≥365≥1250≥3000
Source: World Bank [73].
Table 7. Bioelectricity availability for domestic (household) uses in rural areas in 2017.
CountryRural PopulationSize of HouseholdNumber of Rural Households (Thousand)Bioelectricity Potential (GWh)Bioelectricity (kWh) *
(Million)% of TotalPer Household Per Capita
Bangladesh102.364.14.522,74418,358807179
Lao-PDR4.665.65.386023782764522
Nepal22.380.74.450683358663151
Ethiopia84.879.74.618,435556730266
Malawi14.783.34.532712687821183
Zambia9.8575.1192320691076211
* Available for domestic and other productive uses. Source: Authors’ estimates.
Table 8. Fuel savings and avoided global greenhouse gas (GHG) emissions from the substitution of diesel power generation by bioelectricity.
ParticularsBangladeshLao-PDRNepalEthiopiaMalawiZambia
Total bioelectricity production (TWh)18.42.43.45.62.72.1
Total diesel savings (million liters)503865369221528737568
GHG emissions avoided (million tonnes)13.41.72.54.12.01.5
Source: Emission factor is taken from IPCC, 2006 [83].
Table 9. Domestic energy consumption, imports, and bioelectricity potential (TWh)*.
CountryDomestic Energy Consumption (TWh)Electricity Imports (TWh) Bioelectricity Potential (TWh)Reference Year
Bangladesh29.14.818.42017
Lao-PDR1.60.82.32015
Nepal1.82.23.42017
Ethiopia5.8-5.42016
Malawi0.9-2.22016
Zambia4.42.21.82016
* Note: Domestic energy consumption and electricity imports are obtained from [48] for Bangladesh; [9] for Lao-PDR; [43] for Nepal, and [41] for Ethiopia, Malawi, and Zambia.

