Performance and Resilience of Socially Responsible Investing (SRI) and Conventional Funds during Different Shocks in 2016: Evidence from Japan


Graduate School of Economics, Ritsumeikan University, 1-1-1, Nojihigashi, Kusatsu, Shiga 525-8577, Japan
*
Author to whom correspondence should be addressed.
Sustainability 2020, 12(2), 540; https://doi.org/10.3390/su12020540
Submission received: 25 October 2019
/
Revised: 30 December 2019
/
Accepted: 7 January 2020
/
Published: 10 January 2020
(This article belongs to the Special Issue Sustainable Financial Markets)
Abstract
:Socially responsible investing (SRI) reap the benefits of a social consensus and is often presented as a solution to conciliate finance and sustainable development. This article investigates the performance and resilience of both socially responsible and conventional funds listed in the Japan Investment Trust Association (JITA) during two economic shocks (the U.S. election and Brexit) in 2016. To see the immediate reaction in fund performance around different shocks, an event study with market model using ordinary least square (OLS), an event study with market model using exponential generalized autoregressive heteroscedasticity (EGARCH) and an event study with Fama–French multi-factor model was used to avoid common features of return data such as non-normality, heteroscedasticity, and cross-correlation. This study found that the recent U.S. election had a significant positive effect whereas the Brexit referendum event had a significant negative shock on fund returns in Japan around the event window. It is evident from the empirical findings that, compared to conventional funds, socially responsible funds were more resilient to uncertainty around the recent U.S. presidential election whereas conventional funds were more sensitive during the Brexit referendum. The important implications of these findings are the optimal strategies of institutional or individual investors who have direct or indirect exposure to the fund volatility risk in Japan.
1. Introduction
In the last few decades, socially responsible investing (SRI), which focuses on ethical values, environmental protection, social issues, good governance, etc., has remarkably drawn attention not only to individual and private investors but also to researchers. The concepts of environmental, social and governance (ESG), SRI, and responsible, sustainable, and green investing have evolved rapidly over time, and are continuously changing. SRI and ESG came up strongly in the 1990s, and sustainability and long-term investing became popular in the 2000s. According to Donovan [1], we are now living in the SRI 2.0 period, which is focused mainly on impacted investment and extension of the general awareness of responsible investing.
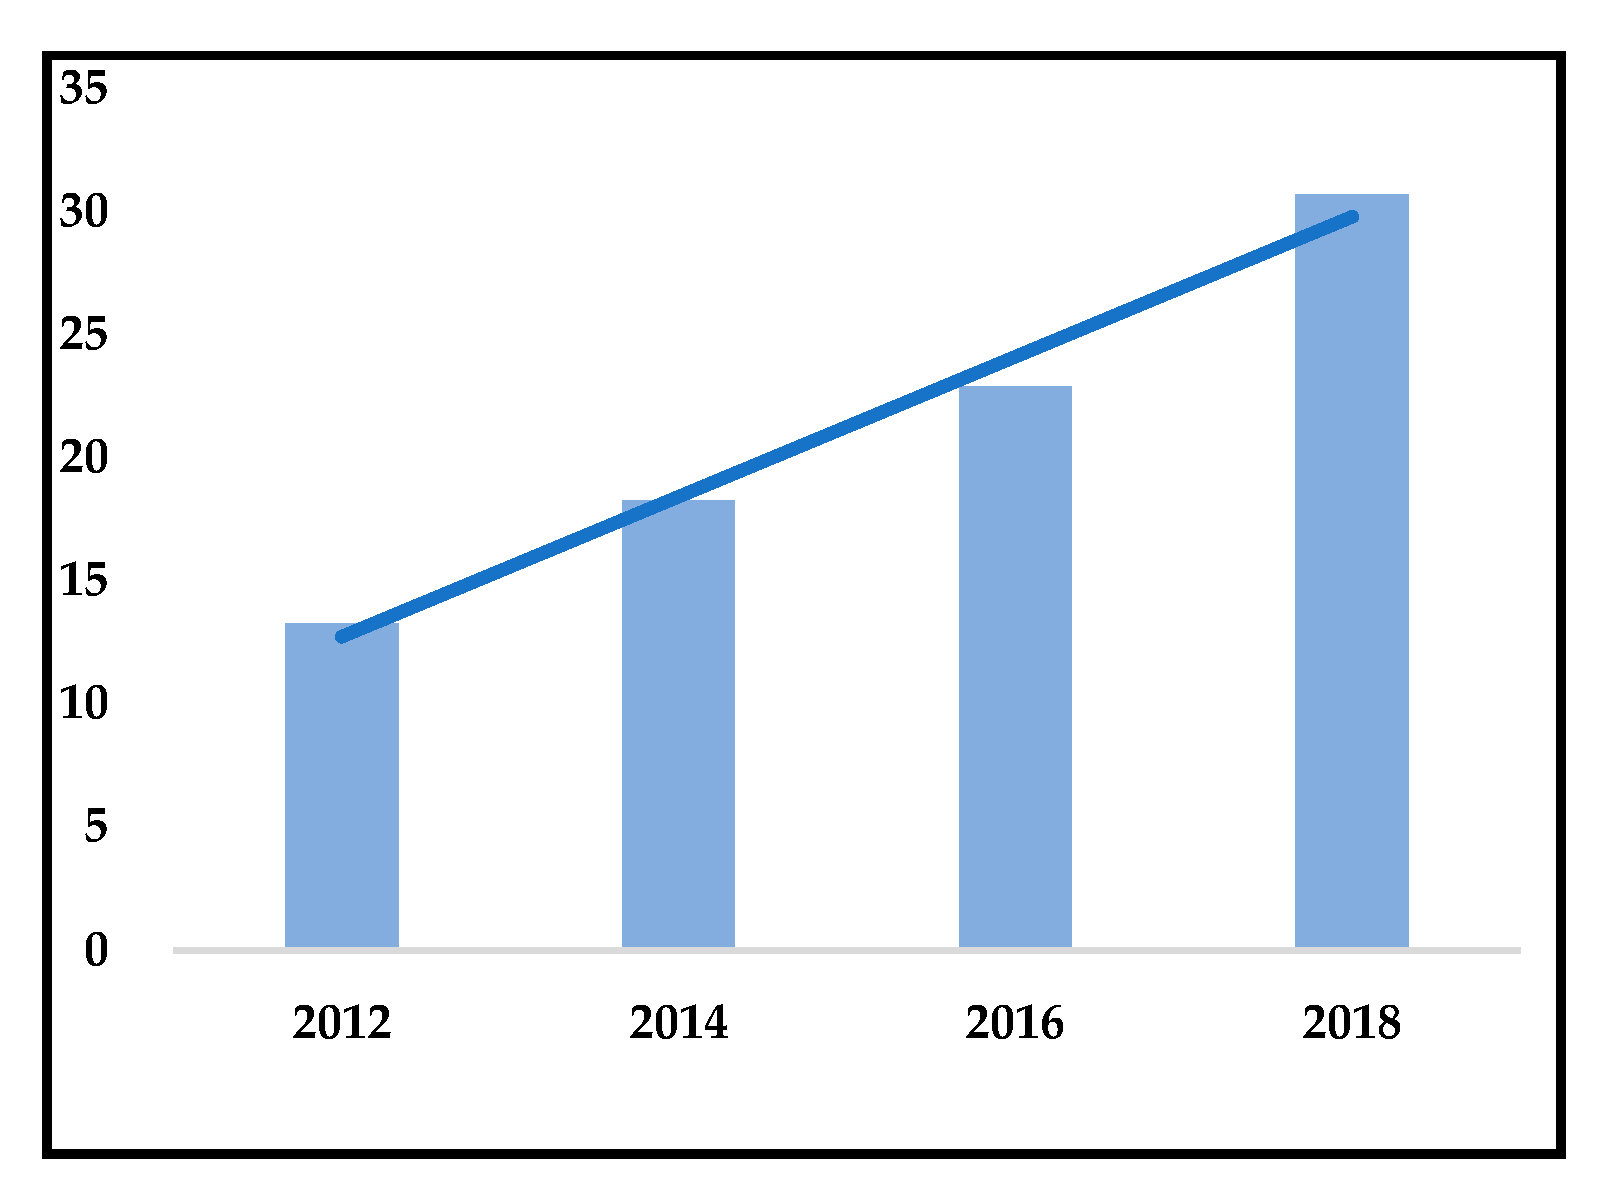
The rapid growth of the SRI market has made it more important worldwide. The global SRI asset outstanding has reached USD 30.7 trillion in 2018, which is almost 2.5 times more compared with 2012 (Figure 1). In 2018, the European market of responsible investment funds reached almost USD 14.1 trillion of managed assets, nearly double the value compared with 2012. The financial means invested into RI (responsible investing) in the U.S. more than tripled in the period of 2012–2018, reaching the level of USD 12.0 trillion. It has been reported that the respective proportions of SRI to total management assets in Europe and the United States are 45.9% and 39.1% in 2018 [2].
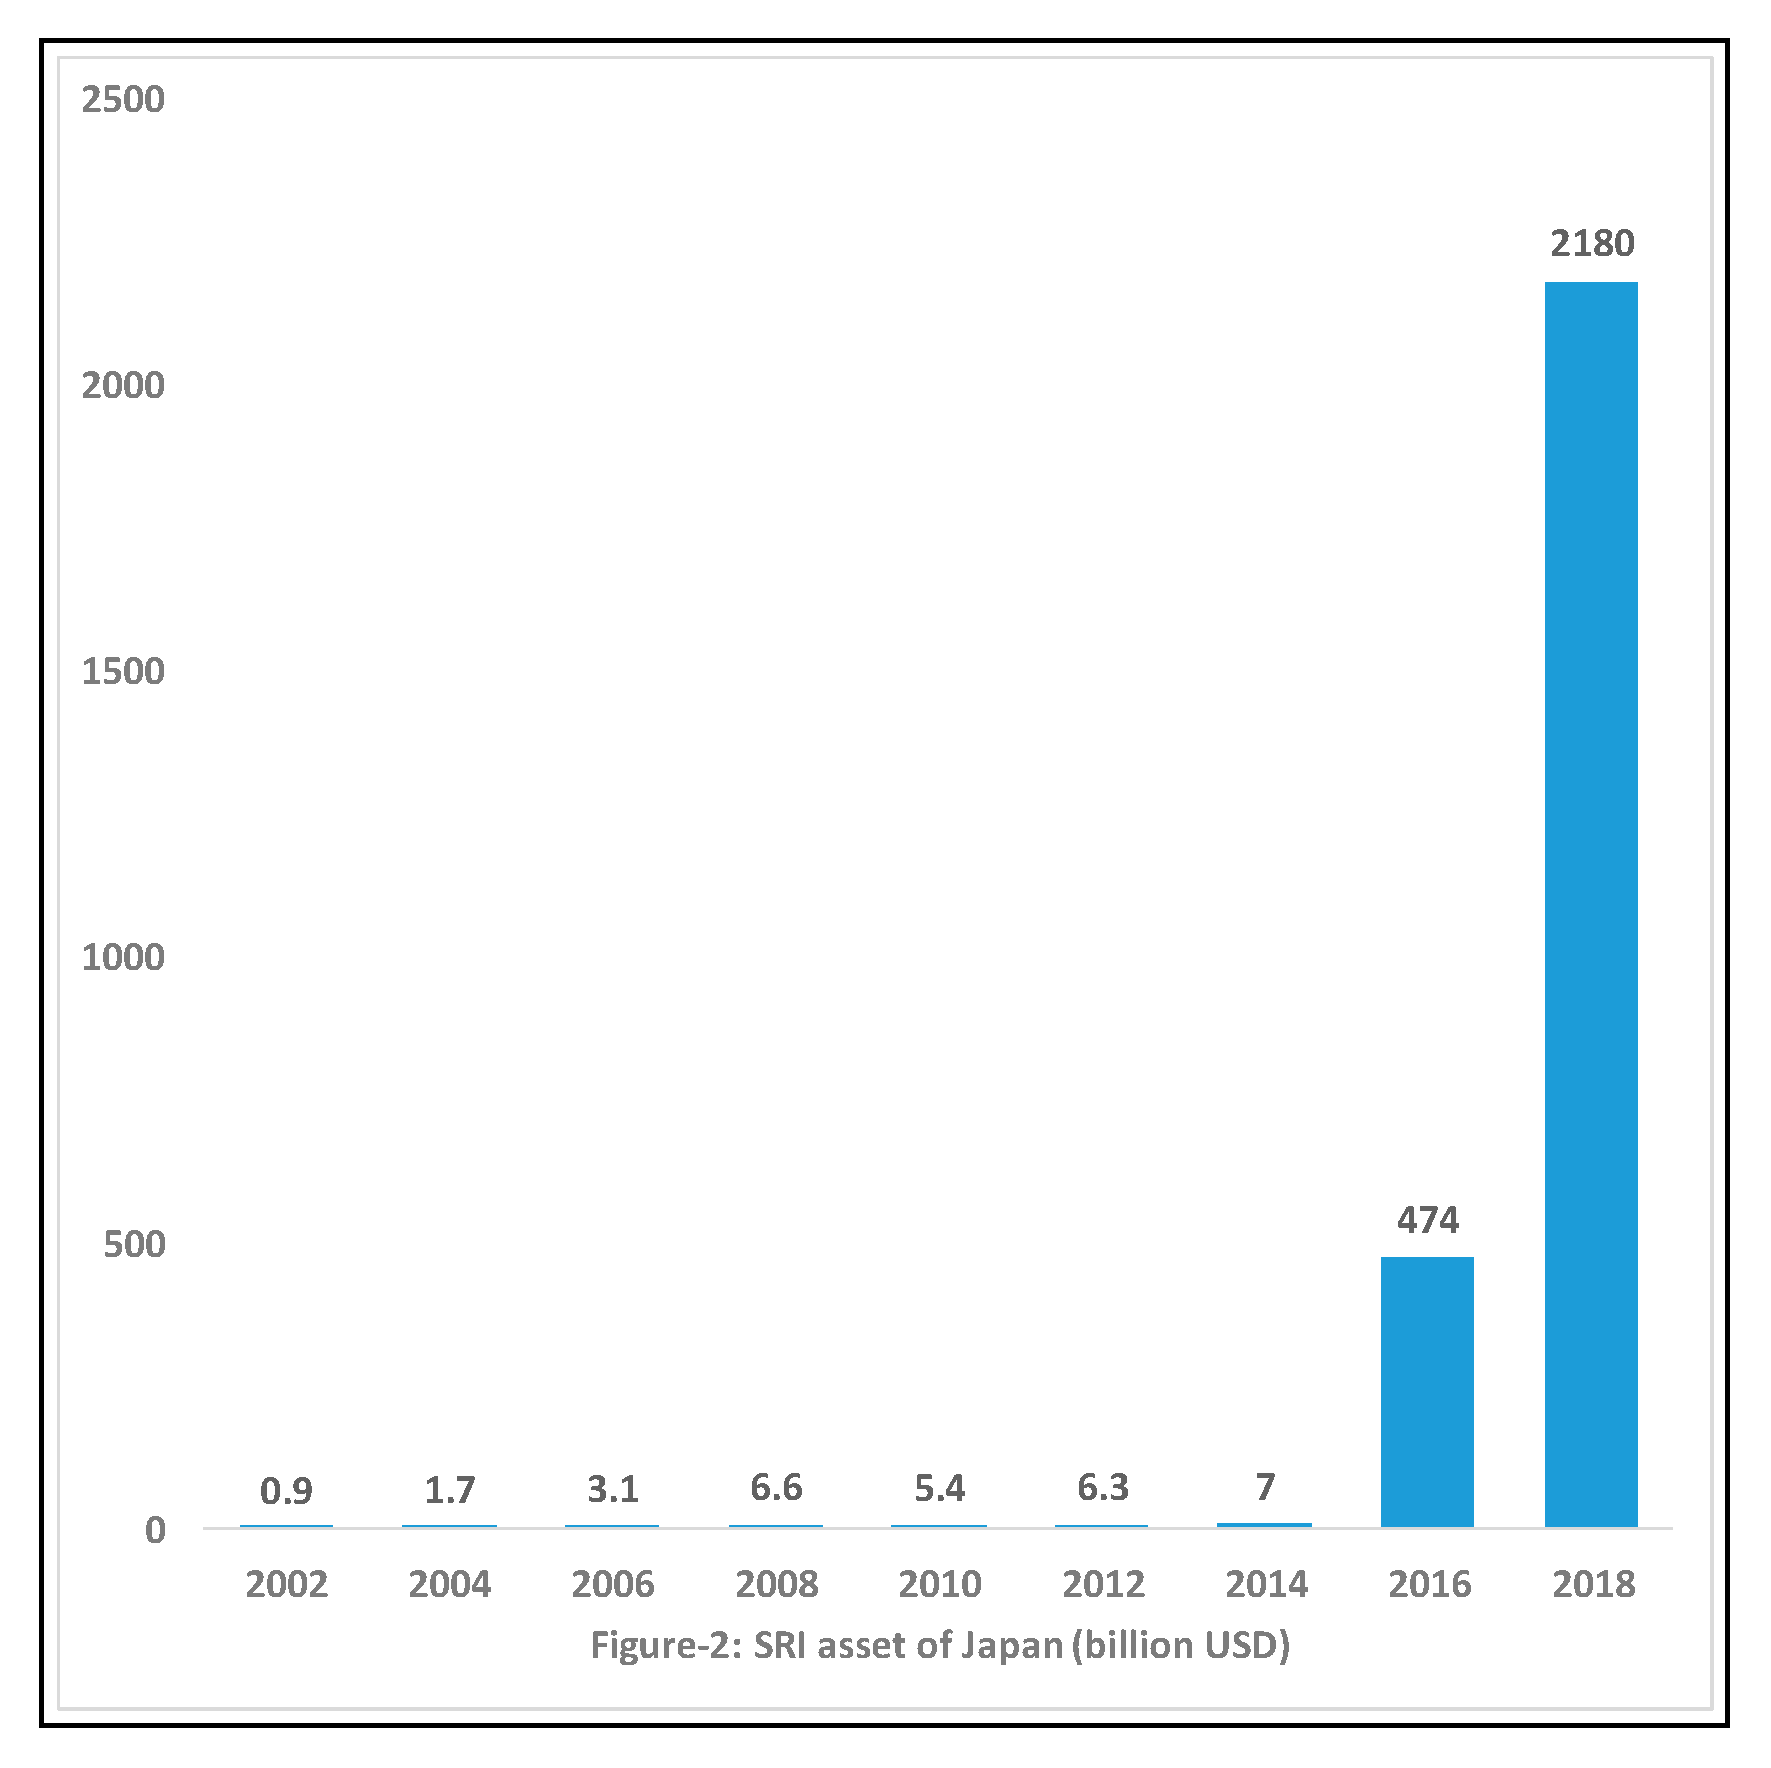
In Asia, Japan is in the leading position regarding socially responsible funds investment. Compared to Europe and the USA, the history of socially responsible funds in Japan is much briefer. Japan started socially responsible funds investment in the early 2000s. The initial investment in SRI was an eco-fund, and the concept of this investment came from the West as a new financial product to push cash flow from households to the SRI market [3]. Though socially responsible investors in Europe and the USA are mostly institutional investors, most SRI in Japan hold publicly offered socially responsible funds targeting individual investors [4]. According to the Japan Sustainable Investment Forum (JSIF), total net assets of socially responsible funds were around JPY 0.8 trillion at the end of December 2011, whereas the total sustainable investment balance was JPY 232 trillion in 2018 (Figure 2), an increase of 1.7 times from the last year [5]. On the other hand, conventional funds are already matured, so there were no sharp increases in the number and assets compared to the socially responsible fund [4].
Though significant developments have been recorded in greening the economy, the United Nations Environment Programme (UNEP) estimates that the annual investment necessary to deliver a green economy over the 2010–2050 period will be approximately 2% of global GDP [6]. Sustainable investment faces many challenges in the rapid transformation of the economy and society to meet the Paris 1.5 °C climate target. Green finance provides not only an opportunity for achieving environmentally sustainable innovation pathways but it also faces some institutional and financial criticalities such as uncertainty about public policies, minimum involvement of financial suppliers, short-term financial instruments, and the knowledge gap of financial options and technical expertise within firms [7].
The finance ecosystem approach and public sector support will be necessary to ensure low carbon investment [8]. According to Falcon and Imbert [9], linking the ecosystem change with economic opportunities and social wellbeing has always been a challenging work. It is important for sustainability to focus not only on a restricted number of sectors (e.g., renewables, eco-innovations, bio-products) but also create the basis for a sustainable financial system to finance and fuel this transition [10]. According to Falcon et al. [11], a longer relationship between banks and firms will foster firm involvement in green investment strategies to reduce their environmental impact. The study by Mazzucato et al. [12] suggested that the emphasis should move from the total amount of finance to its composition by financial actors (e.g., private banks, public banks and utilities) and areas of investment to promote sustainable investment. Better environmental performance due to green investment strategies can increase returns for firms by enabling access to green markets, and a product differentiation strategy based on firm environmental reputation. Also, green investment strategies can lead to a decrease in the cost of materials and energy use, capital assets and cost of labor [13]. The discussed measures might increase the attractiveness of green investments to many investors. However, political instability and the uncertainty of the regulatory and policy environment could lead to an additional challenge for the investment. Therefore, it is difficult to measure the performance of socially responsible investing compared to its conventional counterparts during economic shocks.
Economic shocks have huge impacts on the economy and in performing the funds. The year 2016 was vulnerable to the economic perspective for the U.S. election and the Brexit referendum. These economic events have an important impact on the Japanese economy because of high trade relations with the world’s leading economy of the United States of America and Europe. Japan has played a very important role on both sides of the U.S. and U.K. as major investors. Japan is one of the most important trade and investment partners for the United States. According to the office of United States trade representative, bilateral U.S.–Japan trade in goods and services surpassed $300 billion in 2018. Moreover, Japan is the third largest source of foreign direct investment (FDI) into the United States, behind only the United Kingdom and Canada, with total stock of FDI in 2018 at $484 billion. The U.S. foreign direct investment (FDI) in Japan (stock) was $125.5 billion in 2018 [14]. On the other hand, the trade between the U.K. and Japan was worth £29.5 billion in 2018 [15]. These economic facts established an important impact in the Japanese market due to uncertain policy from the recent U.S. election and Brexit.
Japanese investors were increasingly worried about the possibility of Donald Trump adopting protectionist policies and backing out of international trade deals which would be negative for Japanese industries. The expected negative shock might come for some Japanese enterprises invested in the U.K. due to a possible stringent policy of exporting their product to other European countries. Almost half (48%) of U.K. goods exports went to the EU in 2016. The U.K. goods exports to the EU were worth £145 billion in 2016, or 7.4% of GDP [16]. Motor vehicles and parts is the largest product group by value of exports: the U.K. exported £18 billion of motor vehicles (and trailers) to the EU in 2016 where Japan has considerable investment in the motor vehicle and parts industry of U.K. In the short term, the market reaction will receive high attention in Japan for unexpected policy changes in the U.S. election and Brexit. In the long run, it may have severe economic consequences of rising oil prices to market panic and interruptions in global trade.
Though investors want to maximize their return, socially responsible investor motives and willingness to pay is more than conventional investors [17,18]. Therefore, socially responsible investors of Japan might have retained their investments rather than selling them during the economic downturn due to the U.S. election and Brexit. We assume that socially responsible funds in Japan have registered the negative effects of the recent U.S. election and Brexit better than their conventional counterpart.
This article examines how Japanese investment funds are influenced by the U.S. election and Brexit and confirms whether these events had any market uncertainty that impacts investor risk aversion and thereby significant positive or negative impacts on performing SRI and conventional funds. Evidence has been found in previous studies that the U.S. election cycle and its political factor is the important determination of international expected return of firms [19]. The Brexit election result showed immediate effect in the Japanese financial market with a sharp decline in share prices. This study investigates the short-term effect of the U.S. election and Brexit to the returns of both SRI and conventional funds. The main objective of this research is to investigate the fund volatility as well as the performance and resilience of the funds between SRI and conventional during the above-mentioned economic shocks in 2016.
This article is organized as follows. Section 2 provides a literature review on SRI, its performance and resilience, etc. The section develops an insight into the existing gaps in the literature. Section 3 presents the data, research methodology, research design, and hypothesis testing. Section 4 analyses and presents the results and discussions of the study. Section 5 concludes the recommendations and suggestions for further study.
2. Literature Review
One of the first questions that usually arise in addressing SRI is financial performance. It is thought that SRI is a successful investment strategy if SRI can add financial value or reduce risk, or both. This study will seek literature related to issues such as the performance and resilience of the funds in both the global and Japanese markets.
2.1. Performance of Socially Responsible Funds Compared to Conventional Funds: Global
The first analysis of socially responsible fund performance was conducted by Moskowitz in 1970 [20]. Since then, a substantial number of articles have been published on SRI portfolio performance. SRI is an investment strategy that promotes not only good environmental and societal aspirations but also an economic gain [21]. Scholars have shown interest in the performance of both SRI and conventional funds, but no existing relationships have been indicated between individual dimensions of SRI and returns [22]. Although ethical investment initially focuses on moral desire, nowadays, SRI is mainly driven by the desire to increase returns and to reduce investment risk [23].
The extant literature has mixed findings regarding the performance and resilience of socially responsible funds compared to conventional funds. Some literature, for example, Michelson et al. [24], Kempf and Oscthoff [25], Gil-Bazo et al. [26], and Durand et al. [27], view socially responsible firms as performing better than conventional ones due to social screening practices, sustainability, management quality, longer time horizon operation, less agency cost, and optimal financial policies of the socially responsible firms.
Some articles, for example, Renneboog et al. [28], indicated that conventional funds outperform SRI stocks in the European market. From the experience of many European, North American, and Pacific Asian markets, the author found that there is a cost to being socially conscious or ethical. However, socially responsible funds outperform conventional funds in Sweden, Japan, and France due to differences in risk-adjusted returns of socially responsible funds [29]. A study carried out by Lee et al. [30] has highlighted that conventional funds perform better than socially responsible funds.
A large number of research findings indicated no significant differences in portfolio performance between SRI and conventional funds [27,31,32,33,34,35,36,37]. Moreover, according to Almazan et al. [38], no significant difference has been found in return performance of SRI and conventional firms after controlling fund size, portfolio turnover policy, restrictions, or constraints.
Statman and Glushkov [35] concluded that socially responsible investors could perform as conventional investors if the sector screening approach applied. Performance of socially responsible funds did not differ from conventional funds regarding asset characteristics, a degree of portfolio diversification, or long-run investment [39]. Regarding screening intensity, there is a non-linear relationship between social responsibility and the performance of mutual funds [40]. Lee et al. [30] also found evidence of a curvilinear relation between SRI and conventional firms considering the screening intensity and mutual fund systematic risk. He also concluded that SRI performance is not significantly different from that of other types of investments.
Recently, Rathner [41] conducted a meta-analysis on SRI performance and summarized 25 articles where a total of 517 funds were examined regarding their performance. Most of the funds (376) showed no significant performance differences relative to the market benchmark. However, 73 socially responsible funds underperformed and 68 socially responsible funds outperformed compared to their conventional counterparts.
2.2. The Resilience of Socially Responsible Funds Compared to Conventional Funds: Global
During economic shock, institutional and individual investors face challenges due to extreme market volatilities, low confidence levels, etc. It has been observed that weak performance in stock markets and low confidence levels led to the investors’ attention moving towards more ethical, regulatory compliant, and responsible investments. Some empirical studies provide evidence that supports linking the resilience of portfolios to economic shocks. A study by Capelle-Blancard and Monjon [42] argued that stakeholders of companies were largely in a consensus that CSR compliance and/or SRI would be a prudent solution for companies to conciliate their finance and ensure a sustainable future.
According to Ellis and Bastin [43], there has been increasing awareness and discussions about sustainability and sustainable business practices as opposed to simple CSR policies during periods of financial crises. A study by Ducassy [44] found a significant positive relationship between CSR and financial performance at the beginning of the recent financial crisis in 2007. According to Nofsinger and Varma [45], socially responsible funds significantly outperformed conventional ones during the economic crises. However, socially responsible funds underperformed conventional funds during non-crisis periods. They explained that this asymmetric pattern was driven by socially responsible funds stipulating environmental, social, and governance (ESG) positive screening. Similar results were found by Leite and Cortez [46] in France, that socially responsible funds significantly underperformed compared to conventional funds during non-crisis periods. They indicated that the difference between socially responsible and conventional funds was not significant during crises. The authors also found that socially responsible funds could not provide additional protection to investors during crisis times.
Socially responsible funds significantly outperformed conventional ones in all markets except those in North America from January 1992–April 2012 [47]. They found the opposite result from March–November 2001 when the technology bubble burst happened. Their results revealed that socially responsible funds have less diversification and it did not hamper fund performance compared to conventional funds. They conducted these articles on long-term crisis periods and there might have influences of the results by other factors.
According to Ducassy [44], regarding different types of investor’s changes in the propensity to invest, the financial crisis did not affect value-based and value-enhancing investor confidence in socially responsible portfolios but strengthened even further their focus on these funds. Nevertheless, value-seeking investors switch from non-ethical to ethical investment to some extent due to the financial distress leading to an increase of ethical constituents in portfolios. As a result, investors have more economic shockproof capital assets in their portfolios serving as a buffer against future losses [44]. Investment in socially responsible portfolios will increase risk-proof capital assets which can help corporates repel risks in economic recession and quickly recover afterwards [48]. Therefore, we expect that the market performance from socially responsible portfolios is likely to achieve better performance as compared to their non-socially responsible counterparts in the time of economic shocks.
2.3. Japanese SRI Performance and Resilience
As of today, there are few studies, such as Ito et al. [49], Nakai, Yamaguchi, & Takeuchi [50], Nakajima [51], and Nakai et al. [4], conducted on the Japanese SRI market to investigate the performance and resilience of the funds, where one paper examines the resilience of socially responsible funds in Japan for the short term. The article by Nakai et al. [4] investigated whether socially responsible funds or conventional funds better resisted the negative effects of the global financial crisis in 2008 including individual investors in Japan. Their results confirmed that socially responsible funds performed better than conventional funds during the Lehman Brothers shock in 2008. However, they have considered almost a decade of old fund data.
The trend of SRI in Japan is growing significantly as investors are becoming more and more inclined to socially responsible investing day by day. From the literature, we can observe that there are few studies that have been conducted on the performance and resilience of socially responsible funds in Japan. Moreover, most of the studies discussed in Section 2.1 and Section 2.2 have been carried out in America, Europe, and Australia, and are focused on a long-term crisis period. Thus, this study seeks to contribute to the literature on the performance and resilience of socially responsible funds compared to conventional funds in Japan for short-term economic shocks considering the return and risk of investors. This study will contribute to outlining the volatility from the short-term abnormal effect of SRI as compared to conventional funds during the two recent external shocks from the two influential economies in the world, such as the U.S. election in 2016 and the Brexit referendum in the U.K. As a result, this study will be significant in shedding more light on the performance and resilience of the socially responsible funds.
3. Data and Methods
3.1. Data
To select the socially responsible funds, the study has extracted the socially responsible fund list from the article of Nakai et al. [4], where 62 socially responsible funds were identified according to Japan Sustainable Investment Forum (JSIF) classification, and randomly selected 35 socially responsible funds. The JSIF defined “sustainable investment” as the investments that embodied the principles of “investments with a view to the sustainability of the earth and society” and “the social effects of these investments to suppliers of capital”. To select the conventional funds, the study has constructed the list of 3320 funds including major classification of domestic stock investment trust, overseas stock investment trust, domestic bond investment trust and foreign bond trading from the Japan Investment Trust Association (JITA) website in 2017 where daily return data on investment funds are available. The study randomly selected 83 funds from 3320 funds using a random number generation technique in the statistical application. Thirteen funds were excluded from the sample due to the unavailability of daily return data for the whole year of 2016 which reduced the sample to 70 conventional funds, and these funds were identified as conventional based on the JSIF classification.
The main purpose of JITA is to promote the sound development of investment trusts and investment companies. The trust is also encouraging and protecting securities investments by ordinary investors. The sample constituted 105 funds where the socially responsible funds to conventional funds ratio was 1:2 (Table 1). Daily return data of 105 funds including 35 socially responsible funds and 70 conventional funds for the year 2016 were downloaded from the JITA in 2107 for each fund separately [52].
Out of 105 funds, 50 domestic and 55 international funds were included in the sample (Table 1). Domestic funds are mutual funds that invest in stocks and/or bonds predominantly in domestic companies, whereas international funds are those investing in both domestic firms and foreign companies, or only the latter. Even though international funds are sometimes invested in foreign companies, the funds are raised and registered in Japan.
In this study, the Tokyo Stock Price Index (TOPIX) was considered as the proxy of the market index for the market model in the methodology of event study [53]. To construct the Fama-French factors, different index data, such as Russell-Nomura Large Cap Growth Index, Russell-Nomura Large Cap Value Index, Russell-Nomura Small Cap Growth Index, and Russell-Nomura Small Cap Value Index [54] were downloaded.
To construct the market premium index, the Japan Benchmark 10-year Government Index was downloaded for the year 2016 as the proxy of the risk-free rate [53]. In the sample, 25,725 observations were made where each fund had 245 daily returns due to 245 working days in the year 2016 in Japan. However, to remove outliers, we have considered the data from February to December of 2016 which reduces the sample to 226 daily returns and 23,730 sample observations. Descriptive statistics of the returns of socially responsible funds, conventional funds, and several indexes are presented in Table 2.
3.2. Theoretical Background and Method
The detailed methodology of an event study including its step by step approach to estimate the normal returns, calculate the abnormal returns, and to test the hypothesis, etc., are described in this section. Moreover, the event study with the market model using OLS, event study with the market model using EGARCH and event study with the Fama–French multi-factor model are also discussed with the method’s potential and limitation.
3.2.1. Event Study and Event Selection
To analyze the short-term performance and resilience of the funds, this study used the event study methodology introduced by Fama, Fisher, Jensen, and Roll [55]. The principle purpose of an event study is to measure the effectiveness of an (unexpected) economic event on the value of a firm. The validity of event study methods relies on assumptions such as (i) market efficiency, (ii) unanticipated event, and (iii) free from confounding effect. Event study methodology relies on the stock market assessment of the economic event focusing on both short-term and long-term implications. One common concern in event studies is how to handle cases when multiple announcements by the same entity occur in close proximity. As we focus on short-term event study, it has the advantage of being less easily distorted by other events so that one can more confidently attribute stock price performance to a specific event.
According to Sorescu et al. [56], confounded observations are mainly eliminated from short-term event studies. However, confounding events are still an issue in short-term study approaches that contaminate the analysis [57]. Although event study has been successful in the area of corporate finance, there have also been limitations on its applications, such as where the event date is difficult to identify, or that the methodology used to compute the cumulative abnormal returns may induce upward bias [58].
For this study, we have selected two external economic events in 2016 (Table 3).
3.2.2. Steps of an Event Study
The analysis of an event study can be broken down into several steps, such as: (i) selection of event date, event window and estimation window; (ii) measuring normal return; (iii) estimation procedure; (iv) measuring abnormal return; (v) testing procedure; and (vi) interpretation.
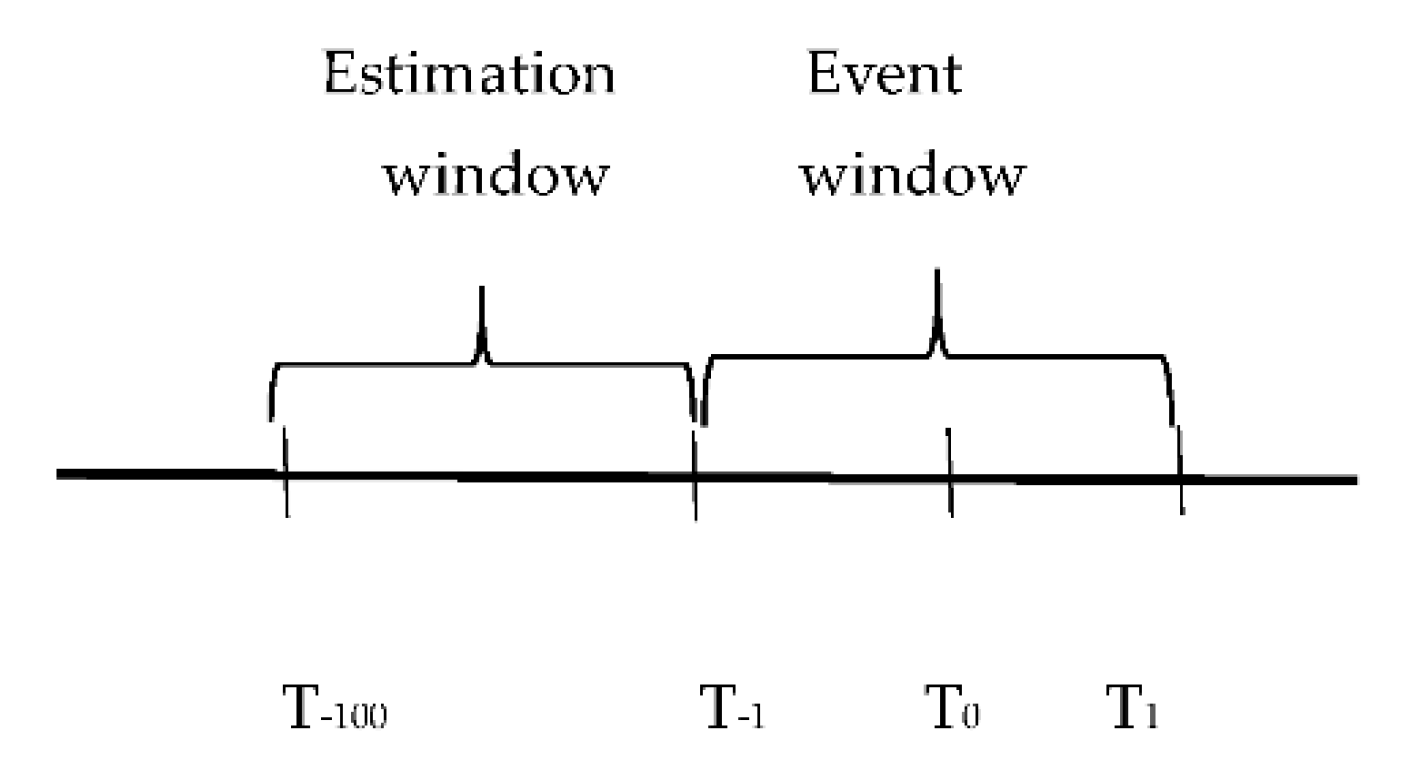
(i) The event of interest is defined as well as the period over which the asset prices are analyzed. This period is known as the event window. In other words, the event window is defined as the period where the abnormal returns are accumulated. This study set three days as the event window, which included the day before the event, the day of the event, and the day after the event. The transaction dates are identified, such as T0 based on the event occurred, T1 as the last transaction day before the event and T−1 the transaction day following the event (Figure 3). As the estimation window, 100 days before the event window is considered to get the normal trend of the return of funds.
(ii) The normal return is the return that would be expected if the event did not take place. The estimation window is used to define the expected normal return, and it is usually assumed that the event is exogenous to the price changes. Further, it is typical that the estimation and event windows do not overlap.
(iii) The estimation window is used to determine the normal performance model. It is preferable to use the period before the event window as the estimation window but not include any portion of the event period itself.
(iv) The impact of the event is determined by measuring an abnormal return. The abnormal return is the difference between the actual return and the expected normal return. Once the parameters of the normal performance model are estimated, the abnormal returns are calculated.
(v) Abnormal returns can be calculated once the normal performance model has been determined. Next, a framework for testing the abnormal returns is developed including the definition of the null hypothesis and how abnormal returns of the individual firms will be aggregated.
(vi) The ultimate goal of an event study is that the empirical results will provide some insight regarding how the event affects security prices.
3.2.3. Choice of Different Estimation Models
To see the immediate reaction in fund performance around shocks, event study with market model using ordinary least square (OLS), event study with market model using exponential generalized autoregressive heteroscedasticity (EGARCH), and event study with Fama–French multi-factor model were used to avoid common features of return data, such as non-normality, heteroscedasticity, and cross-correlation. But, apart from these model-specific problems, as Fama (1991) indicates, all tests suffer from joint-hypothesis problems [59]. The joint hypothesis problem means that all tests would be for both the selected model and efficiency; they cannot be separated from one another. In other words, as long as the correct model is not chosen to model the expected returns, any test of abnormal returns could be misleading. The selection of the correct model helps to reduce the noise term and increase the power of tests. Therefore, the choice of the model is one of the most crucial steps of an event study.
3.2.4. Event Studies with the Market Model using OLS
Fund returns were calculated from fund prices using the following formula,
where is the fund return and is the fund price on day t (t = −100, −99, …, 2, 3) for funds i (i = 1, 2, …, 105).
The normal return was then estimated in which the event did not occur. Linearity assumption was considered between the return of the market proxy, TOPIX, and the return of each fund. The coefficient of and were estimated from the market model using an estimation window. To calculate the normal return, the market model and the OLS method were used to estimate the coefficient of and for each fund using an estimation window,
in which E[] = 0 and Var[] = 2. Additionally, signifies the return of the market index; and are unknown parameters. With estimated parameters, the normal return for each three-day event window can be estimated. Subtracting this value from the realized return gives the abnormal return (AR).
The estimated abnormal returns for funds i in day t can be written as:
The estimated abnormal return scan be aggregated across funds and over time. For an aggregation across affected funds, the estimated average abnormal returns est(A) for a day t in the event window are the means of the estimated abnormal returns for the funds i = 1, 2, …, N.
The cumulative abnormal return (CAR) is then calculated after adding the abnormal returns of firm i for the three-day event window.
For an aggregation over time, the estimated cumulative abnormal returns est() for funds i are the sums of the considered estimated abnormal returns for all days t from to :
All CAR values can be analyzed for the entire sample in the same category, called the average cumulative abnormal return (ACAR), as
For a combined aggregation over time and across affected funds, the estimated average cumulative abnormal returns est(ACAR) are the means of the estimated cumulative abnormal returns for the funds i = 1, 2, …, N.
The variance of the average cumulative return can thereby be obtained as
Using the ACAR, J-statistics were calculated to test the hypothesis that the event had no effect on fund returns.
3.2.5. Event Studies with the Market Model Using EGARCH
It may be mentioned that the event study with the market model using OLS does not consider the heteroscedasticity. Generally, in financial time series data, the stock price has non-constant variance. To mitigate this problem, an autoregressive conditional heteroscedasticity (ARCH) model [60] and a generalized autoregressive conditional heteroscedasticity (GARCH) model have been used to address the heteroscedasticity issue [61]. However, the GARCH model considers a non-negative assumption to estimate time-variant conditional variance. This assumption is not necessary for the EGARCH model introduced by Nelson [62]. This factor makes the EGARCH model superior to the GARCH model. Usually, non-negative conditions are violated by estimators. This study used the market model with EGARCH (1, 1) to confirm that the results found in the market model with OLS were robust. To test the significance of the event with the market model using EGARCH, the same steps as an event study with the market model using OLS can be followed.
3.2.6. Event Studies with the Fama–French Three-Factor Model
The former two models use only one variable to describe the return of the fund with the market return, but the Fama–French model uses three factors, such as company size, company price-to-book-ratio, and market risk. This model started with the idea that two classes of stocks have tended to do better than the market as a whole: (i) small caps and (ii) stocks with a high book-to-market ratio. It can be stated that the Fama–French three-factor model explains over 90% of a diversified portfolio’s returns, compared with the average 70% given by the CAPM (within the sample).
To conduct this methodology, this study tested whether these three factors had any significant effect on fund returns. Following the study of Faff [63] and Nakai et al. [4], we have constructed Fama–French factors of small minus big (SMB) and high minus low (HML) using four indexes such as Russell–Nomura Large Cap Growth Index, Russell–Nomura Large Cap Value Index, Russell–Nomura Small Cap Growth Index, and Russell–Nomura Small Cap Value Index developed by Global Research Division, the Nomura Securities Co. Ltd. and Russell Investments. The SMB factor gives the idea that firms with small market capitalization can earn higher returns than firms with high market capitalization. The other Fama–French factor HML shows the difference in returns between a firm with a high book-to-market ratio (often designated as a value stock) and a firm with a low book-to-market ratio (so-called growth stocks). The proxy of SMB and HML at time t can be constructed as follows,
where is return on the Russell–Nomura Small Cap Value Index at time t; is return on the Russell–Nomura Small Cap Growth Index at time t; is return on the Russell–Nomura Large Cap Value Index at time t and is return on the Russell–Nomura Large Cap Growth Index at time t.
We can estimate the expected return using the following model:
Here, “market premium” is calculated by subtracting the risk-free rate from the market portfolio. The 10-year Japanese Government Bond Index is considered a proxy for the risk-free rate. These factors are considered in the event study methodology based on significance. For the interaction terms, these three factors are considered with dummy variables where “1” represents socially responsible funds, and “0” indicates conventional funds. This technique helps identify whether these risk exposures differ significantly between SRI and conventional funds.
From the output of factors constructed for this study in Table 4, for all factors and their interaction coefficients it has been observed that they have significant effects on return at one percent significant level. Thus, these three factors can be considered in this event study with the Fama–French factor model. The interaction term confirms the positive or negative exposure of the funds. The sign is positive for market return and its interaction term with SRI dummy indicates that socially responsible funds had greater exposure to the market return in comparison to conventional funds. Previous studies conducted by Nakai et al. [4] and Becchetti et al. [47] found a similar result and, like our study, confirmed the consistency of the findings.
The sign is negative for SMB factor indicating that invested funds of larger firms are getting more returns compared with their counterparts. Regarding HML factors positive sign in the factors constructed for this study, it can be concluded that investment funds holding firms are value-oriented rather than growth. However, the opposite direction was found for the HML factor constructed on French’s website for Japan. The coefficient of HML and that which interacted with the dummy was showing that socially responsible funds are more exposed to the value-oriented than the conventional fund. The result is not consistent with Nakai et al. [4] and Leite and Cortez [46].
In order to check the results of Fama–French factors constructed for this study, we have tested the regression results using Fama–French 3 Factors for Japan indicated in the website of Kenneth R. French [64]. Results using two different sources of Fama–French factors confirmed the robustness with some exceptions (Table 4). This exception might be due to the different construction approaches of the Fama–French factors regarding currency, risk-free rate, formulation of SMB, etc.
Now, the abnormal return can be calculated using the Fama–French factor model as follows:
To test the significance of the event, the same steps as an event study with the market model using OLS and event study with the market model using EGARCH can be followed.
4. Results and Discussion
The following outputs in Table 5, Table 6, Table 7, Table 8 and Table 9 will explain the estimation (average cumulative abnormal return) and J-statistics results of the models described in Section 3.2.
4.1. Recent U.S. Election Impact on the Return of All Funds Together
The recent U.S. election is the concern for Japan for many reasons such as high trade relations and the possibility of the backing out of the U.S. from the transpacific trade agreement. Japan was the fourth-largest export market and trading partner for the United States in 2018. The U.S. goods exports to Japan reached $75.7 billion in 2018, while services exports were $45.4 billion, for a total of $121.1 billion. Imports of goods from Japan topped $142 billion in 2018, as services imports neared $37 billion, for a total of $179.1 billion. Japan has a good tie with the U.S. historically regarding foreign direct investment (FDI) and it has grown every year for the past ten years, from $238 billion in 2009 to $484 billion in 2018 [64]. Thus, investors in Japan are worried about Donald Trump’s unexpected policies. In the short term, the market reaction might receive high attention due to unexpected policy changes.
Moreover, political uncertainty can impact investors and markets in several ways. For example, Doukas, Chansog, and Pantzalis [65] found that the mispricing of stocks tends to occur when there is high information uncertainty. Moreover, Ortega and Tornero [66] found negative returns close after elections and suggest that this could show that the market needs time to assess the election’s impact following the vote count and the coming change in policies. A similar result was found in the analysis of Nippani Arize [67] in their article on stock market volatility by the U.S. election of 2000. They found evidence indicating that both the Canadian and Mexican stock markets were affected negatively. Thus, we hypothesize that the recent U.S. presidential election has an impact on the return of Japanese investment funds.
The hypothesis that “there are no abnormal returns on all funds together around the days of the recent U.S. presidential election” can be rejected at 1% significant level for all models. It is evident from Table 5 that the event had a significant effect on the returns of funds with J-statistics of 13.96, 8.8 and 14.17 in the event study method with the market model without EGARCH, the market model with EGARCH and Fama–French factor model respectively. The average price impact of the fund is 0.3 percent, 0.2 percent and 0.3 percent in the market model without EGARCH, the market model with EGARCH and Fama–French factor model respectively, as the estimated average cumulative abnormal returns (ACAR) are 0.003, 0.002 and 0.003 in the above-mentioned models respectively. Robustness is checked by testing in three different econometric models that indicates validity in these results (Table 5). In the analysis, the volatility of fund returns is found within the event window which is similar to the result of Bialkowski et al. [68].
4.2. Recent U.S. Election Impact on the Return of SRI vs. Conventional Funds
Now, this study examines how the 2016 U.S. election impacts short-term fund returns in Japan between SRI and conventional funds. It is evident from the empirical result that, in uncertain times, investors tend to avoid conventional stocks since SRI stocks pay a better return. Thus, this can also help explain the more abnormal returns for socially responsible funds, because of the uncertainty that can arise around an election. This thesis is based on a large sample of funds. Therefore, it is believed that this thesis contributes to bringing clarity in the performance area of both funds during election uncertainty. The following hypotheses are investigated.
Hypothesis (H1).
The U.S. election of 2016 had no effect on socially responsible fund returns in Japan.
Hypothesis (H2).
The U.S. election of 2016 had no effect on conventional fund returns in Japan.
Hypothesis (H3).
There is no difference in fund performance between SRI and conventional funds due to the U.S. election.
In the case of socially responsible funds, it is evident from the J-statistics value that the event of the recent U.S. election had a significant effect on the returns of socially responsible funds at the one percent (1%) level with J-statistics of 17.19, 14.04, and 9.44 in event study methodology on market model without EGARCH, market model with EGARCH, and Fama–French factor models respectively. From Table 6, the average price impact in this event window is 0.6 percent, 0.5 percent, and 0.4 percent in the market model without EGARCH, the market model with EGARCH, and Fama–French factor models respectively as the estimated ACAR of socially responsible funds are 0.006, 0.005, and 0.004 in the above-mentioned models respectively.
In the case of conventional funds, when performing the same test as above, it is found that the recent U.S. election had a significant effect on the returns of conventional funds at the one percent (1%) level in event study methodology on market model without EGARCH (J-stat = 3.22) and Fama–French factor models (J-stat = 7.11). However, J-statistics for the market model with EGARCH was 0.24 which not significant. According to Table 6, there is a positive estimated ACAR through all models considered in this study for conventional funds. The average price impact in this event window is 0.1 percent, 0.01 percent, and 0.3 percent in the event study on market model without EGARCH, market model with EGARCH, and Fama–French factor models respectively as the estimated ACAR of conventional funds are 0.001, 0.0001, and 0.003 in the above-mentioned models respectively.
In the event study with the market model without EGARCH and the market model with EGARCH, the difference of the ACAR between SRI and conventional funds in mean test gives a t-statistic coefficient of 2.47 for both models, which implies that the mean CAR of socially responsible funds is significantly higher than mean CAR of conventional funds at five percent (5%) significance level (Table 6). By comparing the mean CAR of SRI and conventional funds in all models, it was found that socially responsible funds are the better performer compared to their counterpart during the benchmark event window around the recent U.S. election. However, in the Fama–French factor model, the difference of CAR between the two groups is not significant. A reason why SRI is performing better would be a positive environmental screening of the most socially responsible funds in Japan which makes investors confident not to sell the stocks during economic shock, though the environmental screening has some additional costs.
The average price impact of socially responsible funds over the benchmark event window consisting of three days is 0.6 per cent in the market model without EGARCH. Hence, if one million yen were invested in a socially responsible fund in the sample when there is a U.S. presidential election, there would be an average gain of approximately 6000 yen over the three trading-days around the election but the gain for the conventional fund is 1000 yen. The gain for the socially responsible fund is more than its counterpart in the other two models too. Therefore, it can be concluded that socially responsible funds showed greater sensitivity (ACAR of SRI > ACAR of conventional) to uncertainty around the recent U.S. presidential election compared to conventional funds.
Moreover, when there is uncertainty about future government policies, stock market volatility tends to increase. This rise in volatility is caused by increases in systematic risk rather than firm-specific risk. Nakai et al. [4] found that the estimated ACAR of socially responsible funds is significantly positive, which is similar to the findings of this research. They stated that the Japanese socially responsible funds were more resilient compared to conventional funds in the Lehman Brothers bankruptcy during the global financial crisis in 2008. According to their analysis, socially responsible fund holders did not sell their stocks even in difficult situations. Regarding the return of funds during economic shock, they indicated the negative return for conventional funds, but this study found the opposite result. There might be scaling intensity of the events concerning economic shocks.
4.3. Recent U.S. Election Impact on the Return of SRI vs. Conventional Funds in Cases of Domestic and International Funds
To investigate the attachment of the fund orientation, this study investigates the quick reaction of funds separately for domestic and internationally involved firms. This study found that international funds had a better return in comparison with domestic funds for both funds. A positive average price impact was found for international funds, whereas it was negative for domestic funds in almost all models. Therefore, it can be said that the fund returns are more attributable to international. Investors might think international enterprises had more CSR activities and domestic firms had less diversification.
In comparison with the estimated ACAR, the socially responsible funds were more resilient (ACAR of SRI > ACAR of conventional) than conventional funds in both domestic and international cases during the U.S. elections for all models (Table 7). In the case of international orientation, the differences of ACAR between SRI and conventional funds are significant at the 5% level (t-stat = 2.45) in the event study with the Fama–French factor model, whereas this difference was not significant for domestic funds.
4.4. The Brexit Referendum Impact on the Return of All Funds together
The term Brexit came to a discussion when the United Kingdom was divided on whether they would remain in or leave the European Union. This decision had a great impact not only for Britain but also for other countries. The U.K. has a great impact on the Japanese economy due to factors regarding international trade, international investment, financial sector, and the stock market. It is estimated that there are nearly 1000 Japanese firms based in the U.K., employing over 150,000 people. The total exports to the U.K. were 1.53 trillion yen (cars, power engines, car parts) and imports from the U.K. were 0.91 trillion yen (medical and pharmaceutical products, cars, power engines) in 2018 [15]. Large Japanese companies such as Toyota, Nissan, etc., have plants in the U.K. These plants sell their products not only in the U.K. but also to other European countries.
The U.K. referendum on whether to stay in or leave the European Union ended with a big surprise to the global economy as well as to Japan. According to the Japan Centre for Economic Research (Saito), Brexit causes stock price volatility which will lead to realized and unrealized losses in investor’s portfolios, and it will ultimately change people’s expectations in the future [69]. The Brexit referendum result reflected quickly in the Japanese share market with a sharp decline in the price. Therefore, our hypothesis is that “there are no significant abnormal fund returns on all funds together around the Brexit referendum result days”.
This study investigates how Japanese investment funds are influenced by the U.K. referendum. The significant (1% level of significance) negative estimated average cumulative abnormal return () of the funds together in all models confirmed the negative shock in Japan (Table 5) due to the isolation of Britain from the European Union (Table 5). It is evident from Table 5 that the average price impact of the fund is −1.4 percent, −1.5 percent and −2.3 percent in the event study on the market model without EGARCH, market model with EGARCH and the Fama–French factor model respectively, as the estimated average cumulative abnormal returns (ACAR) are −0.014, −0.015 and −0.023 in all models respectively.
4.5. The Brexit Referendum Impact on the Return of SRI vs. Conventional Funds
The Brexit referendum had a significant adverse effect on the returns of both SRI and conventional funds. The difference of the estimated between SRI and a conventional fund is also significant in all models (Table 8). The results show that in uncertain times, investors tend to avoid socially responsible funds which is opposite to the U.S. election impact on socially responsible funds. The possibility would be a real connection between Japanese socially responsible firms with the U.K. or the European Union market.
It is clear from empirical findings that conventional funds show greater resilience to the uncertainty around the recent Brexit referendum compared to socially responsible funds. Moreover, when there is uncertainty about future government policies, stock market volatility increases. In comparison with conventional funds, socially responsible funds were more resilient in Japan in the event of the Lehman Brothers bankruptcy during the global financial crisis in 2008 [4]. This result is opposite to the findings of this study. They also indicated negative returns for conventional funds, which is similar to this study.
4.6. The Brexit Referendum Impact on the Return of SRI vs. Conventional Funds in Cases of Domestic and International Funds
The Brexit referendum had a significant (1% level of significance) negative effect on the performance of all funds except domestic conventional funds. One possibility would be less influence of domestic funds by the U.K. business entity. In both domestic and international cases, a significant difference on the estimated was observed between the SRI and conventional funds. The conventional funds had a positive estimated ACAR in the case of domestic funds and negative estimated ACAR for the international funds in the Fama–French factor model (Table 9). The reason may be the international orientation of the fund. Regardless of the domestic and international orientation of the funds, conventional funds were more resilient during the Brexit referendum shock.
4.7. Limitations of the Study
Usually, an event study methodology can have several problems regarding the exact event date, estimation window selection, daily returns, time horizon, confounding effects, market models, etc. The exact event date was known for this study, which ensured the unexpected outcome of the funds. However, the modern election poll survey might have some impact on the volatility of the funds, which violates the assumption of completely unexpected event results. Also, this study is not free from confounding effects. Fund-specific noise might be observed as we have selected the individual funds instead of indices. However, as the short-term event study was conducted, the mis-specification problem of expected returns was not as severe as in a long-term event study.
5. Concluding Remarks
This study investigated the performance and resilience of both SRI and conventional funds in Japan during the U.S. election and Brexit referendum in 2016 using an event study methodology. It is expected that these economic shocks affected fund volatility in Japan. Empirical results obtained using the market model without EGARCH, the market model with EGARCH, and the Fama–French three-factor models showed that the U.S. election had a significant positive effect whereas the Brexit referendum event had a significant negative impact on the performance of the fund returns in Japan around the event window. The negative average cumulative abnormal return (ACAR) of both SRI and conventional funds confirmed the negative shock in Japanese funds due to the isolation of Britain from the European Union.
It is evident from the study that socially responsible funds showed greater sensitivity to the uncertainty around the recent U.S. presidential election in 2016 compared to conventional funds. However, the opposite result was found regarding the Brexit referendum. There might be a reason for more bilateral business involvements of conventional Japanese enterprises with the U.K. and European Union, more than the U.S.A compared to socially responsible funds. This study also found that the performance and resilience of socially responsible funds during the U.S. election event were largely attributable to international funds. Similar results were found by Nakai et al. [4] where they noted that “socially responsible funds better resisted the Lehman Brothers bankruptcy than conventional funds did”. They discussed the two possibilities of the international socially responsible funds resilience, such as “more CSR activities by international firms” and “less diversified domestic socially responsible funds”. Moreover, this study found that conventional funds had a positive ACAR in the case of domestic funds and negative ACAR for international funds during the Brexit referendum. The reason might be the international orientation of the funds.
The important implications of these findings are the optimal strategies of institutional or individual investors who have direct or indirect exposure to the fund volatility risk. The study shows a significant connection between social performance and financial performance of the Japanese funds during the recent U.S. election and Brexit referendum in 2016, meaning that a ‘good’ level of social performance allows responsible investors to suffer less from the negative effects of economic downturn. The buffer effect of a good level of social performance found in this study should motivate investors to invest in socially responsible investing, particularly in times of uncertainty, when investors are facing a hostile environment. We expect that adhering to social and environmental practices does not harm an investor’s competitive position, but on the contrary, constitutes a competitive advantage. We find that the evidence that Japanese socially responsible funds provide additional downside risk protection to investors compared to conventional funds in times of economic shocks, but that they also do not imply any sacrifice in terms of financial performance, is consistent with the study of Nofsinger and Varma [45]. As most of the socially responsible funds in Japan are environmentally screened, socially responsible investors might successfully navigate the dynamic challenges of economic shocks. This pattern could be valued by investors seeking downside protection.
This study can be extended to examine why funds perform better during economic shocks in the context of periods, scaling, risk exposure, screening, etc. This will also help to discover the resilience factors of the funds in the Japanese market.
Author Contributions
Conceptualization, S.A.; supervision, K.S. This paper is to be attributed in equal parts to S.A. and K.S. All authors have read and agreed to the published version of the manuscript.
Funding
This research was partly funded by the Japan Society for the Promotion of Science (JSPS), Grant No. 15K00645.
Acknowledgments
We are highly indebted to Kei Sakata of Ritsumeikan University for his thoughtful comments and Qin Jie of the same university for his guidance regarding finance-related interpretation of the event study. Any errors should be attributed to the authors.
Conflicts of Interest
The authors declare no conflict of interest.
Abbreviations
| SRI | Socially Responsible Investing |
| ACAR | Average Cumulative Abnormal Return |
| Average Cumulative Abnormal Return | |
| TOPIX | Tokyo Stock Price index |
| EGARCH | Exponential Generalized Autoregressive Heteroscedasticity |
References
- Donovan, W. A Short History of Socially Responsible Investing. 2018. Available online: https://www.thebalance.com/a-short-history-of-socially-responsible-investing-3025578 (accessed on 5 December 2019).
- Alliance, G.S.I. Global Sustainable Investment Review. 2018. Available online: http://www.gsi-alliance.org/wp-content/uploads/2019/06/GSIR_Review2018F.pdf (accessed on 24 December 2019).
- Sakuma, K.; Louche, C. Socially Responsible Investment in Japan: Its Mechanism and Drivers. J. Bus. Ethics 2008, 82, 425–448. [Google Scholar] [CrossRef]
- Nakai, M.; Yamaguchi, K.; Takeuchi, K. Can Socially responsible funds better resist global financial crisis? Evidence from Japan. Int. Rev. Financ. Anal. 2016, 48, 12–20. [Google Scholar] [CrossRef] [Green Version]
- Forum, J.S.I. Sustainable Investment Survey. 2018. Available online: http://japansif.com/2018survey-en.pdf (accessed on 4 December 2019).
- United Nations Environment Programme. Towards A Green Economy: Pathways to Sustainable Development and Poverty Eradication; United Nations Environment Programme: Nairobi, Kenya, 2011. [Google Scholar]
- Falcone, P.M.; Sica, E. Assessing the opportunities and challenges of green finance in Italy: An analysis of the biomass production sector. Sustainability 2019, 11, 517. [Google Scholar] [CrossRef] [Green Version]
- Owen, R.; Brennan, G.; Lyon, F. Enabling investment for the transition to a low carbon economy: Government policy to finance early stage green innovation. Curr. Opin. Environ. Sustain. 2018, 31, 137–145. [Google Scholar] [CrossRef]
- Falcone, P.; Imbert, E. Social life cycle approach as a tool for promoting the market uptake of bio-based products from a consumer perspective. Sustainability 2018, 10, 1031. [Google Scholar] [CrossRef] [Green Version]
- Falcone, P.M.; Morone, P.; Sica, E. Greening of the financial system and fueling a sustainability transition: A discursive approach to assess landscape pressures on the Italian financial system. Technol. Forecast. Soc. Chang. 2018, 127, 23–37. [Google Scholar] [CrossRef]
- Falcone, P.M. Green investment strategies and bank-firm relationship: A firm-level analysis. Econ. Bull. 2018, 38, 2225–2239. [Google Scholar]
- Mazzucato, M.; Semieniuk, G. Financing renewable energy: Who is financing what and why it matters. Technol. Forecast. Soc. Chang. 2018, 127, 8–22. [Google Scholar] [CrossRef]
- Ambec, S.; Lanoie, P. Does it pay to be green? A systematic overview. Acad. Manag. Perspect. 2008, 22, 45–62. [Google Scholar]
- Office of the United States Trade Representative. 2019. Available online: https://ustr.gov/countries-regions/japan-korea-apec/japan (accessed on 29 December 2019).
- Trading Economics. 2019. Available online: https://tradingeconomics.com/japan/exports-to-united-kingdom (accessed on 29 December 2019).
- Office for National Statistics. 2019. Available online: https://www.ons.gov.uk/businessindustryandtrade/internationaltrade/articles/whodoestheuktradewith/2017-02-21 (accessed on 29 December 2019).
- Riedl, A.; Smeets, P. Why do investors hold socially responsible mutual funds? J. Financ. 2017, 72, 2505–2550. [Google Scholar] [CrossRef] [Green Version]
- Gutsche, G.; Ziegler, A. Which private investors are willing to pay for sustainable investments? Empirical evidence from stated choice experiments. J. Bank. Financ. 2019, 102, 193–214. [Google Scholar] [CrossRef]
- Foerster, S.R.; Schmitz, J.J. The transmission of US election cycles to international stock returns. J. Int. Bus. Stud. 1997, 28, 1–13. [Google Scholar] [CrossRef]
- Lean, H.H.; Ang, W.R.; Smyth, R. Performance and performance persistence of socially responsible investment funds in Europe and North America. N. Am. J. Econ. Financ. 2015, 34, 254–266. [Google Scholar] [CrossRef] [Green Version]
- Brzeszczyński, J.; McIntosh, G. Performance of portfolios composed of British SRI stocks. J. Bus. Ethics 2014, 120, 335–362. [Google Scholar] [CrossRef] [Green Version]
- Climent, F.; Soriano, P. Green and Good? The Investment Performance of US Environmental Mutual Funds. J. Bus. Ethics 2011, 103, 275–287. [Google Scholar] [CrossRef] [Green Version]
- Richardson, B.J. Keeping Ethical Investment Ethical: Regulatory Issues for Investing for Sustainability. J. Bus. Ethics 2009, 87, 555–572. [Google Scholar] [CrossRef] [Green Version]
- Michelson, G.; Wailes, N.; Van Der Laan, S.; Frost, G. Ethical Investment Processes and Outcomes. J. Bus. Ethics 2004, 52, 1–10. [Google Scholar] [CrossRef]
- Kempf, A.; Osthoff, P. The Effect of Socially Responsible Investing on Portfolio Performance. Eur. Financ. Manag. 2007, 13, 908–922. [Google Scholar] [CrossRef] [Green Version]
- Gil-Bazo, J.; Ruiz-Verdú, P.; Santos, A.A. The performance of socially responsible mutual funds: The role of fees and management companies. J. Bus. Ethics 2010, 94, 243–263. [Google Scholar] [CrossRef] [Green Version]
- Duranda, R.B.; Kohb, S.; Limkriangkraic, M. Saints versus Sinners. Does morality matter? J. Int. Financ. Mark. Inst. Money 2013, 24, 166–183. [Google Scholar] [CrossRef]
- Renneboog, L.; Horst, J.T.; Zhang, C. Socially responsible investments: Institutional aspects, performance, and investor behavior. J. Bank. Financ. 2008, 32, 1723–1742. [Google Scholar] [CrossRef]
- Renneboog, L.; Horst, J.T.; Zhang, C. The price of ethics and stakeholder governance: The performance of socially responsible mutual funds. J. Corp. Financ. 2008, 14, 302–322. [Google Scholar] [CrossRef]
- Lee, D.D.; Humphrey, J.E.; Benson, K.L.; Ahn, J.Y. Socially responsible investment fund performance: The impact of screening intensity. Account. Financ. 2010, 50, 351–370. [Google Scholar] [CrossRef]
- Schroder, M. The performance of socially responsible investments: Investment funds and indices. Swiss Soc. Financ. Mark. Res. 2004, 18, 122–142. [Google Scholar] [CrossRef]
- Bauer, R.; Koedijk, K.; Otten, R. International evidence on ethical mutual fund performance and investment style. J. Bank. Financ. 2005, 29, 1751–1767. [Google Scholar] [CrossRef] [Green Version]
- Bauer, R.; Otten, R.; Rad, A.T. Ethical investing in Australia: Is there a financial penalty? Pac. Basin Financ. J. 2006, 14, 33–48. [Google Scholar] [CrossRef]
- Becchetti, L.; Ciciretti, R. Corporate social responsibility and stock market performance. Appl. Financ. Econ. 2009, 19, 1283–1293. [Google Scholar] [CrossRef]
- Statman, M.; Glushkov, D. The wages of social responsibility. Financ. Anal. J. 2009, 65, 33–46. [Google Scholar] [CrossRef]
- Gladysek, O.; Chipeta, C. The impact of socially responsible investment index constituent announcements on firm price: Evidence from the JSE. S. Afr. J. Econ. Manag. Sci. 2012, 15, 429–439. [Google Scholar]
- Managi, S.; Okimoto, T.; Matsu, A. Do socially responsible investment indexes outperform conventional indexes? Appl. Financ. Econ. 2012, 22, 1511–1527. [Google Scholar] [CrossRef] [Green Version]
- Almazan, A.; Brown, K.C.; Chapman, D.; Carlson, M. Why constrain your mutual fund manager? J. Financ. Econ. 2004, 73, 289–321. [Google Scholar] [CrossRef]
- Bello, Z.Y. Socially responsible investing and portfolio diversification. J. Financ. Res. 2005, 28, 41–57. [Google Scholar] [CrossRef]
- Barnett, M.L.; Salomon, R.M. Beyond dichotomy: The curvilinear relationship between social responsibility and financial performance. Strateg. Manag. J. 2006, 27, 1101–1122. [Google Scholar] [CrossRef]
- Rathner, S. The Performance of Socially Responsible Investment Funds: A Meta-Analysis; No. 2012-03; Working Papers in Economics and Finance; University of Salzburg: Salzburg, Austria, 2012. [Google Scholar]
- Capelle-Blancard, G.; Monjon, S. Trends in the literature on socially responsible investment: Looking for the keys under the lamppost. Busi. Ethics Eur. Rev. 2012, 21, 239–250. [Google Scholar] [CrossRef] [Green Version]
- Ellis, L.; Bastin, C. Corporate social responsibility in times of recession: Changing discourses and implications for policy and practice. Corp. Soc. Responsib. Environ. Manag. 2011, 18, 294–305. [Google Scholar] [CrossRef]
- Ducassy, I. Does corporate social responsibility pay off in times of crisis? An alternate perspective on the relationship between financial and corporate social performance. Corp. Soc. Responsib. Environ. Manag. 2013, 20, 157–167. [Google Scholar] [CrossRef]
- Nofsinger, J.; Varma, A. Socially responsible funds and market crises. J. Bank. Financ. 2014, 48, 180–193. [Google Scholar] [CrossRef]
- Leite, P.; Cortez, M.C. Performance of European socially responsible funds during market crisis: Evidence from France. Int. Rev. Financ. Anal. 2015, 40, 132–141. [Google Scholar] [CrossRef]
- Becchetti, L.; Ciciretti, R.; Dalò, A. Socially responsible and conventional investment funds: Performance comparison and the global financial crisis. Appl. Econ. 2015, 47, 2541–2562. [Google Scholar] [CrossRef]
- Wu, J.; Lodorfos, G.; Dean, A.; Gioulmpaxiotis, G. The market performance of socially responsible investment during periods of the economic cycle–Illustrated using the case of FTSE. Manag. Decis. Econ. 2017, 38, 238–251. [Google Scholar] [CrossRef]
- Ito, Y.; Managi, S.; Matsuda, A. Performances of socially responsible investment and environmentally friendly funds. J. Oper. Res. Soc. 2013, 64, 1583–1594. [Google Scholar] [CrossRef] [Green Version]
- Nakai, M.; Yamaguchi, K.; Takeuchi, K. Sustainability membership and stock price: An empirical study using the Morningstar-SRI Index. Appl. Financ. Econ. 2013, 23, 71–77. [Google Scholar] [CrossRef]
- Nakajima, K. Socially Responsible Firms and Stock Returns: Evidence from Japanese Constituents in FTSE4 Good Index; Draft, Nikko Financial Intelligence, Inc.: Tokyo, Japan, 2011. [Google Scholar]
- Japan Investment Trust Association. 2017. Available online: http://tskl.toushin.or.jp (accessed on 10 May 2017).
- Investing.com. 2017. Available online: https://uk.investing.com/indices/topix-historical-data (accessed on 10 May 2017).
- Nomura Securities. Global Research Division, Financial Engineering & Technology Research Centre. 2017. Available online: http://qr.nomuraholdings.com (accessed on 10 May 2017).
- Eugene, F.F.; Lawrence, F.; Michael, J.C.; Richard, R. The adjustment of stock prices to new information. Int. Econ. Rev. 1969, 10, 1–21. [Google Scholar]
- Sorescu, A.; Warren, N.L.; Ertekin, L. Event study methodology in the marketing literature: An overview. J. Acad. Mark. Sci. 2017, 45, 186–207. [Google Scholar] [CrossRef]
- De Jong, A.; Naumovska, I. A note on event studies in finance and management research. Rev. Financ. 2015, 20, 1659–1672. [Google Scholar] [CrossRef]
- Mackinlay, A.C. Event Studies in Economics and Finance. J. Econ. Lit. 1997, 35, 13–39. [Google Scholar]
- Fama, F.E. Efficient Capital Markets: II. J. Financ. 1991, 46, 1575–1617. [Google Scholar] [CrossRef]
- Engle, R.F. Autoregressive conditional heteroscedasticity with estimates of the variance of United Kingdom inflation. Econ. J. Econ. Soc. 1982, 50, 987–1007. [Google Scholar] [CrossRef]
- Engle, R.F.; Bollerslev, T. Modelling the persistence of conditional variances. Econ. Rev. 1986, 5, 1–50. [Google Scholar] [CrossRef]
- Nelson, D.B. Conditional heteroskedasticity in asset returns: A new approach. Econ. J. Econ. Soc. 1991, 59, 347–370. [Google Scholar] [CrossRef]
- Faff, R. A simple test of the Fama and French model using daily data: Australian evidence. Appl. Financ. Econ. 2004, 14, 83–92. [Google Scholar] [CrossRef]
- Kenneth, R. French. 2019. Available online: http://mba.tuck.dartmouth.edu/pages/faculty/ken.french/index.html (accessed on 24 December 2019).
- Doukas, J.; Chansog, K.; Pantzalis, C. Arbitrage Risk and Stock Mispricing. CFA Dig. 2011, 41, 37–39. [Google Scholar]
- Ortega, D.F.; Tornero, Á.P. Politics and Elections at the Spanish Stock Exchange. In Proceedings of the 9th Global Conference on Business & Economics, Cambridge, UK, 16–17 October 2009. [Google Scholar]
- Nippani, S.; Arize, A.C. U.S. presidential election impact on Canadian and Mexican stock markets. J. Econ. Financ. 2005, 29, 271–279. [Google Scholar] [CrossRef]
- Białkowski, J.; Gottschalk, K.; Wisniewski, T.P. Stock market volatility around national elections. J. Bank. Financ. 2008, 32, 1941–1953. [Google Scholar] [CrossRef] [Green Version]
- Saito, J. Brexit’s Impact on the Japanese Economy; Japan Centre for Economic Research: Tokyo, Japan, 2016. [Google Scholar]
Figure 1.
Global socially responsible investing (SRI) assets (trillion dollar).

Figure 2.
SRI asset of Japan (billion USD).

Figure 3.
Timeline for an event study.


Table 1.
Sample sizes of SRI and conventional funds.
| Funds | Domestic | International | Total |
|---|---|---|---|
| SRI | 23 | 12 | 35 |
| Conventional | 32 | 38 | 70 |
| Total | 55 | 50 | 105 |
Table 2.
Descriptive statistics of the funds and different indexes.
| Items | Observations | Mean | Std. Dev. | Min | Max |
|---|---|---|---|---|---|
| Socially Responsible Funds | 7910 | −0.0003 | 0.0204 | −1.282 | 0.0806 |
| Conventional Funds | 15,820 | −0.0005 | 0.0208 | −1.044 | 0.5000 |
| Market Proxy (TOPIX) | 226 | −0.0001 | 0.0166 | −0.0782 | 0.0742 |
| Market Premium | 226 | 0.0094 | 0.4205 | −1.633 | 1.818 |
| SMB Index | 226 | −0.0010 | 0.0220 | −0.0867 | 0.0855 |
| HML index | 226 | −0.0007 | 0.0132 | −0.0660 | 0.0568 |
Table 3.
Two external economic events in 2016.
| Events | First Transaction Date in the Japanese Market Based on the Event Impact |
|---|---|
| The U.S. election | 10 November 2016 |
| The Brexit referendum | 27 June 2016 |
Note: To set the event impact date in the market, we have considered the time difference between countries and holidays in Japan.
Table 4.
Regression results using Fama–French factor model.
| Variables | Return | |||
|---|---|---|---|---|
| Factors Constructed for this Study for Japan | Factors Constructed in French’s Website for Japan | |||
| Coefficient | Standard Error | Coefficient | Standard Error | |
| Market Premium | 0.000913 *** | 0.000350 | 0.00003 *** | 0.000001 |
| SMB | −0.024181 *** | 0.005881 | −0.000012 *** | 0.000003 |
| HML | 0.472291 *** | 0.009809 | −0.000009 *** | 0.000003 |
| Market Premium * SRI | 0.001922 *** | 0.000600 | 0.000027 *** | 0.000002 |
| SMB * SRI | −0.000029 *** | 0.000007 | −0.000038 *** | 0.000006 |
| HML * SRI | 0.000006 *** | 0.000001 | 0.000006 | 0.000004 |
| Constant | −0.000832 *** | 0.000156 | −0.000598 *** | 0.000142 |
| Observations | 23,730 | 23,730 | ||
| Number of funds | 105 | 105 | ||
*** significant at 1% level.
Table 5.
Estimation (average cumulative abnormal returns, ACAR) and test of the events on the return of all funds together.
Table 5.
Estimation (average cumulative abnormal returns, ACAR) and test of the events on the return of all funds together.
| Events in 2016 | Event Study Methodology | ||
|---|---|---|---|
| Market Model without EGARCH | Market Model with EGARCH | Fama–French Factor Model | |
| The U.S. election | 0.003 *** (13.96) | 0.002 *** (8.80) | 0.003 *** (14.17) |
| The Brexit referendum | −0.014 *** (−18.45) | −0.015 *** (−19.46) | −0.023 *** (−40.29) |
Note: Numbers in parentheses are J-statistics. *** significant at 1% level.
Table 6.
Comparison of ACAR between SRI and conventional funds.
| Event | Type of Fund | Market Model without EGARCH | Market Model with EGARCH | Fama–French Factor Model |
|---|---|---|---|---|
| The U.S. election in 2016 | Socially responsible fund | 0.006 *** (17.19) | 0.005 *** (14.04) | 0.004 *** (9.44) |
| Conventional Fund | 0.001 *** (3.22) | 0.0001 (0.24) | 0.003 *** (7.11) | |
| Difference | 0.005 ** (2.47) | 0.005 ** (2.47) | 0.001 (0.57) |
Note: For SRI and conventional funds, numbers in parentheses are J-statistics. For difference, numbers in parentheses are t-statistics. *** Significant at 1% level, ** significant at 5% level.
Table 7.
Comparison of ACAR between SRI and conventional funds in case of domestic and international orientation.
Table 7.
Comparison of ACAR between SRI and conventional funds in case of domestic and international orientation.
| Event | Fund Type | Domestic | International | ||||
|---|---|---|---|---|---|---|---|
| Market Model without EGARCH | Market Model with EGARCH | Fama–French Factor Model | Market Model without EGARCH | Market Model with EGARCH | Fama–French Factor Model | ||
| The U.S. election, 2016 | Socially responsible fund | 0.001 (1.60) | −0.0001 (−0.23) | −0.003 *** (67.32) | 0.017 *** (17.99) | 0.015 *** (16.67) | 0.017 *** (19.17) |
| Conventional Fund | −0.009 *** (−13.43) | −0.008 *** (−11.33) | −0.008 *** (−9.42) | 0.010 *** (17.64) | 0.007 *** (11.32) | 0.011 *** (21.05) | |
| Difference | 0.010 *** (3.99) | 0.008 *** (3.04) | 0.004 (1.51) | 0.007 ** (2.47) | 0.008 *** (2.95) | 0.006 ** (2.45) | |
Note: For SRI and conventional funds, numbers in parentheses are J-statistics. For difference, numbers in parentheses are t-statistics. *** Significant at 1% level, ** significant at 5% level.
Table 8.
Comparison of ACAR between SRI and conventional funds.
| Event | Type of Fund | Market Model without EGARCH | Market Model with EGARCH | Fama–French Factor Model |
|---|---|---|---|---|
| Brexit Referendum | Socially responsible fund | −0.022 *** (−22.54) | −0.024 *** (−24.73) | −0.032 *** (−35.14) |
| Conventional Fund | −0.010 *** (−7.27) | −0.010 *** (−7.62) | −0.018 *** (−18.46) | |
| Difference | −0.013 * (−1.72) | −0.013 * (−1.85) | −0.014 ** (−2.45) |
Note: For SRI and conventional funds, numbers in parentheses are J-statistics. For difference, numbers in parentheses are t-statistics. *** Significant at 1% level, ** significant at 5% level, * significant at 10% level.
Table 9.
Comparison of ACAR between SRI and conventional funds in case of domestic and international orientation.
Table 9.
Comparison of ACAR between SRI and conventional funds in case of domestic and international orientation.
| Event | Fund Type | Domestic | International | ||||
|---|---|---|---|---|---|---|---|
| Market Model without EGARCH | Market Model with EGARCH | Fama–French Factor Model | Market Model without EGARCH | Market Model with EGARCH | Fama–French Factor Model | ||
| Brexit Referendum | Socially responsible fund | −0.004 *** (−3.73) | −0.006 *** (−5.73) | −0.020 *** (−15.06) | −0.057 *** (−33.04) | −0.058 *** (−32.49) | −0.056 *** (−32.98) |
| Conventional Fund | 0.031 *** (7.94) | 0.03 *** (7.63) | 0.010 *** (3.51) | −0.044 *** (−54.35) | −0.044 *** (−54.16) | −0.042 *** (−52.08) | |
| Difference | −0.035 *** (−2.70) | −0.035 *** (−2.74) | −0.03 *** (−3.03) | −0.013 *** (−3.02) | −0.014 *** (−3.14) | −0.014 *** (−3.25) | |
Note: For SRI and conventional funds, numbers in parentheses are J-statistics. For difference, numbers in parentheses are t-statistics. *** Significant at 1% level.
© 2020 by the authors. Licensee MDPI, Basel, Switzerland. This article is an open access article distributed under the terms and conditions of the Creative Commons Attribution (CC BY) license (http://creativecommons.org/licenses/by/4.0/).
Share and Cite
MDPI and ACS Style
Arefeen, S.; Shimada, K. Performance and Resilience of Socially Responsible Investing (SRI) and Conventional Funds during Different Shocks in 2016: Evidence from Japan. Sustainability 2020, 12, 540. https://doi.org/10.3390/su12020540
AMA Style
Arefeen S, Shimada K. Performance and Resilience of Socially Responsible Investing (SRI) and Conventional Funds during Different Shocks in 2016: Evidence from Japan. Sustainability. 2020; 12(2):540. https://doi.org/10.3390/su12020540
Chicago/Turabian StyleArefeen, Saiful, and Koji Shimada. 2020. "Performance and Resilience of Socially Responsible Investing (SRI) and Conventional Funds during Different Shocks in 2016: Evidence from Japan" Sustainability 12, no. 2: 540. https://doi.org/10.3390/su12020540
Note that from the first issue of 2016, this journal uses article numbers instead of page numbers. See further details here.