External-Cost Estimation of Electricity Generation in G20 Countries: Case Study Using a Global Life-Cycle Impact-Assessment Method


Abstract
:
1. Introduction
1.1. Life-Cycle Assessment (LCA) of Electricity Generation
1.2. External Cost of Electricity Generation

| Impact Considered | Power-Plant Type | Low ($/kWh) | High ($/kWh) | Location | Year | Reference |
|---|---|---|---|---|---|---|
| CC, AP | C, Bio | 0.009 (Bio) | 0.026 (Coal) | China | 2019 | [36] |
| CC, AP | WTE | 0.99 | 0.99 | Spain | 2019 | [37] |
| CC, AP | C, L | 0.041 (C) | 0.082 (L) | Poland | 2018 | [38] |
| AP | C, NGC, NGCC | 0.019 | 0.089 | Iran | 2015 | [39] |
| AP, CC, R | Bio, C, Li, N, NGCC, O, S, W | 0.001 (H) | 0.078 (Bio) | Lithuania | 2014 | [30] |
| AP, CC, SOC | C | 0.029 | 0.25 | Northern Poland | 2012 | [33] |
| AP, CC | C | 0.046 | 0.046 | Western India | 2012 | [35] |
| AP | Li | 0.002 | 0.035 | Turkey | 2011 | [40] |
| AP | C | 0.115 | 0.225 | Bosnia and Herzegovina | 2011 | [3] |
| CC | Li, NG, O | 0.014 (NG) | 0.034 (Li) | Greece | 2010 | [41] |
| AP, CC, SOC | Bio, C, H, Li, N, NGCC, O, P, S, W | <0.001 (H, W) | 0.240 (Li) | EU25 | 2008 | [28] |
| AP | C, O, NG, Bio, N, W, S | 0.001 (S, W) | 0.375 (C) | Global | 2007 | [34] |
| AP, CC | Bio, C, Geo, H, NG, O, N, S, W | 0.001 (H, S, W) | 0.177 (C) | Global | 2007 | [29] |
| AP | O | 0.008 | 0.013 | Cuba | 2007 | [42] |
| AP | C, NG, O | 0.001 (NG) | 0.007 (NG, O) | Croatia | 2005 | [31] |
| AP, CC | C | 0.021 | 0.144 | South Africa | 2003 | [43] |
- Previous research has tended to only focus on the impact of air pollution or climate change, which could easily lead to an underestimation of the damages;
- Several studies only consider the operational stage (electricity generation stage), which is not adapted for the assessment of renewables;
- Only three studies covered the entire range of possibilities for different electricity generation sources;
- Rafaj and Kypreos (2007) [29] and Klaassen et al. (2007) [34] are the only studies to establish a comparison on a global scale. However, their models only estimate the external cost at the continental or global level, which is a serious limitation because, for example, the situation between western and eastern Europe is completely different (with a higher reliance on renewables in the former area and a higher reliance on coal (especially lignite) in the latter);
- The two previous studies were published more than 10 years ago, so they do not take into account current technological progress or the shift in the energy mix, which both have a strong influence on the results [28].
2. Materials and Methods
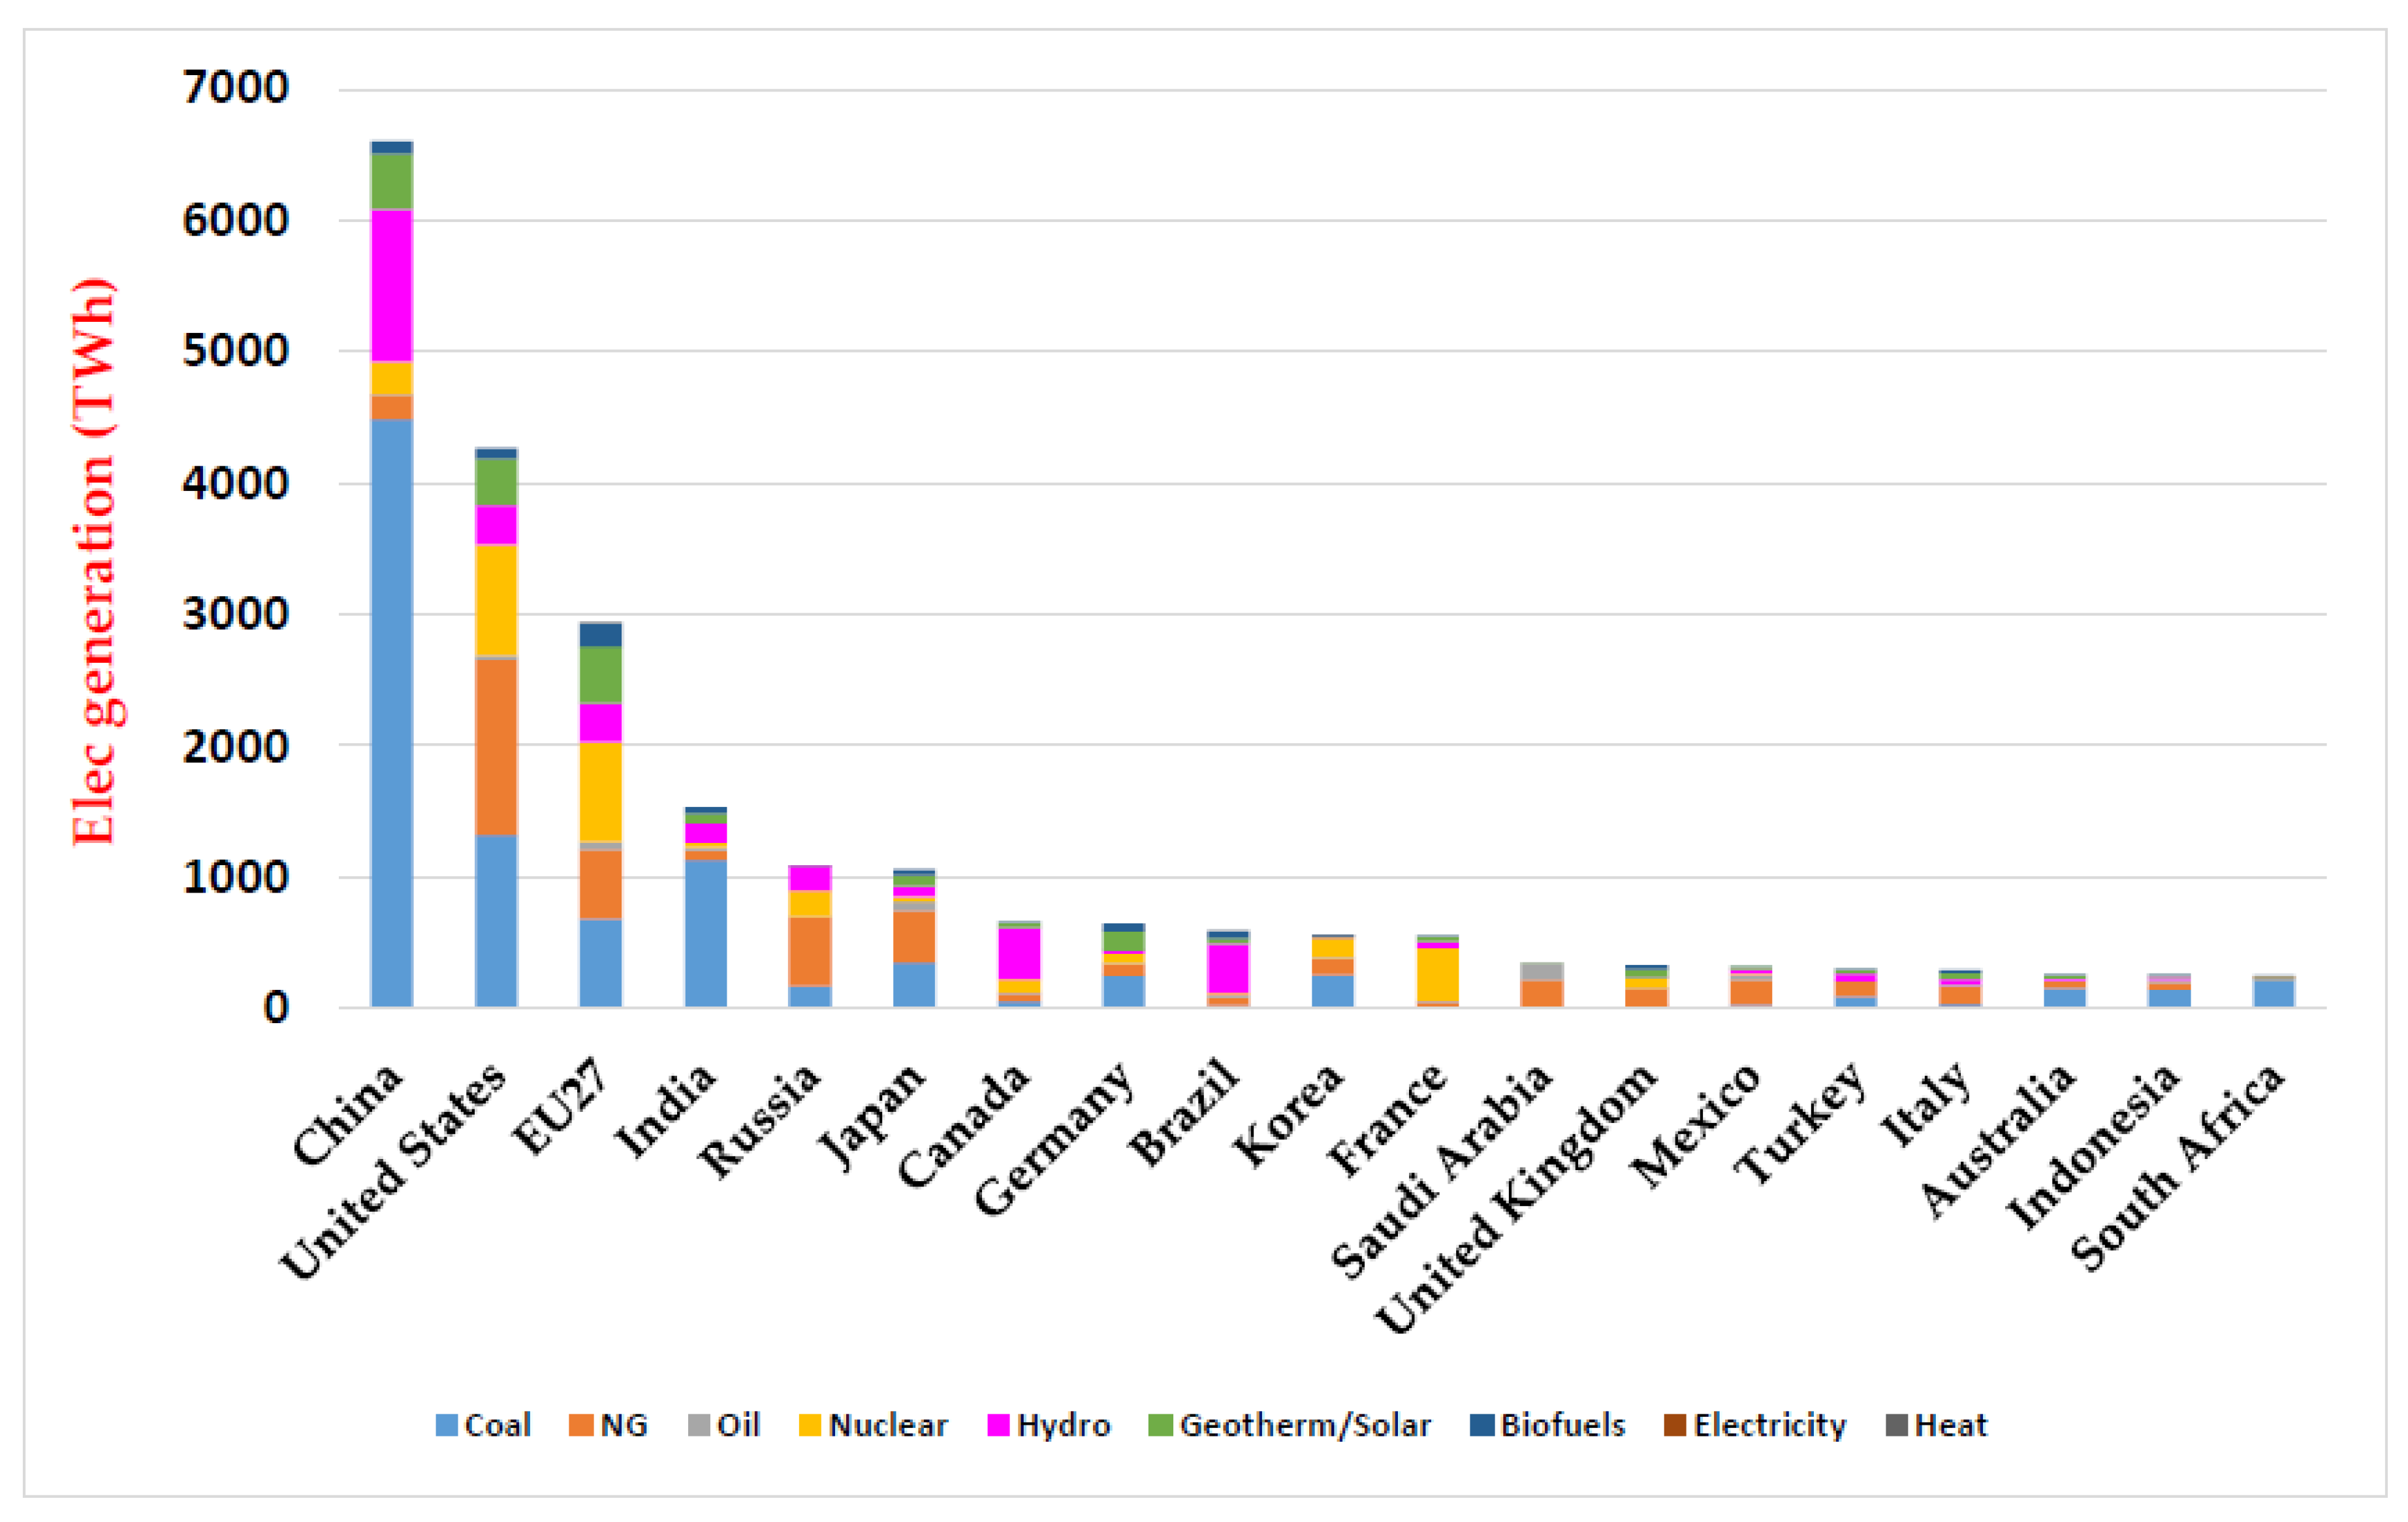
2.1. Goal and Scope
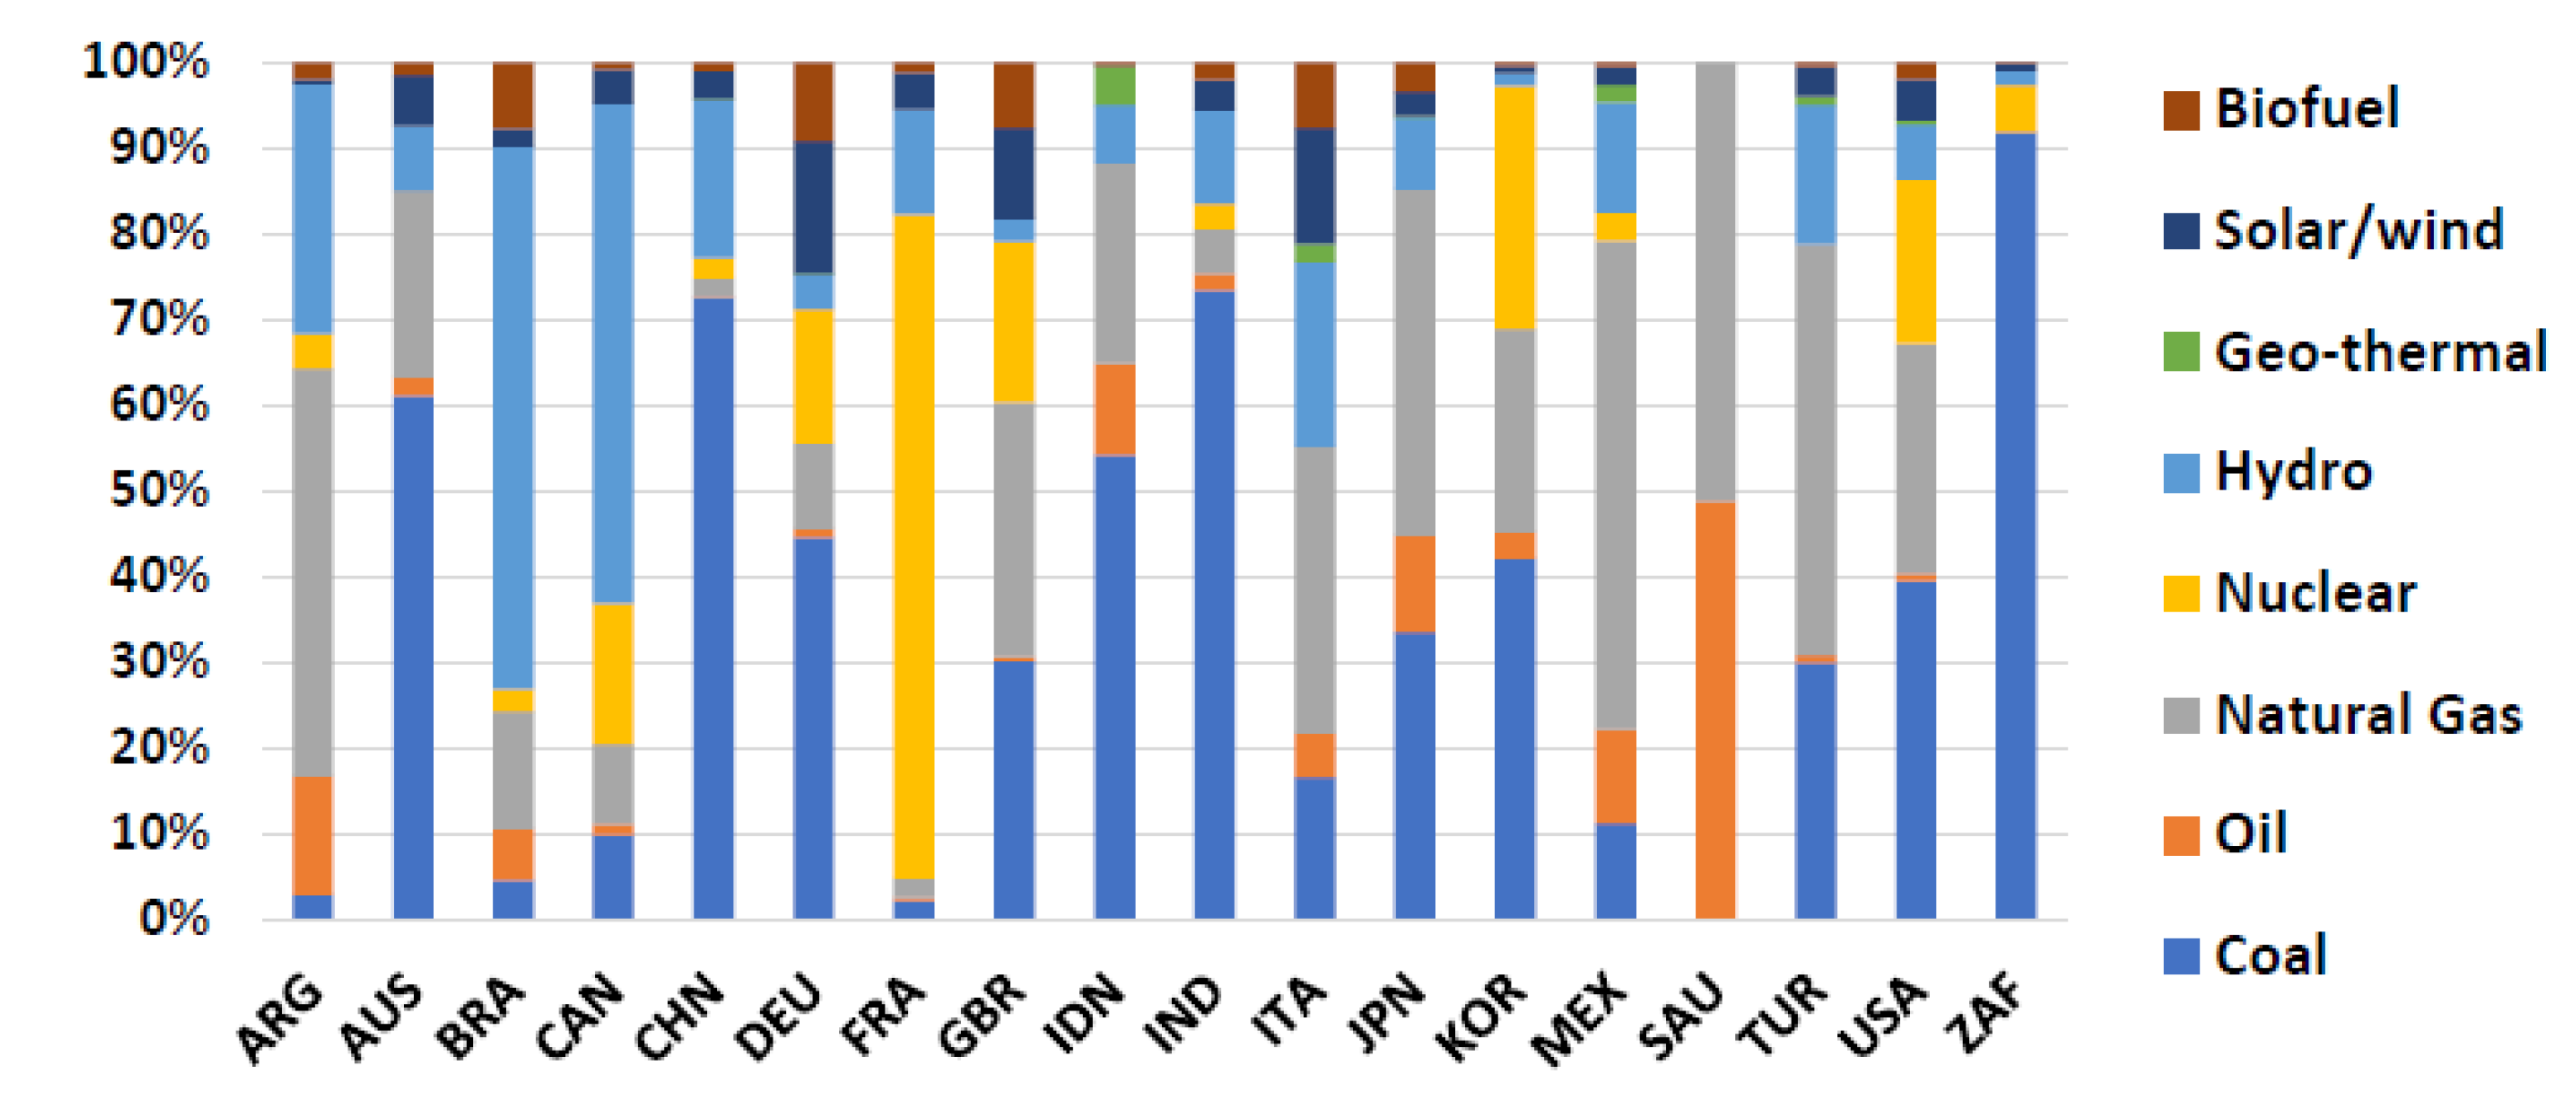
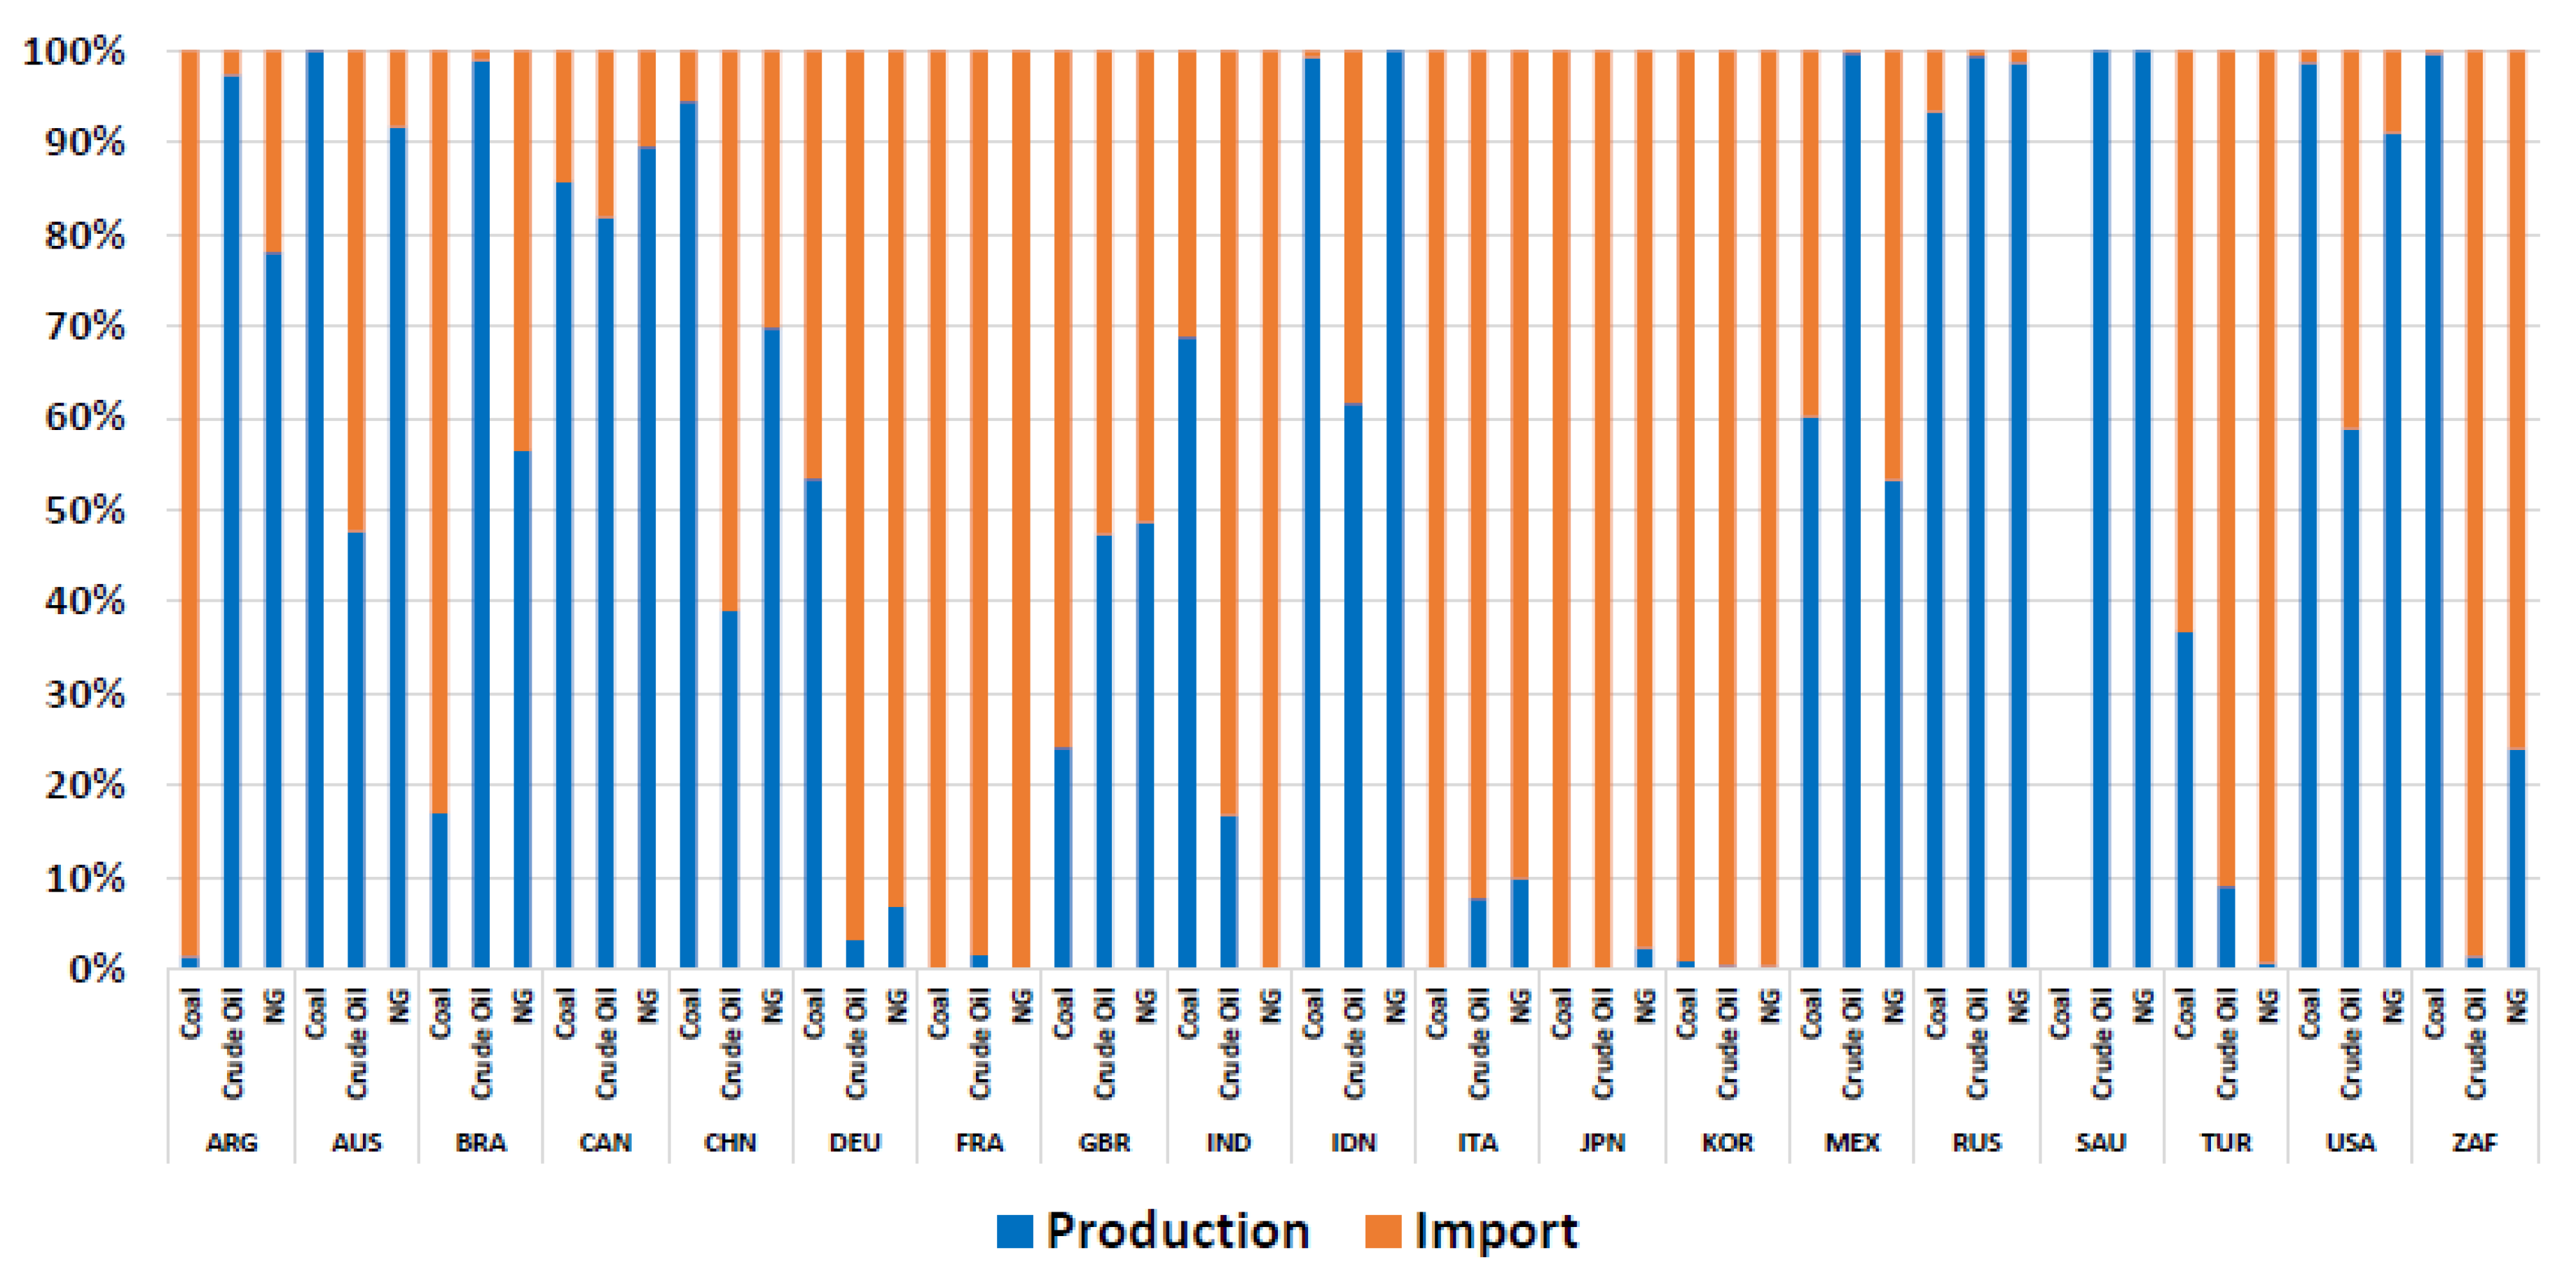
2.2. Inventory
- -
- Coal: In comparison to hard coal, lignite (also referred sometimes as brown coal) is the lowest grade coal with higher emissions of carbon dioxide and air pollutants during combustion.
- -
- Natural gas: A combined cycle power plant combines both a gas and a steam turbine together for better efficiency than conventional plants.
- -
- Wind: Both onshore and offshore options have pros and cons. Onshore wind farms are currently the most popular type of wind farm for economical reasons (with higher maintenance and supply costs for offshore turbines).
- -
- Hydro: In run-of-river sytems, water flows from a river though a canal or penstock to spin a turbine; in pumped-storage systems composed of a lower and upper reservoir, during high demand, the water is pumped from the upper reservoir to spin a turbine and produce electricity; in reservoir systems, a dam is used to store water, which is later released to spin turbines and produce electricity.
- -
- Nuclear: Both boiling water and pressure water reactors use nuclear energy as fuel and water to generate steam and cool the reactors. However, a pressure water reactor uses two water circuits, while boiled water generates steam using only one water circuit.
- -
- Solar: Open ground facilities can generate much more energy than simple roof-top panels; however, they require the occupation of land.
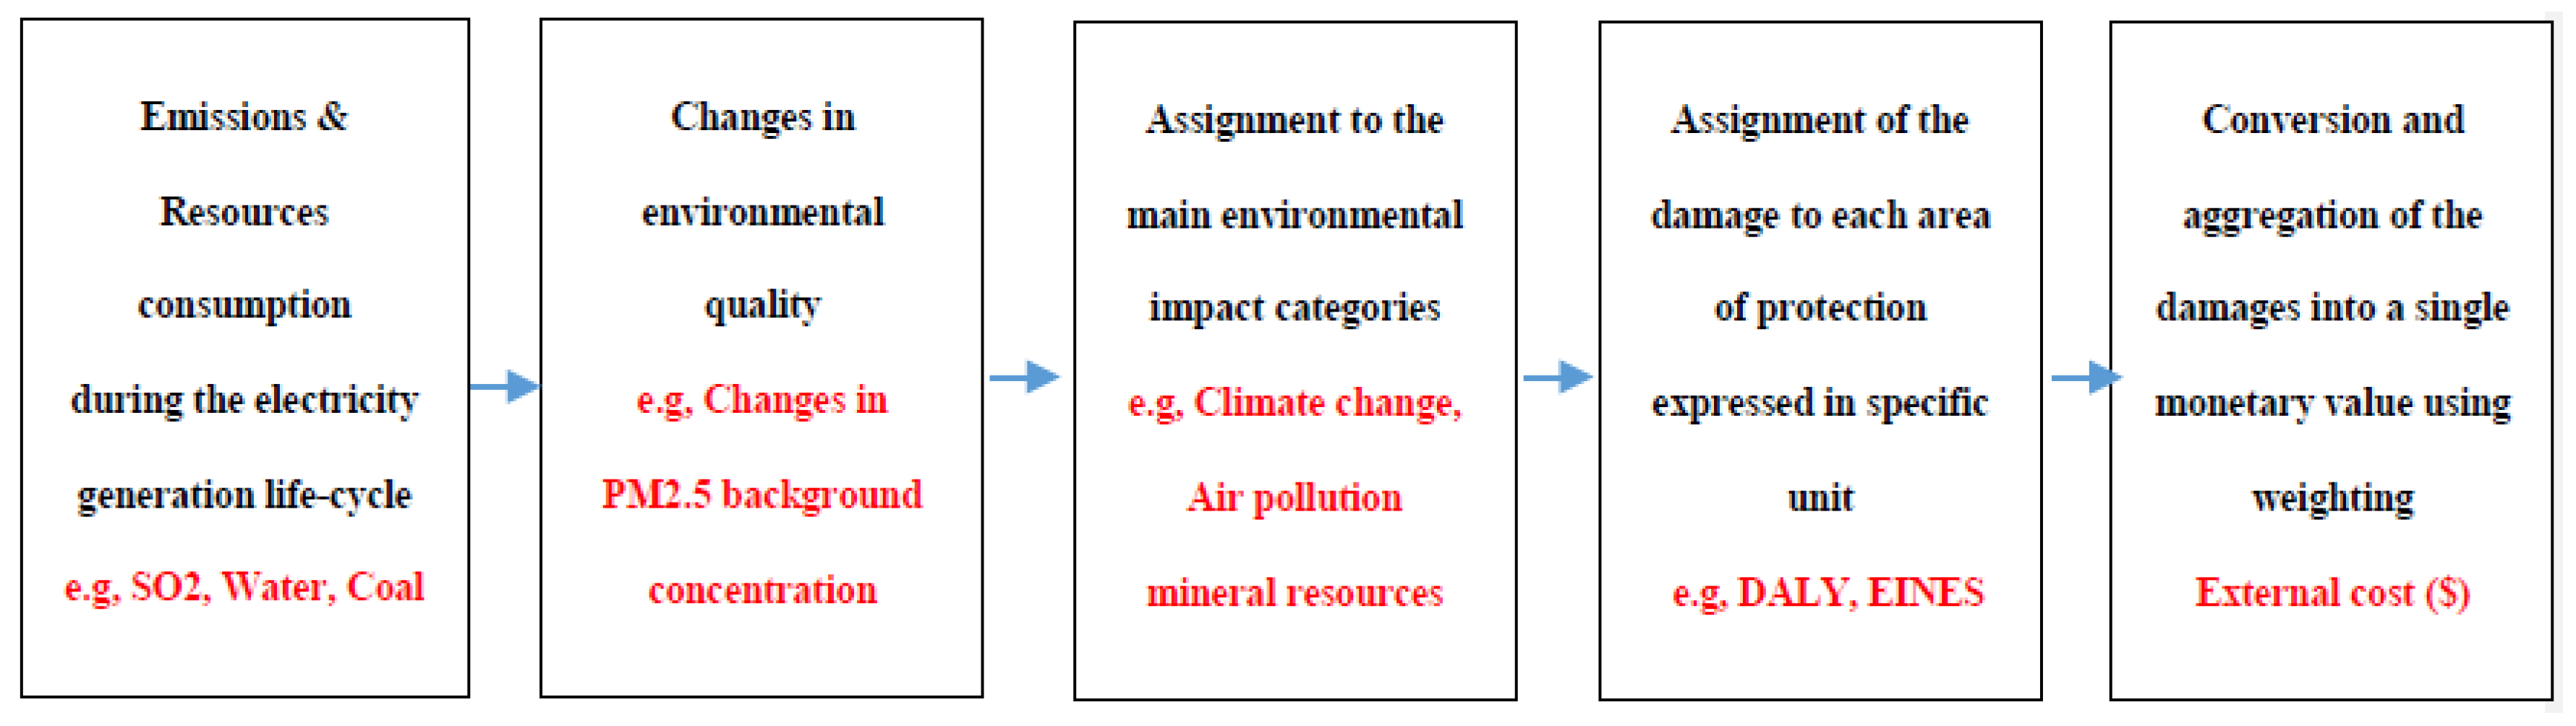
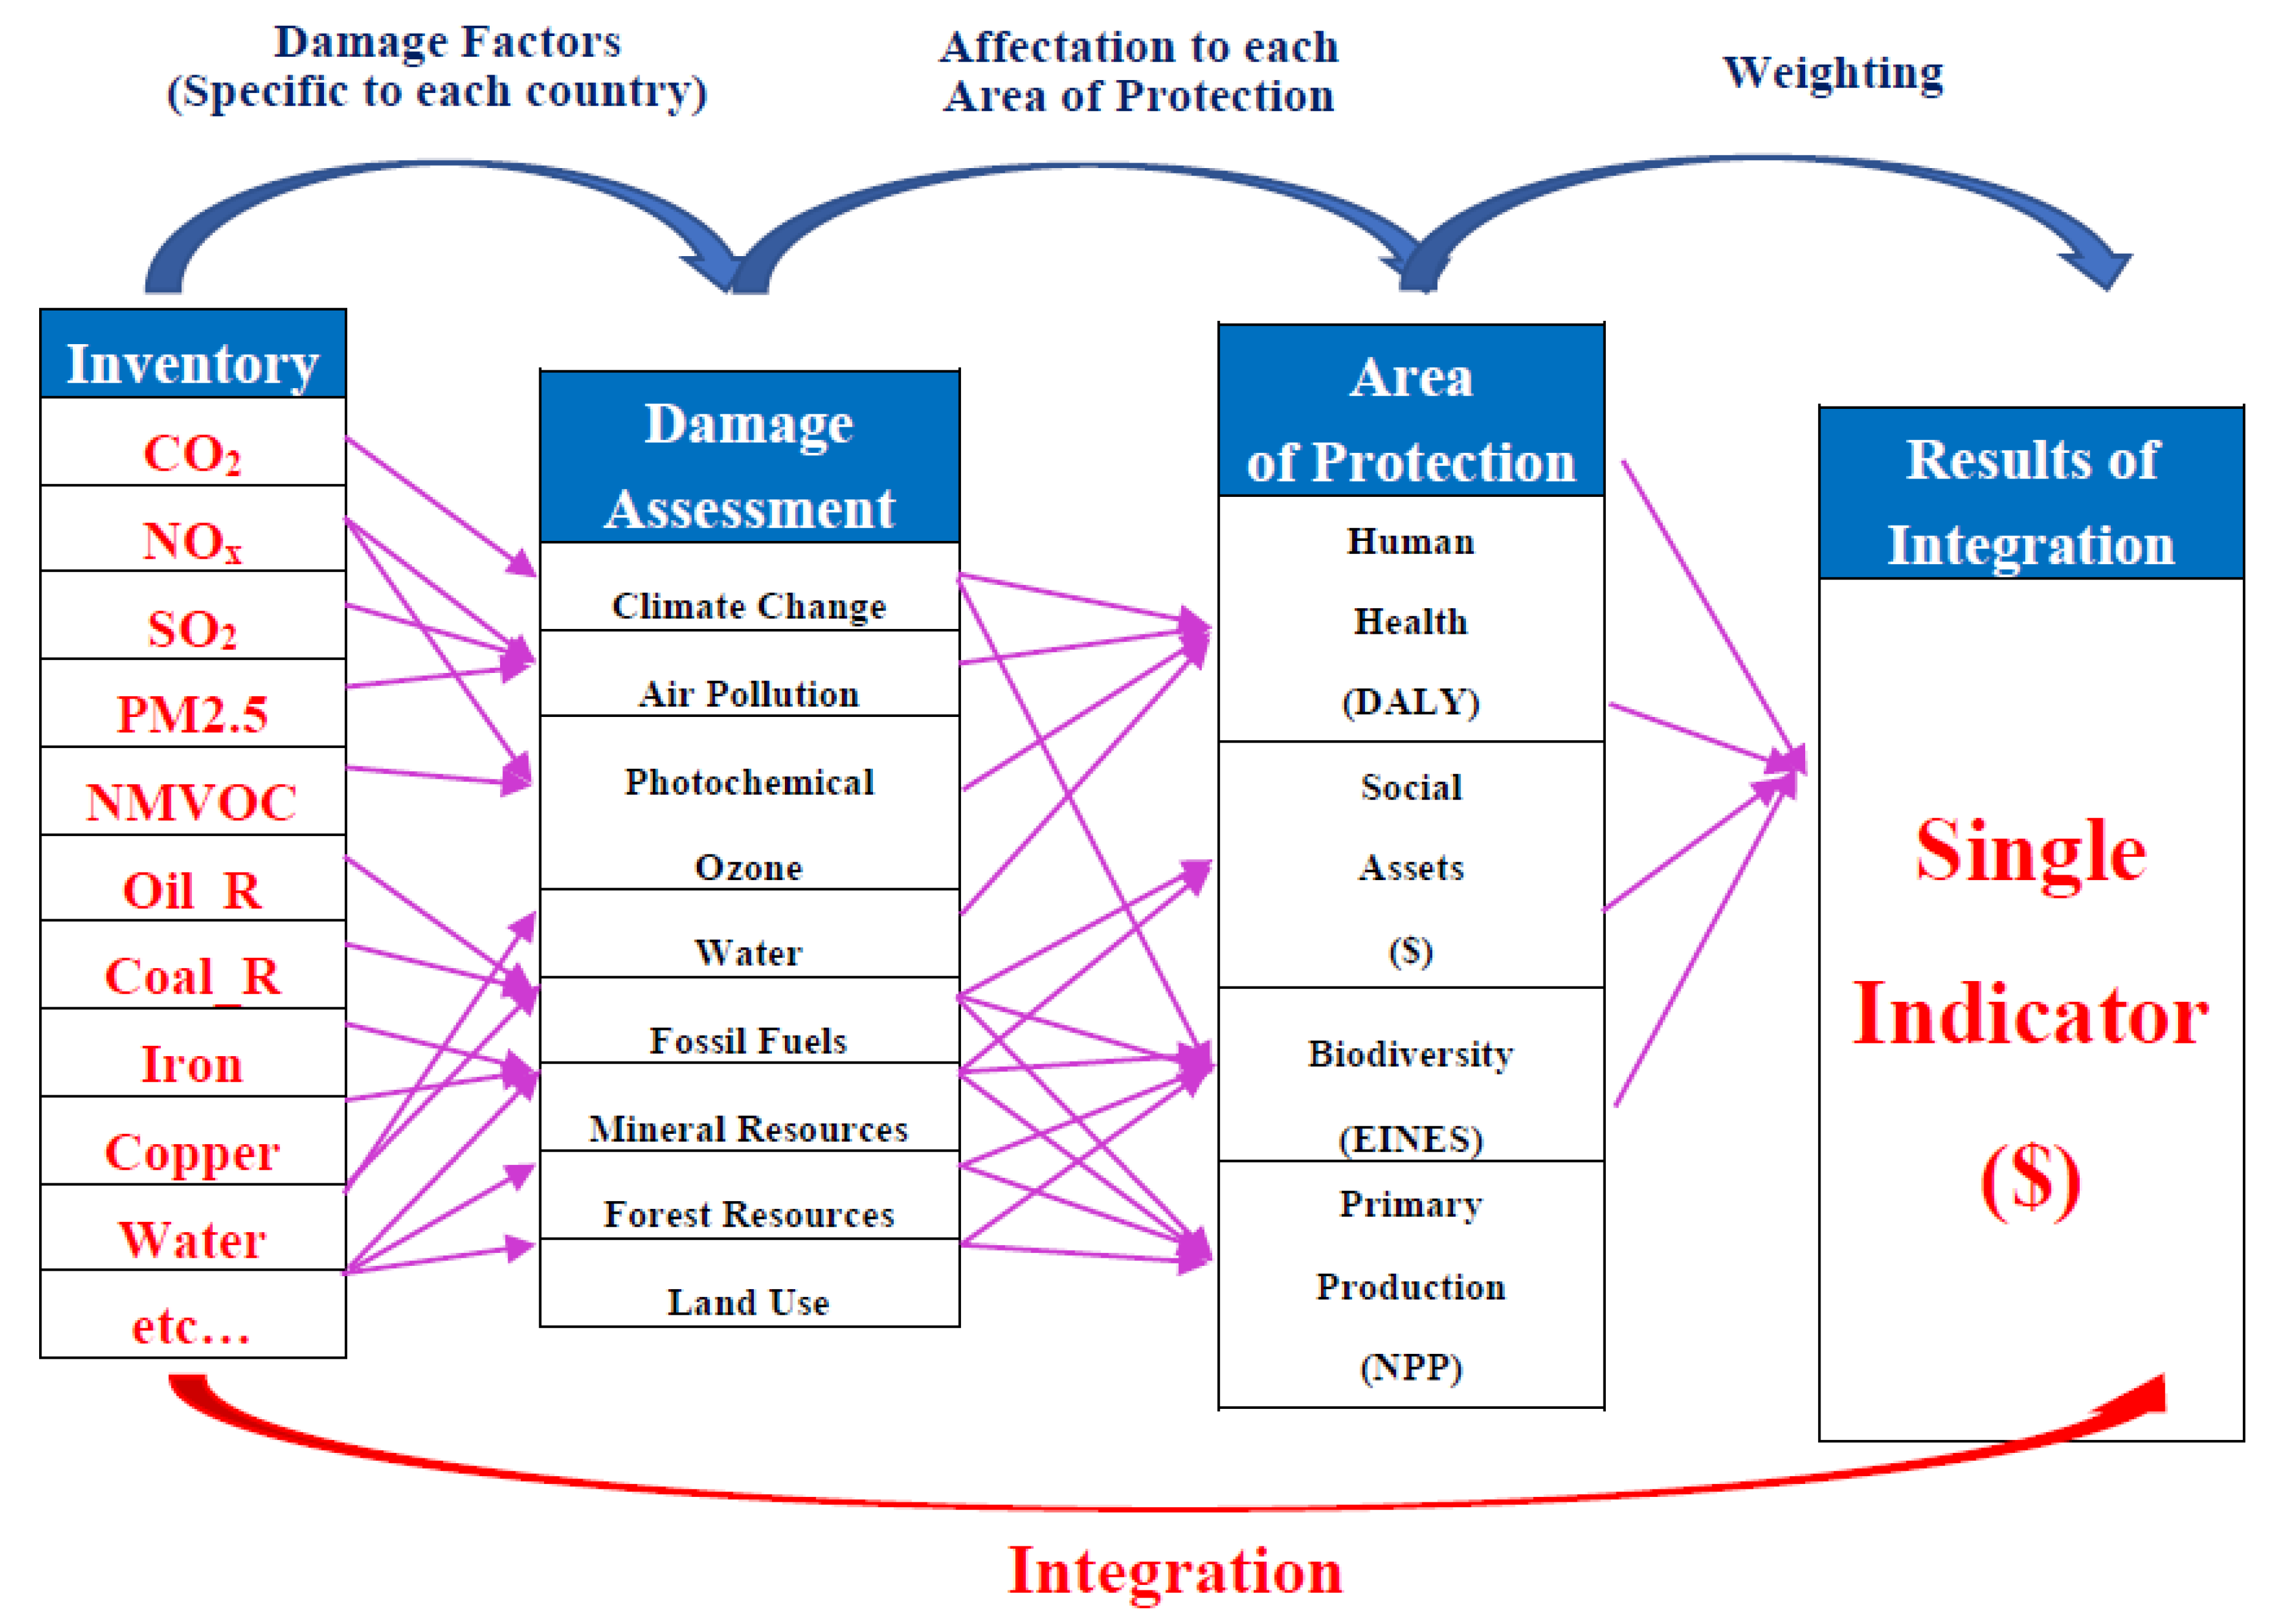
2.3. Impact Assessment
- -
- Inv(X) is the amount of inventory item X;
- -
- IFimpact is the integration factor associated with “Impact”, which is caused by inventory item X extended to the area of protection “Safe”;
- -
- DFimpact is the damage factor associated with “Impact”, which is caused by inventory item X extended to the area of protection “Safe”;
- -
- EV(Safe) is the economic-value conversion factor based on weighting for the damage of one unit of the area of protection “Safe”.
3. Results
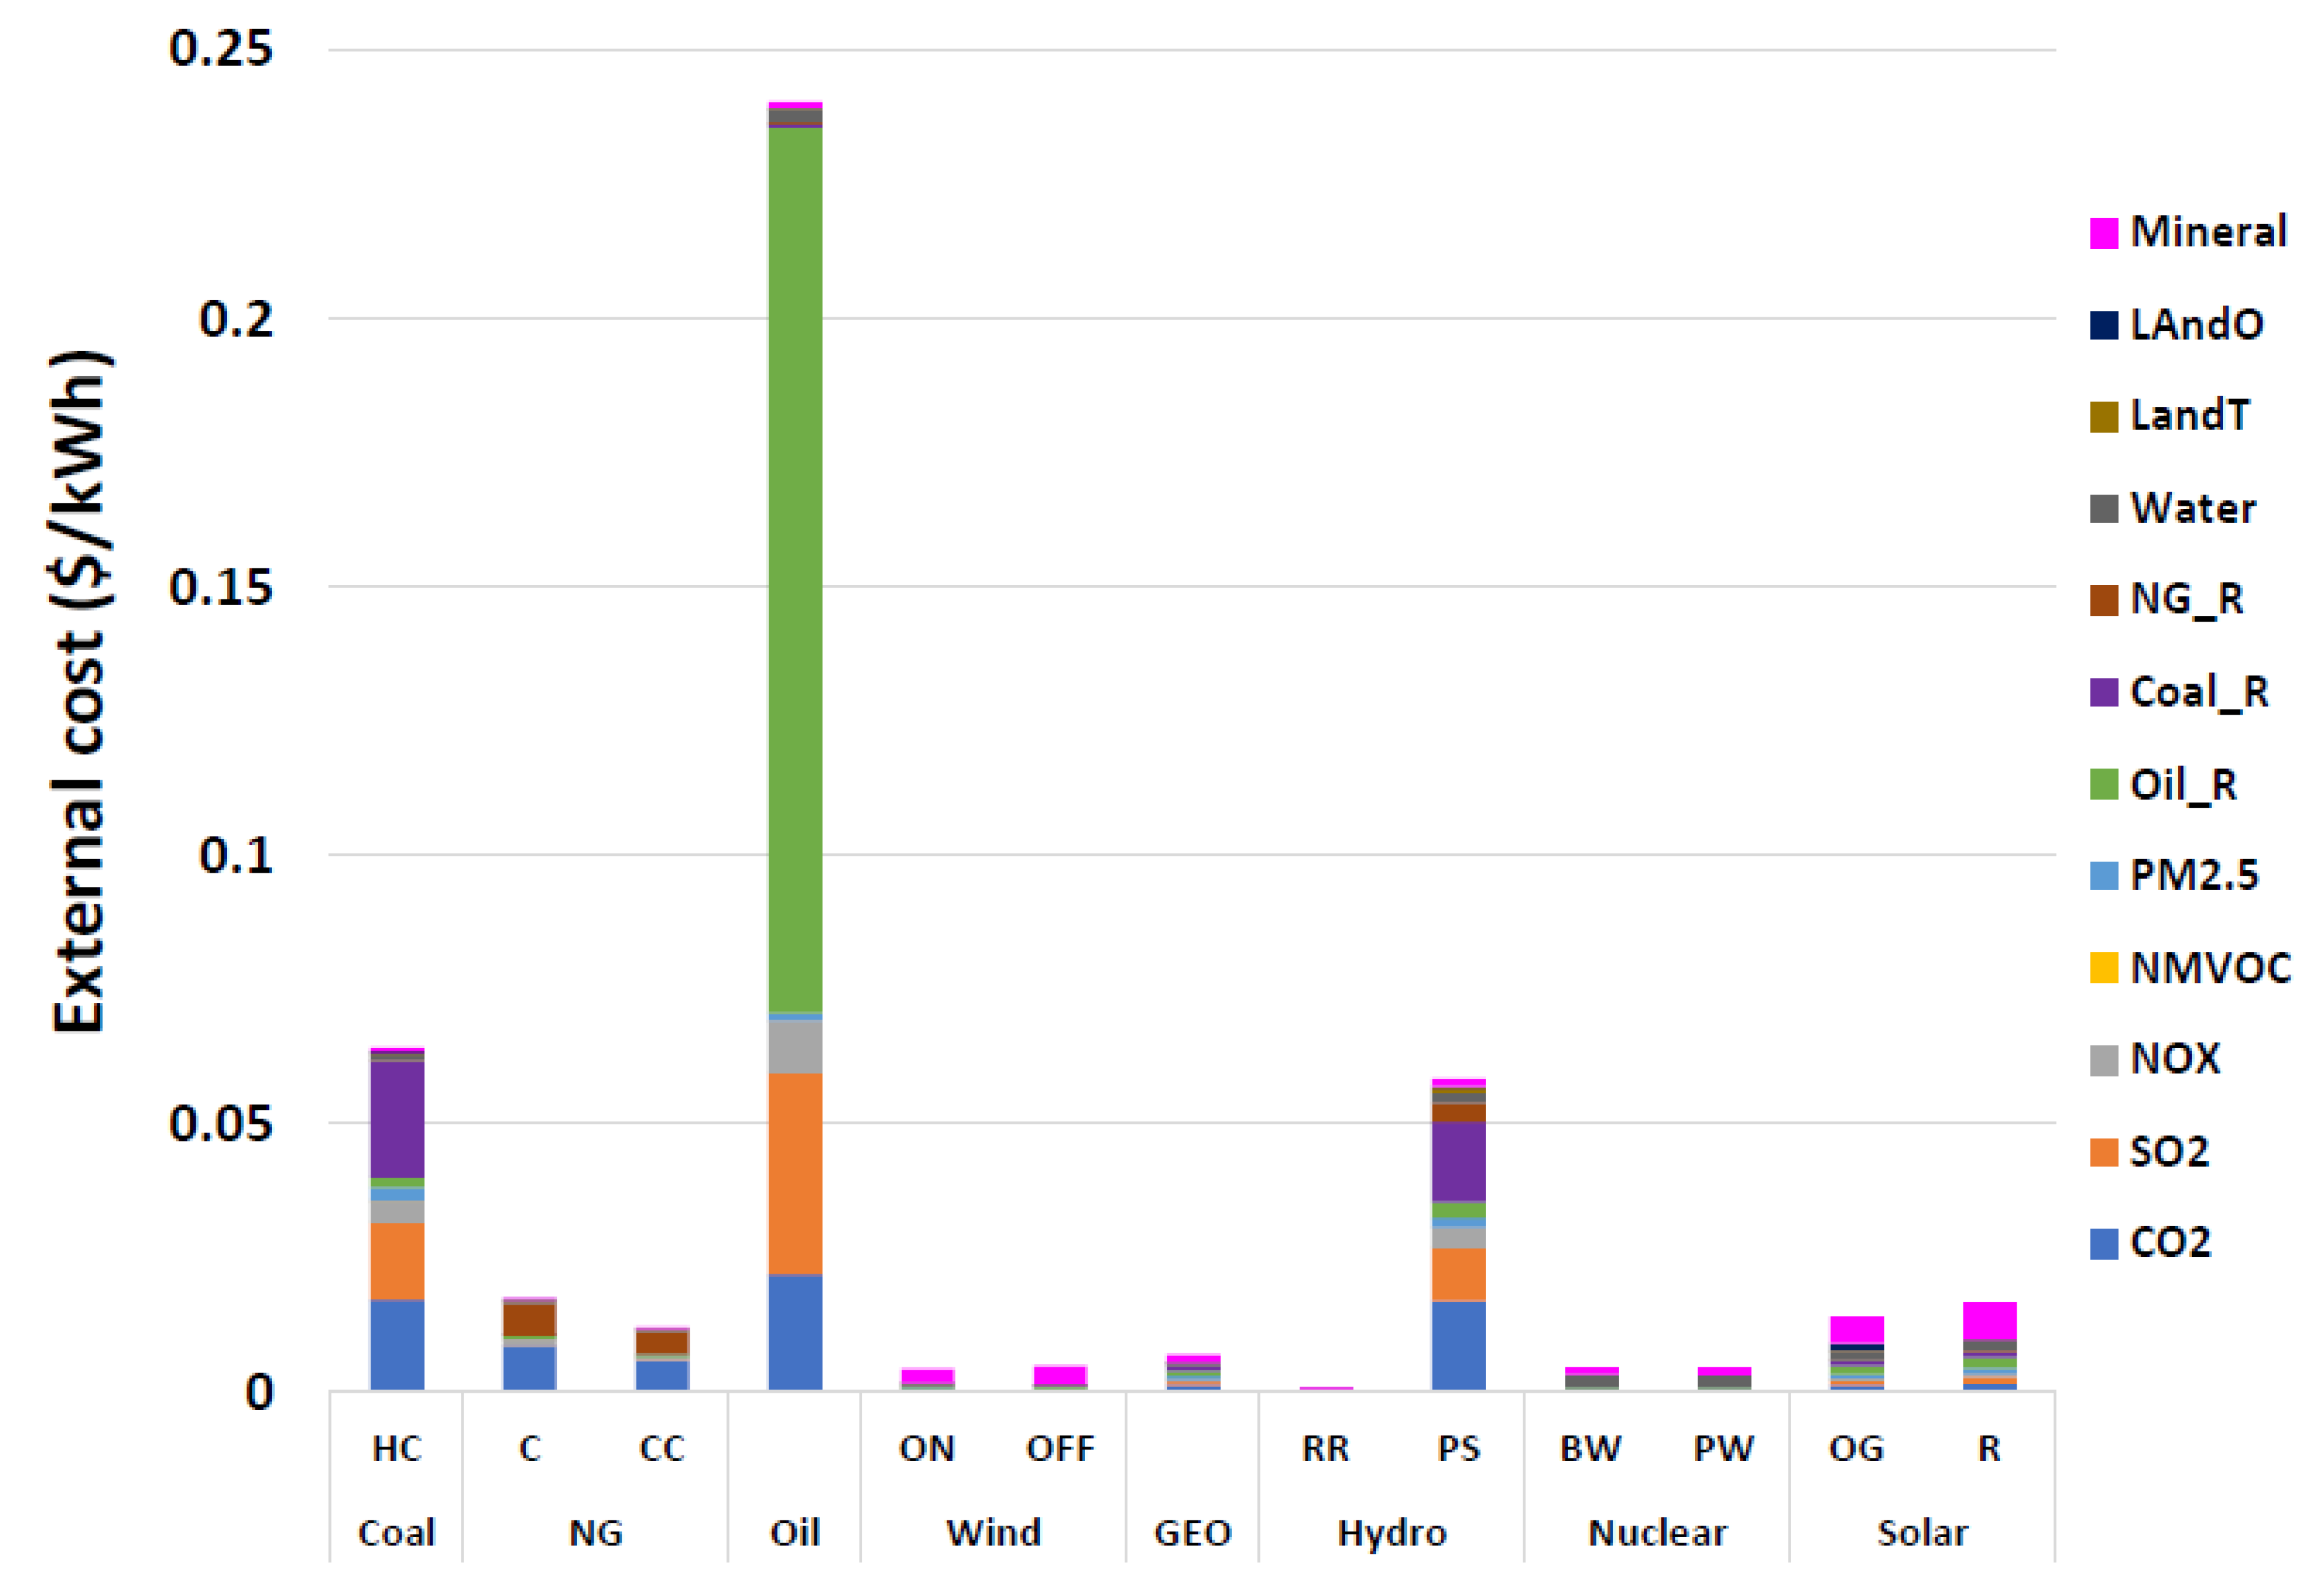
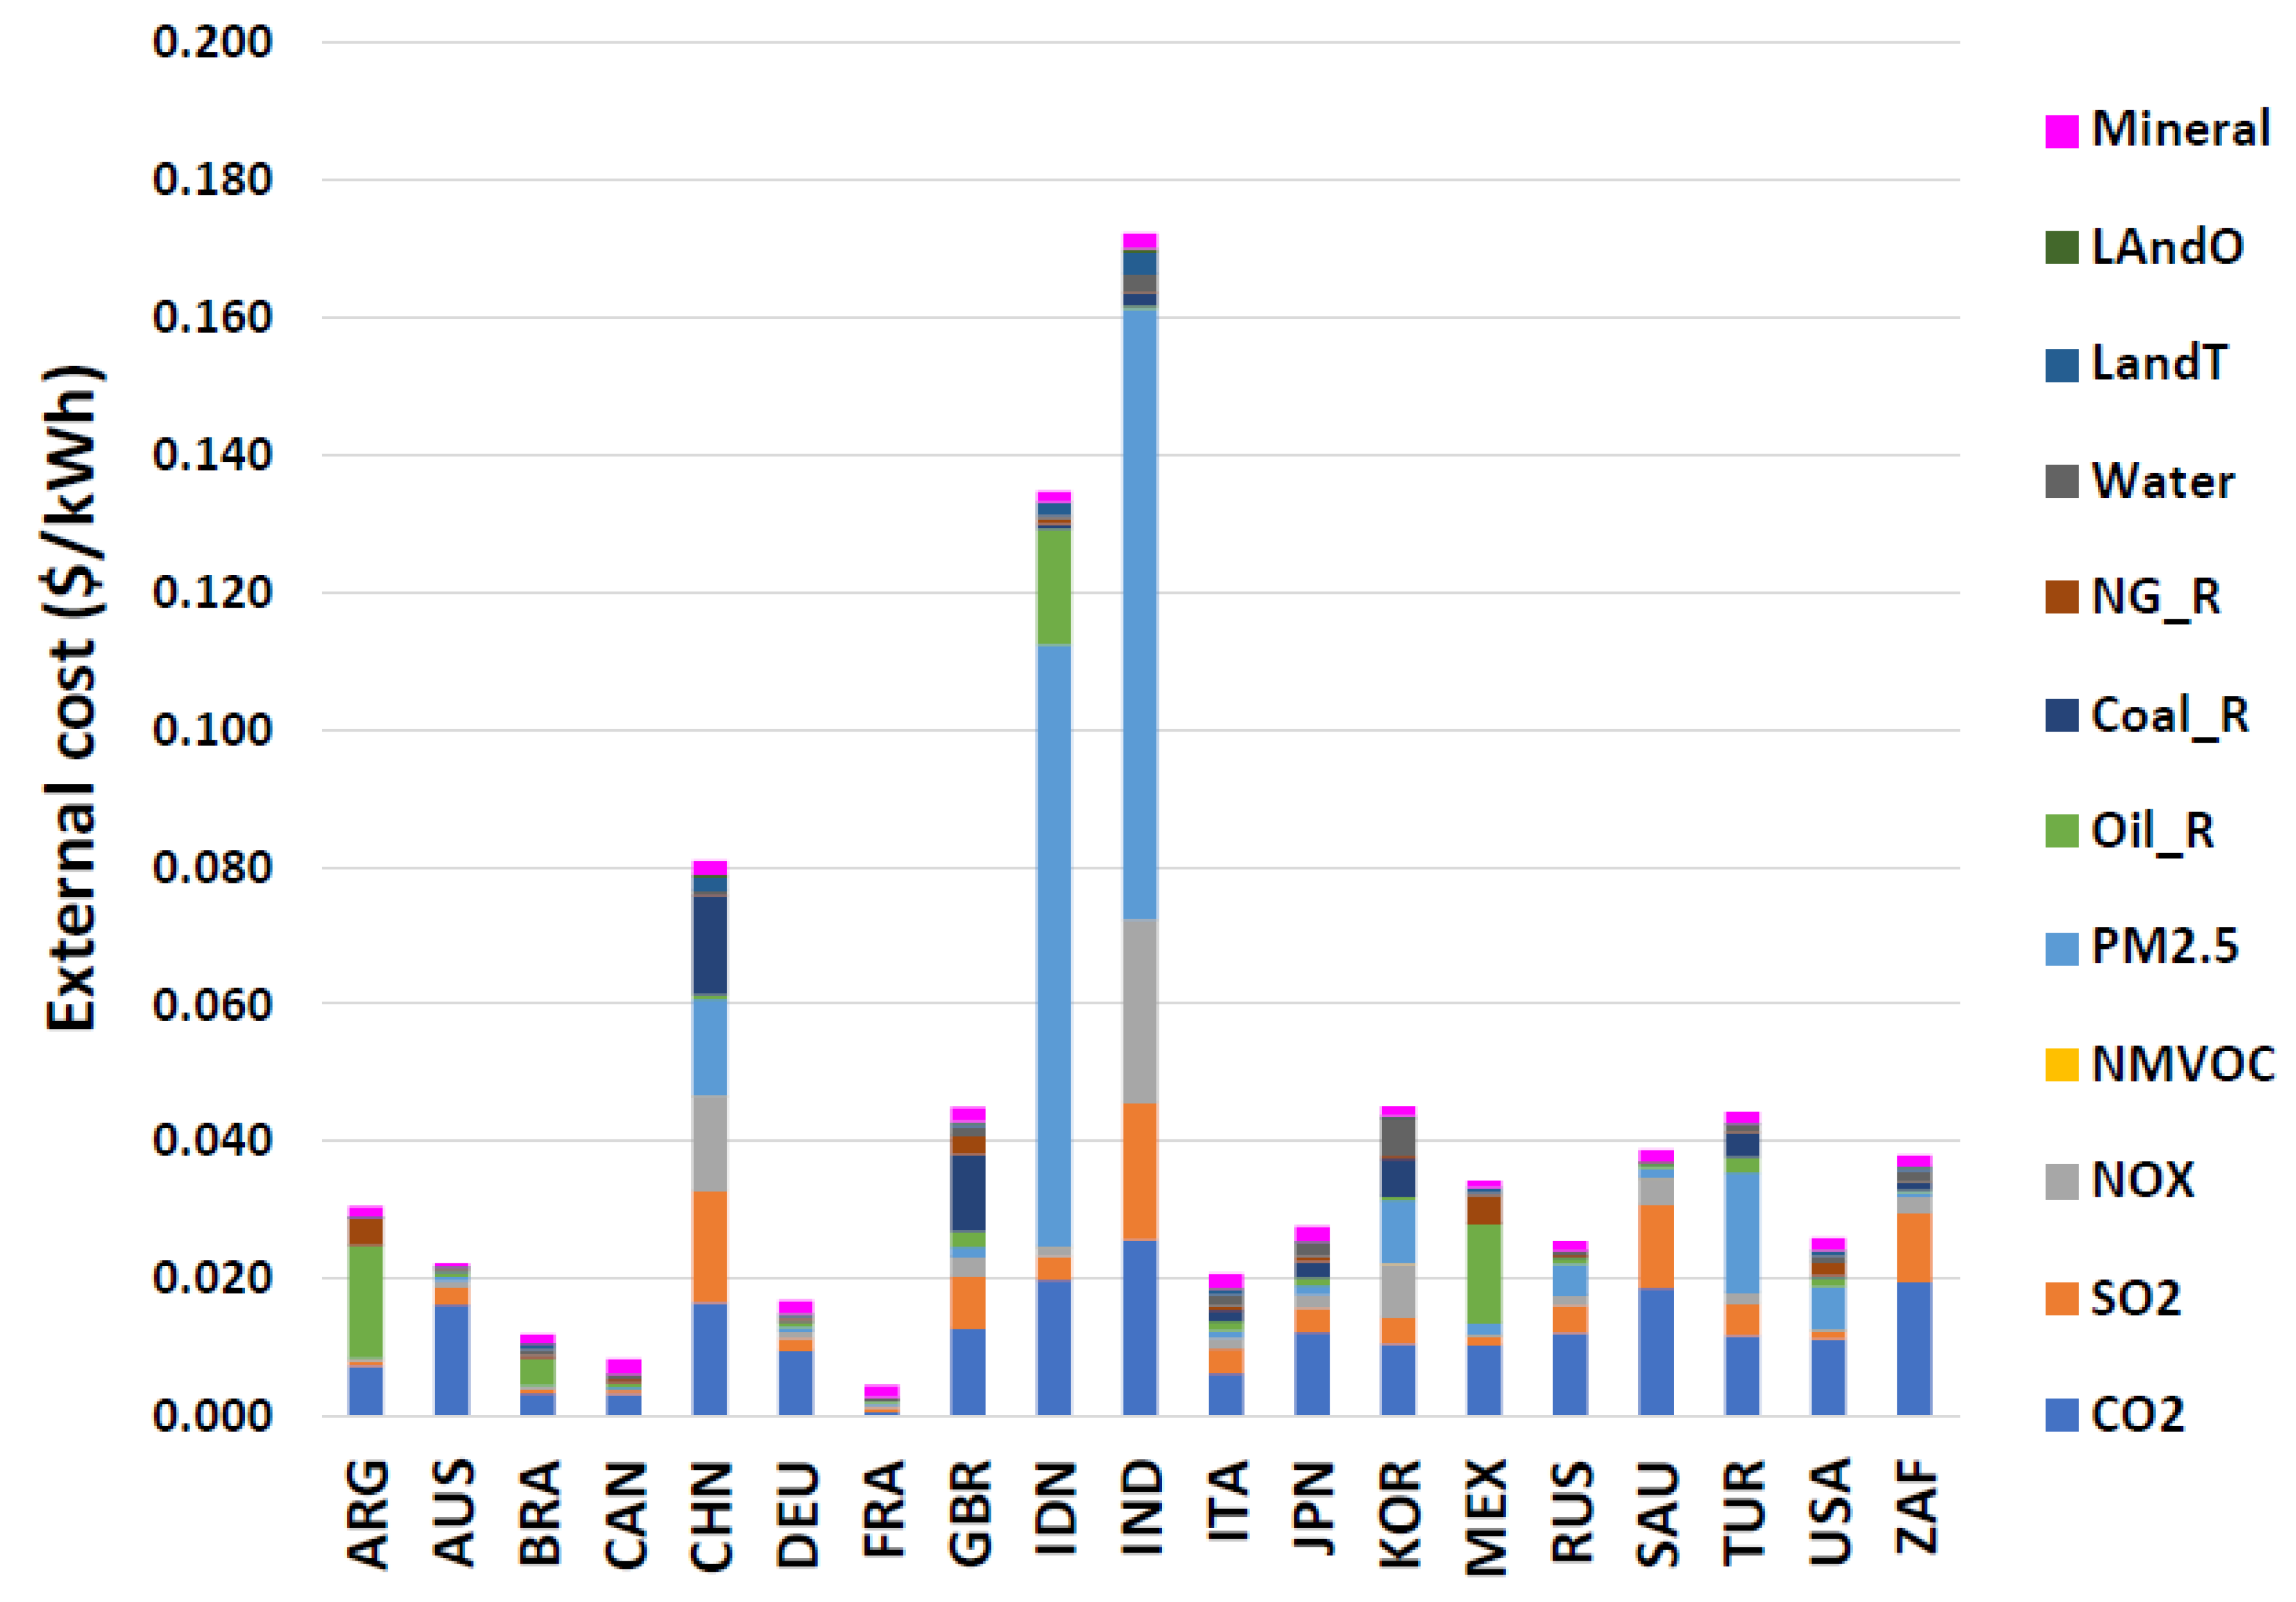
3.1. External Cost Estimation of Each Technology in G20 Countries
3.2. External Cost Estimation of Each Technology in G20 Countries
3.2.1. Argentina
3.2.2. Australia
3.2.3. Brazil
3.2.4. Canada
3.2.5. China
3.2.6. France
3.2.7. Germany
3.2.8. India
3.2.9. Indonesia
3.2.10. Italy
3.2.11. Japan
3.2.12. Mexico
3.2.13. Russia
3.2.14. Saudi Arabia
3.2.15. South Africa
3.2.16. South Korea
3.2.17. Turkey
3.2.18. UK
3.2.19. USA
4. Discussion
4.1. Estimation of the Annual GDP Loss
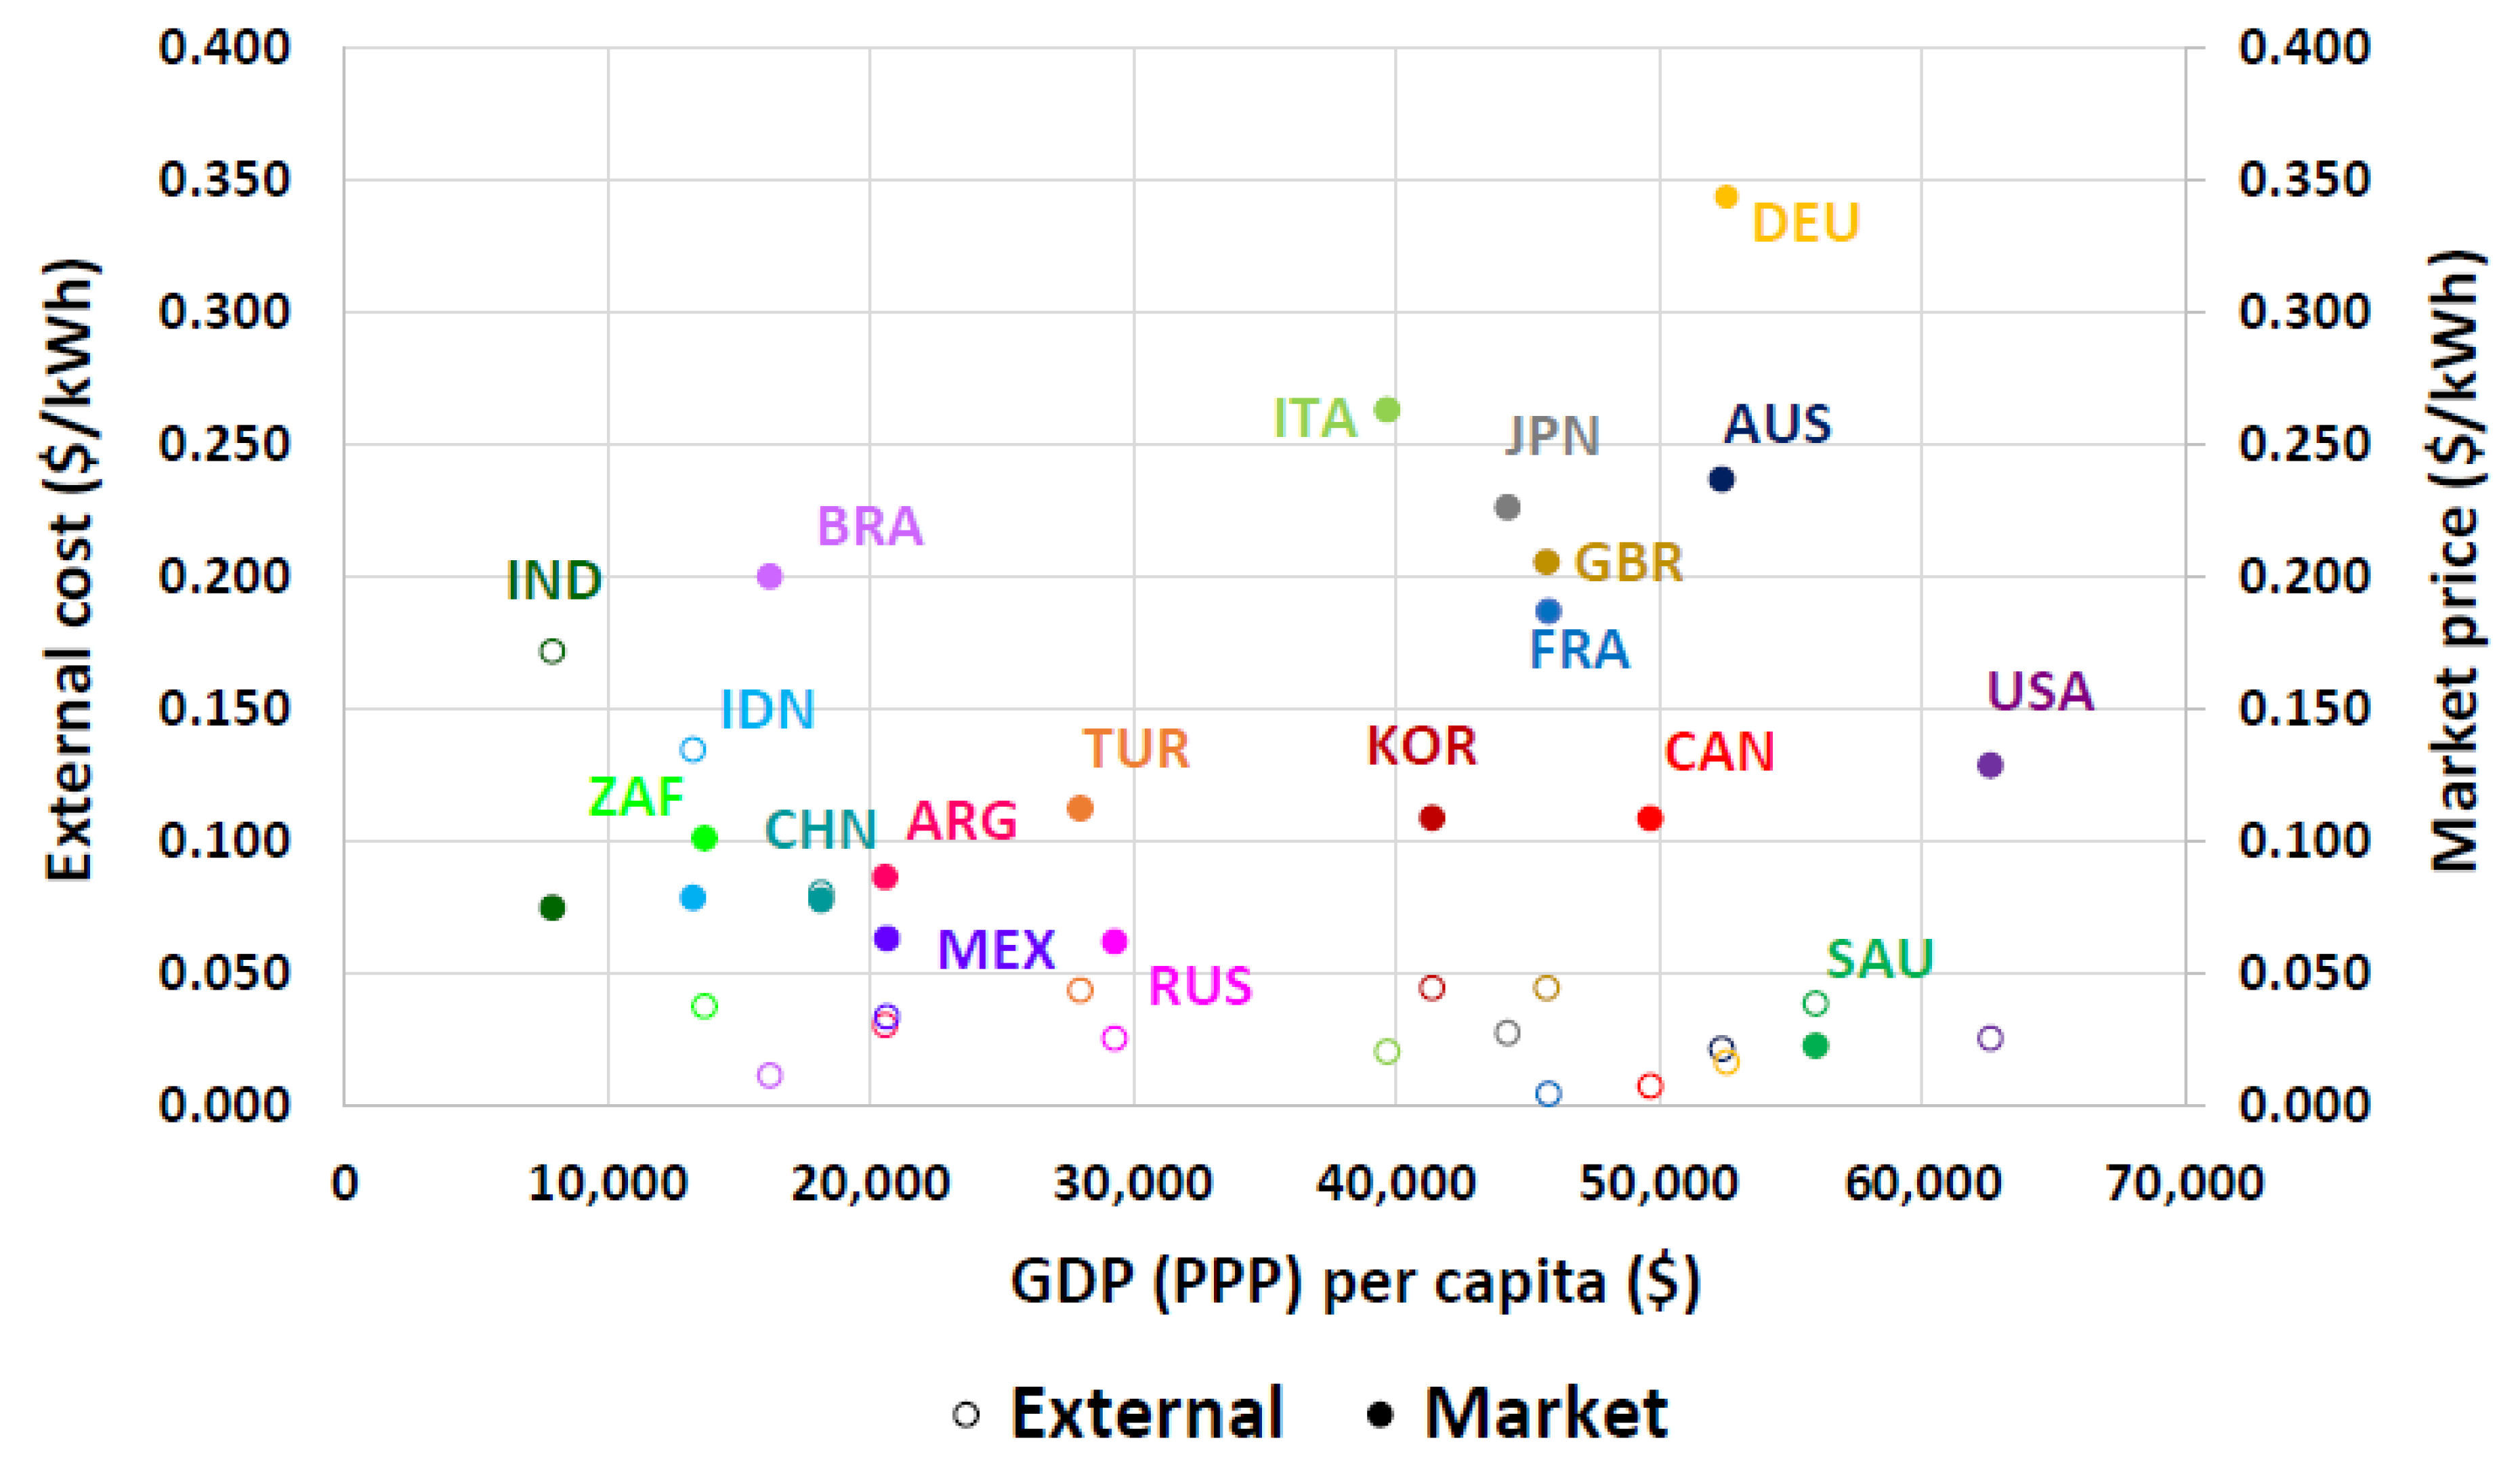
4.2. Comparison of Electricity External Price with Market Price
4.3. Comparison with Previous Studies
5. Conclusions
Author Contributions
Funding
Conflicts of Interest
Appendix A
| ARG | Argentina |
| AUS | Australia |
| BRA | Brazil |
| Bio-CCS | Biomass with carbon capture and storage |
| CAN | Canada |
| CCS | Carbon capture and storage |
| CHN | China |
| Coal_R | Coal Resource |
| DALY | Disability-adjusted life year |
| DEU | Germany |
| DF | Damage factor |
| EC | External cost |
| EEA | European Environment Agency |
| EINES | Expected increase in number of extinction species |
| EV | Economic-value conversion factor |
| EU | European Union |
| FRA | France |
| GBR | United Kingdom |
| GDP | Gross Domestic Production |
| IDN | Indonesia |
| IEA | International Energy Agency |
| IND | India |
| IF | Integration Factor |
| ISO | International Organization for Standardization |
| ITA | Italy |
| JPN | Japan |
| KOR | Korea |
| LandT | Land Transformation |
| LandO | Land Occupation |
| LCA | Life-cycle assessment |
| LCI | Life-cycle inventory |
| LCIA | Life-cycle impact assessment |
| LIME | Life-cycle impact-assessment method based on endpoint modeling |
| MEX | Mexico |
| NG | Natural Gas |
| NG_R | Natural Gas Resource |
| Oil_R | Oil Resource |
| PPP | Purchasing Power Parity |
| SAU | Saudi Arabia |
| SD | Standard Deviation |
| TUR | Turkey |
| USA | United States |
| WTP | Willingness to pay |
| ZAF | South Africa |
| $ | US dollars |

| Coal |
|
| Natural gas |
|
| Oil |
|
| Wind |
|
| Solar |
|
| Biomass |
|
| Geothermal |
|
| Hydro |
|
| Energy Source | CO2-eq (kg/MWh) | NOx (kg/MWh) | SO2 (kg/MWh) |
|---|---|---|---|
| Hard coal | 660–1050 | 0.3–3.9 | 0.3–6.7 |
| Lignite | 800–1300 | 0.2–1.7 | 0.6–7 |
| Natural gas | 380–1000 | 0.2–3.8 | 0.01–0.32 |
| Oil | 530–900 | 0.5–1.5 | 0.85–8 |
| Nuclear power | 3–35 | 0.01–0.04 | 0.003–0.038 |
| Biomass | 8.5–130 | 0.08–1.7 | 0.03–0.94 |
| Hydropower | 2–20 | 0.004–0.06 | 0.001–0.003 |
| Solar energy | 13–190 | 0.15–0.40 | 0.12–0.29 |
| Wind | 3–41 | 0.02–0.11 | 0.02–0.09 |
| Impact Category | Human Health DALY | Social Asset US$ | Biodiversity EINES | Primary Production NPP | Important Parameters | G20 IF Low | G20 IF High |
|---|---|---|---|---|---|---|---|
| Climate Change | Malnutrition, diarrhea, cardiovascular disease, malaria, coastal flooding, and inland flooding | - | Terrestrial ecosystem (vascular plants) | - | Diseases Relative Risk against temperature, Average mortality per disease, Future population, Current and Future species distribution, Ratio of Area decrease | Same for all countries | |
| Air pollution | Chronic death, acute death, respiratory diseases | - | - | - | Total population, Population density, Age distribution, Pollutant dispersion | ARG BRA MEX | IND |
| Photochemical Oxidant | Chronic death, acute death, respiratory diseases | - | - | - | Total population, Population density, Age distribution, Pollutant dispersion | CAN USA | IND |
| Water | Waterborne infectious diseases, nutritional deficiency | - | - | - | Water scarcity, Economic adaptation capacity, International trade | ARG | KOR |
| Land Use | - | - | Terrestrial ecosystem (vascular plants) | Terrestrial ecosystem | National population of threatened species, Species distribution | CAN | IDN |
| Mineral resources | - | User cost | Terrestrial ecosystem (vascular plants) | Terrestrial ecosystem | Reserve to extraction ratio, International trade | BRA | GBR |
| Fossil resources | - | User cost | Terrestrial ecosystem (vascular plants) | Terrestrial ecosystem | Reserve to extraction ratio, International trade | SAU | GBR |
| ARG | AUS | BRA | CAN | CHN | DEU | FRA | GBR | IDN | IND | ITA | JPN | KOR | MEX | RUS | SAU | TUR | USA | ZAF | |
|---|---|---|---|---|---|---|---|---|---|---|---|---|---|---|---|---|---|---|---|
| CO2 ($/kg) | 1.71 × 10⁻² | 1.71 × 10⁻² | 1.71 × 10⁻² | 1.71 × 10⁻² | 1.71 × 10⁻² | 1.71 × 10⁻² | 1.71 × 10⁻² | 1.71 × 10⁻² | 1.71 × 10⁻² | 1.71 × 10⁻² | 1.71 × 10⁻² | 1.71 × 10⁻² | 1.71 × 10⁻² | 1.71 × 10⁻² | 1.71 × 10⁻² | 1.71 × 10⁻² | 1.71 × 10⁻² | 1.71 × 10⁻² | 1.71 × 10⁻² |
| SO2 ($/kg) | 6.18 × 10⁻¹ | 1.02 | 6.18 × 10⁻¹ | 7.87 × 10⁻¹ | 4.33 | 2.84 | 2.84 | 2.84 | 1.02 | 5.11 | 2.84 | 1.58 | 4.33 | 6.18 × 10⁻¹ | 1.85 | 2.52 | 1.85 | 7.87 × 10⁻¹ | 1.240 |
| NOX ($/kg) | 3.01 × 10⁻¹ | 4.47 × 10⁻¹ | 3.01 × 10⁻¹ | 4.02 × 10⁻¹ | 4.96 | 2.11 | 2.11 | 2.11 | 4.47 × 10⁻¹ | 8.66 | 2.11 | 1.37 | 4.96 | 3.01 × 10⁻¹ | 1.16 | 1.31 | 1.16 | 4.02 × 10⁻¹ | 5.23 × 10⁻¹ |
| NMVOC ($/kg) | 5.57 × 10⁻³ | 9.41 × 10⁻³ | 5.57 × 10⁻³ | 4.63 × 10⁻² | 1.28 × 10⁻¹ | 8.11 × 10⁻² | 8.11 × 10⁻² | 8.11 × 10⁻² | 9.41 × 10⁻³ | 6.69 × 10⁻² | 8.11 × 10⁻² | 4.25 × 10⁻² | 1.28 × 10⁻¹ | 5.57 × 10⁻³ | 4.10 × 10⁻² | 3.15 × 10⁻² | 4.10 × 10⁻² | 4.63 × 10⁻² | 1.12 × 10⁻² |
| PM2.5 ($/kg) | 1.80 | 4.14 | 1.80 | 3.22 | 2.51 × 101 | 1.02 × 101 | 1.02 × 101 | 1.02 × 101 | 4.14 | 3.64 × 101 | 1.02 × 101 | 1.20 × 101 | 2.51 × 101 | 1.80 | 4.21 | 9.15 | 4.21 | 3.22 | 4.05 |
| Oil_R ($/kg) | 3.63 × 10⁻¹ | 1.57 × 10⁻¹ | 1.76 × 10⁻¹ | 1.32 × 10⁻¹ | 2.17 × 10⁻¹ | 2.12 × 10⁻¹ | 1.43 × 10⁻¹ | 4.08 × 10⁻¹ | 2.58 × 10⁻¹ | 5.50 × 10⁻² | 1.03 × 10⁻¹ | 3.23 × 10⁻² | 3.72 × 10⁻² | 3.62 × 10⁻¹ | 1.68 × 10⁻¹ | 2.49 × 10⁻³ | 3.52 × 10⁻¹ | 2.21 × 10⁻¹ | 4.84 × 10⁻² |
| Coal_R ($/kg) | 2.12 × 10⁻³ | 1.35 × 10⁻³ | 1.98 × 10⁻³ | 3.98 × 10⁻³ | 2.92 × 10⁻² | 1.04 × 10⁻³ | 1.76 × 10⁻³ | 3.92 × 10⁻² | 6.84 × 10⁻² | 2.03 × 10⁻³ | 1.77 × 10⁻² | 1.30 × 10⁻² | 2.42 × 10⁻² | 1.75 × 10⁻³ | 6.12 × 10⁻⁴ | 2.12 × 10⁻² | 3.41 × 10⁻² | 1.82 × 10⁻³ | 1.78 × 10⁻³ |
| NG_R ($/kg) | 4.13 × 10⁻² | 4.68 × 10⁻³ | 1.75 × 10⁻² | 3.56 × 10⁻² | 1.28 × 10⁻² | 1.80 × 10⁻² | 3.68 × 10⁻³ | 3.18 × 10⁻² | 1.02 × 10⁻² | 1.28 × 10⁻² | 1.13 × 10⁻² | 7.65 × 10⁻³ | 7.61 × 10⁻³ | 3.70 × 10⁻² | 1.98 × 10⁻³ | 5.99 × 10⁻⁴ | 1.60 × 10⁻³ | 3.40 × 10⁻² | 8.76 × 10⁻³ |
| Water ($/m3) | 1.60 × 10⁻⁴ | 5.83 × 10⁻² | 2.95 × 10⁻² | 2.75 × 10⁻² | 3.04 × 10⁻¹ | 1.15 × 10⁻¹ | 9.98 × 10⁻² | 7.03 × 10⁻¹ | 1.02 × 10⁻¹ | 5.69 × 10⁻¹ | 1.90 × 10⁻¹ | 9.34 × 10⁻¹ | 1.40 | 2.43 × 10⁻¹ | 3.68 × 10⁻² | 8.35 × 10⁻⁴ | 2.69 × 10⁻¹ | 3.32 × 10⁻¹ | 4.01 × 10⁻¹ |
| Ag ($/kg) | 5.64 × 10² | 2.01 × 10² | 6.40 × 10² | 8.88 × 10² | 7.62 × 10² | 5.04 × 10² | 6.65 × 10² | 6.65 × 10² | 6.47 × 10² | 5.64 × 10² | 6.65 × 10² | 1.19 × 10² | 5.56 × 10² | 9.46 × 10² | 5.10 × 10² | 5.64 × 10² | 5.64 × 10² | 5.95 × 10² | 5.95 × 10² |
| Al ($/kg) | 3.44 × 10⁻¹ | 1.02 × 10⁻¹ | 2.28 × 10⁻² | 2.43 × 10⁻² | 1.07 | 4.97 × 10⁻² | 1.22 × 10⁻¹ | 1.14 | 2.45 × 10⁻¹ | 3.74 × 10⁻¹ | 1.44 | 2.25 × 10⁻¹ | 2.29 × 10⁻¹ | 6.37 × 10⁻¹ | 1.03 | 4.65 × 10⁻¹ | 1.67 | 3.37 × 10⁻² | 5.49 × 10⁻¹ |
| Au ($/kg) | 4.13 × 10⁴ | 2.13 × 10⁴ | 1.51 × 10⁴ | 6.43 × 10⁴ | 7.84 × 10⁴ | 2.13 × 10⁴ | 3.91 × 10⁴ | 3.97 × 10⁴ | 3.50 × 10⁴ | 4.01 × 10⁴ | 3.91 × 10⁴ | 4.11 × 10⁴ | 6.32 × 10⁴ | 2.79 × 10⁴ | 2.95 × 10⁴ | 4.37 × 10⁴ | 3.95 × 10⁴ | 5.31 × 10⁴ | 2.43 × 10⁴ |
| Ce ($/kg) | 2.44 × 10⁻³ | 2.43 × 10⁻³ | 3.24 × 10⁻³ | 2.42 × 10⁻³ | 2.40 × 10⁻³ | 2.42 × 10⁻³ | 2.41 × 10⁻³ | 2.43 × 10⁻³ | 2.43 × 10⁻³ | 2.96 × 10⁻³ | 2.42 × 10⁻³ | 2.42 × 10⁻³ | 2.41 × 10⁻³ | 2.42 × 10⁻³ | 2.41 × 10⁻³ | 2.43 × 10⁻³ | 2.41 × 10⁻³ | 2.43 × 10⁻³ | 2.43 × 10⁻³ |
| Co ($/kg) | 1.01 × 101 | 1.05 × 10⁻² | 3.03 | 1.94 × 101 | 4.89 | 2.62 × 101 | 2.76 × 10⁻² | 1.01 × 101 | 6.34 | 2.20 × 10⁻¹ | 1.01 × 101 | 1.66 × 101 | 1.01 × 101 | 1.01 × 101 | 1.57 × 101 | 1.01 × 101 | 1.01 × 101 | 6.18 × 101 | 4.91 |
| Cr ($/kg) | 9.93 | 9.94 | 9.95 | 1.0 × 101 | 1.02 × 101 | 1.01 × 101 | 1.0 × 101 | 9.96 | 9.94 | 1.39 × 101 | 9.97 | 1.22 × 101 | 10− × 101 | 9.97 | 5.48 | 9.42 | 9.93 | 9.93 | 9.93 |
| Cu ($/kg) | 3.13 | 1.99 × 10⁻¹ | 4.48 | 8.26 | 3.39 | 3.12 | 3.22 | 6.74 | 4.28 | 3.20 | 3.19 | 3.84 | 3.22 | 5.85 × 10⁻¹ | 2.46 | 3.62 | 3.32 | 4.40 | 3.97 |
| Eu ($/kg) | 1.30 × 10⁻¹ | 1.29 × 10⁻¹ | 1.24 × 10⁻¹ | 1.48 × 10⁻¹ | 1.23 × 10⁻¹ | 1.29 × 10⁻¹ | 1.26 × 10⁻¹ | 1.30 × 10⁻¹ | 1.30 × 10⁻¹ | 1.53 × 10⁻¹ | 1.27 × 10⁻¹ | 1.26 × 10⁻¹ | 1.25 × 10⁻¹ | 1.28 × 10⁻¹ | 1.24 × 10⁻¹ | 9.87 × 10⁻² | 1.25 × 10⁻¹ | 1.27 × 10⁻¹ | 1.30 × 10⁻¹ |
| Fe ($/kg) | 2.73 × 10⁻³ | 8.87 × 10⁻³ | 2.73 × 10⁻³ | 7.50 × 10⁻⁴ | 8.69 × 10⁻² | 5.71 × 10⁻³ | 3.24 × 10⁻³ | 1.57 × 10⁻² | 1.81 × 10⁻³ | 4.74 × 10⁻² | 8.27 × 10⁻³ | 1.32 × 10⁻² | 1.10 × 10⁻² | 1.10 × 10⁻² | 2.88 × 10⁻⁴ | 5.28 × 10⁻² | 3.50 × 10⁻³ | 1.15 × 10⁻³ | 8.21 × 10⁻² |
| Gd ($/kg) | 4.56 × 10⁻¹ | 4.54 × 10⁻¹ | 4.42 × 10⁻¹ | 5.26 × 10⁻¹ | 4.41 × 10⁻¹ | 4.52 × 10⁻¹ | 4.46 × 10⁻¹ | 4.55 × 10⁻¹ | 4.54 × 10⁻¹ | 4.55 × 10⁻¹ | 4.49 × 10⁻¹ | 4.47 × 10⁻¹ | 4.45 × 10⁻¹ | 4.50 × 10⁻¹ | 4.43 × 10⁻¹ | 3.43 × 10⁻¹ | 4.44 × 10⁻¹ | 4.49 × 10⁻¹ | 4.55 × 10⁻¹ |
| La ($/kg) | 9.02 × 10⁻² | 8.96 × 10⁻² | 1.16 × 10⁻¹ | 8.93 × 10⁻² | 8.89 × 10⁻² | 8.95 × 10⁻² | 8.92 × 10⁻² | 8.97 × 10⁻² | 8.96 × 10⁻² | 1.08 × 10⁻¹ | 8.93 × 10⁻² | 8.93 × 10⁻² | 8.92 × 10⁻² | 8.94 × 10⁻² | 8.90 × 10⁻² | 8.98 × 10⁻² | 8.91 × 10⁻² | 8.97 × 10⁻² | 8.97 × 10⁻² |
| Li ($/kg) | 3.44 × 10⁻⁴ | 1.15 | 3.80 × 10⁻¹ | 2.24 × 10⁻¹⁴ | 1.03 × 10⁻¹ | 6.74 × 10⁻¹ | 5.16 × 10⁻¹ | 5.20 × 10⁻¹ | 6.10 × 10⁻¹ | 1.62 × 10⁻¹ | 2.43 × 10⁻¹ | 4.25 × 10⁻¹ | 6.10 × 10⁻¹ | 1.19 × 10⁻² | 1.50 × 10⁻¹ | 6.10 × 10⁻¹ | 6.10 × 10⁻¹ | 7.64 × 10⁻¹ | 1.32 × 10⁻¹ |
| Mn ($/kg) | 3.78 × 10⁻² | 8.86 × 10⁻¹ | 1.08 × 10⁻² | 6.55 × 10⁻¹ | 1.62 | 3.87 × 10⁻¹ | 1.07 × 10⁻¹ | 3.87 × 10⁻¹ | 9.43 × 10⁻¹ | 5.11 × 10⁻¹ | 4.03 × 10⁻¹ | 5.12 × 10⁻¹ | 7.07 × 10⁻¹ | 2.11 | 3.52 × 10⁻¹ | 4.93 × 10⁻¹ | 4.34 × 10⁻¹ | 5.48 × 10⁻¹ | 3.47 × 10⁻¹ |
| Mo ($/kg) | 5.22 | 5.22 | 7.04 | 8.54 | 4.45 | 5.99 | 6.38 | 4.43 | 5.22 | 6.38 | 5.22 | 8.75 | 5.86 | 3.88 | 3.22 | 5.22 | 5.22 | 6.73 | 7.91 |
| Nd ($/kg) | 1.05 × 10⁻¹ | 1.05 × 10⁻¹ | 1.37 × 10⁻¹ | 1.04 × 10⁻¹ | 1.04 × 10⁻¹ | 1.05 × 10⁻¹ | 1.04 × 10⁻¹ | 1.05 × 10⁻¹ | 1.05 × 10⁻¹ | 1.27 × 10⁻¹ | 1.04 × 10⁻¹ | 1.04 × 10⁻¹ | 1.04 × 10⁻¹ | 1.05 × 10⁻¹ | 1.04 × 10⁻¹ | 1.05 × 10⁻¹ | 1.04 × 10⁻¹ | 1.05 × 10⁻¹ | 1.05 × 10⁻¹ |
| Ni ($/kg) | 1.43 × 101 | 5.80 × 10⁻² | 8.67 × 10⁻² | 1.40 × 101 | 2.13 × 101 | 1.43 × 101 | 1.33 | 1.43 × 101 | 1.43 × 101 | 1.43 × 101 | 1.43 × 101 | 2.15 × 101 | 1.33 | 1.43 × 101 | 1.78 × 101 | 1.43 × 101 | 1.43 × 101 | 1.43 × 101 | 3.16 × 10⁻¹ |
| Pb ($/kg) | 3.09 | 7.33 × 10⁻¹ | 2.75 | 3.21 | 3.35 | 2.97 | 2.75 | 3.09 | 2.94 | 1.89 | 2.75 | 1.55 | 1.46 | 1.09 | 3.09 | 2.75 | 3.09 | 2.53 | 4.34 |
| Pd ($/kg) | 2.66 × 10⁴ | 2.66 × 10⁴ | 4.46 × 10³ | 2.47 × 10⁴ | 1.23 × 10⁴ | 6.90 × 10³ | 6.07 × 10³ | 1.87 × 10⁴ | 2.66 × 10⁴ | 2.66 × 10⁴ | 1.63 × 10⁴ | 1.48 × 10⁴ | 1.24 × 10⁴ | 2.66 × 10⁴ | 2.66 × 10⁴ | 2.66 × 10⁴ | 2.66 × 10⁴ | 1.42 × 10⁴ | 2.66 × 10⁴ |
| Pr ($/kg) | 3.00 × 10⁻¹ | 2.98 × 10⁻¹ | 3.89 × 10⁻¹ | 2.97 × 10⁻¹ | 2.95 × 10⁻¹ | 2.97 × 10⁻¹ | 2.96 × 10⁻¹ | 2.98 × 10⁻¹ | 2.98 × 10⁻¹ | 3.60 × 10⁻¹ | 2.97 × 10⁻¹ | 2.97 × 10⁻¹ | 2.96 × 10⁻¹ | 2.97 × 10⁻¹ | 2.96 × 10⁻¹ | 2.98 × 10⁻¹ | 2.96 × 10⁻¹ | 2.98 × 10⁻¹ | 2.98 × 10⁻¹ |
| Pt ($/kg) | 2.88 × 10⁴ | 3.88 × 10⁴ | 2.25 × 10³ | 2.37 × 10⁴ | 2.37 × 10³ | 1.21 × 10⁴ | 3.46 × 10³ | 5.62 × 10⁴ | 2.88 × 10⁴ | 2.88 × 10⁴ | 1.88 × 10⁴ | 1.52 × 10⁴ | 1.75 × 10⁴ | 2.88 × 10⁴ | 1.19 × 10⁵ | 2.88 × 10⁴ | 2.88 × 10⁴ | 8.72 × 10³ | 2.88 × 10⁴ |
| Re ($/kg) | 8.14 × 10² | 8.14 × 10² | 8.14 × 10² | 2.42 × 10³ | 8.14 × 10² | 8.14 × 10² | 8.14 × 10² | 8.14 × 10² | 8.14 × 10² | 8.14 × 10² | 8.14 × 10² | 8.14 × 10² | 8.14 × 10² | 8.14 × 10² | 3.75 × 10⁻¹ | 8.14 × 10² | 8.14 × 10² | 1.90 × 10² | 8.14 × 10² |
| Sn ($/kg) | 2.01 × 101 | 2.01 × 101 | 6.13 | 1.25 | 2.44 × 101 | 2.01 × 101 | 1.25 | 2.01 × 101 | 2.34 × 101 | 1.25 | 2.01 × 101 | 2.01 × 101 | 2.01 × 101 | 1.25 | 4.08 × 10⁻¹ | 2.01 × 101 | 2.01 × 101 | 2.01 × 101 | 1.25 |
| Sr ($/kg) | 3.96 × 10⁻¹ | 4.48 × 10⁻¹ | 4.48 × 10⁻¹ | 4.48 × 10⁻¹ | 4.24 × 10⁻¹ | 6.00 × 10⁻¹ | 4.69 × 10⁻¹ | 4.79 × 10⁻¹ | 4.48 × 10⁻¹ | 4.48 × 10⁻¹ | 4.86 × 10⁻¹ | 5.49 × 10⁻¹ | 5.58 × 10⁻¹ | 6.53 × 10⁻¹ | 4.48 × 10⁻¹ | 4.48 × 10⁻¹ | 4.48 × 10⁻¹ | 6.28 × 10⁻¹ | 4.48 × 10⁻¹ |
| Ta ($/kg) | 1.07 × 101 | 1.80 × 10⁻¹ | 4.30 × 10⁻¹ | 1.62 × 10⁻¹ | 7.68 × 10⁻¹ | 1.07 × 101 | 3.49 × 10⁻¹ | 2.26 × 10⁻¹ | 3.49 × 10⁻¹ | 3.49 × 10⁻¹ | 3.49 × 10⁻¹ | 1.80 × 10⁻¹ | 3.49 × 10⁻¹ | 3.49 × 10⁻¹ | 3.49 × 10⁻¹ | 1.07 × 101 | 1.07 × 101 | 9.06 | 1.56 × 101 |
| U ($/kg) | 4.46 × 101 | 1.94 × 10⁻¹ | 1.57 × 10⁻¹ | 3.02 × 101 | 2.18 × 101 | 1.27 × 101 | 2.35 × 101 | 2.80 × 101 | 2.82 × 101 | 2.61 | 3.57 | 3.05 × 101 | 3.05 × 101 | 2.80 × 101 | 7.50 × 10⁻¹ | 2.80 × 101 | 2.80 × 101 | 6.88 | 1.56 × 10⁻¹ |
| Zn ($/kg) | 2.29 | 7.77 × 10⁻¹ | 2.74 | 3.46 | 2.97 | 2.72 | 1.50 | 2.29 | 2.29 | 2.65 | 2.31 | 1.54 | 1.53 | 8.81 × 10⁻¹ | 1.25 | 2.29 | 2.29 | 2.59 | 2.29 |
| Zr ($/kg) | 1.19 × 10⁻¹ | 8.73 × 10⁻² | 5.13 × 10⁻¹ | 1.19 × 10⁻¹ | 1.61 × 10⁻¹ | 6.84 × 10⁻² | 5.35 × 10⁻² | 6.21 × 10⁻² | 4.39 × 10⁻¹ | 1.31 × 10⁻¹ | 7.53 × 10⁻² | 8.68 × 10⁻² | 9.75 × 10⁻² | 1.19 × 10⁻¹ | 1.53 × 10⁻¹ | 1.19 × 10⁻¹ | 1.19 × 10⁻¹ | 7.43 × 10⁻² | 3.84 × 10⁻² |
| HC | Lignite | NG C/CC | Oil | Wind ON/OFF | GEO | Hydro RR | Hydro PS | Hydro R | Nuclear BW/PW | Solar OG | Solar Roof | |
|---|---|---|---|---|---|---|---|---|---|---|---|---|
| AUS | 1-CO2 2-SO2 | 1-CO2 2-SO2 | 1-CO2 2-SO2 | 1-Oil_R 2-CO2 3-SO2 | Mineral | - | Various | 1-CO2 2-SO2 | - | - | 1-LandO 2-Mineral | 1-Mineral 2-Oil_R |
| BRA | 1-CO2 2-SO2 | 1-CO2 2-PM2.5 3-SO2 | 1-CO2 2-NG_R | 1-Oil_R 2-CO2 3-SO2 | Mineral | - | - | 1-Water 2-LandT | Mineral | 1-LandO 2-Mineral | 1-Mineral 2-CO2 3-Oil_R | |
| CAN | 1-CO2 2-SO2 | 1-CO2 2-PM2.5 | 1-CO2 2-NG_R | 1-Oil_R 2-CO2 | Mineral | Various | Various | 1-CO2 2-Oil_R | 1-Water 2-Mineral | Mineral | 1-Mineral 2-LandO | Mineral |
| CHN | 1-SO2 2-CO2 3-PM2.5 | - | 1-CO2 2-NG_R | 1-Oil_R 2-SO2 3-NOx | Mineral | 1-PM2.5 2-Mineral | Various | 1-SO2 2-CO2 3-PM2.5 | - | Mineral | 1-Mineral 2-PM2.5 | 1-Mineral 2-PM2.5 |
| DEU | 1-CO2 2-SO2 3-NOx | 1-CO2 2-SO2 3-NOx | 1-CO2 2-NG_R | 1-Oil_R 2-CO2 3-SO2 | Mineral | 1-Mineral 2-CO2 3-PM2.5 | Mineral | 1-CO2 2-SO2 3-Mineral | Water | Mineral | 1-Mineral 2-LandO 3-CO2 | 1-Mineral 2-CO2 3-SO2 |
| FRA | 1-CO2 2-SO2 3-NOx | - | 1-CO2 2-NOx | 1-Oil_R 2-SO2 3-CO2 | Mineral | 1-CO2 2-PM2.5 3-Mineral | Various | 1-Mineral 2-CO2 | Water | Mineral | 1-Mineral 2-LandO 3-CO2 | 1-Mineral 2-CO2 3-SO2 |
| GBR | 1-Coal_R 2-SO2 3-CO2 | - | 1-CO2 2-NG_R | 1-Oil_R 2-SO2 3-CO2 | Mineral | 1-Mineral 2-CO2 | Various | 1-Coal_R 2-CO2 3-SO2 | - | 1-Water 2-Mineral | Mineral | Mineral |
| IDN | - | 1-PM2.5 2-CO2 | CO2 | 1-Oil_R 2-SO2 3-CO2 | Mineral | 1-Coal_R 2-Mineral 3-CO2 | - | - | 1-Land T 2-Mineral | - | - | Mineral |
| IND | 1-PM2.5 2-NOx 3-CO2 | 1-PM2.5 2-NOx 3-CO2 | CO2 | 1-NOx 2-SO2 | Mineral | Various | - | 1-PM2.5 2-NOx 3-CO2 | - | Various | - | 1-Mineral 2-PM2.5 |
| ITA | 1-CO2 2-SO2 3-NOx | - | 1-CO2 2-NOx | 1-Oil_R 2-SO2 3-CO2 | Mineral | 1-CO2 2-PM2.5 3-Mineral | Various | 1-Mineral 2-CO2 | Water | Mineral | 1-Mineral 2-LandO 3-CO2 | 1-Mineral 2-CO2 3-SO2 |
| JPN | 1-CO2 2-SO2 3-NOx | 1-PM2.5 2-CO2 3-SO2 | CO2 | 1-CO2 2-SO2 3-Oil_R | Mineral | 1-Mineral 2-CO2 3-PM2.5 | Various | 1-CO2 2-SO2 3-Coal_R | Water | Water Mineral | - | 1-Mineral 2-Water |
| KOR | 1-CO2 2-NOx 3-CO2 | 1-PM2.5 2-SO2 3-CO2 | CO2 | 1-SO2 2-NOx 3-SO2 | Mineral | - | Various | 1-PM2.5 2-CO2 3-NOx | Water | Water | Water Mineral | Mineral Water |
| MEX | CO2 | 1-CO2 2-PM2.5 | 1-CO2 2-NG_R | 1-Oil_R 2-CO2 | Mineral | - | Various | - | - | Mineral | Mineral | Mineral |
| RUS | 1-CO2 2-SO2 | 1-PM2.5 2-CO2 3-SO2 | CO2 | 1-Oil 2-CO2 3-SO2 | Mineral | Various | Various | 1-CO2 2-PM2.5 3-SO2 | Various | Mineral | - | Mineral |
| SAU | - | - | CO2 | 1-CO2 2-SO2 3-NOx | - | - | - | - | - | - | - | Mineral |
| TUR | 1-Coal_R 2-CO2 | 1-PM2.5 2-CO2 3-SO2 | CO2 | 1-Oil_R 2-SO2 3-CO2 | Mineral | Various | Various | - | Water | - | - | Mineral |
| USA | CO2 | 1-PM2.5 2-CO2 | 1-CO2 2-NG_R | 1-Oil_R 2-CO2 | Mineral | Various | Various | 1-CO2 2-PM2.5 | Water | Mineral | Mineral | Mineral |
| ZAF | 1-CO2 2-SO2 | - | CO2 | 1-CO2 2-Oil 3-SO2 | Mineral | 1-Mineral 2-CO2 | Various | 1-CO2 2-SO2 | Water | Mineral | - | Mineral |
| Argentina | 148 |
| Australia | 259 |
| Brazil | 596 |
| Canada | 663 |
| China | 7092 |
| France | 571 |
| Germany | 647 |
| India | 1643 |
| Indonesia | 268 |
| Italy | 291 |
| Japan | 1102 |
| Mexico | 320 |
| Russia | 1128 |
| Saudi Arabia | 351 |
| South Africa | 256 |
| South Korea | 593 |
| Turkey | 303 |
| UK | 334 |
| USA | 4429 |
References
- BP (British Petroleum). Available online: https://www.bp.com/content/dam/bp/business-sites/en/global/corporate/pdfs/energy-economics/statistical-review/bp-stats-review-2019-full-report.pdf (accessed on 7 November 2019).
- International Energy Agency (IEA). World Energy Balance 2019; IEA Publications: Paris, France, 2019. [Google Scholar]
- IEA (International Energy Agency). Available online: https://www.iea.org/statistics/co2emissions/ (accessed on 8 October 2019).
- Crippa, M.; Guizzardi, D.; Muntean, M.; Schaaf, E.; Dentener, F.; van Aardenne, J.A.; Monni, S.; Doering, U.; Olivier, J.G.J.; Pagliari, V.; et al. Gridded Emissions of Air Pollutants for the period 1970–2012 within EDGAR v4.3.2. Earth Syst. Sci. Data 2018, 10, 1987–2013. [Google Scholar] [CrossRef] [Green Version]
- Enerdata. Available online: https://yearbook.enerdata.net/coal-lignite/coal-world-consumption-data.html (accessed on 8 October 2019).
- IEA (International Energy Agency). Available online: https://www.iea.org/gas2018/ (accessed on 14 May 2019).
- IEA (International Energy Agency). Available online: https://www.iea.org/geco/oil/ (accessed on 14 May 2019).
- Turconi, R.; Boldrin, A.; Astrup, T. Life cycle assessment (LCA) of electricity generation technologies: Overview, comparability and limitations. Renew. Sustain. Energy Rev. 2013, 28, 555–565. [Google Scholar] [CrossRef] [Green Version]
- Cuéllar-Franca, R.M.; Azapagic, A. Carbon capture, storage and utilisation technologies: A critical analysis and comparison of their life cycle environmental impacts. J. CO2 Util. 2015, 9, 82–102. [Google Scholar] [CrossRef]
- EASAC. Available online: https://easac.eu/fileadmin/PDF_s/reports_statements/Negative_Carbon/EASAC_Report_on_Negative_Emission_Technologies.pdf (accessed on 25 February 2019).
- Sher, F.; Iqbal, S.Z.; Liu, H.; Imran, M.; Snape, C.E. Thermal and kinetic analysis of diverse biomass fuels under different reaction environment: A way forward to renewable energy sources. Energy Convers. Manag. 2020, 203, 112266. [Google Scholar] [CrossRef]
- Sher, F.; Kawai, A.; Güleç, F.; Sadiq, H. Sustainable energy saving alternatives in small buildings. Sustain. Energy Technol. Assess. 2019, 32, 92–99. [Google Scholar] [CrossRef]
- Santoyo-Castelazo, E.; Azapagic, A. Sustainability assessment of energy systems: Integrating environmental, economic and social aspects. J. Clean. Prod. 2014, 80, 119–138. [Google Scholar] [CrossRef]
- Zhu, Y.; Jiang, S.; Zhao, Y.; Li, H.; He, G.; Li, L. Life-cycle-based water footprint assessment of coal-fired power generation in China. J. Clean. Prod. 2020, 254, 120098. [Google Scholar] [CrossRef]
- Restrepo, Á.; Bazzo, E.; Miyake, R. A life cycle assessment of the Brazilian coal used for electric power generation. J. Clean. Prod. 2015, 92, 179–186. [Google Scholar] [CrossRef]
- Aguirre-Villegas, H.A.; Benson, C.H. Case history of environmental impacts of an Indonesian coal supply chain. J. Clean. Prod. 2017, 157, 47–56. [Google Scholar] [CrossRef]
- Vieira, M.D.M.; Huijbregts, M.A.J. Comparing mineral and fossil surplus costs of renewable and non-renewable electricity production. Int. J. Life Cycle Assess. 2018, 23, 840–850. [Google Scholar] [CrossRef] [Green Version]
- Rimos, S.; Hoadley, A.F.; Brennan, D.J. Resource depletion impact assessment: Impacts of a natural gas scarcity in Australia. Sustain. Prod. Consum. 2015, 3, 45–58. [Google Scholar] [CrossRef]
- Chary, K.; Aubin, J.; Guindé, L.; Sierra, J.; Blazy, J. Cultivating biomass locally or importing it? LCA of biomass provision scenarios for cleaner electricity production in a small tropical island. Biomass Bioenergy 2018, 110, 1–12. [Google Scholar] [CrossRef] [Green Version]
- Beagle, E.; Belmont, E. Comparative life cycle assessment of biomass utilization for electricity generation in the European Union and the United States. Energy Policy 2019, 128, 267–275. [Google Scholar] [CrossRef]
- U.S Energy Information Administration. Available online: https://www.eia.gov/energyexplained/index.php?page=nuclear_environment (accessed on 7 November 2019).
- Serp, J.; Poinssot, C.; Bourg, S. Assessment of the Anticipated Environmental Footprint of Future Nuclear Energy Systems. Evidence of the Beneficial Effect of Extensive Recycling. Energies 2017, 10, 1445. [Google Scholar] [CrossRef] [Green Version]
- Frischknecht, R.; Braunschweig, A.; Hofstetter, P.; Suter, P. Human health damages due to ionising radiation in life cycle impact assessment. Environ. Impact Assess. Rev. 2000, 20, 159–189. [Google Scholar] [CrossRef]
- Jin, Y.; Behrens, P.; Tukker, A.; Scherer, L. Water use of electricity technologies: A global meta-analysis. Renew. Sustain. Energy Rev. 2019, 115, 109391. [Google Scholar] [CrossRef]
- Lieberei, J.; Gheewala, S.H. Resource depletion assessment of renewable electricity generation technologies—Comparison of life cycle impact assessment methods with focus on mineral resources. Int. Life Cycle Assess. 2017, 22, 185–198. [Google Scholar] [CrossRef]
- Dorber, M.; Mattson, K.R.; Sandlund, O.T.; May, R.; Verones, F. Quantifying net water consumption of Norwegian hydropower reservoirs and related aquatic biodiversity impacts in Life Cycle Assessment. Environ. Impact Assess. Rev. 2019, 76, 36–46. [Google Scholar] [CrossRef]
- Laurent, A.; Espinosa, N.; Hauschild, M. Life Cycle Assessment Theory and Practice; Chapter 26; Springer: Berlin/Heidelberg, Germany, 2018. [Google Scholar]
- European Environment Agency. Available online: https://www.eea.europa.eu/data-and-maps/indicators/en35-external-costs-of-electricity-production-1#tab-figures-supporting-this (accessed on 10 June 2019).
- Rafaj, P.; Kypreos, S. Internalisation of external cost in the power generation sector: Analysis with Global Multi-regional MARKAL model. Energy Policy 2007, 35, 828–843. [Google Scholar] [CrossRef]
- Streimikiene, D.; Alisauskaite-Seskiene, I. External costs of electricity generation options in Lithuania. Renew. Energy 2014, 64, 215–224. [Google Scholar] [CrossRef]
- Vrhovcak, M.B.; Tomsic, Z.; Debrecin, N. External costs of electricity production: Case study Croatia. Energy Policy 2005, 33, 1385–1395. [Google Scholar] [CrossRef]
- Dimitrijevic, Z.; Tatic, K.; Knezevic, A.; Salihbegovic, I. External costs from coal-fired thermal plants and sulphur dioxide emission limit values for new plants in Bosnia and Herzegovina. Energy Policy 2011, 39, 3036–3041. [Google Scholar] [CrossRef]
- Czarnowska, L.; Frangopoulos, C.A. Dispersion of pollutants, environmental externalities due to a pulverized coal power plant and their effect on the cost of electricity. Energy 2012, 41, 212–219. [Google Scholar] [CrossRef]
- Klaasen, G.; Riahi, K. Internalizing externalities of electricity generation: An analysis with MESSAGE-MACRO. Energy Policy 2007, 35, 815–827. [Google Scholar] [CrossRef]
- Mahapatra, D.; Shukla, P.; Dhar, S. External cost of coal based electricity generation: A tale of Ahmedabad city. Energy Policy 2012, 49, 253–265. [Google Scholar] [CrossRef]
- Wang, C.; Zhang, L.; Zhou, P.; Chang, Y.; Zhou, D.; Pang, M.; Yin, H. Assessing the environmental externalities for biomass- and coal-fired electricity generation in China: A supply chain perspective. J. Environ. Manag. 2019, 246, 758–767. [Google Scholar] [CrossRef]
- Istrate, I.; García-Gusano, D.; Iribarren, D.; Dufour, J. Long-term opportunities for electricity production through municipal solid waste incineration when internalising external costs. J. Clean. Prod. 2019, 215, 870–877. [Google Scholar] [CrossRef]
- Cel, W.; Czechowska-Kosacka, A.; Kujawska, J.; Wasąg, H. External costs as a measure of environmental impact in the generation of electricity in Poland. IOP Conf. Ser. Earth Environ. Sci. 2018, 150, 012028. [Google Scholar] [CrossRef]
- Karimzadegan, H.; Rahmatian, M.; Farsiabi, M.M.; Meiboudi, H. Social cost of fossil-based electricity generation plants in Iran. Environ. Eng. Manag. J. 2015, 14, 2373–2382. [Google Scholar]
- Buke, T.; Kone, A.C. Estimation of the health benefits of controlling air pollution from the Yatagan coal-fired power plant. Environ. Sci. Policy 2011, 14, 1113–1120. [Google Scholar] [CrossRef]
- Georgakellos, D.A. Impact of a possible environmental externalities internalisation on energy prices: The case of the greenhouse gases from the Greek electricity sector. Energy Econ. 2010, 32, 202–209. [Google Scholar] [CrossRef]
- Turtos Carbonell, L.; Meneses Ruiz, E.; Sanchez Gacita, M.; Rivero Oliva, J.; Díaz Rivero, N. Assessment of the impacts on health due to the emissions of Cuban power plants that use fossil fuel oils with high content of sulfur. Estim. Extern. Costs Atmos. Environ. 2007, 41, 2202–2213. [Google Scholar] [CrossRef]
- Spalding-Fecher, R.; Matibe, D.K. Electricity and externalities in South Africa. Energy Policy 2003, 31, 721–734. [Google Scholar] [CrossRef]
- Inaba, A.; Itsubo, N. Preface. Int. J. Life Cycle Assess. 2018, 23, 2271–2275. [Google Scholar] [CrossRef] [Green Version]
- Itsubo, N.; Murakami, K.; Kuriyama, K.; Yoshida, K.; Tokimatsu, K.; Inaba, A. Development of weighting factors for G20 countries—Explore the difference in environmental awareness between developed and emerging countries. Int. J. Life Cycle Assess. 2018, 23, 2311–2326. [Google Scholar] [CrossRef] [Green Version]
- Murakami, K.; Itsubo, N.; Kuriyama, K.; Yoshida, K.; Tokimatsu, K. Development of weighting factors for G20 countries. Part 2: Estimation of willingness to pay and annual global damage cost. Int. J. Life Cycle Assess. 2018, 23, 2349–2364. [Google Scholar] [CrossRef]
- Huijbregts, M.A.J.; Steinmann, Z.J.N.; Elshout, P.M.F.; Stam, G.; Verones, F.; Vieira, M.; Zijp, M.; Hollander, A.; Van Zelm, R. ReCiPe2016: A harmonised life cycle impact assessment method at midpoint and endpoint level. Int. J. Life Cycle Assess. 2017, 22, 138–147. [Google Scholar] [CrossRef]
- Bulle, C.; Margni, M.; Patouillard, L.; Boulay, A.M.; Bourgault, G.; De Bruille, V.; Cao, V.; Hauschild, M.; Henderson, A.; Humbert, S.; et al. IMPACT World+: A globally regionalized life cycle impact assessment method. Int. J. Life Cycle Assess. 2019, 24, 1653–1674. [Google Scholar] [CrossRef] [Green Version]
- Tang, L.; Ii, R.; Tokimatsu, K.; Itsubo, N. Development of human health damage factors related to CO2 emissions by considering future socioeconomic scenarios. Int. J. Life Cycle Assess. 2018, 23, 2288–2299. [Google Scholar] [CrossRef]
- Tang, L.; Higa, M.; Tanaka, N.; Itsubo, N. Assessment of global warming impact on biodiversity using the extinction risk index in LCIA: A case study of Japanese plant species. Int. J. Life Cycle Assess. 2018, 23, 314–323. [Google Scholar] [CrossRef]
- Tang, L.; Nagashima, T.; Hasegawa, K.; Ohara, T.; Sudo, K.; Itsubo, N. Development of human health damage factors for PM2.5 based on a global chemical transport model. Int. J. Life Cycle Assess. 2018, 23, 2300–2310. [Google Scholar] [CrossRef]
- Tang, L.; Nagashima, T.; Hasegawa, K.; Ohara, T.; Sudo, K.; Itsubo, N. Development of human health damage factors for tropospheric ozone considering transboundary transport on a global scale. Int. J. Life Cycle Assess. 2018, 23, 2339–2348. [Google Scholar] [CrossRef]
- Motoshita, M.; Ono, Y.; Pfister, S.; Boulay, A.; Berger, M.; Nansai, K.; Tahara, K.; Itsubo, N.; Inaba, A. Consistent characterisation factors at midpoint and endpoint relevant to agricultural water scarcity arising from freshwater consumption. Int. J. Life Cycle Assess. 2018, 23, 2276–2287. [Google Scholar] [CrossRef] [Green Version]
- Yamaguchi, K.; Ii, R.; Itsubo, N. Ecosystem damage assessment of land transformation using species loss. Int. J. Life Cycle Assess. 2018, 23, 2327–2338. [Google Scholar] [CrossRef]
- Available online: https://www.europarl.europa.eu/RegData/etudes/BRIE/2019/631047/IPOL_BRI(2019)631047_EN.pdf (accessed on 5 March 2020).
- IEA (International Energy Agency). World Energy Statistics and Balances; IEA Publications: Paris, France, 2017. [Google Scholar]
- Ahmad, Y.J.; El Serafy, S.; Lutz, E. Environmental Accounting for Sustainable Development; The World Bank: Washington, DC, USA, 1989. [Google Scholar]
- U.S Energy Information Administration, International Energy Statistics 2019. Available online: https://www.eia.gov/beta/international/data/browser/ (accessed on 12 November 2019).
- Carbon Brief, Mapped: The Global Coal Trade 2016. Available online: https://www.carbonbrief.org/mapped-the-global-coal-trade (accessed on 4 November 2019).
- International Energy Agency (IEA). World Energy Prices 2019; IEA Publications: Paris, France, 2019. [Google Scholar]
- European Environment Agency, 2008. Efficiency of Conventional Thermal Electricity and Heat Production in Europe. 2008. Available online: https://www.eea.europa.eu/data-and-maps/indicators/efficiency-of-conventional-thermal-electricity-generation-4/assessment-2 (accessed on 4 November 2019).
- Young, B.; Krynock, M.; Carlson, D.; Hawkins, T.R.; Marriott, J.; Morelli, B.; Jamieson, M.; Cooney, G.; Skone, T.J. Comparative environmental life cycle assessment of carbon capture for petroleum refining, ammonia production, and thermoelectric power generation in the United States. Int. J. Greenh. Gas Control 2019, 91, 102821. [Google Scholar] [CrossRef]
- Yu, P.; Luo, Z.; Wang, Q.; Fang, M. Life cycle assessment of transformation from a sub-critical power plant into a polygeneration plant. Energy Convers. Manag. 2019, 198, 111801. [Google Scholar] [CrossRef]
- Tarannum, I.; Mohammedy, F.M. Life Cycle Assessment of Natural Gas and Heavy Fuel Oil Power Plants in Bangladesh. In Proceedings of the TENCON 2019-2019 IEEE Region 10 Conference (TENCON), Kochi, India, 17–20 October 2019. [Google Scholar]
- Xie, J.; Fu, J.; Liu, S.; Hwang, W. Assessments of carbon footprint and energy analysis of three wind farms. J. Clean. Prod. 2020, 254, 120159. [Google Scholar] [CrossRef]
- Kouloumpis, V.; Sobolewski, R.A.; Yan, X. Performance and life cycle assessment of a small scale vertical axis wind turbine. J. Clean. Prod. 2020, 247, 119520. [Google Scholar] [CrossRef]
- Besseau, R.; Sacchi, R.; Blanc, I.; Pérez-López, P. Past, present and future environmental footprint of the Danish wind turbine fleet with LCA_WIND_DK, an online interactive platform. Renew. Sustain. Energy Rev. 2019, 108, 274–288. [Google Scholar] [CrossRef] [Green Version]
- Parisi, M.; Maranghi, S.; Vesce, L.; Sinicropi, A.; Di Carlo, A.; Basosi, R. +Prospective life cycle assessment of third-generation photovoltaics at the pre-industrial scale: A long-term scenario approach. Renew. Sustain. Energy Rev. 2020, 121, 109703. [Google Scholar] [CrossRef]
- Liu, F.; van den Bergh, J.C. Differences in CO2 emissions of solar PV production among technologies and regions: Application to China, EU and USA. Energy Policy 2020, 111234. [Google Scholar] [CrossRef]
- Mérida García, A.; Gallagher, J.; McNabola, A.; Camacho Poyato, E.; Montesinos Barrios, P.; Rodríguez Díaz, J. Comparing the environmental and economic impacts of on- or off-grid solar photovoltaics with traditional energy sources for rural irrigation systems. Renew. Energy 2019, 140, 895–904. [Google Scholar] [CrossRef]
- Zang, G.; Zhang, J.; Jia, J.; Lora, E.S.; Ratner, A. Life cycle assessment of power-generation systems based on biomass integrated gasification combined cycles. Renew. Energy 2020, 149, 336–346. [Google Scholar] [CrossRef]
- Masum, M.F.H.; Dwivedi, P.; Anderson, W.F. Estimating unit production cost, carbon intensity, and carbon abatement cost of electricity generation from bioenergy feedstocks in Georgia, United States. Renew. Sustain. Energy Rev. 2020, 117, 109514. [Google Scholar] [CrossRef]
- Sanchez Moore, C.C.; Anton, L.; Cardoso, F.H.; Kulay, L. Effect of Process Parameters on Bioelectricity Production, Energy and Environmental Performance. J. Sustain. Dev. Energy Water Environ. Syst. 2019, 7, 567–583. [Google Scholar] [CrossRef] [Green Version]
- Yan, L.; Cao, Y.; He, B. Energy, exergy and economic analyses of a novel biomass fueled power plant with carbon capture and sequestration. Sci. Total Environ. 2019, 690, 812–820. [Google Scholar] [CrossRef]
- Paulillo, A.; Cotton, L.; Law, R.; Striolo, A.; Lettieri, P. Geothermal energy in the UK: The life-cycle environmental impacts of electricity production from the United Downs Deep Geothermal Power project. J. Clean. Prod. 2020, 249, 119410. [Google Scholar] [CrossRef]
- Karlsdottir, M.R.; Heinonen, J.; Palsson, H.; Palsson, O.P. Life cycle assessment of a geothermal combined heat and power plant based on high temperature utilization. Geothermics 2020, 84, 101727. [Google Scholar] [CrossRef]
- Paulillo, A.; Striolo, A.; Lettieri, P. The environmental impacts and the carbon intensity of geothermal energy: A case study on the Hellisheiði plant. Environ. Int. 2019, 133, 105226. [Google Scholar] [CrossRef]
- Yuguda, T.K.; Li, Y.; Xiong, W.; Zhang, W. Life cycle assessment of options for retrofitting an existing dam to generate hydro-electricity. Int. J. Life Cycle Assess. 2020, 25, 57–72. [Google Scholar] [CrossRef]
- Ueda, T.; Roberts, E.S.; Norton, A.; Styles, D.; Williams, A.P.; Ramos, H.M.; Gallagher, J. A life cycle assessment of the construction phase of eleven micro-hydropower installations in the UK. J. Clean. Prod. 2019, 218, 1–9. [Google Scholar] [CrossRef] [Green Version]
- Mahmud, M.A.P.; Huda, N.; Farjana, S.H.; Lang, C. A strategic impact assessment of hydropower plants in alpine and non-alpine areas of Europe. Appl. Energy 2019, 250, 198–214. [Google Scholar] [CrossRef]
- Kaddoura, M.; Tivander, J.; Molander, S. Life Cycle Assessment of Electricity Generation from an Array of Subsea Tidal Kite Prototypes. Energies 2020, 13, 456. [Google Scholar] [CrossRef] [Green Version]


| Impact Category | Coal | Natural Gas | Oil | Nuclear | Wind | Solar | Hydro | Geo-Thermal | Biomass |
|---|---|---|---|---|---|---|---|---|---|
| Climate Change | Operation | Operation | Operation | Operation | Resource | Resource | Resource | Resource | Operation |
| Particulate Matter | Operation | Operation | Operation | Operation | Resource | Resource | Resource | Resource | Operation |
| Water Use | Operation | Operation | Operation | Operation | Resource | Resource | Resource/Operation | Resource | Operation |
| Land Use | Operation | Operation | Operation | Operation | Resource/Operation | Resource/Operation | Resource/Operation | Resource/Operation | Operation |
| Fossil Depletion | Operation | Operation | Operation | Operation | Resource | Resource | Resource | Resource | Operation |
| Metal Depletion | Resource/Operation | Resource/Operation | Resource/Operation | Operation | Resource/Disposal | Resource/Disposal | Resource/Disposal | Resource/Disposal | Resource/Disposal |
| Category | Type 1 | Type 2 | Type 3 |
|---|---|---|---|
| Coal | Hard Coal (HC) | Lignite | - |
| Natural Gas | Conventional (C) | Combined Cycle (CC) | - |
| Oil | Oil | - | - |
| Wind | Onshore (ON) | Offshore (OFF) | - |
| Geothermal | Geothermal (GEO) | - | - |
| Hydro | Run of River (RR) | Pumped Storage (PS) | Reservoir (R) |
| Nuclear | Boiling Water (BW) | Pressure Water (PW) | - |
| Solar | Open Ground (OG) | Roof | - |
| Human Health (USD/DALY) | Biodiversity (USD/EINES) | Social Assets (USD/USD) | Primary Production (USD/kg) |
|---|---|---|---|
| 2.3 × 10⁴ | 1.10 × 10¹⁰ | 2.5 | 5.6 × 10⁻² |
| HC | Lignite | NG | Oil | Wind | GEO | Hydro | Nuclear | Solar | |
|---|---|---|---|---|---|---|---|---|---|
| C/CC | ON/OFF | RR/PS/R | BW/PW | OG/Roof | |||||
| ARG | - | - | -/- | - | -/- | - | -/-/-/- | -/- | - |
| AUS | 0.026 | 0.026 | 0.013/0.008 | 0.096 | 0.002/- | - | 0.000/0.031/- | -/- | 0.004/0.003 |
| BRA | 0.023 | 0.047 | 0.013/0.009 | 0.081 | 0.003/- | - | -/-/0.002 | -/0.001 | -/0.006 |
| CAN | 0.034 | 0.029 | 0.022/0.014 | 0.071 | 0.004/- | - | 0.001/0.017/0.002 | -/0.004 | 0.008/0.009 |
| CHN | 0.101 | - | 0.021/0.020 | 0.146 | 0.009/0.006 | 0.009 | 0.001/0.112/- | -/0.004 | 0.015/0.014 |
| DEU | 0.021 | 0.027 | 0.019/0.012 | 0.083 | 0.005/0.004 | 0.005 | 0.001/0.024/0.004 | 0.002/0.002 | 0.011/0.010 |
| FRA | 0.037 | - | 0.017/0.012 | 0.087 | 0.003/0.003 | 0.004 | 0.001/0.005/0.004 | -/0.002 | 0.009/0.008 |
| GBR | 0.064 | - | 0.017/0.012 | 0.24 | 0.004/0.005 | 0.007 | 0.001/0.058/- | 0.005/0.005 | 0.014/0.017 |
| IDN | - | 0.194 | 0.020/0.012 | 0.133 | 0.002/- | 0.006 | -/-/0.005 | -/- | -/0.010 |
| IND | 0.174 | 0.143 | 0.021/0.020 | 0.112 | 0.006/- | 0.009 | 0.001/0.227/0.068 | 0.005/0.004 | -/0.010 |
| ITA | 0.041 | 0.133 | 0.019/0.011 | 0.083 | 0.005/- | 0.005 | 0.001/0.028/0.006 | -/- | 0.010/0.009 |
| JPN | 0.036 | - | 0.020/0.013 | 0.041 | 0.005/0.005 | 0.005 | 0.001/0.038/0.028 | 0.005/0.005 | 0.011/0.010 |
| KOR | 0.062 | 0.282 | 0.020/0.011 | 0.082 | 0.004/0.004 | - | 0.001/0.062/0.042 | -/0.007 | 0.015/0.015 |
| MEX | 0.027 | 0.043 | 0.022/0.014 | 0.134 | 0.003/- | 0.004 | 0.001/-/- | 0.003/- | 0.009/0.005 |
| RUS | 0.033 | 0.069 | 0.031/0.008 | 0.141 | 0.015/- | 0.004 | 0.000/0.032/0.002 | 0.001/0.001 | -/0.008 |
| SAU | - | - | 0.015/0.008 | 0.046 | -/- | - | -/-/- | -/- | -/0.005 |
| TUR | 0.048 | 0.141 | 0.014/0.009 | 0.133 | 0.003/- | 0.005 | 0.001/-/0.009 | -/- | -/0.008 |
| USA | 0.028 | 0.055 | 0.020/0.013 | 0.138 | 0.003/- | 0.004 | 0.001/0.029/0.011 | 0.002/0.002 | 0.007/0.007 |
| ZAF | 0.035 | - | -/0.007 | 0.047 | 0.006/- | 0.004 | 0.001/0.049/0.013 | -/0.002 | -/0.009 |
| AVG | 0.049 | 0.099 | 0.019/0.012 | 0.105 | 0.005/0.005 | 0.005 | 0.001/0.055/0.015 | 0.003/0.003 | 0.011/0.009 |
| CO2 | 0.001–0.026 [0.012] [0.006] |
| SO2 | 0–0.020 [0.005] [0.006] |
| NOx | 0–0.027 [0.004] [0.006] |
| NMVOC | 0–0 [0] [0] |
| PM2.5 | 0–0.089 [0.013] [0.027] |
| Oil_R | 0–0.017 [0.003] [0.006] |
| Coal_R | 0–0.015[0.002] [0.004] |
| Natural Gas_R | 0–0.004 [0.001] [0.001] |
| Water | 0–0.006 [0.001] [0.001] |
| Land transformation | 0–0.003 [0.001] [0.001] |
| Land Occupation | 0–0.001 [0.000] [0] |
| Mineral | 0.001–0.002 [0.002] [0] |
| Country | Annual External Cost (Bill USD) | Potential GDP (Nominal) Loss Ratio |
|---|---|---|
| Argentina | 4.6 | 0.88% |
| Australia | 5.7 | 0.40% |
| Brazil | 7.2 | 0.38% |
| Canada | 5.3 | 0.31% |
| China | 574 | 4.22% |
| France | 2.9 | 0.10% |
| Germany | 11.0 | 0.28% |
| India | 282 | 10.37% |
| Indonesia | 36.2 | 3.47% |
| Italy | 6.1 | 0.29% |
| Japan | 30.9 | 0.62% |
| Mexico | 10.9 | 0.89% |
| Russia | 29.3 | 1.77% |
| Saudi Arabia | 13.7 | 1.75% |
| South Africa | 9.7 | 2.64% |
| South Korea | 26.7 | 1.65% |
| Turkey | 13.3 | 1.74% |
| UK | 15.0 | 0.53% |
| USA | 115 | 0.56% |
| EEA | This Study | |
|---|---|---|
| Main parameters | ||
| Area of interest | EU | G20 |
| Dataset (year) | 2005 | 2014 |
| Currency | Euro | Dollar |
| Impact categories considered | ||
| Climate change | x | x |
| Air pollution | x | x |
| Photochemical ozone | x | x |
| Water use | x | |
| Fossil fuels | x | |
| Mineral resources | x | |
| Land use | x | |
| Noise | x | |
| External cost ($) | ||
| France | 0.008–0.021 | 0.005 |
| Germany | 0.023–0.085 | 0.017 |
| Italy | 0.017–0.062 | 0.021 |
| UK | 0.026–0.085 | 0.045 |
© 2020 by the authors. Licensee MDPI, Basel, Switzerland. This article is an open access article distributed under the terms and conditions of the Creative Commons Attribution (CC BY) license (http://creativecommons.org/licenses/by/4.0/).
Share and Cite
Karkour, S.; Ichisugi, Y.; Abeynayaka, A.; Itsubo, N. External-Cost Estimation of Electricity Generation in G20 Countries: Case Study Using a Global Life-Cycle Impact-Assessment Method. Sustainability 2020, 12, 2002. https://doi.org/10.3390/su12052002
Karkour S, Ichisugi Y, Abeynayaka A, Itsubo N. External-Cost Estimation of Electricity Generation in G20 Countries: Case Study Using a Global Life-Cycle Impact-Assessment Method. Sustainability. 2020; 12(5):2002. https://doi.org/10.3390/su12052002
Chicago/Turabian StyleKarkour, Selim, Yuki Ichisugi, Amila Abeynayaka, and Norihiro Itsubo. 2020. "External-Cost Estimation of Electricity Generation in G20 Countries: Case Study Using a Global Life-Cycle Impact-Assessment Method" Sustainability 12, no. 5: 2002. https://doi.org/10.3390/su12052002