Examining the Key Drivers of Residential Solar Adoption in Upstate New York


1
Department of Social Sciences, Michigan Technological University, 1400 Townsend Drive, Houghton, MI 49930, USA
2
GenMetrix LLC, 260 1st Ave S, Suite 200 Box 142, St. Petersburg, FL 33701, USA
*
Author to whom correspondence should be addressed.
Sustainability 2020, 12(6), 2552; https://doi.org/10.3390/su12062552
Submission received: 4 February 2020
/
Revised: 9 March 2020
/
Accepted: 17 March 2020
/
Published: 24 March 2020
(This article belongs to the Special Issue Social Dimensions of Human-Technology Interaction and Sustainable Energy Communities)
Abstract
:This research examines the decision factors influencing adoption of residential solar electric power systems in upstate New York. New York has a goal to provide 100% of electric energy in the State through renewable resources, which includes solar electricity, by 2030. Thus, identifying the most important decision factors may be useful in understanding potential means of promoting solar technology adoption. Through an online survey of homeowners in upstate New York who have installed residential solar systems, the research examined the importance of decision factors influencing the decision to adopt and how factors have changed over time. The research finds that environmental motivations are slightly more important than economics and that perception of solar installers is also important to adopters. This work contributes new insights to the field of research examining solar and renewable energy technology adoption at the residential scale, addresses the role of policy in promoting solar adoption, and provides insights for developers and others looking to enhance the rates of solar technology adoption at the residential scale.
1. Introduction
The photovoltaic effect, the means of harnessing the sun’s power by transforming it into electricity, was first discovered in 1839. However, it was not until the last two decades that solar electric systems became widely utilized for electrical power production at both the residential and utility scale. In the United States, solar electric technology adoption is currently incentivized through a federal investment tax credit (ITC) to encourage solar system adoption, although the ITC decreased after 2019 and is set to be eliminated for residential systems by 2022. Individual states vary widely in whether and how much they incentivize or subsidize solar system installation.
The state of New York has invested heavily in promoting solar systems by subsidizing costs for residential, commercial, and industrial energy users. These incentives are spurred by aggressive targets for renewable energy production, of which solar is a component. New York has committed to aggressive growth in renewable energy in the State’s overall energy resource portfolio. The state of New York has set an ambitious goal of having 100% carbon-free electricity by 2040, and one component of this involves a target for 6 gigawatts (GW) of solar installed in the state by 2025 [1].
Through various statutory and regulatory initiatives, New York is incentivizing the development of renewable energy projects at a rapid pace. While there are many types of renewable energy resources, solar photovoltaic (PV) energy projects play a key role in New York, as indicated by the launch of the NY-Sun incentive program in 2012 [2]. The adoption of solar, then, is one key factor in meeting New York’s substantial renewable energy targets. Meeting the renewable energy goals of the state of New York will require solar technology adoption at a range of scales, including large utility scale solar systems but also smaller scale residential solar systems.
Although the costs of solar technology are declining rapidly and, in many cases, solar is a lower cost option than fossil fuel-based energy sources [3], the up-front expense of residential solar installations is still a considerable economic barrier for household scale adoption. Given the decline and eventual elimination of the federal ITC to economically incentivize residential solar, it is imperative to understand the role of other factors motivating solar adoption at the residential scale. The goal of the research presented in this paper was to add to the knowledge base on solar technology adoption at the residential scale by examining what decision factors were most important to adopters in their decision to adopt, focusing on a specific segment of the market.
The research was based on a survey of upstate New York (for practical purposes, all of New York except for New York City and Long Island) residential solar adopters who received state-level incentives. The survey was designed based on the factors identified in previous research on residential scale solar adoption to explicitly examine the most important factors to this group in their decisions to adopt solar electric technology at the residential scale. This research was designed to seek answers to four questions:
- What are the demographic parameters that describe the upstate New York residential solar power system adopters?
- What were the most important decision factors identified by adopters as shaping their decision to adopt?
- How do the importance ratings of the decision factors correlate to demographic parameters?
- How have the decision factors changed in importance over time?
Survey findings indicate that environmental and economic factors are both important to residential PV technology adopters, with these two factors being identified as equally important considerations. This finding is particularly important given that economic incentives for residential PV adoption are declining while rates of concern about climate change are increasing [4]. While these two factors are practically indistinguishable in their importance to respondents, it is also noteworthy that women were more likely to indicate environmental factors as a more important motivator. The third most important decision factor reported by respondents was trust in solar installer. This indicates a key area of opportunity, as states can work to ensure public trust in installers and installers can work to build relationships of trust with communities as these entities both seek to enhance the rate of PV adoption at the residential scale.
2. Household Solar Technology Adoption Research
Solar technology adoption provides a wide range of benefits to both residential adopters and utilities [5]. Solar technology adoption research is a robust field with over a decade spent examining the role of various factors in shaping adoption, such as environmental concern and political orientation [6] and policies such as renewable portfolio standards [7]. Others have examined the environmental, social, economic, and political variables that impact solar adoption, finding that areas with heavy insolation (the amount of solar radiation reaching a given area) are underperforming due to environmental, social, and economic, factors [8]. This bolsters the assertion that the amount of sunshine is not a critical driver in solar adoption, which is important since other parameters can be controlled, but sunshine cannot. Similarly, other have correlated solar thermal adoption at the county level to socioeconomic, environmental concern, and ecological (temperatures and solar radiation) indices and concluded that the socioeconomic variables household income, home value, and education were correlated with solar adoption [9].
Results from previous research point to the importance of state-level economic incentives to foster solar technology adoption [10,11]. Research shows that offering cash incentives to offset solar costs is correlated with more successful deployment of solar resources [12] and that renewable portfolio standards have demonstrably increased solar technology adoption [7,13]. This suggests that as the subsidies in New York decline and ultimately end, it will be more challenging to encourage adoption.
However, stability in energy costs via solar installation is also an important benefit to adopters. Other work has found that reducing long term economic uncertainty is an important factor in solar adoption [14], and retail electric rates in an area can drive solar technology adoption [15]. Other research suggests the importance of non-economic factors that influence a prospective customer’s decision to adopt solar technology. For example, according to past research, energy independence or not relying on the utility grid for access to electrical energy was a key driver for why customers opted to invest in solar power [16]. Low cost policy options, such as improved interconnection and net metering standards, can also motivate increased solar technology adoption [17].
Past work examining the role of social interaction in the form of peer influence on the diffusion of environmentally responsible technologies like residential solar and find a strong positive correlation between peer influence and solar adoption [18]. The direct influence of close peers is more impactful at influencing choice than passive influence such as seeing solar panels, supporting the notion that peers play a very clear and important role in influencing adoption and adoption promotes further adoption via patterns of diffusion [19]. Work exploring the peer effect of solar community organizations on adoption concludes that future studies should consider their role in the adoption of solar [20].
Information and communication have been central themes of non-economic adoption motivations [21]. The authors attributed much of the gap between the potential of solar power adoption and reality to a lack of information and misinformation. One study found that 82% of residential solar adopters also co-adopt other energy-efficient technologies [22]. This finding shows that environmental concern, not just economics or peer influence, is a key driver of adopting solar.
Past research suggests that there are three types of motivators: economic (cost of solar), social (peer influence), and environmental (reduced pollution) [23]. In exploring elements that drive photovoltaic adoption, including environmental motivations, economic considerations, and demographic characteristics, past work finds that adoption can be influenced by the timing of economic events in a homeowner’s life (e.g., an inheritance that enables the purchase of solar equipment) [24]. This literature on the motivations for solar technology adoption at the residential scale suggests several important considerations related to economic considerations including upfront cost, economic savings, and economic incentivization, environmental values, peer influence and access to information, and timing of life events. Further, applied work in the field based on the authors’ experiences suggests that attitudes toward solar installers may shape motivations for adoption. Therefore, the decision factors selected for this study were:
- Low or no up-front cost
- Expected energy bill reduction
- Positive impact on the environment
- Leaving a positive legacy
- Recommendations for solar power from peers
- Reputation of my solar installer
- Perceived honesty of my solar sales representative
- Exposure to public information about solar
- Reduced dependency on my power company
- The timing of life events enabled my solar installation
3. Methods
An online survey was used to examine the factors that influenced the decision residential solar electric systems among adopters in upstate New York. Descriptive statistics were analyzed to describe participants’ decision factors. Correlation analyses were used to analyze the relationships between decision factors and participant demographics or other indicators in the survey.
The population is comprised of residents of upstate New York who adopted residential solar technology between 2013 and 2017, who received an incentive from NYSERDA to offset solar power system costs (see Table 1), and for whom NYSERDA retained email addresses. This population includes 19,634 adopters. NYSERDA maintains a database with information pertaining to the installation, such as the system size, electric utility, and location. This project was not in any way supported financially by NYSERDA, but they were cooperative partners in administering the survey to the residential PV adopters who received incentives administered through NYSERDA programs and who were thus in the NYSERDA database. The NYSERDA database of residential PV adopters who have received rebates administered by NYSERDA is not publicly available information. To protect anonymity, NYSERDA assisted in survey distribution rather than provide the actual email contact information. NYSERDA maintained exclusive data ownership and access to identifiable information and did not share such information, providing only anonymous data to the research team for analysis.
The survey was distributed to a total of 19,634 email addresses of upstate New York residential solar power system adopters. There were 2093 survey responses. About 12% (251) of responses were dropped from the data for being incomplete. Records were excluded as incomplete if they met several criteria: missing any of the ratings of the ten primary decision factors, declaring a solar installation year outside of the scope of this analysis, or declaring an electric utility company not in the list of those that considered by NYSERDA to be outside of the upstate New York territory (PSEG Long Island and Consolidated Edison). The final sample size was 1842, with a response rate of 9.4%. A 95% confidence and margin of error of 3 results in a value of 1013 for a representative sample; this sample has a calculated margin of error of 2.
The survey captured information about the adopters’ demographics, the physical descriptions of the home upon which the system was installed, and ratings of the factors influencing their decision to adopt (the survey instrument is included with this paper as Supplementary Material). NYSERDA uploaded the survey to its Qualtrics account and distributed the survey to its protected list of residential adopters. At the close of the survey, approximately one week after initial distribution, NYSERDA provided the results with no identifiable information.
4. Results
This quantitative analysis was performed on survey data in four phases. First, descriptive statistics were examined to show the demographic makeup of the respondents. Second, descriptive statistics were calculated on the ratings of the decision factors that influenced participant adoption of residential solar systems. Third, correlations were calculated to identify key relationships between demographic characteristics and ratings of the decision factors. Finally, the importance ratings were grouped by the year of solar system installation to evaluate change in importance of factors over time. Each of the ten decision factors that were rated in importance to the solar power system adoption were put in ordinal format of integers from 1 (not important at all) to 5 (extremely important). The minimum, maximum, mean, and median values were calculated for each for the entire sample. For this analysis, the key determinant of importance was the mean score.
4.1. Demographic Summary
Table 2 provides a demographic summary. Respondents who identify as white make up a larger portion of the solar adopters than they do of the general population of upstate New York (82% White); the opposite is true of other races in the sample. Respondents are more highly educated than the general population. Nearly half (48.7%) of the responses identified as Democrats as compared to approximately one in five (21.9%) who identify as Republican and one in four (25.2%) who declare an “other” political affiliation. New York voter registration data on political party affiliation for the active voter registrations for the 55 counties that comprise the upstate New York solar shows that 50% of upstate voters are Democrats, nearly identical to the percentage of Democrats in the sample. However, the registration data showed that 40% of the upstate voters were Republicans, nearly twice the percentage of survey respondents who identified as Republicans. The group who identified their political affiliation as “other” was also surprisingly large. The other group made up just 11% of the voter registrations but over 25% of the sample respondents.
4.2. Climate Change Beliefs
As one metric of environmental concern, the survey provided respondents with the ability to select from three options: that climate change is not real, that climate change is real but is not caused by humans, and that climate change is real and is caused by humans. Respondents were also allowed to choose not to answer, although 98% of respondents (1797 out of 1842) answered this question. The data show that solar adoption in upstate New York is largely comprised of people who believe climate change is caused by humans (84.4%). Another 11.8% believe that climate change is real but that humans do not cause it. Combined, this shows that an overwhelming majority (96.2%) of solar adopters in upstate New York believe that climate change is real. A recent survey by Yale University shows that 77% of adult New York State residents believe that global warming is happening [25]. Comparing to the 96.2% of survey respondents who acknowledge that climate change is real suggests that survey respondents are more likely to believe in climate change than national polling respondents.
4.3. Decision Factors
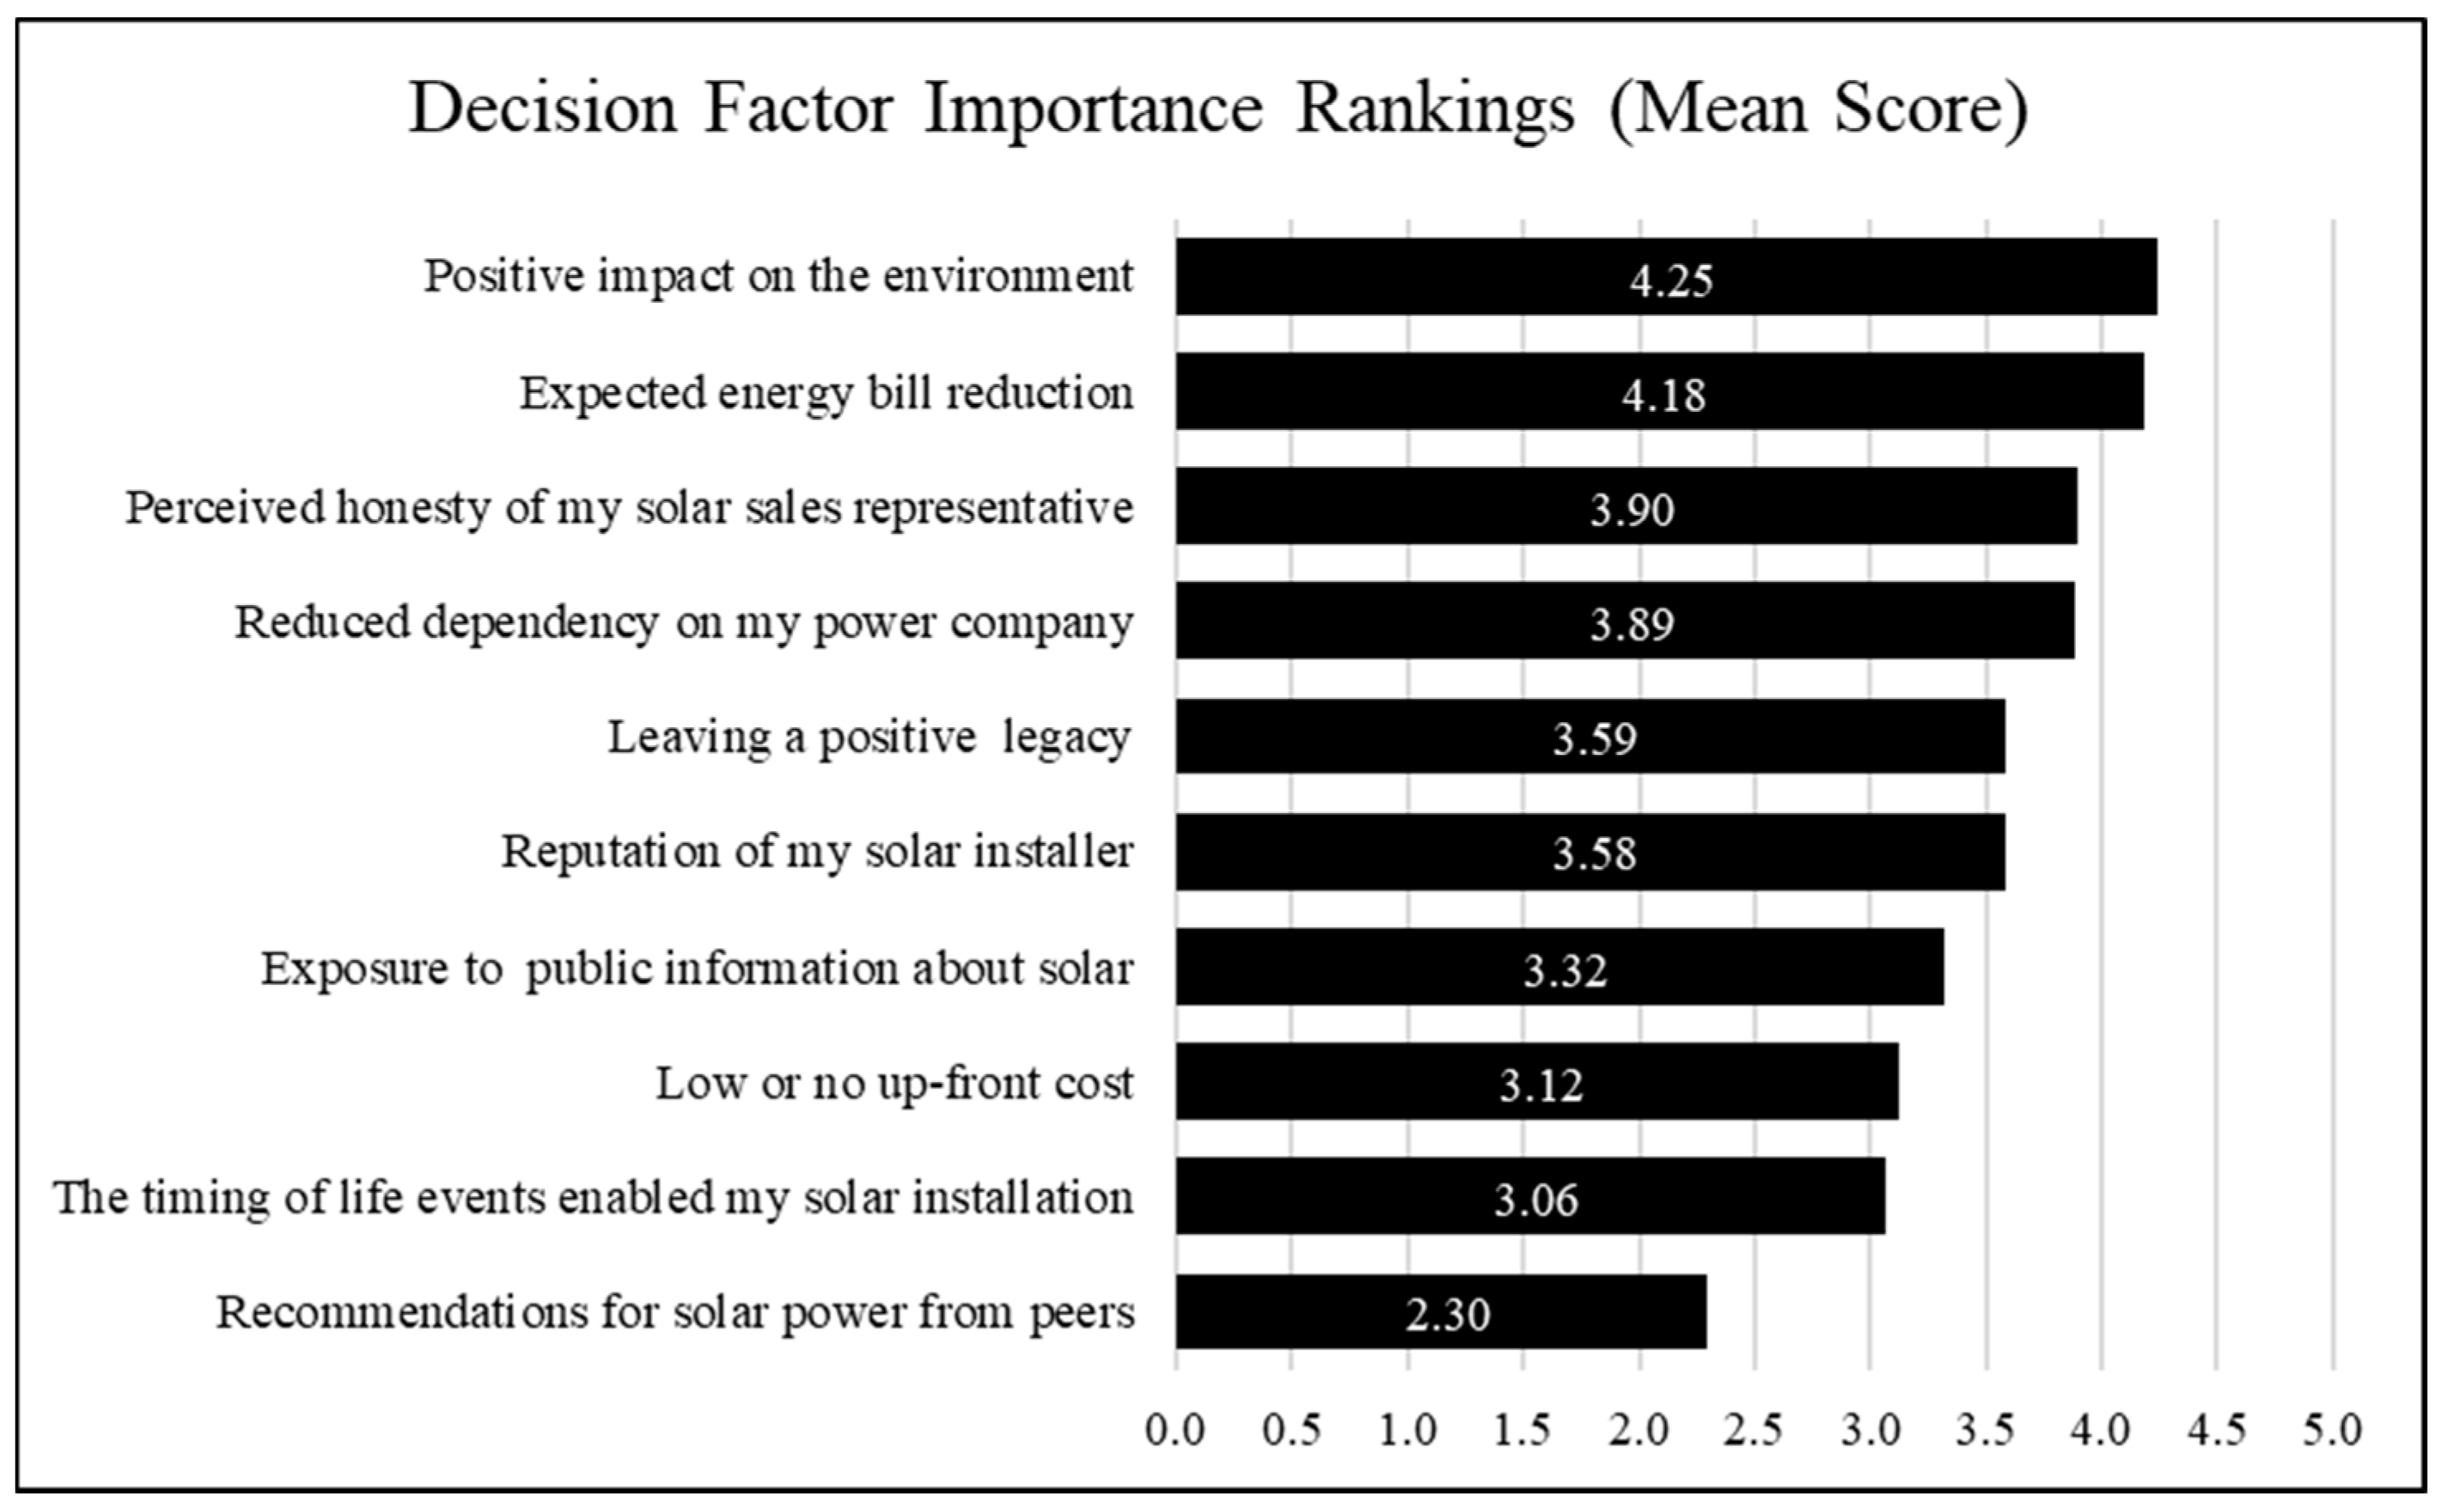
With the ordinal value assigned to the importance of each factor for each survey response, the mean value of each decision factor was calculated. These are displayed graphically in Figure 1. The most important overall factor in the decision to adopt solar power systems was that solar power has a positive impact on the environment (μ = 4.25). This was followed closely by the expectation of a reduction in energy bills (μ = 4.18). This strikes a nearly fair balance between environmental and economic considerations, with the environment rated as slightly more important. These two factors are considered the highest tier factors in importance.
The factors in the next tier of importance were perceived honesty of the solar sales representative (μ = 3.90) and reduced dependency on the power company (μ = 3.89). The next tier was comprised of leaving a positive legacy (μ = 3.59) and reputation of the solar installer (μ = 3.58). The factors fall off in importance after that, with recommendation for solar power from peers being the least important factor (μ = 2.30).
In addition to the 10 specific decision factors for which the survey collected importance ratings, respondents were given the opportunity to list another non-listed decision factor of their own choosing. Respondents who chose to do this wrote in a description of the other decision factor and provided an importance rating.
Approximately 17% of respondents (307 of 1842) indicated another factor. For those who did this, the other decision factor descriptions varied widely, and many of those descriptions were exact matches to or closely related to the ten decision factors listed in the survey. The 307 other responses had a high mean importance score of 4.08. This leads to the inference that the category was used by some respondents to emphasize specific decision factors. The other factors were grouped into three categories: solar economics, environmental impact, and undefined. These were coded based on the text provided by respondents indicating certain themes, which were generally either cost (economic) related or environmental benefits related. Examples of the economics category include “good investment” and “tax breaks”. Examples of the environmental impact category include “global warming” and “environmental”. The unspecified factors were diverse and generally unfit for analysis. Examples include “I signed the loan agreement the day Donald Trump was elected” and “retired”. Table 3 shows the number of other factors in each of these categories and the mean importance rating of each.
In a follow-up question, survey participants were asked to select the top three most important decision factors. Participant responses were summed for each decision factor. The top two most common selections were also the two decision factors with the highest mean importance ratings. The first and second decision factors are reversed when compared to the mean of the importance ratings. These are shown in Table 4.
Expected energy bill reduction and positive impact on the environment are far more important than the other factors based on this second approach. Most of the factors had similar importance between both approaches to measuring importance, with one key exception. In the overall ratings, low or no up-front cost rated eighth. However, in the top three approach, it ranked as the third most selected decision factor.
Table 5 shows importance ratings by gender and indicates a fundamental difference between the male and female respondents. Females in the sample rate positive impact on the environment as the most important decision factor. Men in the sample rate expected energy bill reduction as the most important decision factor. This difference was not explored beyond the descriptive statistics presented here but represents a key indication for future research.
In addition to identifying the most important decision factors, this analysis was designed to calculate correlations between demographic parameters and the importance of decision factors. Table 6 shows the correlation coefficient ρ-values between four demographic factors (age, education, home value, and income) and the importance assigned to the decision factors. The table also shows the number of responses in each calculation (N) and the statistical significance calculated with the two-tailed t-test all produced by SPSS.
Interpreting this table relies on an understanding of both correlation and significance. There were 40 variables tested for correlation. Of the 40 variables tested, 25 were shown to be statistically significant. However, the correlation coefficients were low, ranging from −0.178 to 0.210. While there is no universal criterion that assigns a label of weak or strong to a correlation factor value, the closer to zero that the coefficient is, the weaker the correlation. This table suggests significant but weak correlations, suggesting that the differences among respondents in terms of education, age, income, and home value and their responses regarding motivational factors may be statistically but not meaningfully significant. These data suggest that prioritizing low or no up-front cost is significantly and negatively correlated with all four demographic factors, that expected energy bill reduction is significantly and negatively correlated with education, that valuing the positive impact on the environment is most strongly, significantly, and positively correlated with education, and that recommendations from peers and perceived reputation of solar installer result in the lowest and least significant correlations.
4.4. Decision Factors over Time
The wealth of data from the large number of survey responses enabled this analysis to consider how importance of decision factors has evolved over time. The study horizon considered the five-year period from 2013 through 2017. Table 7 shows the average importance rating of each decision factor for each year of installation represented by the sample.
There are three key takeaways from this data. First, positive impact on the environment and expected energy bill reduction maintained their respective number one and number two ratings throughout the study period. Second, the ratings for most decision factors remained relatively flat over the study horizon. Third, two of the less important decision factors over the entire period showed the largest change between 2013 and 2017. Recommendations for solar power from peers and reputation of my solar installer were the fastest growing decision factors in terms of importance as shown in the shaded area of the Change column of Table 7. These results make sense, given that as adoption increases in prevalence and visibility, discussions with peers about solar adoption become more likely and reputations of solar installers likely become more established and well known.
5. Conclusions and Policy Implications
This study examined solar technology adoption at the residential scale by conducting an online survey that forced respondents to rank decision factors that motivated their choice to adopt. The most important decision factor was positive impact on the environment, with a mean importance score of 4.25. This was followed by expectation of lower energy bills, one of the two economic factors, which was rated as almost equally important to environmental considerations. This finding confirms findings from previous research on solar technology adoption at the residential scale [24] that adopters are motivated by both environmental and economic considerations; therefore, framing solar energy technology based on an exclusive focus on either the environmental or the economic benefits creates an artificially narrow focus that does not align with actual adoption motivations, which recognize both economic and environmental benefits as important.
However, the other economic decision factor, low or no up-front cost, was the eighth most important decision factor. The conclusion of decision factors is that the most important solar decision factor was positive impact on the environment, followed by expected energy bill reduction. Another important finding is the importance of perceived honesty of the solar sales representative, which ranked third in importance when respondents were forced to select their top three reasons for adopting. This decision factor has nothing to do with the environment, economics, or solar itself, but indicates the unexplored role perceptions of trust play in motivating renewable energy technology adoption. Other recent research also indicates that concerns regarding trust are important in shaping perceptions of solar technology development [26]; a recent study on Long Island found that concern that the economic benefits of solar are not equitably distributed, a concern anchored in lack of trust regarding a fair distribution of benefits associated with solar, was the most highly ranked concern about solar development [27]. Previous research suggests that peer effects influence adoption [28], while the current study suggests perceived reputation of installers is more influential.
This research demonstrates that when forced to rank order the decision factors that motivated adoption, economics alone are not sufficient (supporting the qualitative findings of [24]). Both environmental and economic factors matter for adopters, as does perception that installers are trustworthy, and policy makers and industry actors alike can learn from these findings to improve policy design and marketing structures for promoting a renewable energy transition that includes solar technology use at the residential scale. Peers and solar installers have become increasingly important factors over time; these findings can shape the activities of policy makers and solar installers as they seek to promote adoption in the face of declining economic incentivization.
For policy makers, this work suggests that economic incentives may not be the only effective tool for promoting solar technology adoption, and that economic incentives that lower energy costs over the long term rather than lessening the costs of installation in the short term may be effective policy tools. While state RPS policies have promoted solar adoption [7] and financial incentivization clearly helps reduce the up-front economic investment required for solar technology adoption, low and no cost policy tools can also be effective [17]. Given the increased importance of recommendations from peers and the reputations of installers over time, policy decision makers may be able to leverage peer to peer networks or bolster reputations of trustworthy installers as tools to increase market penetration of residential solar. For solar installers, this work suggests the importance of targeted marketing that focuses on both environmental and economic benefits, especially given that their motivational role changes for different groups (men and women).
While this work suggests that women and men are motivated by different factors when thinking about residential solar technology adoption, the survey did not ask about actual decision making roles within the household, and thus one weakness is that this gender based difference in correlation of motivational factors may not directly predict adoption decision making. However, the gendered difference in responses may suggest an avenue for future research or possibilities for targeted marketing. This work also suggests the importance of establishing a reputation of trust when working in communities to promote solar technology adoption at the residential scale.
Future research on solar technology adoption may benefit from explicit exploration regarding the gendered differences in motivations for adoption, and how these differentiations intersects with decision making roles regarding solar technology adoption within the household. Future research may also aim to interrogate the role of particular non-monetary policy incentives that can be used to promote solar. Future research may also benefit from directly exploring the various opportunities and barriers for increasing both transparency and trust in the field of solar development and installation. These considerations regarding trust in development actors and transparency in the economic benefits provided by solar are fruitful areas for research in solar development across many scales, including residential as well as utility scale development.
Supplementary Materials
The following are available online at https://www.mdpi.com/2071-1050/12/6/2552/s1, Supplementary Material: Survey Instrument.
Author Contributions
Conceptualization: both authors; research design: both authors; methodology: J.C.L.; writing—original draft preparation: J.C.L.; writing—editing and review: C.S. All authors have read and agreed to the published version of the manuscript.
Funding
This research received no external funding.
Acknowledgments
The authors thank NYSERDA for assistance with data acquisition and Afi Wiggins for serving as J.C.L.’s DLP advisor.
Conflicts of Interest
The authors declare no conflict of interest.
References
- Misbrener, K. Governor Cuomo Doubles New York Solar Goal to 6 GW by 2025. 2019. Available online: https://www.solarpowerworldonline.com/2019/01/governor-cuomo-doubles-new-york-solar-goal/ (accessed on 4 March 2020).
- Comptroller, New York State Office of the State Comptroller. NY-Sun Incentive Program, Report 2015-S-91. 2016. Available online: https://osc.state.ny.us/audits/allaudits/093016/15s91.pdf (accessed on 19 March 2020).
- Lazard. Lazard’s Levelized Cost of Energy Analysis Version 13.0. 2019. Available online: https://www.lazard.com/media/451086/lazards-levelized-cost-of-energy-version-130-vf.pdf (accessed on 4 March 2020).
- Pew Research Center. US Concern about Climate Change is Rising. 2019. Available online: https://www.pewresearch.org/fact-tank/2019/08/28/u-s-concern-about-climate-change-is-rising-but-mainly-among-democrats/ft_19-08-28_climatechange_more-americans-say-climate-change-major-threat-than-2013/ (accessed on 5 March 2020).
- Pitt, D.; Michaud, G. Assessing the value of distributed solar energy generation. Curr. Sustain. Renew. Energy Rep. 2015, 2, 105–113. [Google Scholar] [CrossRef] [Green Version]
- Zahran, S.; Brody, S.D.; Vedlitz, A.; Lacy, M.G.; Schelly, C. Greening local energy: Explaining the geographic distribution of household solar use in the United States. J. Am. Plan. Assoc. 2008, 74, 419–434. [Google Scholar] [CrossRef]
- Carley, S. State renewable energy electricity policies: An empirical evaluation of effectiveness. Energy Policy 2009, 37, 3071–3081. [Google Scholar] [CrossRef]
- Kwan, C.L. Influence of local environmental, social, economic and political variables on the spatial distribution of residential solar PV arrays across the United States. Energy Policy 2012, 47, 332–344. [Google Scholar] [CrossRef]
- Schelly, C. Testing Residential Solar Thermal Adoption. Environ. Behav. 2010, 42, 151–170. [Google Scholar] [CrossRef]
- Burns, J.E.; Kang, J.-S. Comparative economic analysis of supporting policies for residential solar PV in the United States: Solar Renewable Energy Credit (SREC) potential. Energy Policy 2012, 44, 217–225. [Google Scholar] [CrossRef]
- Brinkman, G.; Denholm, P.; Drury, E.; Margolis, R.; Mowers, M. Toward a solar-powered grid. IEEE Power Energy Mag. 2011, 9, 24–32. [Google Scholar] [CrossRef]
- Sarzynski, A. The impact of state financial incentives on market deployment of solar technology. Energy Policy 2012, 46, 550–557. [Google Scholar] [CrossRef]
- Shrimali, G.; Kniefel, J. Are government policies effective in promoting deployment of renewable electricity resources? Energy Policy 2011, 39, 4726–4741. [Google Scholar] [CrossRef]
- Bauner, C.; Crago, C.L. Adoption of residential solar power under uncertainty: Implications for renewable energy incentives. Energy Policy 2015, 86, 27–35. [Google Scholar] [CrossRef]
- Michaud, G.; Pitt, D. Non-utility Photovoltaic Deployment: Evaluation of US State-level Policy Drivers. Strateg. Plan. Energy Environ. 2019, 38, 52–80. [Google Scholar] [CrossRef]
- Balcombe, P.; Rigby, D.; Azapagic, A. Investigating the importance of motivations and barriers related to microgeneration uptake in the UK. Appl. Energy 2014, 130, 403–418. [Google Scholar] [CrossRef]
- Krasko, V.A.; Doris, E. State distributed PV policies: Can low cost (to government) policies have a market impact? Energy Policy 2013, 59, 172–181. [Google Scholar] [CrossRef]
- Bollinger, B.; Gillingham, K. Peer Effects in the Diffusion of Solar Photovoltaic Panels. Mark. Sci. 2012, 31, 900–912. [Google Scholar] [CrossRef]
- Graziano, M.; Gillingham, K. Spatial patterns of solar photovoltaic system adoption: The influence of neighbors and the built environment ‡. J. Econ. Geogr. 2015, 15, 815–839. [Google Scholar] [CrossRef]
- Noll, D.; Dawes, C.; Rai, V. Solar Community Organizations and active peer effects in the adoption of residential PV. Energy Policy 2014, 67, 330–343. [Google Scholar] [CrossRef]
- Rai, V.; Beck, A.L. Play and learn: Serious games in breaking informational barriers in residential solar energy adoption in the United States. Energy Res. Soc. Sci. 2017, 27, 70–77. [Google Scholar] [CrossRef] [Green Version]
- Rai, V.; Reeves, D.C.; Margolis, R. Overcoming barriers and uncertainties in the adoption of residential solar PV. Renew. Energy 2016, 89, 498–505. [Google Scholar] [CrossRef]
- Sommerfeld, J.; Buys, L.; Vine, D. Residential consumers’ experiences in the adoption and use of solar PV. Energy Policy 2017, 105, 10–16. [Google Scholar] [CrossRef] [Green Version]
- Schelly, C. Residential solar electricity adoption: What motivates, and what matters? A case study of early adopters. Energy Res. Soc. Sci. 2014, 2, 183–191. [Google Scholar] [CrossRef]
- Yale Climate Opinion Survey. Retrived. Available online: http://climatecommunication.yale.edu/visualizations-data/ycom-us-2018/ (accessed on 19 March 2020).
- Barnett, B.; Prehoda, E.; Kantamneni, A.; Winkler, R.; Schelly, C. Sociotechnical Dimensions of Solar Technology Adoption. In A Research Agenda for Environmental Management; Halvorsen, K.E., Schelly, C., Handler, R., Pishcke, E., Knowlton, J., Eds.; Edward Elgar: Cheltenham, UK, 2019. [Google Scholar]
- Schelly, C.; Price Jessica, P.; Delach, A.; Thapaliya, R.; abd Leu, K. Improving Solar Development Policy and Planning through Stakeholder Engagement: The Long Island Solar Roadmap Project. Electr. J. 2019, 32. [Google Scholar] [CrossRef]
- Palm, A. Peer effects in residential solar photovoltaics adoption—A mixed methods study of Swedish users. Energy Res. Soc. Sci. 2017, 26, 1–10. [Google Scholar] [CrossRef]
Figure 1.
Rated Importance of Decision Factors.


Table 1.
NY-Sun State Program Incentives for Residential Solar Adoption.
| Block | From | To | Size (kW) | Incentive ($/W) | Status |
|---|---|---|---|---|---|
| 1 | 1/1/2014 | 9/23/2014 | 40,000 | 1.00 | Closed |
| 2 | 9/23/2014 | 11/12/2014 | 15,000 | 0.90 | Closed |
| 3 | 11/12/2014 | 2/18/2015 | 19,000 | 0.80 | Closed |
| 4 | 2/18/2015 | 6/12/2015 | 22,000 | 0.70 | Closed |
| 5 | 6/12/2015 | 9/24/2015 | 24,000 | 0.60 | Closed |
| 6 | 9/24/2015 | 1/28/2016 | 35,000 | 0.50 | Closed |
| 7 | 1/28/2016 | 9/21/2017 | 85,000 | 0.40 | Closed |
| 8 | 9/21/2017 | TBD | 75,000 | 0.35 | 41% complete |
| 9 | TBD | TBD | 148,000 | 0.20 | Future |
Note: The NY-Sun program has provided incentives to offset the cost of residential solar power systems since 2014. These incentives compare to an average 2018 residential solar power system cost of $3.41 per watt in New York. These are New York incentives above the federal incentives that are common to all states.
Table 2.
Summary of Survey Respondents.
| Demographic Parameter | % |
|---|---|
| Race | |
| American Indian or Alaska Native | 0.1% |
| Asian | 1.5% |
| Black or African American | 0.9% |
| Native Hawaiian or Other Pacific Islander | 0.1% |
| Other | 2.1% |
| White | 94.2% |
| Mixed | 1.1% |
| U.S. Census Data: White | 82% |
| Education Level | |
| No high school diploma or GED | 0.3% |
| High school diploma or GED | 10.3% |
| Associates Degree | 12.6% |
| Bachelor’s Degree | 30.5% |
| Master’s Degree | 31.8% |
| Doctoral Degree | 14.6% |
| U.S. Census: Bachelor’s or more | 32% |
| Age | |
| 18–29 | 2.3% |
| 30–39 | 12.4% |
| 40–49 | 19.4% |
| 50–59 | 28.0% |
| 60–69 | 29.3% |
| 70 or older | 8.5% |
| Household Income | |
| $0 to $50,000 | 7.6% |
| $50,000 to $100,000 | 35.7% |
| $100,000 to $200,000 | 43.6% |
| $200,000 to $300,000 | 8.6% |
| $300,000 to $400,000 | 2.1% |
| $400,000 to $500,000 | 0.8% |
| Above $500,000 | 1.6% |
| Home Value | |
| Under $100,000 | 4.3% |
| $100,000 to $199,999 | 29.6% |
| $200,000 to $299,999 | 29.9% |
| $300,000 to $399,999 | 17.7% |
| $400,000 to $499,999 | 7.7% |
| $500,000 to $599,999 | 4.5% |
| $600,000 to $699,999 | 2.5% |
| Over $700,000 | 3.7% |
| Climate Change Beliefs | |
| It’s not real | 3.8% |
| It’s real but is not caused by humans | 11.8% |
| It’s real and is caused by humans | 84.4% |
| Political Affiliation | |
| Democrat | 48.7% |
| Republican | 21.9% |
| Other | 25.2% |
| Multiple | 4.2% |
| Gender | |
| Female | 26.8% |
| Male | 73.0% |
| Other | 0.3% |
| Marital Status | |
| Single | 16.7% |
| Married | 83.3% |
Table 3.
Other Decision Factors and Their Mean Importance Ratings.
| Other Factor | Count | Mean |
| Solar Economics | 150 | 4.06 |
| Environmental Impact | 24 | 4.04 |
| Unspecified | 133 | 4.12 |
| Total | 307 | 4.08 |
Table 4.
Frequency of Decision Factors Selected as “Three Most Important”.
| Rank | Decision Factor | Count |
|---|---|---|
| 1 | Expected energy bill reduction | 1452 |
| 2 | Positive impact on the environment | 1298 |
| 3 | Low or no up-front cost | 757 |
| 4 | Reduced dependency on my power company | 667 |
| 5 | Leaving a positive legacy | 369 |
| 6 | The timing of life invents enabled my solar installation | 272 |
| 7 | Reputation of my solar installer | 158 |
| 7 | Perceived honesty of my solar sales representative | 158 |
| 9 | Other (if designated above) | 148 |
| 10 | Exposure to public information about solar | 113 |
| 11 | Recommendation for solar power from peers | 71 |
Table 5.
Decision Factor Importance Ratings by Gender.
| Gender | |||
|---|---|---|---|
| Decision Factor | Female | Male | Other |
| n (sample size) | 489 | 1330 | 3 |
| Low or no up-front cost | 3.22 | 3.08 | 3.67 |
| Expected energy bill reduction | 4.16 | 4.19 | 4.67 |
| Positive impact on the environment | 4.56 | 4.14 | 3.33 |
| Leaving a positive legacy | 3.90 | 3.47 | 2.00 |
| Recommendations for solar power from peers | 2.55 | 2.20 | 2.00 |
| Reputation of my solar installer | 3.72 | 3.54 | 2.33 |
| Perceived honesty of my solar sales rep | 4.01 | 3.86 | 2.67 |
| Exposure to public information about solar | 3.55 | 3.24 | 2.00 |
| Reduced dependency on my power company | 4.06 | 3.83 | 3.33 |
| The timing of life events enabled my solar installation | 3.22 | 3.01 | 2.33 |
| Other | 4.11 | 4.07 | 4.00 |
Table 6.
Correlation between Decision Factors and Key Demographics.
| Independent Variables | |||||
|---|---|---|---|---|---|
| Variable | Parameter | Education | Age | Income | Home Value |
| DF1 | Correlation Coefficient | −0.177 ** | −0.119 ** | −0.143 ** | −0.087 ** |
| Sig. (2-tailed) | 0.000 | 0.000 | 0.000 | 0.000 | |
| N | 1822 | 1826 | 1655 | 1783 | |
| DF2 | Correlation Coefficient | −0.178 ** | −0.044 | −0.049 * | −0.017 |
| Sig. (2-tailed) | 0.000 | 0.062 | 0.046 | 0.469 | |
| N | 1822 | 1826 | 1655 | 1783 | |
| DF3 | Correlation Coefficient | 0.210 ** | 0.115 ** | −0.001 | 0.004 |
| Sig. (2-tailed) | 0.000 | 0.000 | 0.978 | 0.856 | |
| N | 1822 | 1826 | 1655 | 1783 | |
| DF4 | Correlation Coefficient | 0.150 ** | 0.099 ** | −0.023 | 0.010 |
| Sig. (2-tailed) | 0.000 | 0.000 | 0.346 | 0.673 | |
| N | 1822 | 1826 | 1655 | 1783 | |
| DF5 | Correlation Coefficient | 0.011 | −0.007 | −0.048 | −0.055 * |
| Sig. (2-tailed) | 0.647 | 0.770 | 0.052 | 0.019 | |
| N | 1822 | 1826 | 1655 | 1783 | |
| DF6 | Correlation Coefficient | −0.089 ** | 0.073 ** | −0.016 | 0.006 |
| Sig. (2-tailed) | 0.000 | 0.002 | 0.523 | 0.788 | |
| N | 1822 | 1826 | 1655 | 1783 | |
| DF7 | Correlation Coefficient | −0.116 ** | 0.074 ** | −0.058 * | −0.021 |
| Sig. (2-tailed) | 0.000 | 0.001 | 0.017 | 0.384 | |
| N | 1822 | 1826 | 1655 | 1783 | |
| DF8 | Correlation Coefficient | 0.007 | 0.096 ** | −0.054 * | −0.054 * |
| Sig. (2-tailed) | 0.772 | 0.000 | 0.027 | 0.024 | |
| N | 1822 | 1826 | 1655 | 1783 | |
| DF9 | Correlation Coefficient | −0.124 ** | 0.025 | −0.100 ** | −0.050 * |
| Sig. (2-tailed) | 0.000 | 0.284 | 0.000 | 0.033 | |
| N | 1822 | 1826 | 1655 | 1783 | |
| DF10 | Correlation Coefficient | −0.038 | 0.065 ** | −0.127 ** | −0.135 ** |
| Sig. (2-tailed) | 0.106 | 0.005 | 0.000 | 0.000 | |
| N | 1822 | 1826 | 1655 | 1783 | |
Note. A single asterisk (*) indicates statistical significance at the 0.05 level. A double asterisk (**) indicates statistical significance at the 0.01 level.
Table 7.
Decision Factor Importance by Year of Installation.
| Decision Factor | 2013 | 2014 | 2015 | 2016 | 2017 | Change |
|---|---|---|---|---|---|---|
| Low or No Up-Front Cost | 3.02 | 3.11 | 3.08 | 3.17 | 3.14 | 4.0% |
| Expected Energy Bill Reduction | 4.15 | 4.20 | 4.21 | 4.20 | 4.13 | −0.5% |
| Positive Impact on the Environment | 4.19 | 4.23 | 4.22 | 4.28 | 4.26 | 1.8% |
| Leaving a Positive Legacy | 3.47 | 3.56 | 3.54 | 3.65 | 3.62 | 4.2% |
| Recommendations for Solar Power from Peers | 2.11 | 2.22 | 2.30 | 2.34 | 2.36 | 11.7% |
| Reputation of My Solar Installer | 3.34 | 3.56 | 3.63 | 3.60 | 3.62 | 8.4% |
| Perceived Honesty of My Solar Sales Representative | 3.83 | 3.88 | 3.91 | 3.91 | 3.90 | 2.0% |
| Exposure to Public Information About Solar | 3.33 | 3.38 | 3.37 | 3.32 | 3.24 | −2.7% |
| Reduced Dependency on My Power Company | 3.77 | 3.78 | 3.89 | 3.97 | 3.89 | 3.2% |
| The Timing of Life Events Enabled My Solar Installation | 2.97 | 3.07 | 3.04 | 3.07 | 3.11 | 4.9% |
| Other | 3.07 | 2.78 | 3.06 | 2.60 | 2.89 | −5.9% |
© 2020 by the authors. Licensee MDPI, Basel, Switzerland. This article is an open access article distributed under the terms and conditions of the Creative Commons Attribution (CC BY) license (http://creativecommons.org/licenses/by/4.0/).
Share and Cite
MDPI and ACS Style
Schelly, C.; Letzelter, J.C. Examining the Key Drivers of Residential Solar Adoption in Upstate New York. Sustainability 2020, 12, 2552. https://doi.org/10.3390/su12062552
AMA Style
Schelly C, Letzelter JC. Examining the Key Drivers of Residential Solar Adoption in Upstate New York. Sustainability. 2020; 12(6):2552. https://doi.org/10.3390/su12062552
Chicago/Turabian StyleSchelly, Chelsea, and James C. Letzelter. 2020. "Examining the Key Drivers of Residential Solar Adoption in Upstate New York" Sustainability 12, no. 6: 2552. https://doi.org/10.3390/su12062552
Note that from the first issue of 2016, this journal uses article numbers instead of page numbers. See further details here.