Article

Mass Transfer Performance Study for CO2 Absorption into Non-Precipitated Potassium Carbonate Promoted with Glycine Using Packed Absorption Column

by
Nur Farhana Ajua Mustafa
1,
Azmi Mohd Shariff
1,*,
Wee Horng Tay
1,
Hairul Nazirah Abdul Halim
2,3 and
Siti Munirah Mhd Yusof
1
1
CO2 Research Centre (CO2RES), Institute of Contaminant Management, Chemical Engineering Department, Universiti Teknologi PETRONAS, Seri Iskandar 32610, Perak, Malaysia
2
School of Bioprocess Engineering, Universiti Malaysia Perlis, Kompleks Pengajian Jejawi 3, Arau 02600, Perlis, Malaysia
3
Center of Excellent for Biomass Utilization, Universiti Malaysia Perlis, Arau 02600, Perlis, Malaysia
*
Author to whom correspondence should be addressed.
Sustainability 2020, 12(9), 3873; https://doi.org/10.3390/su12093873
Submission received: 5 February 2020 / Revised: 6 March 2020 / Accepted: 24 March 2020 / Published: 9 May 2020
(This article belongs to the Special Issue Emerging Energy Technologies and Energy Savings)

Abstract

:
The removal of carbon dioxide (CO2) at offshore operation requires an absorption system with an environmentally friendly solvent that can operate at elevated pressure. Potassium carbonate promoted with glycine, PCGLY, is a green solvent that has potential for offshore applications. For high solvent concentrations at elevated pressure, the by-product of CO2 absorption consists of precipitates that increase operational difficulty. Therefore, this study was done to assess the CO2 absorption performance of non-precipitated PCGLY with concentration 15wt%PC+3wt%GLY, which is known to have comparable solubility performance with MDEA. A packed absorption column was used to identify the CO2 removal efficiency, mass transfer coefficient in liquid film, k l a e , and overall volumetric mass transfer coefficient, K G a v . A simplified rate-based model was used to determine k l a e and K G a v based on the experimental data with a maximum MAE value, 0.057. The results showed that liquid flow rates and liquid temperature gives significant effects on the k l a e and K G a v profile, whereas gas flow rate and operating pressure had little effect. The CO2 removal efficiency of PCGLY was found to be 77%, which was only 2% lower than 1.2 kmol/m3 MDEA. K G a v of PCGLY is comparable with MDEA. The absorption process using PCGLY shows potential in the CO2 sweetening process at offshore.

1. Introduction

Carbon dioxide (CO2) concentration in the atmosphere is now in critical condition as it has reached the 406.5 ppm threshold [1]. It is considered as the peak level since the past three million years. CO2 release in Malaysia is projected to upsurge by more than 100% in 2030 [2,3]. This issue has raised concerns by the industrial sectors to use natural gas (NG) as a fuel, as it is the cleanest fossil fuel. In fact, when burned, NG can release up to 50% less CO2 than coal and 20% to 30% less than oil [4,5].
In the gas processing industry, CO2 in raw gas will be removed to its permissible concentration as it is crucial for enhancing the gross heating value of the natural gas and reducing the corrosion risk at the pipelines and equipment. It is estimated that at least 13 trillion cubic feet of NG reserves in Malaysia are left undrilled due to the high CO2 concentration, which is reaching 87% [6]. However, the current technology is still limited to process raw NG with CO2 concentration less than 10% at the onshore purification plant [7]. This problem will cause an increasing demand for NG due to the technology’s limitation in processing CO2-rich NG.
Researchers have discovered an excellent opportunity for significant CO2 capture at offshore platforms which can capitalize high pressure of raw NG from the gas reservoir for CO2-CH4 separation [8]. However, it is still in its preliminary stage [8,9]. This is due to the current technology for CO2 capture at offshore, which is the membrane technology, have several issues that affect membrane viability at high pressure offshore conditions, such as plasticization of the membrane and an aggressive gas environment [8,10,11].
The maturity of the chemical absorption technology is well understood for CO2 removal at industrial scale [12].
Today, alkanolamines solvent used in the packed absorption column causes several effects to the environment, such as corrosion, high toxicity, and degradation of products that need to be handled thus far [13,14,15,16,17].
Therefore, many studies have been devoted to develop a “green” solvent that can perform better than the commercialised alkanolamine. The idea of “green” solvents expressed the goal to minimized the environmental impact resulting from the use of the chemical solvent [18]. Grant et al. [19] reported that the UNO MK3 process, which involved potassium carbonate (PC) as a solvent, is significantly better than MEA on ecotoxicity and carcinogen emission. The key advantages of PC are low corrosivity, high chemical solubility of CO2, low toxicity, low degradation rate, requires low solvent cost, and ease of regeneration as compared to amine-based solvents [20,21,22]. In addition, as mentioned by Kim et al. [23], potassium carbonate (PC) is an effective solvent for absorbing CO2 from synthesis gas at elevated temperature and pressure. The characteristic permits the operation for CO2 capture at an offshore platform. However, this solvent has a major disadvantage, which is sluggish mass transfer rate in liquid phase. This will consequently result in a poor mass transfer performance and subsequently, large and expensive equipment will be needed [14,20,24,25].
The absorption performance including the chemical kinetics and mechanism for CO2 and glycine was studied by Guo et al. [26]. They demonstrated that glycine is a good promoter to improve the absorption performance. Recent literature [27] has studied the capture rate of precipitating potassium carbonate promoted with glycine (PCGLY). The precipitating carbonate promotes high cyclic loading and low reaction enthalpy, which lead to low energy requirement for regeneration process. However, the highly concentrated PCGLY produces some operational problems such as flooding in the absorption column and intermittent operation, which is caused by blockage at the operation start-up [28]. The precipitation of the solvent in the form of crystal and fouling has severe risks to the operation, which will subsequently reduce the CO2 absorption performance.
Nevertheless, a previous study by Shaikh et al. [21] on CO2 solubility in non-precipitated PCGLY showed its potential as an effective CO2 absorbent. The optimum concentration of this solvent that give promising solubility performance was also reported. It was considerably better than MEA. Other than the solubility data, mass transfer performance data are very important as they can be used for upscaling purposes. Nevertheless, no mass transfer coefficient data are available for this solvent.
Therefore, this research aimed to assess the mass transfer performance of non-precipitated PCGLY blend solvent for CO2 removal at elevated operational pressure condition. The NG sweetening process at the offshore platform was usually operated at a pressure more than 3.7 MPa [29]. Therefore, the operational condition of the bench-scale packed column was maintained at 4.0 MPa in most of the experimental sets.

2. Materials and Methods

2.1. Chemicals and Materials

The chemicals used in this experiment were potassium carbonate (PC) with 99.95% purity and glycine with 99% purity. Both chemicals were bought from Avantis Supply Sdn. Bhd. Purified CO2 were bought from Air Product Sdn. Bhd. NG was purchased from PETRONAS NGV Sdn. Bhd.

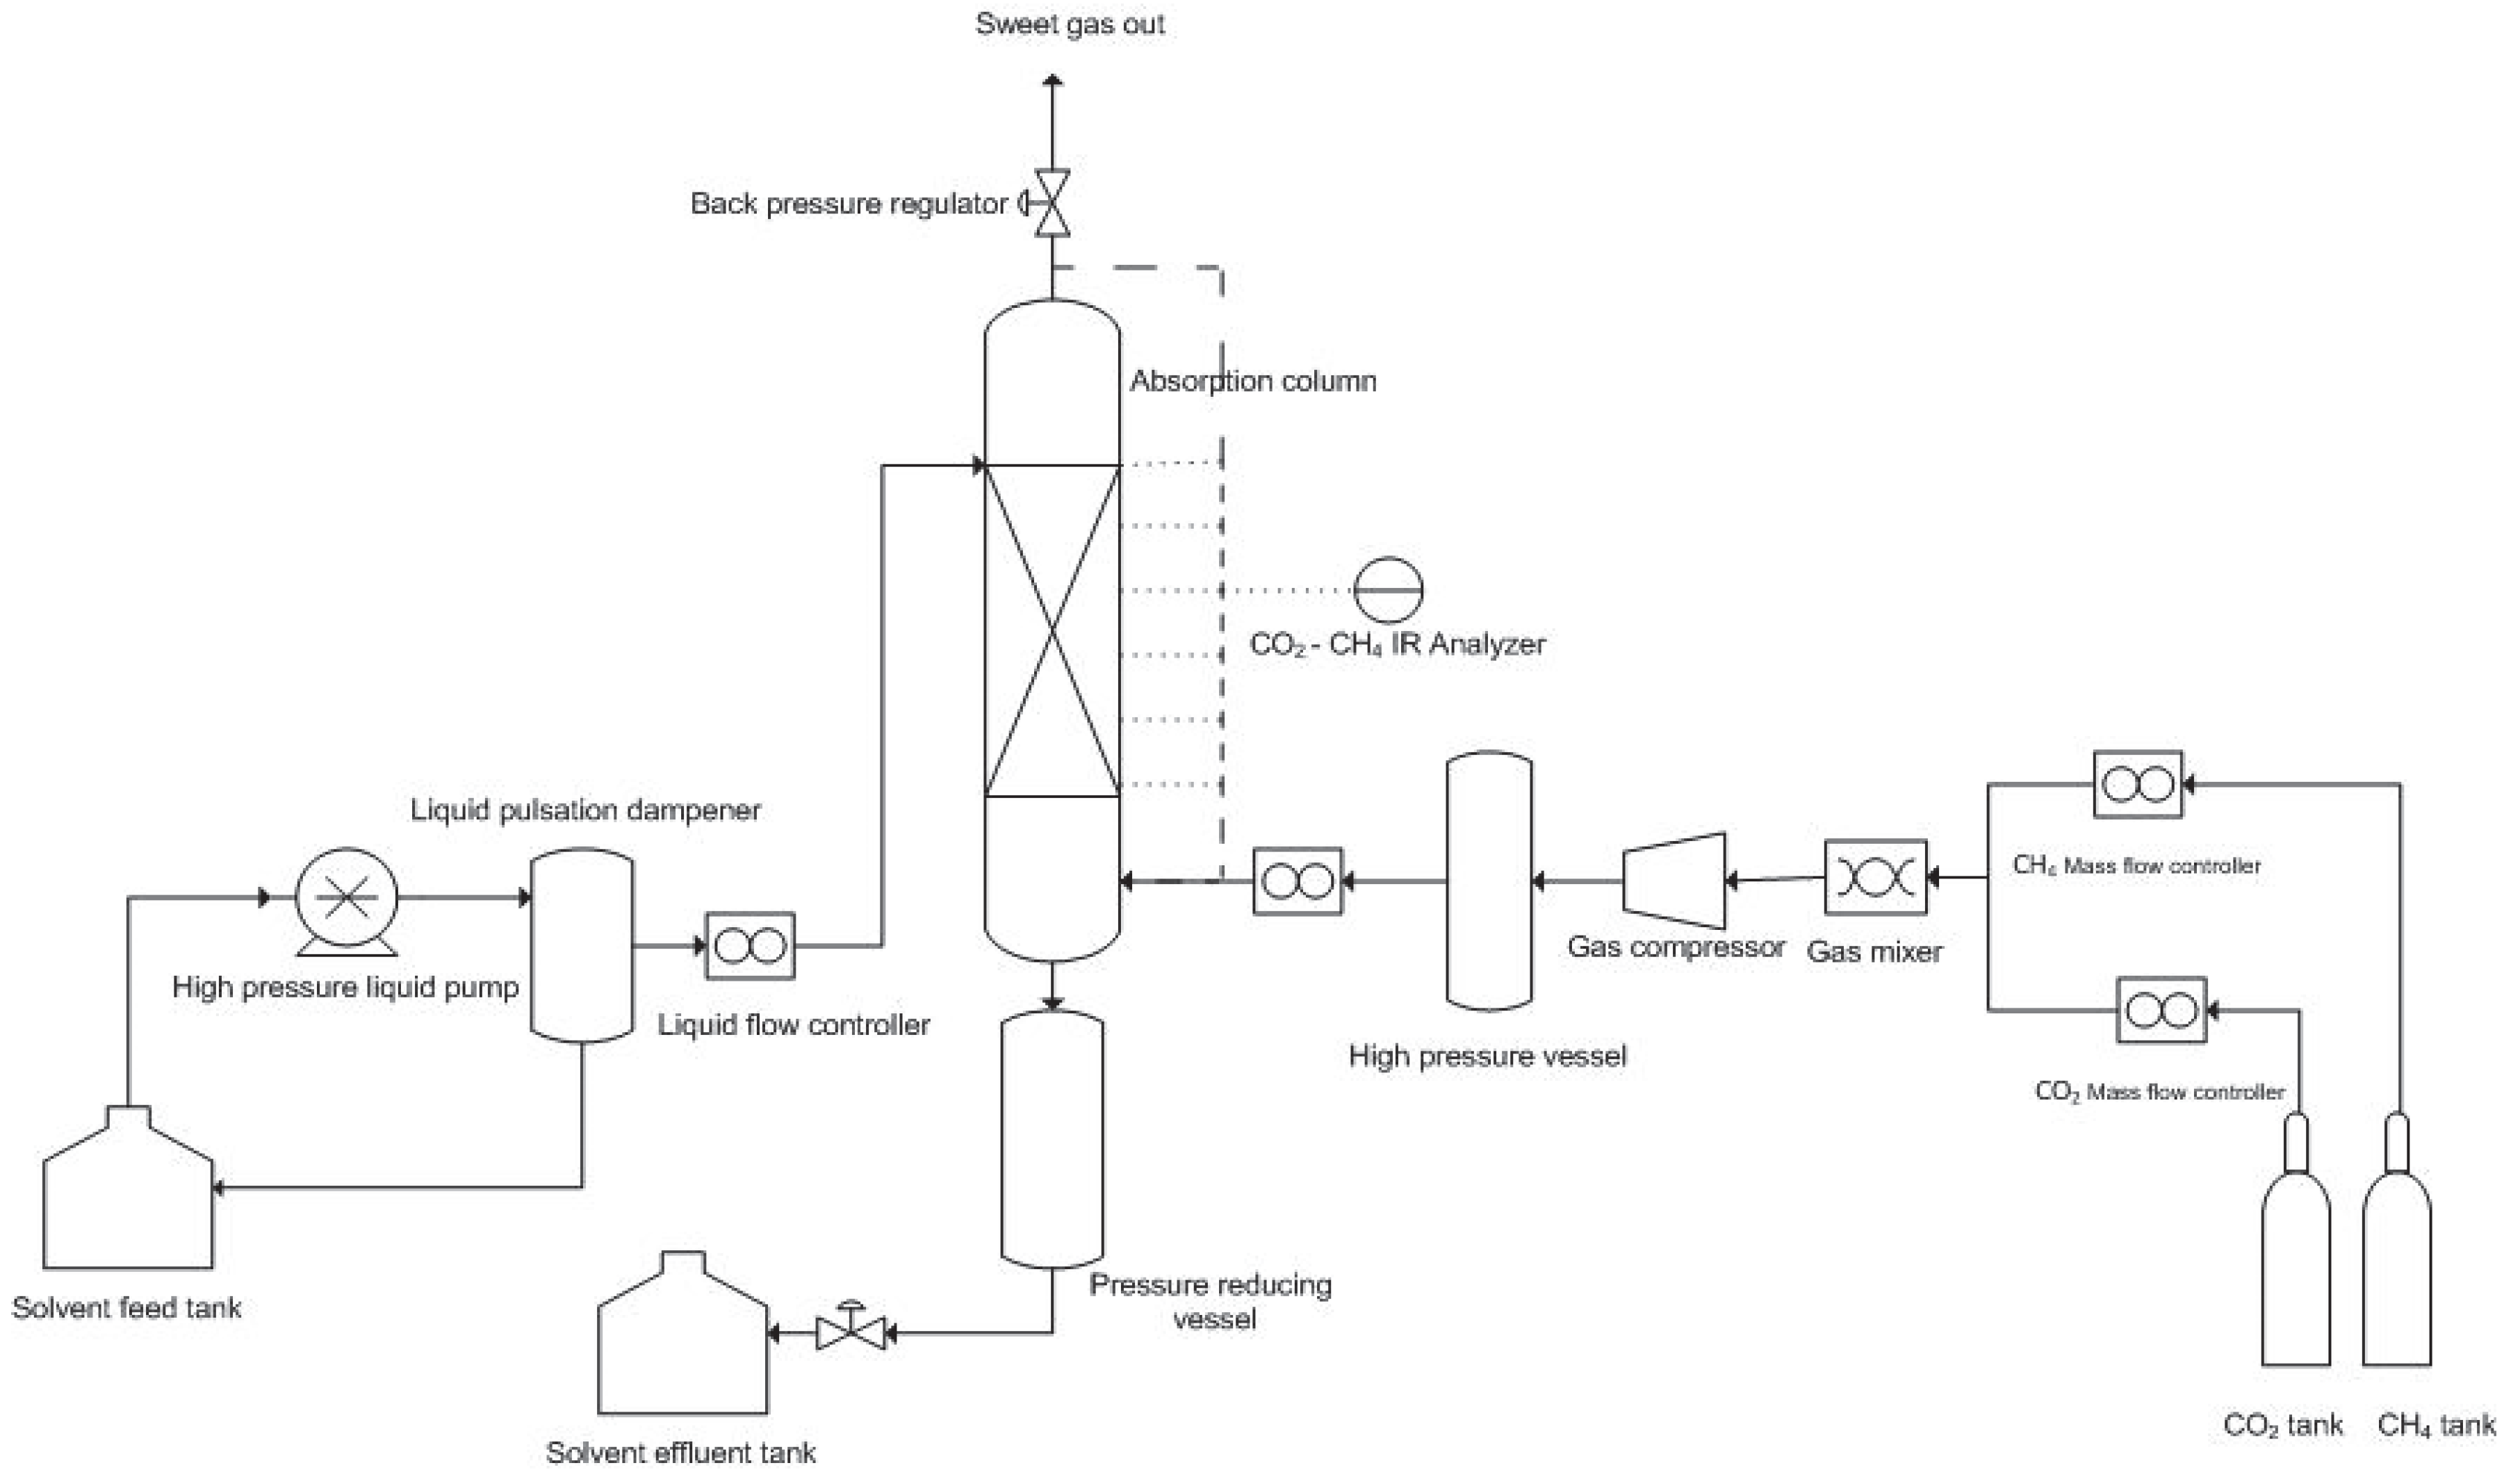
2.2. Process Description
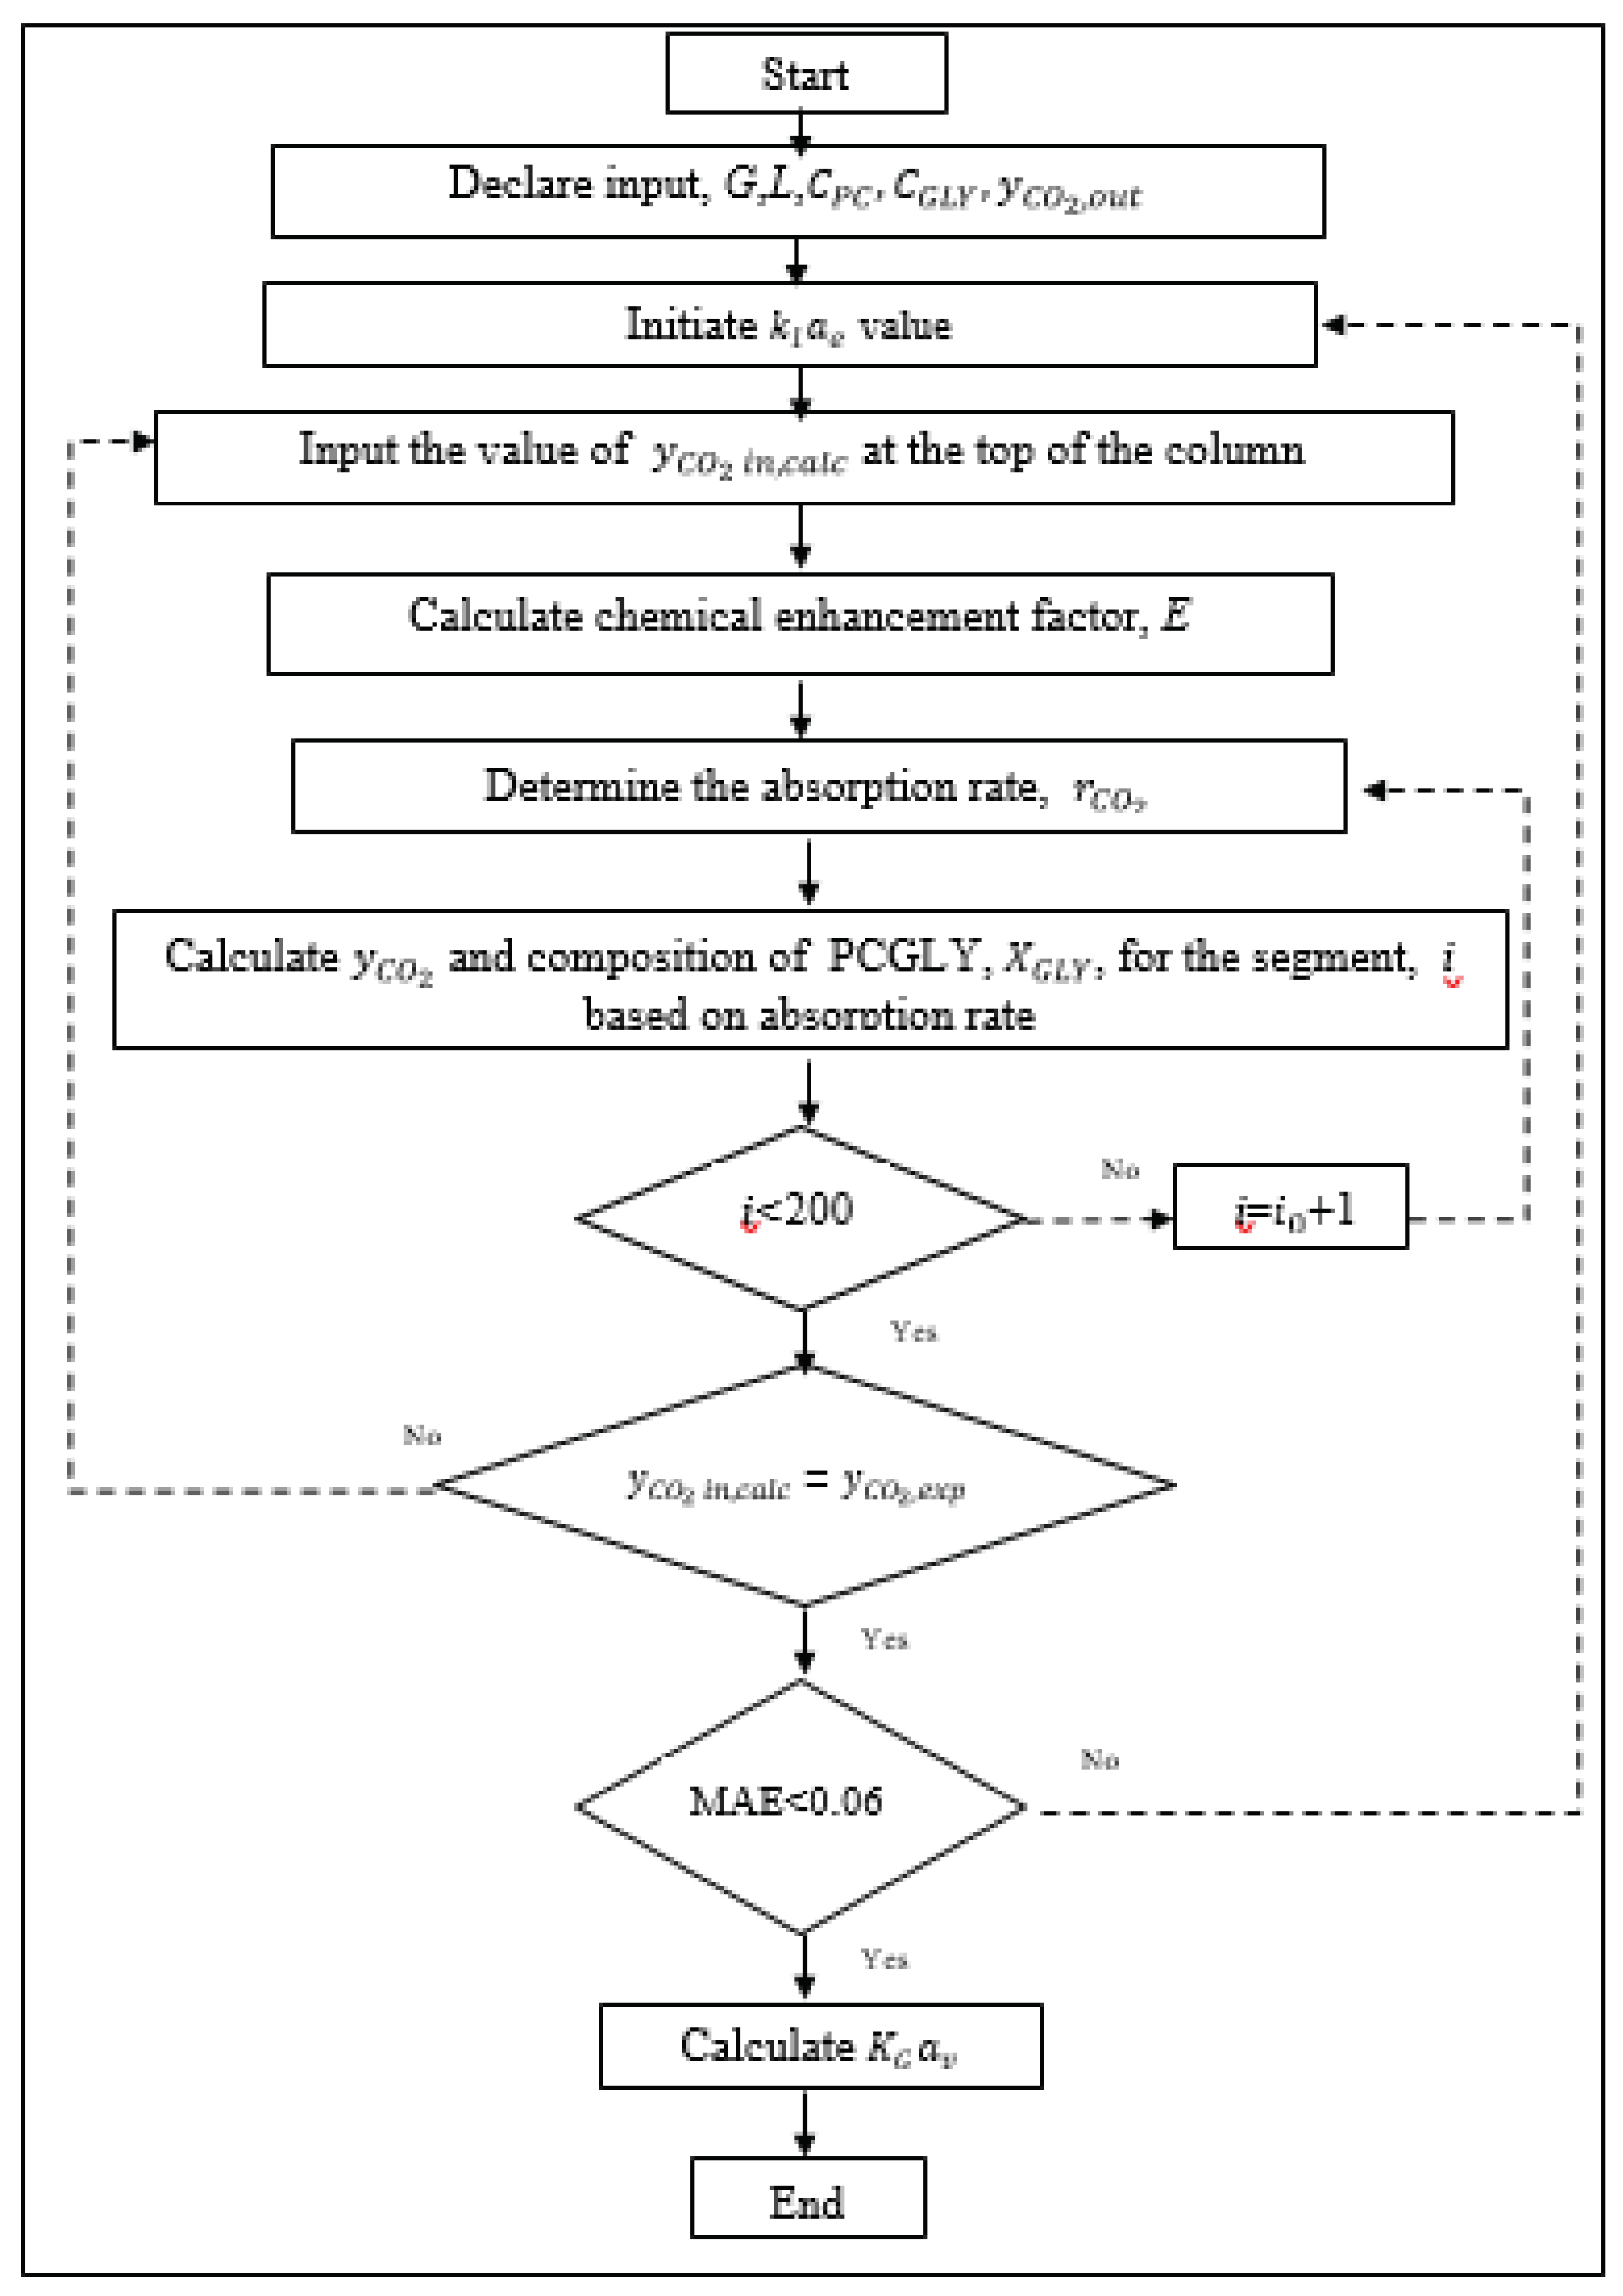
The equipment used in this study was a bench-scale packed absorption column with 0.046 m internal diameter, 2.040 m height, and packed with Sulzer metal gauze. The packing had the surface area of approximately 500 m2/m3, fabricated from 316 stainless steels and equipped with six sampling points along the column height. The absorption packed column was designed to operate at a maximum of 6 MPa. The maximum liquid flow capacity of the bench-scale packed absorption column was 0.5 L/min. The same equipment was used by Hairul et al. and Halim et al. [8,30,31], but with minor modifications on the liquid flow stabilizer system. The packed absorption column is illustrated by a schematic diagram shown below (Figure 1).
In this study, NG was used with 97% CH4. The desired CO2 concentration is achieved by setting the values using mass flow controller. CO2 and NG were first heated by a heat exchanger to 70 °C. Then, the inlet CO2 and NG concentrations were set by a mass flow controller. The mixed gas was then compressed into a high pressure vessel and flowed into an absorption packed column until the desired operating pressure was reached. Pressure of the absorption packed column was maintained by a back pressure regulator.
Gas was injected from the bottom part of the column with respective gas flow rate. Meanwhile, the liquid was pumped into the top of the column. The liquid flow rate was controlled by a liquid flow controller, which was equipped with a back pressure regulator. The pressure in high pressure gas vessel was monitored to be at least 10 bars above the column pressure to ensure that the gas can flow into the column.
Mass transfer mechanism took place in the absorber once the mixed gas was in direct contact with the liquid to create a counter current flow. In turn, CO2 in the mixed gas was absorbed into the liquid. The treated gas withdrawn through the top of the column and the CO2-rich solvent was drained into a solvent effluent tank.
The absorption performance experiments were performed in anticipation of the steady-state conditions at each sampling points were reached. Then, CO2 concentration in the gas phase along the column was determined at six equidistance sampling point across the column by using an infrared (IR) analyser.

2.3. Reactive Absorption Model for k l a e and K G a v   Determination

2.3.1. Reaction and Kinetic Mechanism of CO2 Absorption into PCGLY Blended Solvent

The mechanism involved in the CO2 absorption system can be represented by a kinetic reaction model. The overall reaction in the carbonate system can be described as follows:
C O 2 + C O 3 2 + H 2 O   H C O 3
The rate-elementary reaction step of reaction 2 is:
C O 2 + O H   H C O 3
In this case, the solvent is in the alkaline form with pH value of 1.09. Since the pH value is more than 10, therefore the contribution of the direct reaction between CO2 and H2O is assumed negligible [14].
The overall reaction between CO2 and glycine takes place via the zwitterion mechanism, where CO2 binds with the amino group to form a zwitterion, which rapidly deprotonates and exchanges H+ with water as follows [26]:
R R N H + C O 2     R R N + H C O 2
R R N + H C O 2     R R N C O 2 + H +
The rate of reaction of PCGLY is shown in Equation (5):
R c o 2 = [ C O 2 ] ( k O H [ O H ] + k G L Y [ G L Y ] )      
The k O H value can be obtained using the correlation reported by Thee et al. [32], whereas k G L Y correlation was reported by Guo et al. [26]:
k O H ( M 1 s 1 ) = 2.53 × 10 11 e x p   4311 T ( K )
k G L Y ( M 1 s 1 ) = 1.24 × 10 12 e x p   5459 T ( K )
During the reaction between PCGLY and CO2, part of the carbonate is converted to bicarbonate while glycine is converted into glycinate. Glycine is an acid that exist in aqueous solution as deprotonated base form. According to Guo et al. [26], the base form of the amino acid being the dominant reactive species compared to OH where the carboxylic acid group in amino acid deprotonated at alkaline conditions. The reaction rate is improved due to the reaction of deprotonated amines group. The deprotonated part of OH in aqueous solution is ionized by glycine to promote CO2 absorption.

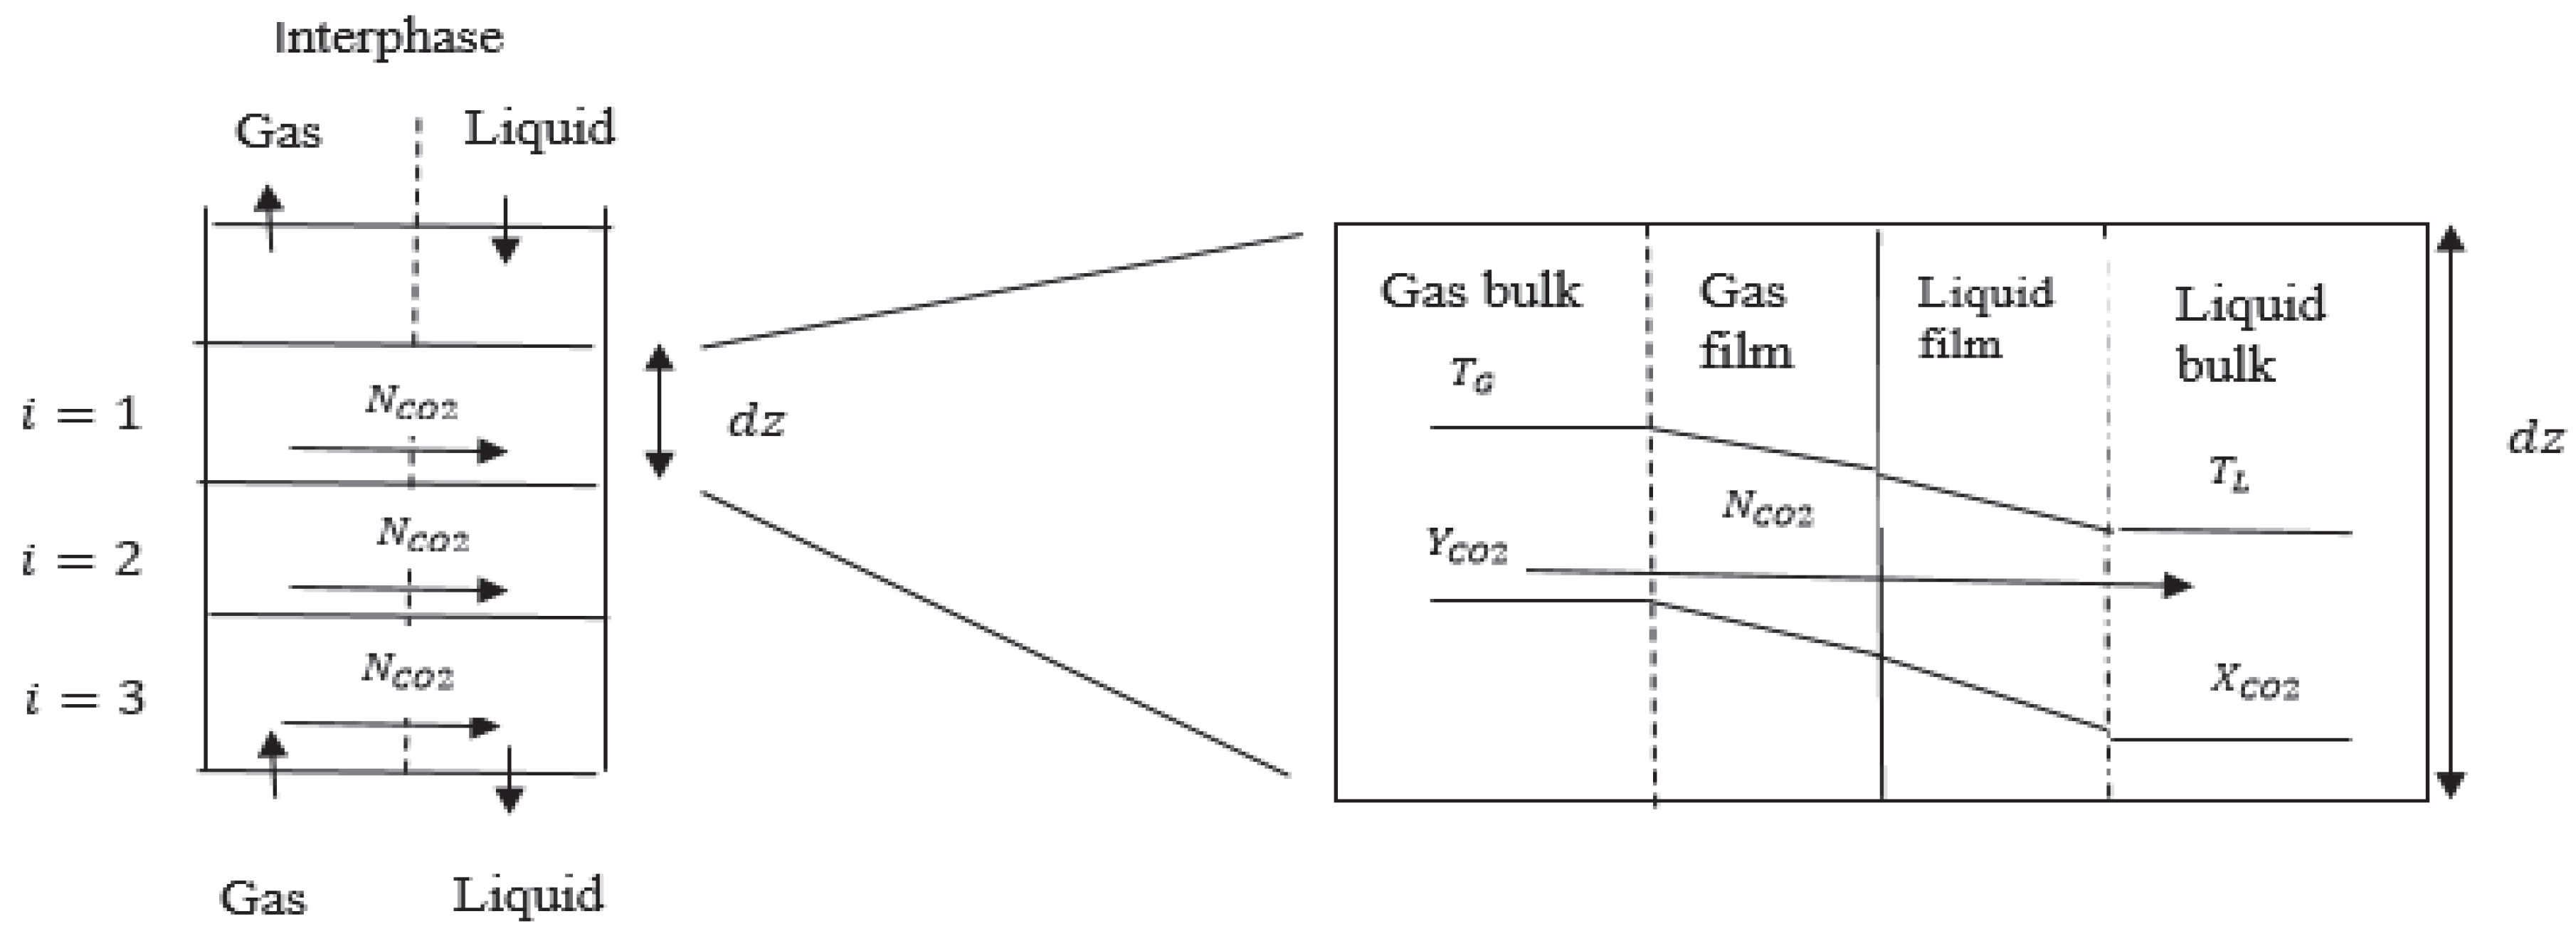
2.3.2. Two-Film Theory

The CO2 absorption mechanism can be considered as according to the two-film theory, where the equilibrium is deemed at the liquid-gas interphase and the mass transfer resistance between the liquid and gas phases is added in order to obtain the overall resistance [33]. This concept can be applied to determine the overall coefficient by combining the individual coefficient, as shown by Equation (8):
K G a e =   (   1 k g a e + H C O 2 k l a e E     ) 1
where   K G denoted as the overall mass transfer coefficient in the gas phase,   a e is the effective mass transfer area in the packed column, H C O 2 is the Henry’s law constant, and   E   is the chemical enhancement factor of PCGLY, and k l and   k g is the mass transfer coefficient of liquid and gas film, respectively. In this case, the CO2 absorption into PCGLY is considered as liquid-film control. Therefore, k g has a negligible effect on K g and the first term in Equation (4) can be omitted to be as shown in Equation (9):
K G a e =   ( H CO 2 k l a e E     ) 1
K G   a v   was then calculated by the formula given Equation (10):
K G   a v   = K G a e / V c e l l
Where V c e l l is the volume of single cell of the infinitesimal element as illustrated in Figure 2 in Section 2.3.4.

2.3.3. Reaction Model

The overall CO2 absorption rate may be presented as follows:
r C O 2 = K G a e   ( P C O 2 P C O 2   * )
where P C O 2 indicated as the CO2 partial pressure and P C O 2   * indicated as the CO2 partial pressure at equilibrium. As the kinetic of the reaction is fast, P C O 2   *   is negligible [34,35].
Equation (9) is substituted into Equation (11) to give Equation (12) as follows:
r C O 2 = P C O 2 H C O 2 / k l a e E
The effect of chemical kinetics of the liquid phase on mass transfer is indicated by E , which was introduced by Wellek et al. [36] as shown in Equation (9). E is dependence on the infinite enhancement ( E i n f ) and Hatta number (Ha).
E = 1 + 1 [     (   1 E i n f 1   ) 1.35 +   (   1 E 1 1   ) 1.35 ] 1 1.35
where,
E i n f = 1 + D O H C O H b O H D C O 2 l C C O 2 i +   D G L Y C G L Y b G L Y D C O 2 l C C O 2 i
E 1 = H a t a n h ( H a )
H a = D C O 2 l   ( ( k O H C O H + k G L Y C G L Y ) k l o
where D O H denoted as the diffusivity coefficient of hydroxide ion in the liquid, C G L Y is the molar concentration of glycine in the liquid, b is the reaction’s stoichiometric factor, C C O 2 i is the CO2 molar concentration at the interphase, D C O 2 l is the CO2 molecular diffusivity in the liquid, and H a is the Hatta number. The values of k G L Y and k O H are the reaction rate constants given by Equations (6) and (7). The correlations of physical parameters of packed absorption column specifically on the hydraulic, and effective areas were presented by our previous work [37].
CO2 molar concentration at the interphase indicated in Equation (14) may be determined as according to the Henry’s law equation, shown as Equation (17):
C c o 2 i = P C O 2     H c o 2
where P C O 2 is the CO2 partial pressure and H C O 2 is the CO2 Henry’s law constant.
Henry’s law can be used to predict the physical solubility of CO2 in PCGLY. In this work, the equation for Henry’s Law constant was accounted for potassium carbonate only since the low concentration of promoter was usually assumed to have no effect on gas solubility [38,39]. The equation of Henry’s Law is given as in Equation (18) [39]:
log H C O 2 = 0.125   m + 5.30 1140 T ( K )
The CO2 diffusivity in carbonate solution can be approximated using Equation (19) [40,41].
D C O 2 , l = D C O 2 w a t e r   ( μ w a t e r / μ l ) 0.82
where,
D C O 2 w a t e r = 2.35 × 10 6 exp ( 2199 T )
μ w a t e r = 1.86 × 10 6 exp ( 16400 RT )
The liquid viscosity of 15wt.% PC + 3 wt.% GLY can be approximated using the correlation provided by Shuaib et al. [15], as shown in Equation (22):
μ l = 185.701 exp ( 0.016 ) T

2.3.4. Mass Balance

To obtain k l a e and K G a v in the system, the calculations for the system can be conducted using the mass balance method. The mass balance of the absorption model considered a few assumptions as follows:
  • The system is at steady-state operation.
  • Fast reaction mechanism occurs in the liquid film of the gas-liquid interface.
  • The gas and liquid flow rates are constant throughout the column.
The CO2 concentration profile at different positions of the column can be determined using the one-dimensional mass balance equation as follows:
d N C O 2 g d z = d ( G Y C O 2 ) d z = r C O 2
where N C O 2 g denoted as CO2 molar flux,   G is the gas flow rate over a unit of column’s cross sectional area,   d z is the step size in z direction, and Y C O 2 is the CO2 mole fraction in the gas phase. Figure 2 illustrates the gas absorption system in an infinitesimal step size of the absorption packed column for mass balance.
The chemical mole fraction in the solvent may be estimated by calculating the mass balance over the column height step size, as shown in Equation (24):
X P C G L Y , i = X P C G L Y . i + 1 + ( Y C O 2 i + 1 Y C O 2 i ) b G L      
where X P C G L Y is the mole fraction of active PCGLY in the water and L is the liquid molar flow rate.
Figure 3 shows the simplified flowchart of CO2 absorption simulation model.
Since correlation to determine k l a e value for Sulzer gauze packing is not available, it was back-calculated using simplified rate-based model as shown in Figure 3. The absorption column height was divided into a number of segments with step size of d z . The solvent and CO2 concentration at the inlet were known. The CO2 absorption in packed column was computed by the iteration method in 200 segments, i of column height as shown in Figure 3. The modelling procedure started from the uppermost part of the column with known PCGLY concentration and initial guess of CO2 concentration at the outlet stream. The model was solved by computing the chemical enhancement factor, absorption rate, and CO2 composition for each segment using Equations (13), (14), and (23), respectively. The CO2 concentration at the final segment of the column was then compared with the experimental outlet CO2 concentration. The procedures were iterated until the computed CO2 concentration was the same as the experimental CO2 concentration at the outlet stream. Then, the computed values were compared with the experimented CO2 concentration profile along the column’s height. The adjustments of k l a e were repeated until MAE < 0.06 Then,   K G a v was identified as according to Equations (9) and (10).

2.4. CO2 Removal Efficiency

CO2 removal efficiency was calculated as follows [8,31,42]:
C O 2   r e m o v a l   e f f i c i e n c y = y i n l e t y o u t l e t y i n l e t   ×   100  
where y i n l e t is the CO2 mole fraction at the inlet of the column and y o u t l e t is the CO2 mole fraction at the last stage of packing.

2.5. Mean Absolute Error (MAE) Was Determined as Given in Equation (26)

M A E = 1 n   t = 1 n | y e x p y C a l y e x p |
where y e x p is the CO2 mole fraction in the experiment, y c a l is the calculated CO2 mole fraction, and n is the number of sampling points.

3. Results

3.1. CO2 Absorption Performance Behaviour

The performance data were plotted as CO2 concentration profile over the column height to determine k l a e and K G a v using the simplified numerical model. k l a e is a characteristic of the packing, which depends on the physical properties of the solvents such as viscosity, density, and surface tension. To observe the performance behavior, k l a e was plotted over several process parameters such as liquid flow rate, gas flow rate, column pressure, and liquid inlet temperature without chemical enhancement. On the other hand, K G a v , which is the overall mass transfer performance, was evaluated across the absorption column with chemical enhancement. In this study, the value of K G a v is not consistent along the column due to the reduction of the chemical reactant with increasing of CO2 loading in solvent. This is a practical condition to achieve the maximum CO2 loading.

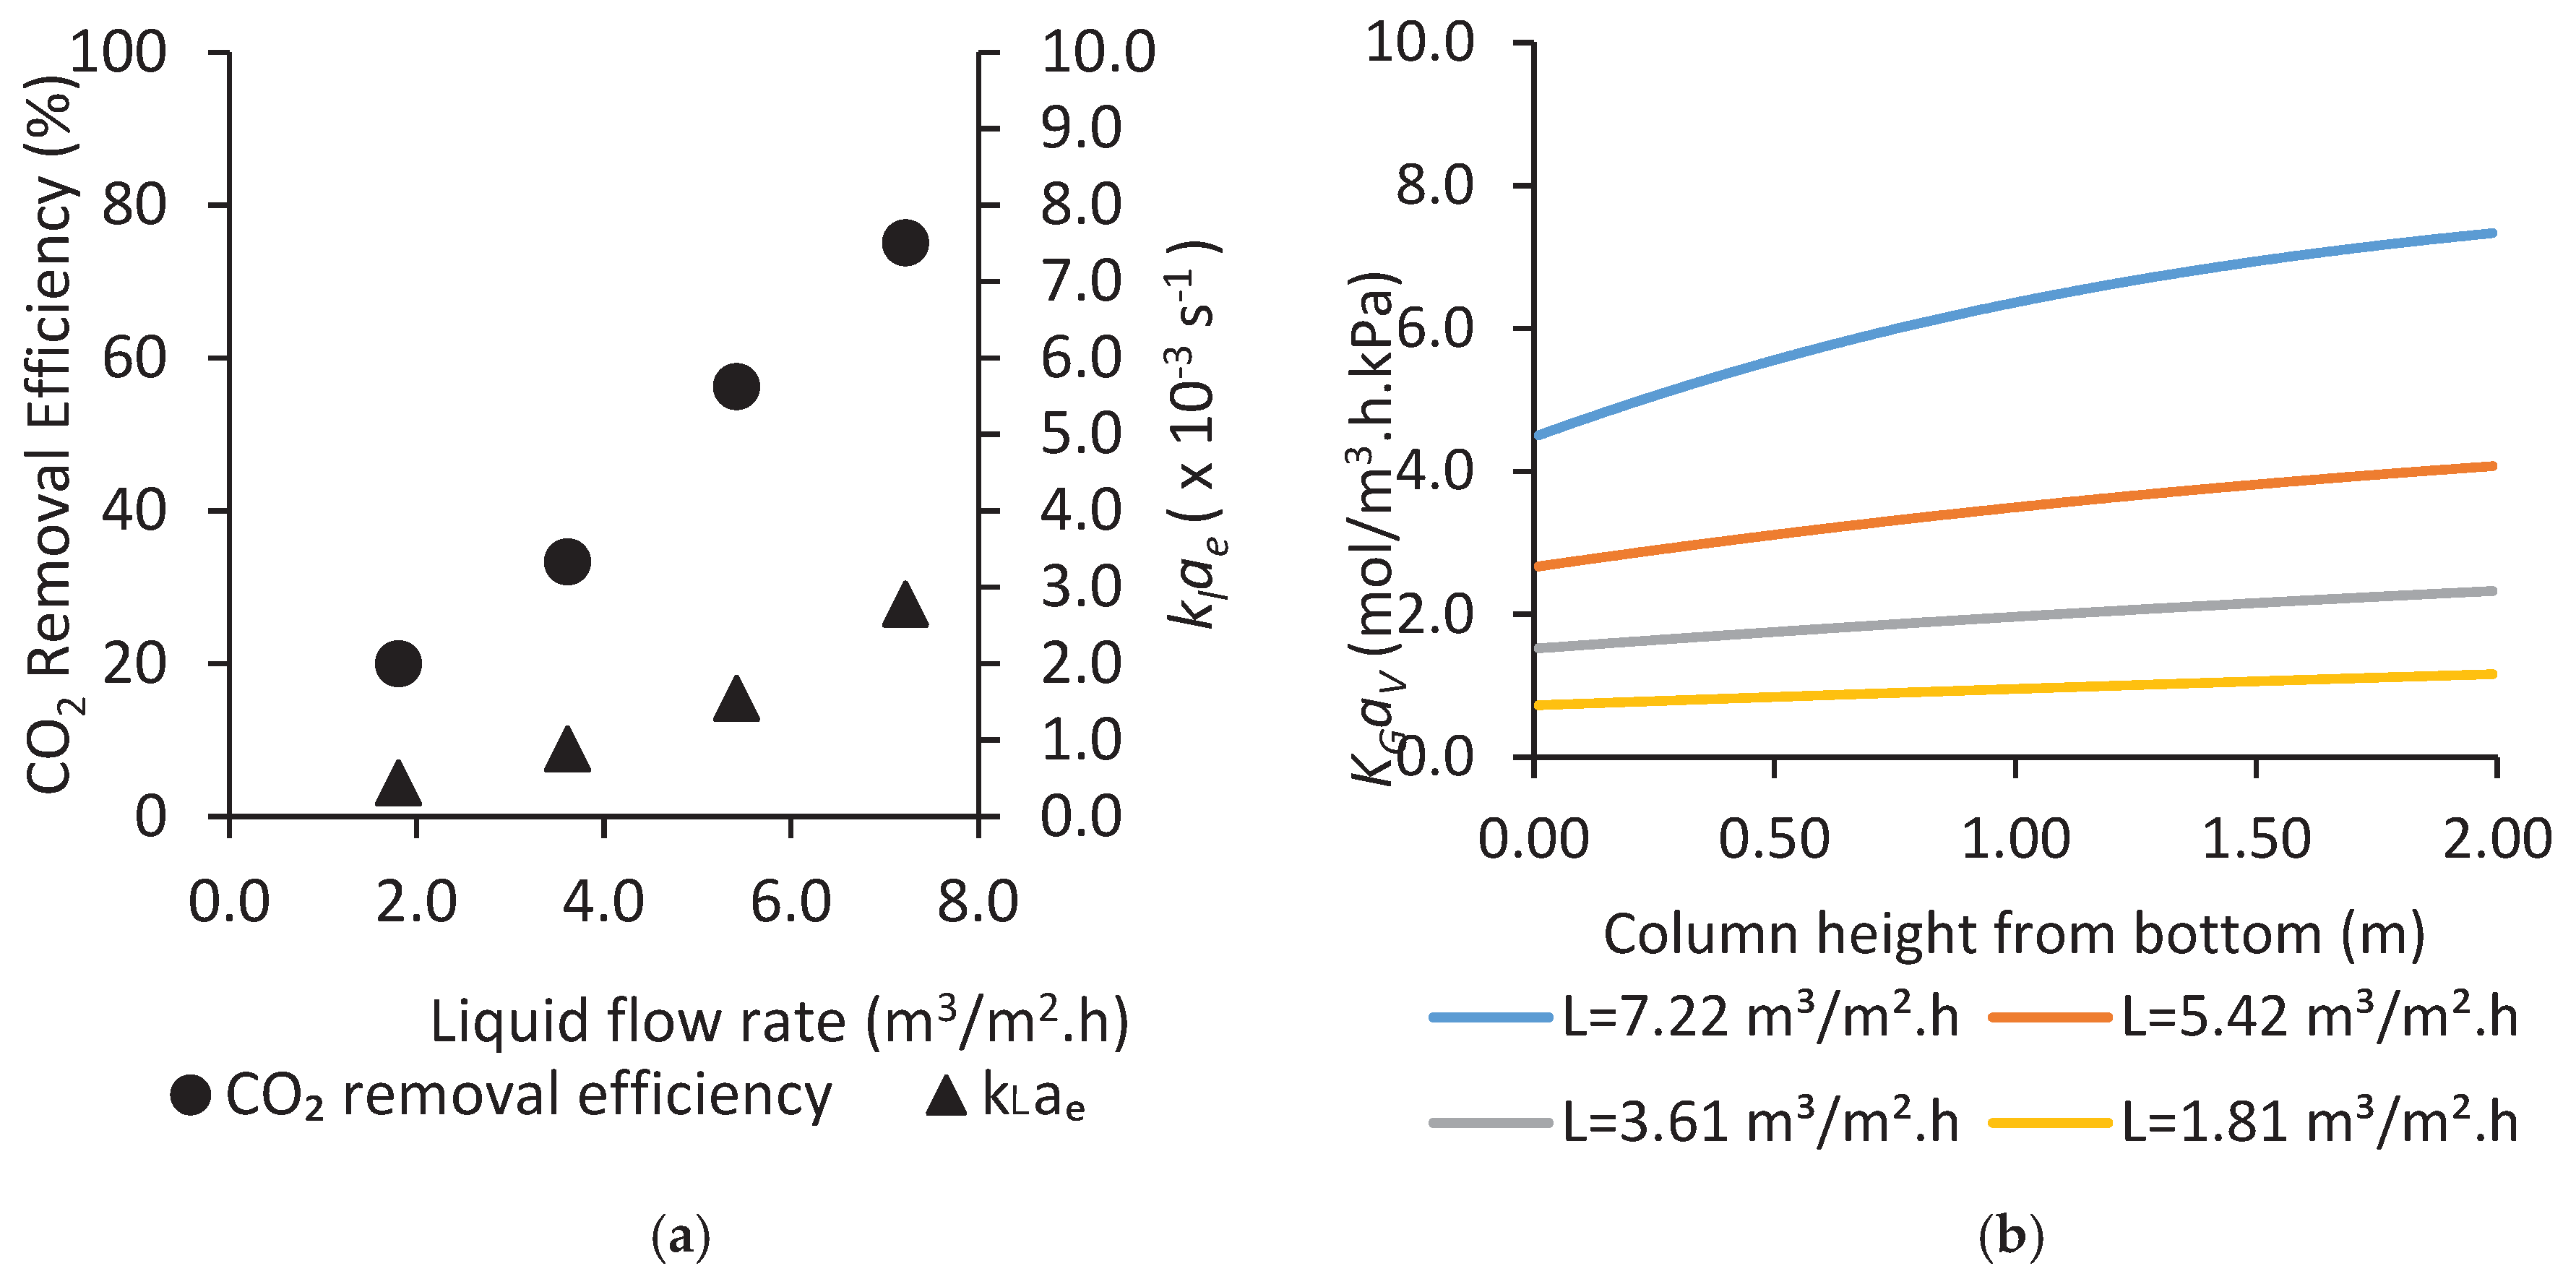
3.1.1. Effect of Liquid Flow Rate on CO2 Absorption and Mass Transfer Performances

Figure 4a,b represents the effect of liquid flow rate on CO2 removal efficiency, k l a e and K G a V value. The experiments were performed under operating conditions 41.72 mol/m2.h of gas flow rate, 4.04 MPa of operational pressure with 20 mol% of CO2 concentration in NG, and 333 K of liquid inlet temperature.
Figure 4a shows that an increase of liquid flow rate from 1.81 to 7.22 m3/m2.h causes the increase of CO2 removal efficiency, and k l a e by 55% and 1.90 × 10 3 s 1 , respectively. The enhancement of k l a e may be caused by the increase of the wetting surface area between the liquid and gas phases in the column, thus intensifying CO2 removal efficiency and k l a e . Another possible factor that contribute to good absorption performance are the turbulence flow regime induced by the liquid flow rate. [7,42,43]. The plotted data indicated that the mass transfer performance of the system was controlled by the mass transfer in liquid phase, where k l a e was mainly affected by the liquid flow rate and contact time between the liquid and gas phases [44].
Similar behaviour can be observed in Figure 4b where an increase of liquid load would result to greater K G a v value. The main cause of this behaviour is due to higher k l a e values at high liquid flow rate observed in Figure 4a which are also proportion to K G a v values [45]. Another possible cause is that the the higher liquid flow rate led to the increasing amount of available chemical molecules that are able to react with CO2 for absorption processes, thus increasing the chemical enhancement E in the solvent, which is proportional to K G a v values. It can be perceived in Figure 4b where the absorption system is controlled by the mass transfer resistance in liquid phase. Besides, a substantial reduction of K G a v can be perceived across the column height at liquid flow rate, L = 7.22 m3/m2 h. This behaviour might be caused by reducing of the chemical reactant and the reaction kinetic in the solvent.

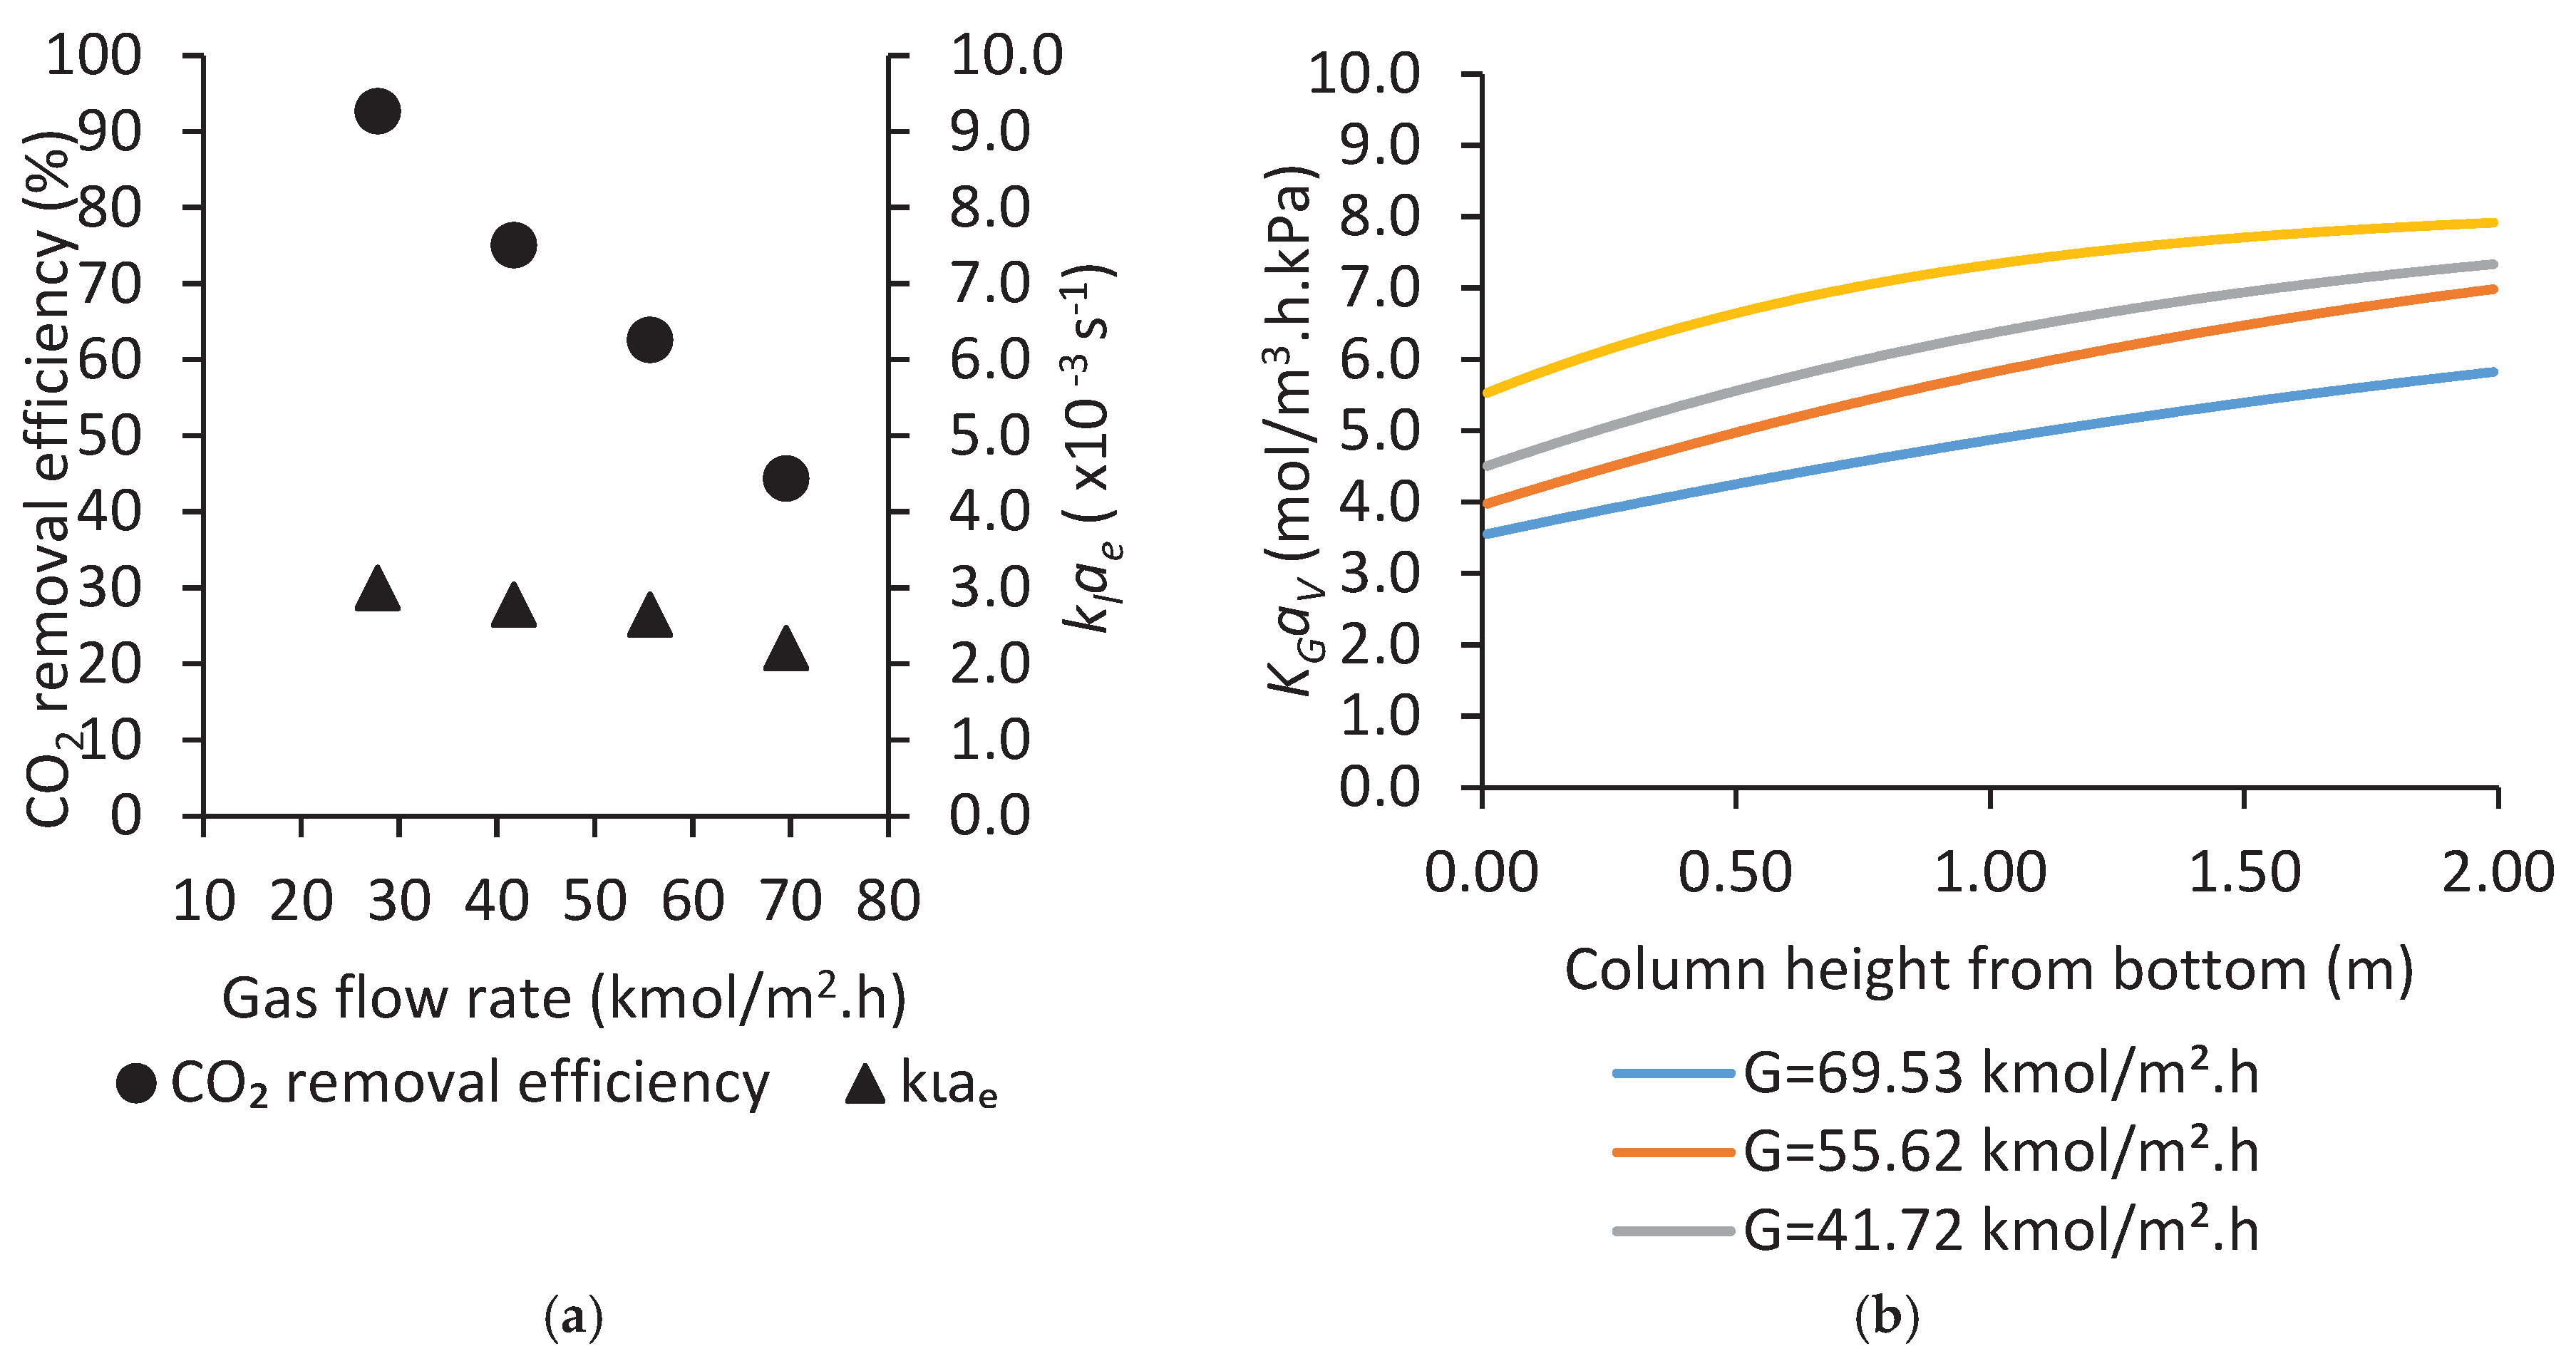
3.1.2. Effect of Gas Flow Rate on CO2 Absorption Performances

The effect of gas flow rate, specifically on CO2 removal efficiency,   k l a e and K G a v was observed as shown in Figure 5a,b. The experiments were conducted under operating conditions 7.22 m3/m2.h of liquid flow rate, 4.04 MPa of operational pressure with 20 mol% of CO2 concentration in NG, and 333 K of liquid inlet temperature.
Based on the Figure 5a, once the gas flow rate increases from 27.81 kmol/m2.h to 69.53 kmol/m2.h, the CO2 removal significantly decreases from 92.68% to 44.38%, whereas the value of k l a e is reduced from 3.00 s−1 to 2.21 s−1. At fixed liquid flow rate, an increase of gas flow rate resultantly decreases L/G, thus causing the CO2 removal efficiency to decrease. The result on CO2 removal efficiency corresponded well with that of Halim et al. and Abdul Halim et al. [7,30]. Nonetheless, the impact of the gas flow rate on k l a e is insignificant compare to the liquid flow rate parameter. This is due to the mass transfer between the liquid and gas phases which mainly depended upon the liquid phase mass transfer resistance [46].
Figure 5b shows the K G a v value reduces with increasing gas flow rate. At fixed liquid flow rate, the reaction between a limited amount of solvent with the excess amount CO2 in gas phase resulted to the reduction of chemical enhancement factor, E, thus causing the K G a v to decrease. The justification is supported by Fu et al. [47], where an increase of gas flow rate would react with more active free absorbent in PCGLY, leading to the decrease of K G a v value.

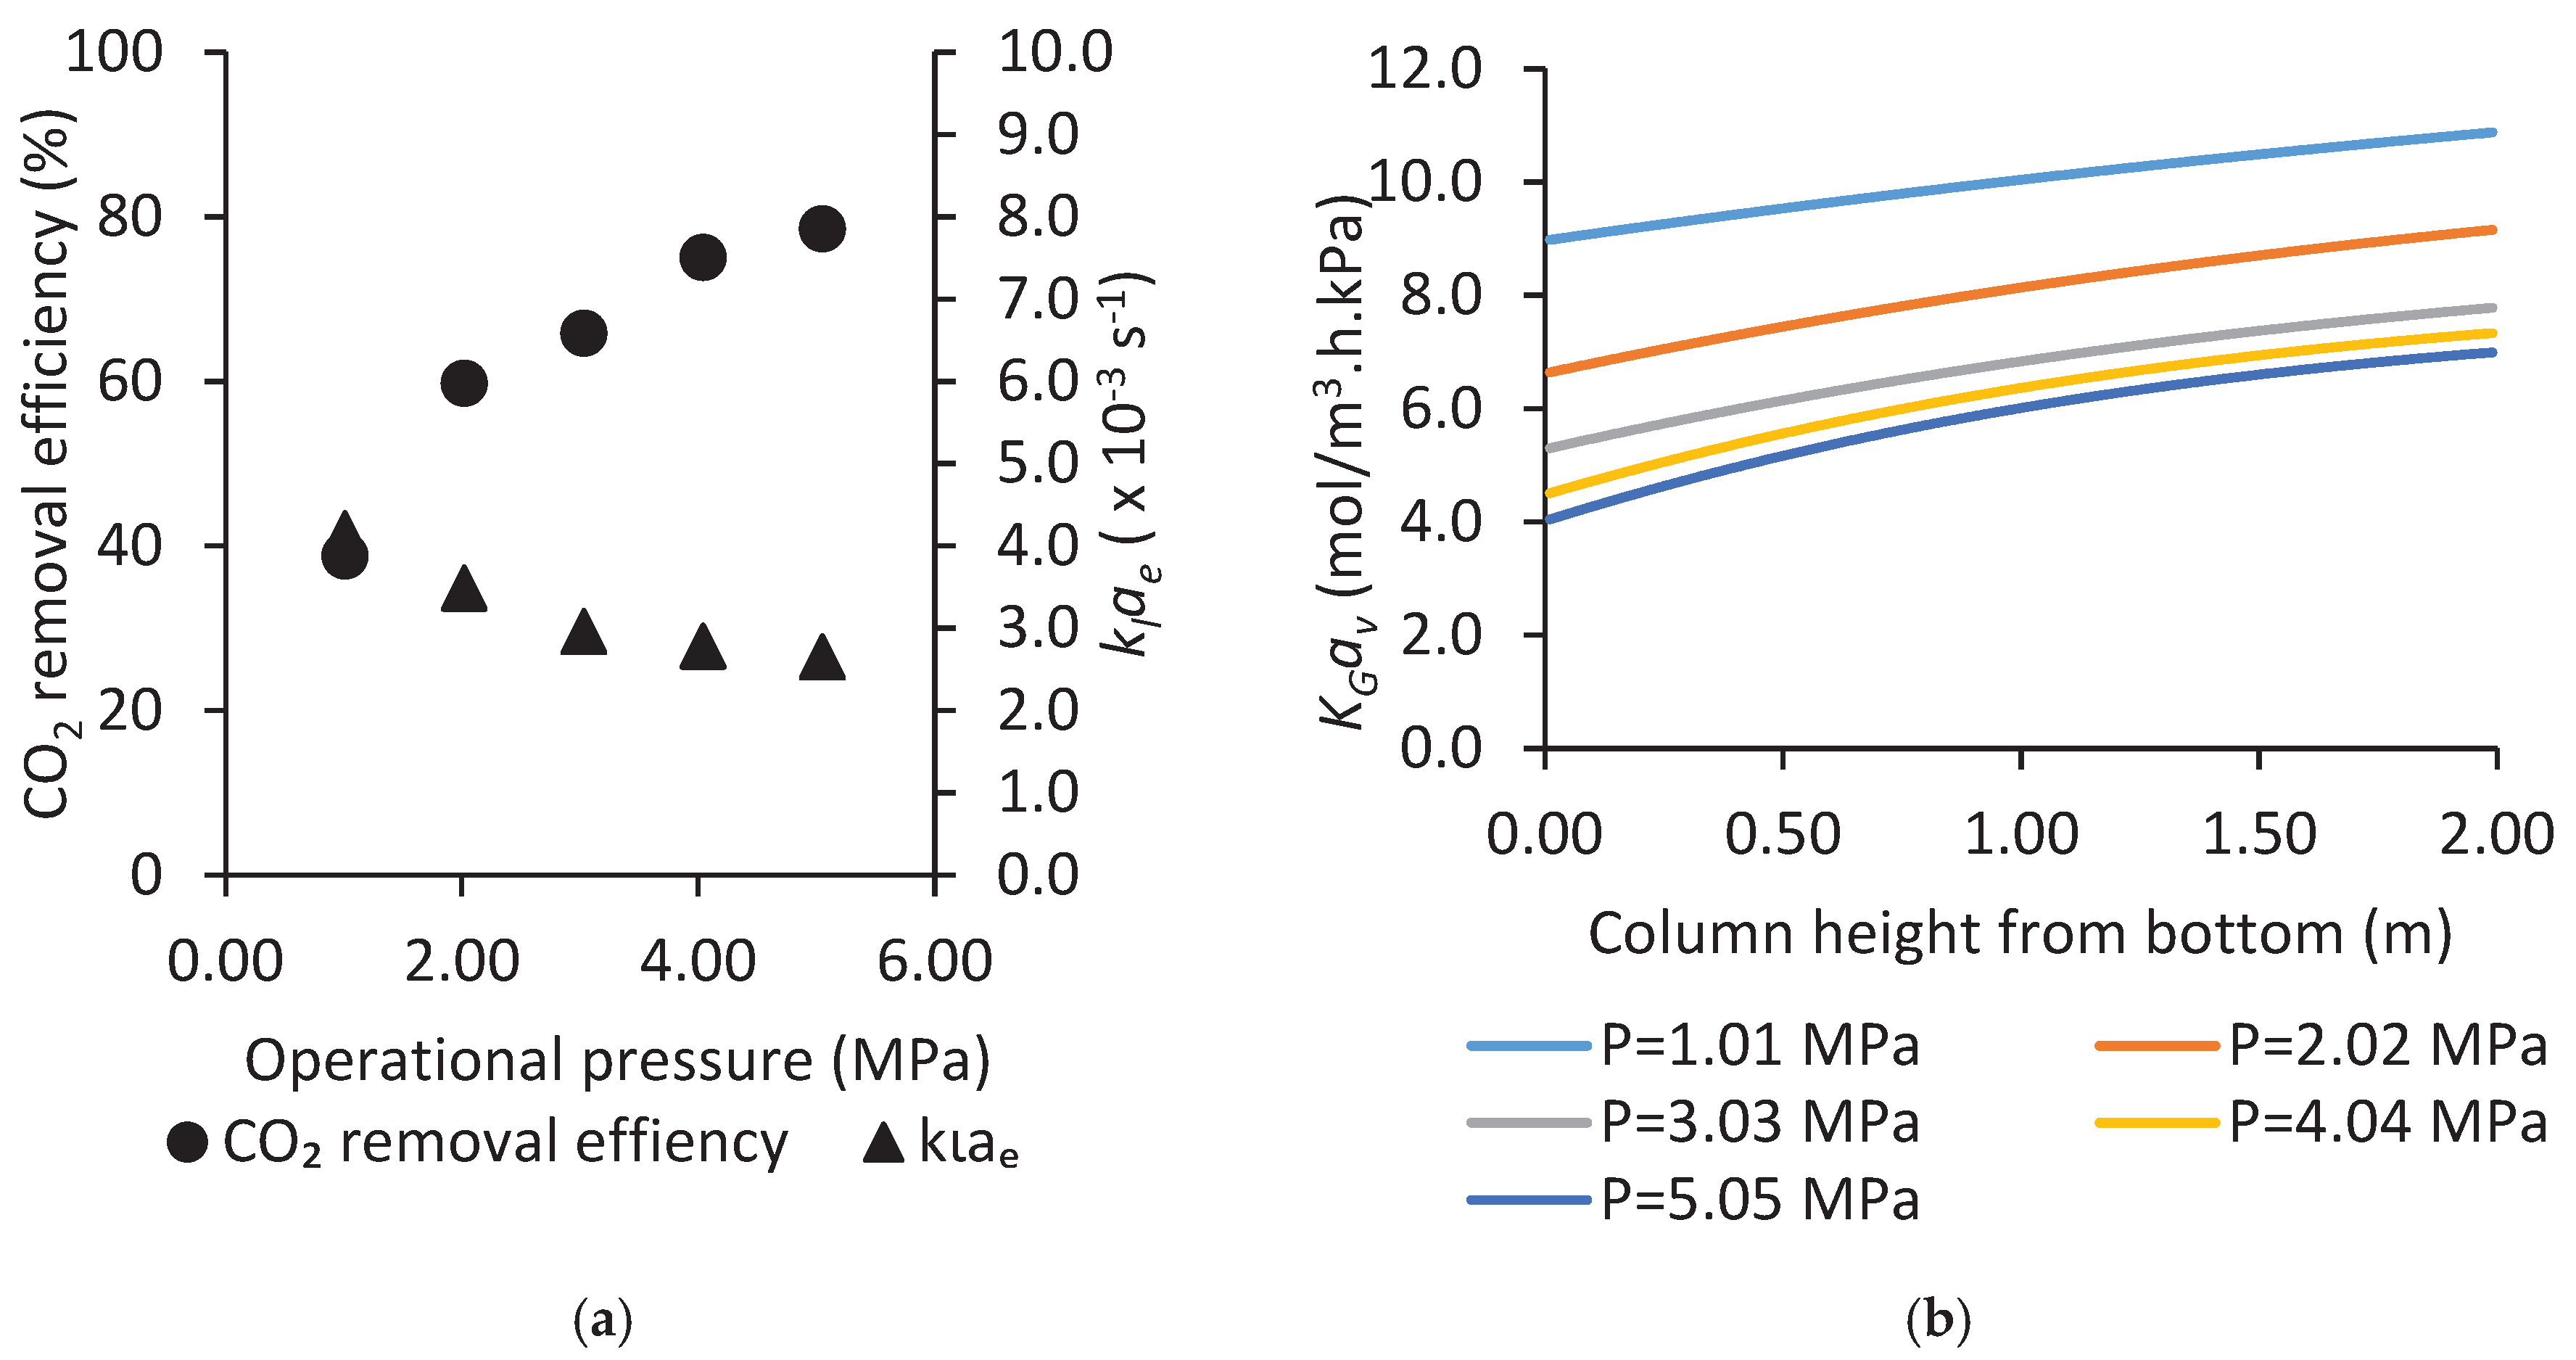
3.1.3. Effect of Operational Pressure on CO2 Absorption Performances

To study the effect of pressure on CO2 absorption performance, a set of experiments was performed over a range of pressure between 1.01 MPa and 5.05 MPa with 20 mol% CO2 inlet concentration, 7.22 m3/m2.h of liquid flow rate, 41.72 mol/m2.h of gas flow rate and 333 K of liquid inlet temperature. Figure 6a,b shows the effect of operational pressure to CO2 removal efficiency,   k l a e and K G a v .
The plotted data in Figure 6a show that if the operational pressure rises from 1.01 MPa to 5.05 MPa, the CO2 removal efficiency is enhanced from 38.80% to 78.57%, while k l a e value slightly decreases from 1.01 MPa to 3.03 MPa and behaves constantly from 3.03 MPa to 5.05 MPa. With respect to similar CO2 concentration, an increase of operational pressure will directly increase CO2 partial pressure. Therefore, the trend of the plotted CO2 removal efficiency can be related to the two-film theory, where the mole fraction driving force for separation will increase with increasing CO2 partial pressure. Based on Figure 6a, it is perceived that k l a e is slightly lower at the higher operational pressures. This may cause by the restricted diffusion between CO2 in gas phase and amount of reactive PCGLY in the liquid phase.
Figure 6b shows the K G a v profile along the absorption packed column height with pressure range between 1.01 MPa to 5.05 MPa. K G a v was observed to decrease with increasing operational pressure. The reduction of K G a v is greater when the operational pressure increases from 1 MPa to 3 MPa. Beyond that, the reduction of K G a v is insignificant. This behaviour is most likely due to the transition of the chemical reaction region from the Hatta number control to the infinite chemical enhancement control. Under infinite chemical enhancement control, the CO2 absorption is controlled by the chemical reactant diffusion in the liquid phase. A higher pressure would result in a lower mass transfer coefficient.

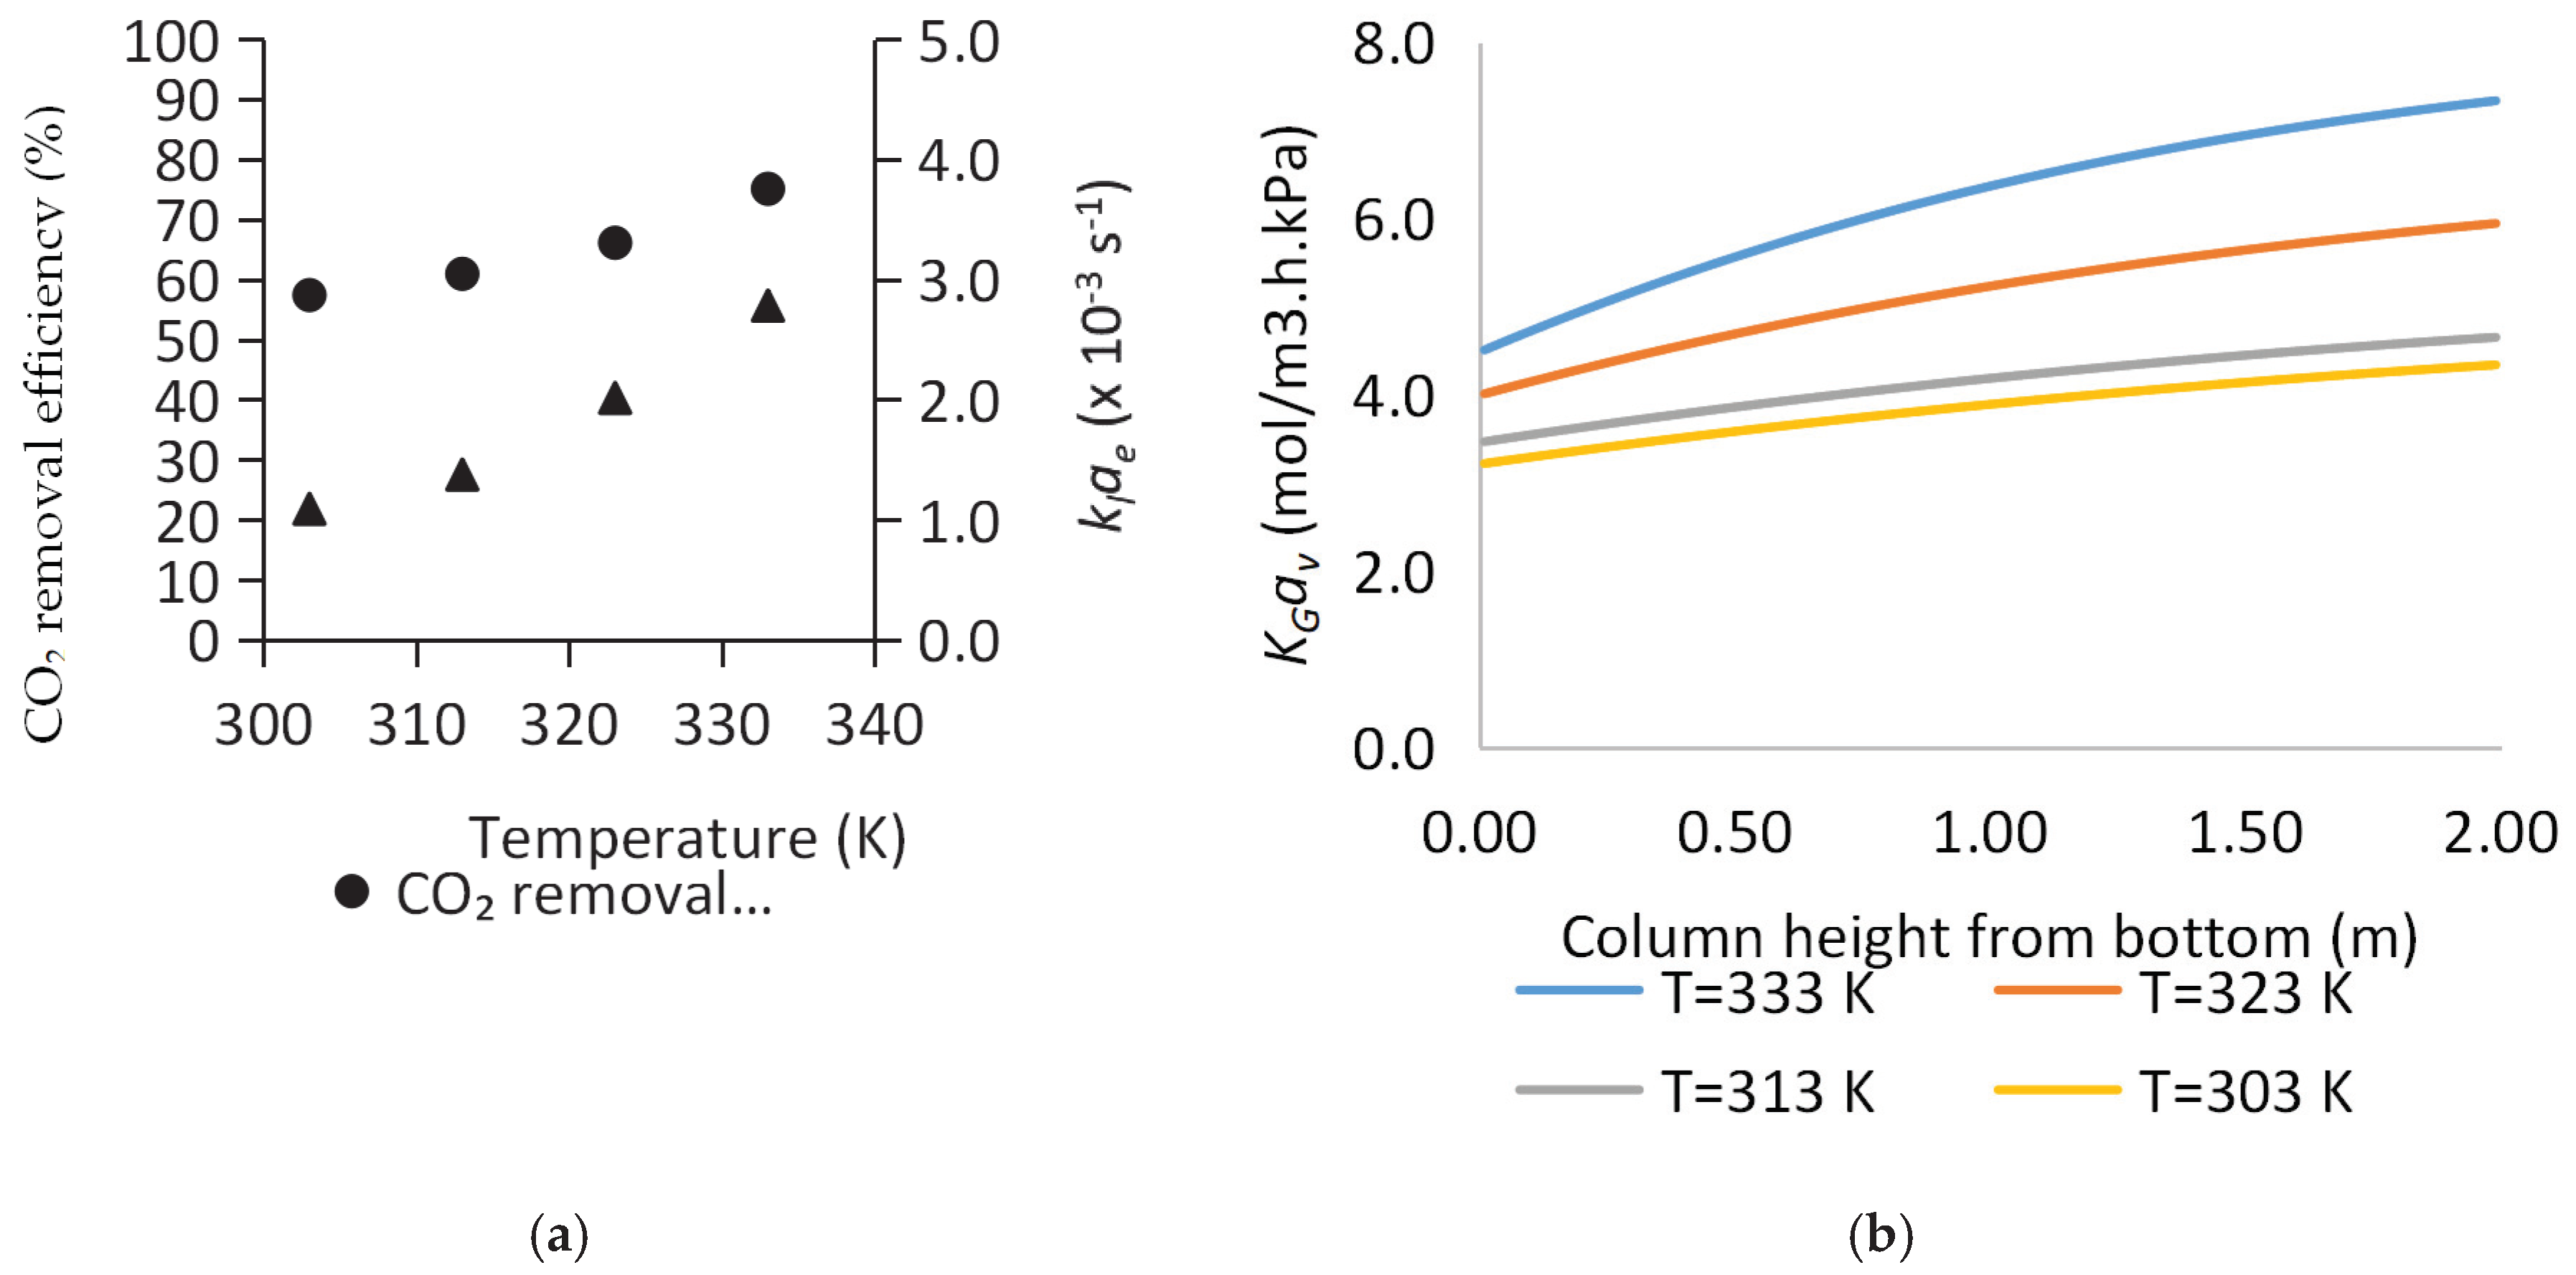
3.1.4. Effect of Inlet Liquid Temperature on CO2 Absorption Performance

To study the effect of liquid inlet temperature on CO2 absorption performance, a set of experiments wasrun over a range of liquid inlet temperature between 303 to 333 K with 20 mol % CO2 inlet concentration, 7.22 m3/m2.h of liquid flow rate, and 41.72 mol/m2.h of gas flow rate with 4.04 MPa of operating pressure. Figure 7a,b shows the effect of liquid inlet temperature on CO2 removal efficiency,   k l a e and K G a v .
Figure 7a indicates that as the inlet liquid temperature increases from 303 to 333 K the CO2 removal efficiency increases from 57% to 75%. Moreover, the k l a e value increases from 1.09 × 10 3   s 1 to 2.78 × 10 3   s 1 . An increase of liquid temperature would resultantly increase the CO2 diffusion coefficient in the liquid thus enhance the mass transfer performance [48].
Figure 7b shows the K G a v profile across the column height at liquid inlet temperature range between 303 to 333 K. A substantial decrease of K G a v values can be perceived at T = 333 K. This is due to increasing reaction kinetic between CO2 in gas phase and PCGLY from the top of the column which consuming chemical enhancement, E in the absorption system. As observed, K G a v values reduce with increasing liquid inlet temperature. This is mainly contributed by the increasing reaction kinetics caused by the increasing liquid temperature [41,49]. According to the Arrhenius expression, higher temperatures will increase kOH and kGLY, in turn resulting in the increase of reaction rate. Conversely, the higher temperatures reduce CO2 solubility, as indicated by the increase in the Henry’s law constant [21,50]. Nevertheless, the effect of increasing the reaction rate constant overrides the effect of increasing the Henry’s law constant [50]. In turn, CO2 removal efficiency and K G a v increased with increasing inlet liquid temperature.

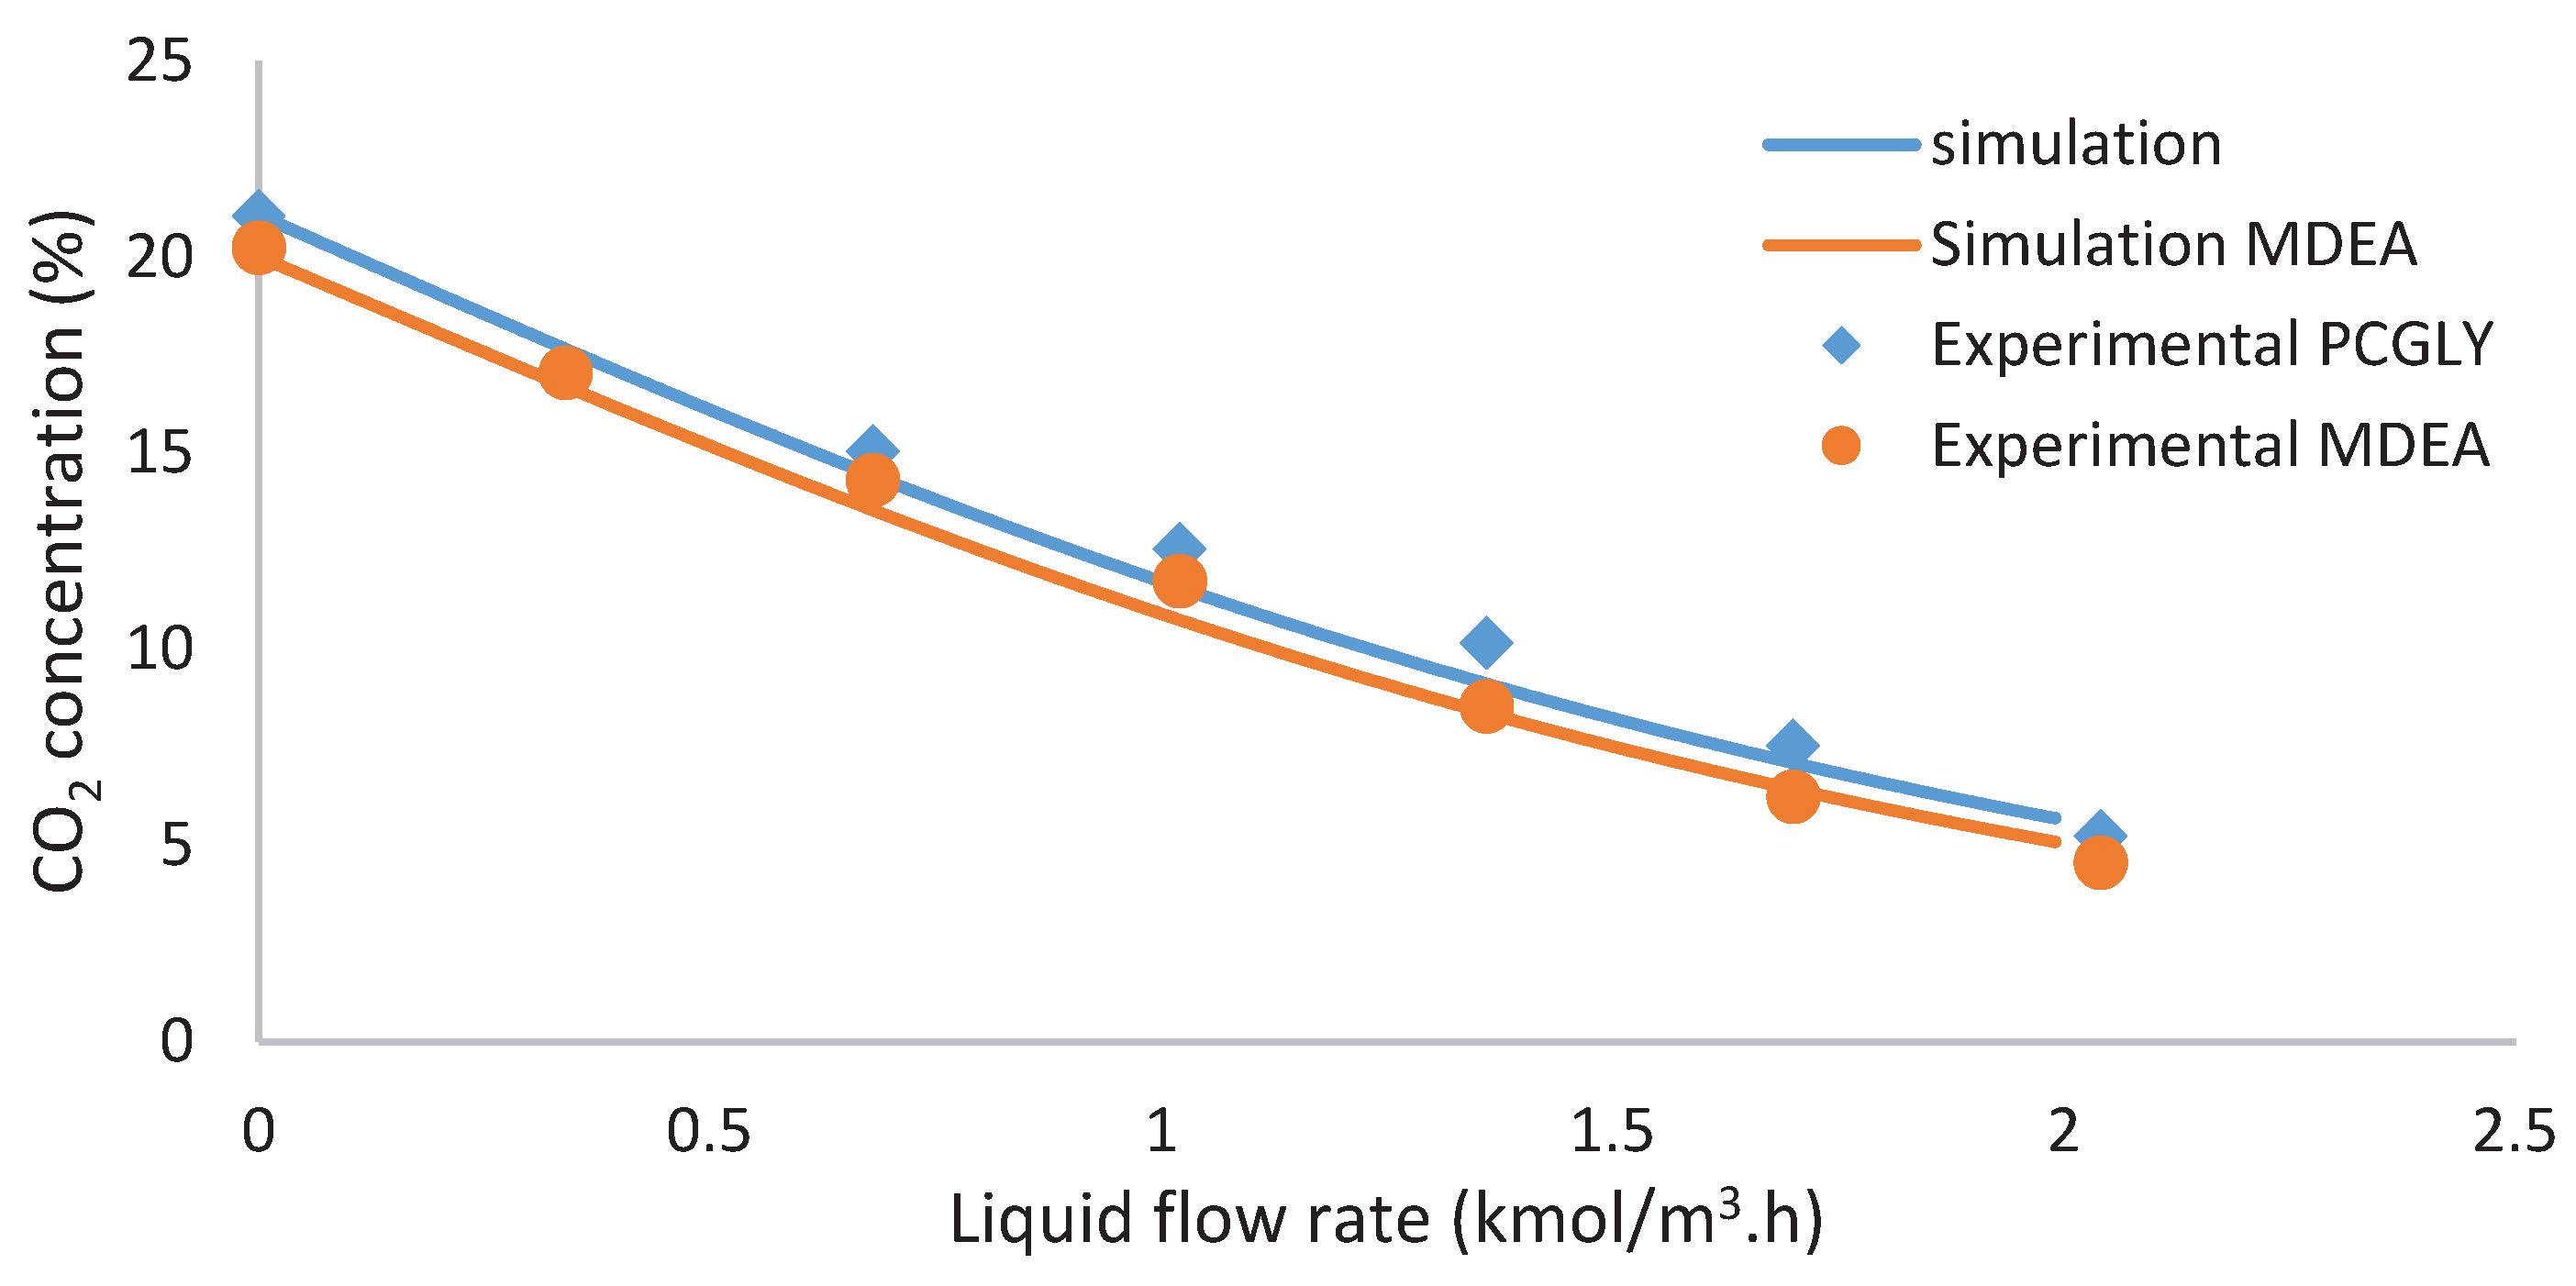
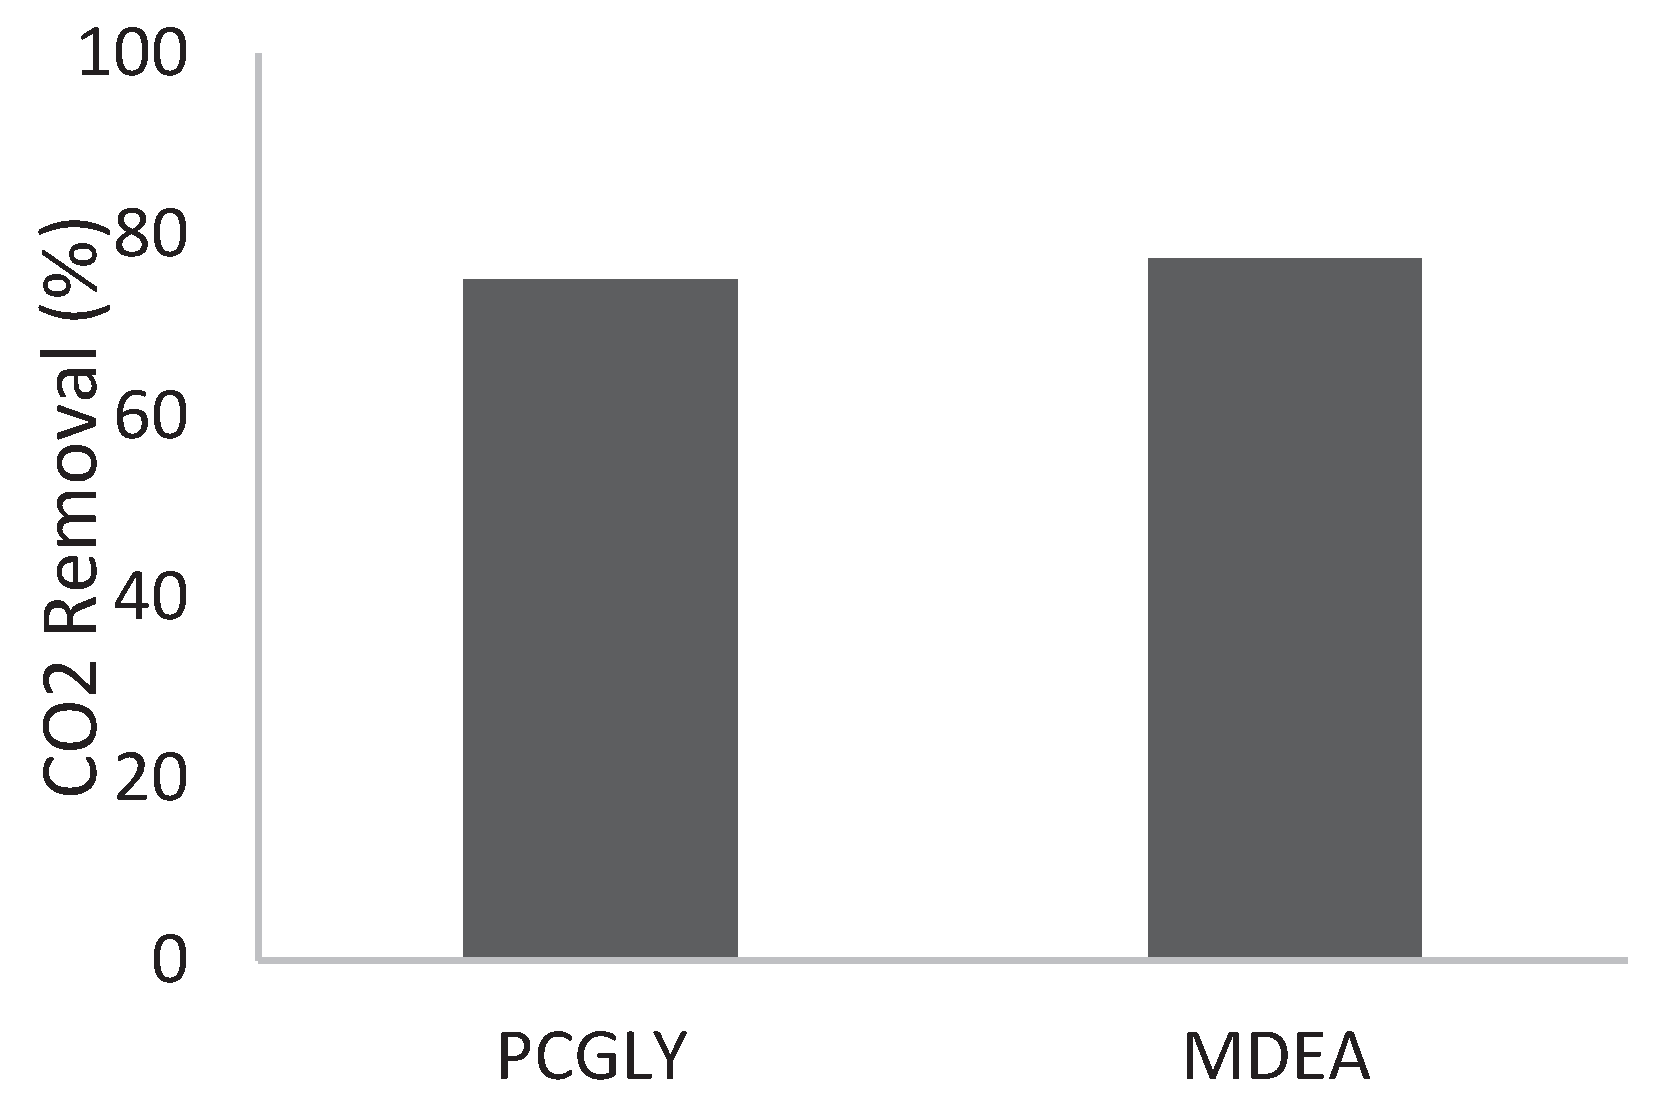
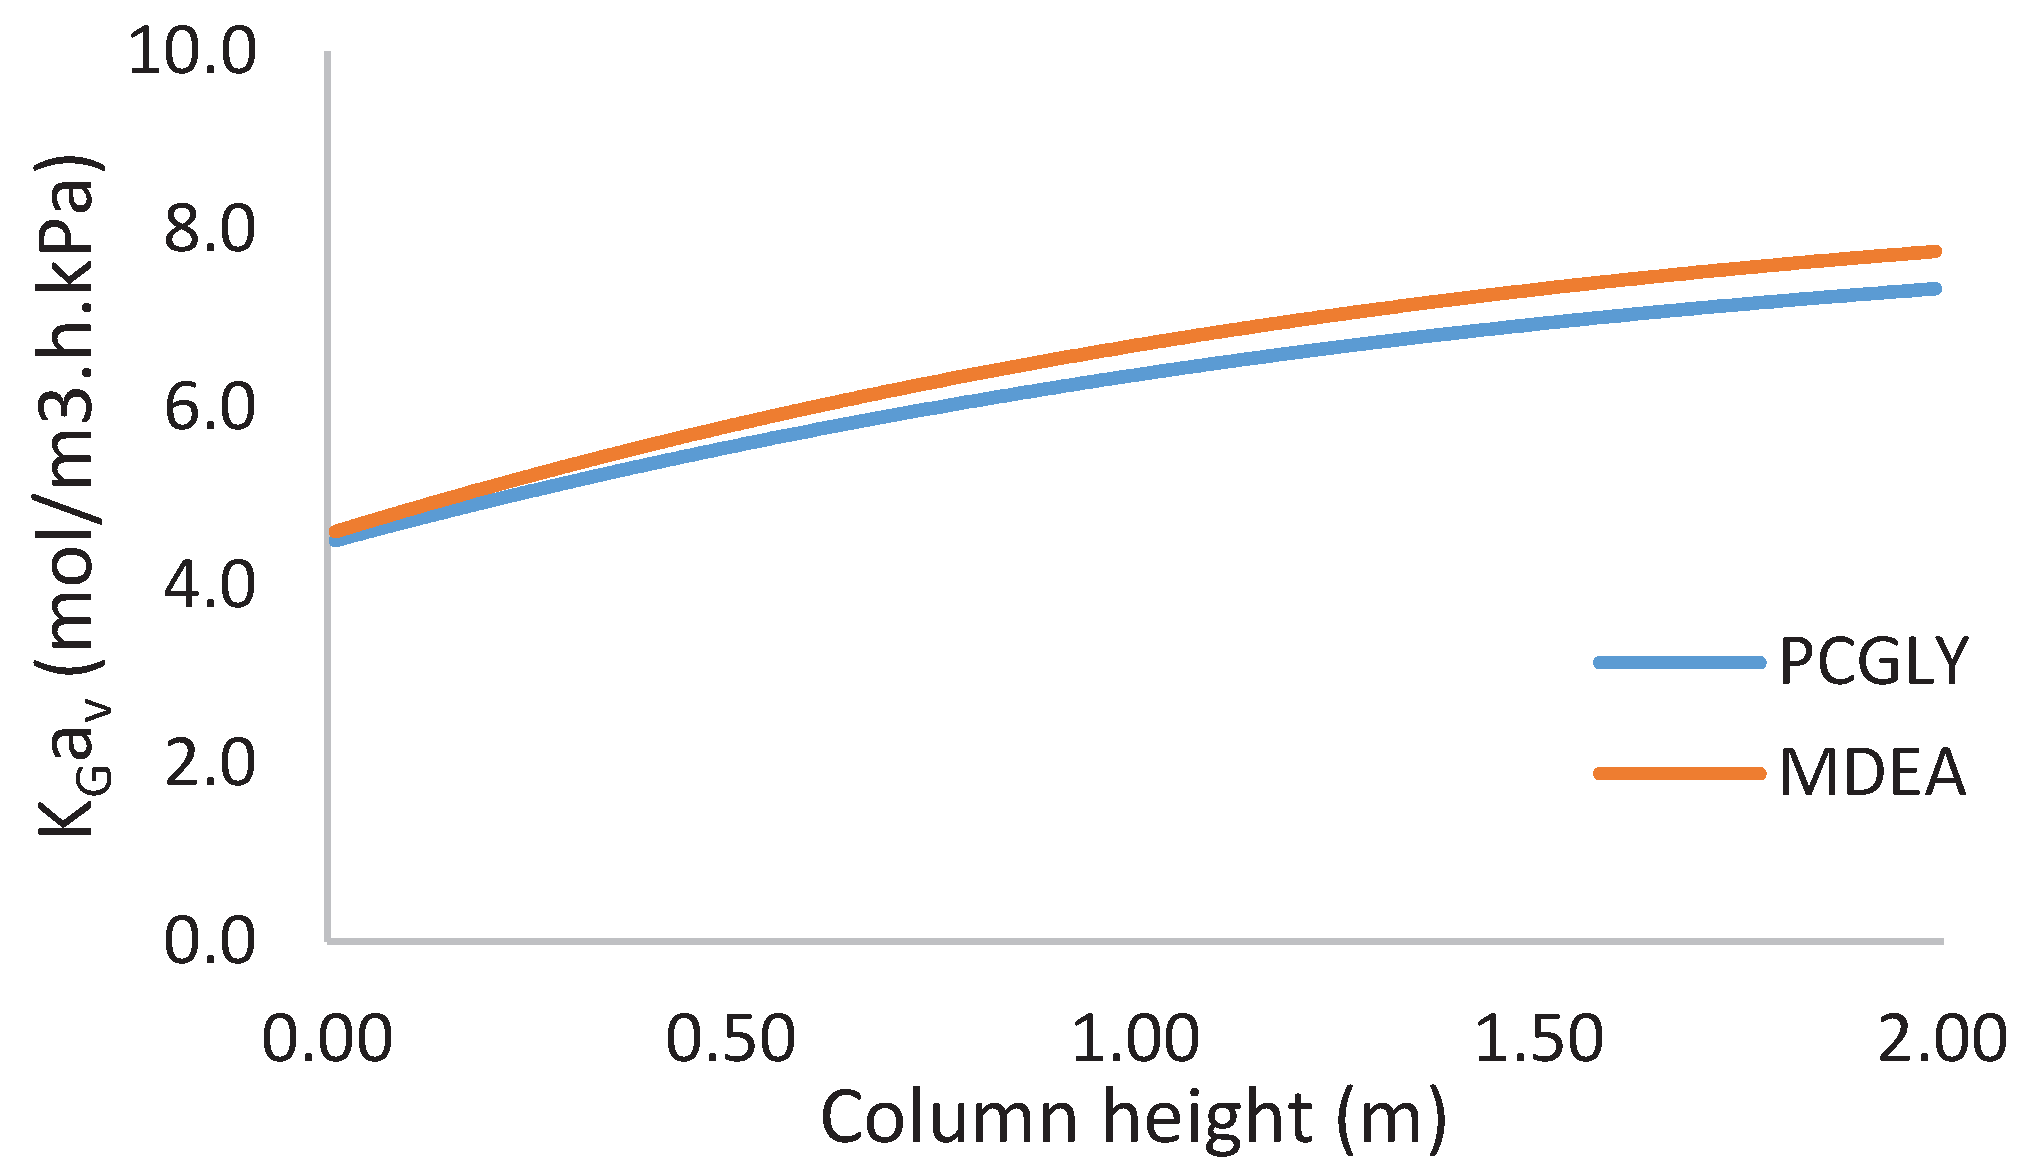
3.2. Comparative Study of Absorption Performance with MDEA

MDEA is an acceptable solvent for comparison with PCGLY as it is the most commercial tertiary amines for NG CO2 purification [51]. In order to measure the process performance of PCGLY, a comparative study was conducted with MDEA. Specifications for process parameter are shown in Table 1.
The simplified rate-based model was used to compare with the experimental data. Figure 8 shows the CO2 concentration profile of MDEA and PCGLY. The model has good fitted with the experimental data with MAE = 0.057.
Figure 9 presented the CO2 removal efficiency of PCGLY and MDEA at 75% and 77%, respectively. The PCGLY performance is comparable in terms of CO2 removal efficiency.
Figure 10 illustrated the overall mass transfer coefficient for PCGLY and MDEA. The K G a v of PCGLY and MDEA was evaluated along the column height. It can be observed that K G a v of MDEA is comparable with PCGLY.

PCGLY as Potential Green Solvent

In this paper, the absorption performance of PCGLY was well proven to be comparable with equimolar MDEA in terms of its CO2 removal efficiency and K G a v . The potential of PCGLY is supported by its environmental friendly properties and has less toxicity than MDEA [24,27]. PCGLY also requires lower regeneration energy as compared to MDEA [15,27,32,52]. Due to the high solvent temperature in the absorber, the required energy for stripping process is lower. [53]. Another advantage of PCGLY as compared to MDEA is it is thermally stable and has no thermal degradation [21,24]. Moreover, PCGLY is cheaper than MDEA, hence it can save more operational costs as compared to MDEA [27,52]. Due to this, PCGLY is one of the potential alternative solvents in CO2 absorption technology. Future research may focus on the evaluation of the energy consumption and control system for absorption system.

4. Conclusions

The mass transfer performance of aqueous PCGLY blend for CO2 absorption was determined using a bench-scale packed absorption column. The experimental results indicated that: (1) k l a e   and K G a v   increased as liquid flow rate and inlet liquid temperature increased; (2) gas flow rate and operating pressure had little effects on k l a e and K G a v ; (3) CO2 removal efficiency and K G a v   value of PCGLY are comparable with MDEA. However, the advantage of PCGLY as green solvent, which also requires lower regeneration energy and costs, would override the performance of MDEA. Furthermore, PCGLY demonstrated resistance to degradation and lower toxicity than amine-based solvents. The simplified numerical model demonstrated good agreement with the experimental data with MAE < 0.06.

Author Contributions

Conceptualization, N.F.A.M. and W.H.T.; Data curation, N.F.A.M. and S.M.M.Y.; Formal analysis, N.F.A.M. and W.H.T.; Investigation, N.F.A.M.; Methodology, N.F.A.M.; Project administration, N.F.A.M.; Resources, N.F.A.M. and S.M.M.Y.; Supervision, A.M.S., W.H.T. and H.N.A.H.; Validation, H.N.A.H.; Writing—original draft, N.F.A.M.; Writing—review & editing, A.M.S. and W.H.T. All authors have read and agreed to the published version of the manuscript.

Funding

This research was funded by Ministry of Higher Education (MOHE) Malaysia through the Fundamental Research Grant Scheme (FRGS) under grant number [FRGS/1/2017/TK02/UTP/01/1 ] and the publication of this paper was supported by Yayasan Universiti Teknologi PETRONAS (YUTP) under grant number [015LC0-136].

Acknowledgments

This research project was supported by the Ministry of Higher Education (MOHE) Malaysia through the Fundamental Research Grant Scheme (FRGS) under grant number [FRGS/1/2017/TK02/UTP/01/1] and the publication of this paper was supported by Yayasan Universiti Teknologi PETRONAS (YUTP) under grant number [015LC0-136].

Conflicts of Interest

The authors declare no conflict of interest.

References

  1. Ritchie, H.; Roser, M. CO2 and Other Greenhouse Gas Emissions; Our World in Data: Oxford, UK, 2019. [Google Scholar]
  2. Ahmad, S.; Ab Kadir MZ, A.; Shafie, S. Current perspective of the renewable energy development in Malaysia. Renew. Sustain. Energy Rev. 2011, 15, 897–904. [Google Scholar] [CrossRef]
  3. Tan, L.S.; Shariff, A.M.; Lau, K.K.; Bustam, M.A. Factors affecting CO2 absorption efficiency in packed column: A review. J. Ind. Eng. Chem. 2012, 18, 1874–1883. [Google Scholar] [CrossRef]
  4. Global Natural Gas. Insight; IGU: Barcelona, Spain, 2017.
  5. The Outlook for Energy: A View to 2040; Exxonmobil: Irving, TX, USA, 2017.
  6. Darman, N.H.; Harun, A.R. Technical Challenges and Solutiond on Natural Gas Development in Malaysia. In Proceedings of the 4th Workshop of the China-Sichuan Basin Case Study, Beijing, China, 30 May–3 June 2006. [Google Scholar]
  7. Halim, H.; Shariff, A.; Bustam, M. High pressure CO2 absorption from natural gas using piperazine promoted 2-amino-2-methyl-1-propanol in a packed absorption column. Sep. Purif. Technol. 2015, 152, 87–93. [Google Scholar] [CrossRef]
  8. Hairul, N.A.H.; Shariff, A.M.; Bustam, M.A. Mass transfer performance of 2-amino-2-methyl-1-propanol and piperazine promoted 2-amino-2-methyl-1-propanol blended solvent in high pressure CO22 absorption. Int. J. Greenh. Gas Control 2016, 49, 121–127. [Google Scholar] [CrossRef]
  9. Tan, L.S.; Lau, K.K.; Bustam, M.A.; Shariff, A.M. Removal of high concentration CO2 from natural gas at elevated pressure via absorption process in packed column. J. Nat. Gas Chem. 2012, 21, 7–10. [Google Scholar] [CrossRef]
  10. Scholes, C.A.; Stevens, G.W.; Kentish, S.E. Membrane gas separation applications in natural gas processing. Fuel 2012, 96, 15–28. [Google Scholar] [CrossRef]
  11. Ahmad, A.L.; Adewole, J.K.; Leo, C.P.; Ismail, S.; Sultan, A.S.; Olatunji, S.O. Prediction of plasticization pressure of polymeric membranes for CO2 removal from natural gas. J. Membr. Sci. 2015, 480, 39–46. [Google Scholar] [CrossRef]
  12. Wu, S.Y.; Liu, Y.F.; Chu, C.Y.; Li, Y.C.; Liu, C.M. Optimal Absorbent Evaluation for the CO2 Separating Process by Absorption Loading, Desorption Efficiency, Cost, and Environmental Tolerance. Int. J. Green Energy 2014, 12, 1025–1030. [Google Scholar] [CrossRef]
  13. Ma’mum, S.; Svendsen, H.F.; Hoff, K.A.; Juliussen, O. Selection of new absorbents for carbon dioxide capture. Energy Convers. Manag. 2007, 48, 251–258. [Google Scholar] [CrossRef]
  14. Thee, H.; Nicholas, N.J.; Smith, K.H.; da Silva, G.; Kentish, S.E.; Stevens, G.W. A kinetic study of CO2 capture with potassium carbonate solutions promoted with various amino acids: Glycine, sarcosine and proline. Int. J. Greenh. Gas Control 2014, 20, 212–222. [Google Scholar] [CrossRef]
  15. Shuaib, S.M.; Shariff, A.M.; Bustam, M.A.; Murshid, G. Physical properties of aqueous solutions of potassium carbonate + glycine as a solvent for carbon dioxide removal. J. Serb. Chem. Soc. 2014, 79, 719–727. [Google Scholar] [CrossRef] [Green Version]
  16. Shen, S.; Yang, Y.; Wang, Y.; Ren, S.; Han, J.; Chen, A. CO2 absorption into aqueous potassium salts of lysine and proline: Density, viscosity and solubility of CO2. Fluid Phase Equilibria 2015, 399, 40–49. [Google Scholar] [CrossRef]
  17. Hamzehie, M.E.; Najibi, H. Experimental and theoretical study of carbon dioxide solubility in aqueous solution of potassium glycinate blended with piperazine as new absorbents. J. CO2 Util. 2016, 16, 64–77. [Google Scholar] [CrossRef]
  18. Capello, C.; Fischer, U.; Hungerbühler, K. What is a green solvent? A comprehensive framework for the environmental assessment of solvents. Green Chem. 2007, 9, 927–934. [Google Scholar] [CrossRef]
  19. Grant, T.; Anderson, C.; Hooper, B. Comparative life cycle assessment of potassium carbonate and monoethanolamine solvents for CO2 capture from post combustion flue gases. Int. J. Greenh. Gas Control 2014, 28, 35–44. [Google Scholar] [CrossRef]
  20. Borhani, T.N.G.; Akbari, V.; Hamid, M.K.A.; Manan, Z.A. Rate-based simulation and comparison of various promoters for CO2 capture in industrial DEA-promoted potassium carbonate absorption unit. J. Ind. Eng. Chem. 2015, 22, 306–316. [Google Scholar] [CrossRef]
  21. Shaikh, M.S.; Azmi, M.S.; Bustam, M.A. Study of CO2 solubility in Aqueous Blend of Potassium Carbonate Promoted with Glycine. Appl. Mech. Mater. 2014, 625, 19–23. [Google Scholar] [CrossRef]
  22. Hu, G.; Nicholas, N.J.; Smith, K.H.; Mumford, K.A.; Kentish, S.E.; Stevens, G.W. Carbon dioxide absorption into promoted potassium carbonate solutions: A review. Int. J. Greenh. Gas Control 2016, 53, 28–40. [Google Scholar] [CrossRef]
  23. Kim, Y.E.; Choi, J.H.; Nam, S.C.; Yoon, Y.I. CO2 absorption capacity using aqueous potassium carbonate with 2-methylpiperazine and piperazine. J. Ind. Eng. Chem. 2012, 18, 105–110. [Google Scholar] [CrossRef]
  24. Ramazani, R.; Mazinani, S.; Jahanmiri, A.; Bruggen, B.V.D. Experimental investigation of the effect of addition of different activators to aqueous solution of potassium carbonate: Absorption rate and solubility. Int. J. Greenh. Gas Control 2016, 45, 27–33. [Google Scholar] [CrossRef]
  25. Raksajati, A.; Ho, M.T.; Wiley, D.E. Reducing the cost of CO2 capture from flue gases using aqueous chemical absorption. Ind. Eng. Chem. Res. 2013, 52, 16887–16901. [Google Scholar] [CrossRef]
  26. Guo, D.; Thee, H.; Tan, C.Y.; Chen, J.; Fei, W.; Kentish, S.; Stevens, G.W. Amino acids as carbon capture solvents: Chemical kinetics and mechanism of the glycine+ CO22 reaction. Energy Fuels 2013, 27, 3898–3904. [Google Scholar] [CrossRef]
  27. Smith, K.H.; Harkin, T.; Mumford, K.; Kentish, S.; Qader, A.; Anderson, C.; Hooper, B.; Stevens, G.W. Outcomes from pilot plant trials of precipitating potassium carbonate solvent absorption for CO2 capture from a brown coal fired power station in Australia. Fuel Process. Technol. 2017, 155, 252–260. [Google Scholar] [CrossRef]
  28. Smith, K.; Andrew, L.; Mumford, K.; Li, S.; Indrawan; Thanumurthy, N.; Anderson, C.; Hooper, B.; Kentish, S.; Stevens, G. Pilot plant results for a precipitating potassium carbonate solvent absorption process promoted with glycine for enhanced CO2 capture. Fuel Process. Technol. 2015, 135, 60–65. [Google Scholar] [CrossRef]
  29. Echt, W.; Meister, P. Design, fabrication and startup of an offshore membrane CO2 removal system. In Proceedings of the 88th Annual Convention, Gas Processors Association, P-28, San Antonio, TX, USA, 8–10 March 2009. [Google Scholar]
  30. Abdul Halim, H.N.; Shariff, A.M.; Tan, L.S.; Bustam, M.A. Mass transfer performance of CO2 absorption from natural gas using monoethanolamine (MEA) in high pressure operations. Ind. Eng. Chem. Res. 2015, 54, 1675–1680. [Google Scholar] [CrossRef]
  31. Hairul, N.; Shariff, A.; Bustam, M. Process behaviour in a packed absorption column for high pressure CO2 absorption from natural gas using PZ+ AMP blended solution. Fuel Process. Technol. 2017, 157, 20–28. [Google Scholar] [CrossRef]
  32. Thee, H.; Smith, K.H.; Silva, G.D.; Kentish, S.E.; Stevens, G.W. Carbon dioxide absorption into unpromoted and borate-catalyzed potassium carbonate solutions. Chem. Eng. J. 2012, 181, 694–701. [Google Scholar] [CrossRef]
  33. McCabe, W.; Smith, J.C.; Hariot, P. Unit Operation of Chemical Engineering, 7th ed.; McGraw-Hill Companies, Inc.: Singapore, 2005. [Google Scholar]
  34. Zeng, Q.; Guo, Y.; Niu, Z.; Lin, W. Mass transfer coefficients for CO2 absorption into aqueous ammonia solution using a packed column. Ind. Eng. Chem. Res. 2011, 50, 10168–10175. [Google Scholar] [CrossRef]
  35. Aroonwilas, A.; Tontiwachwuthikul, P. High-efficiency structured packing for CO2 separation using 2-amino-2-methyl-1-propanol (AMP). Sep. Purif. Technol. 1997, 12, 67–79. [Google Scholar] [CrossRef]
  36. Wellek, R.; Brunson, R.; Law, F. Enhancement factors for gas-absorption with second-order irreversible chemical reaction. Can. J. Chem. Eng. 1978, 56, 181–186. [Google Scholar] [CrossRef]
  37. Hairul, N.; Shariff, A.M.; Tay, W.H.; Mortel, A.M.A.; Lau, K.K.; Tan, L.S. Modelling of high pressure CO2 absorption using PZ+ AMP blended solution in a packed absorption column. Sep. Purif. Technol. 2016, 165, 179–189. [Google Scholar] [CrossRef]
  38. Cullinane, J.T.; Rochelle, G.T. Carbon dioxide absorption with aqueous potassium carbonate promoted by piperazine. Chem. Eng. Sci. 2004, 59, 3619–3630. [Google Scholar] [CrossRef]
  39. Kumar, N.; Rao, D.P. Design of a packed column for absorption of carbon dioxide in hot K2CO3 solution promoted by arsenious acid. Gas. Sep. Purif. 1989, 3, 152–155. [Google Scholar] [CrossRef]
  40. Shen, S.; Feng, X.; Zhao, R.; Ghosh, U.K.; Chen, A. Kinetic study of carbon dioxide absorption with aqueous potassium carbonate promoted by arginine. Chem. Eng. J. 2013, 222, 478–487. [Google Scholar] [CrossRef]
  41. Tay, W.H.; Lau, K.K.; Shariff, A.M. High performance promoter-free CO2 absorption using potassium carbonate solution in an ultrasonic irradiation system. J. CO2 Util. 2017, 21, 383–394. [Google Scholar] [CrossRef]
  42. Mustafa, N.F.A.; Shariff, A.M.; Halim, H.N.A.; Tay, W.H.; Yusof, S.M.M. CO2 removal efficiency from natural gas at elevated pressure of packed absorption CO2 lumn using potassium carbonate promoted with glycine. Sci. Proc. Ser. 2019, 1, 55–57. [Google Scholar]
  43. Lau, R.; Peng, W.; Valesquez-Vargas, L.G.; Yang, G.Q.; Fan, L.S. Gas− liquid mass transfer in high-pressure bubble columns. Ind. Eng. Chem. Res. 2004, 43, 1302–1311. [Google Scholar] [CrossRef]
  44. Wang, G.; Yuan, X.; Yu, K. Review of mass-transfer correlations for packed columns. Ind. Eng. Chem. Res. 2005, 44, 8715–8729. [Google Scholar] [CrossRef]
  45. Naami, A.; Edali, M.; Sema, T.; Idem, R.; Tontiwachwuthikul, P. Mass transfer performance of CO2 absorption into aqueous solutions of 4-diethylamino-2-butanol, monoethanolamine, and N-methyldiethanolamine. Ind. Eng. Chem. Res. 2012, 51, 6470–6479. [Google Scholar] [CrossRef]
  46. Xu, B.; Gao, H.; Luo, X.; Liao, H.; Liang, Z. Mass transfer performance of CO2 absorption into aqueous DEEA in packed columns. Int. J. Greenh. Gas Control 2016, 51, 11–17. [Google Scholar] [CrossRef]
  47. Fu, K.; Rongwong, W.; Liang, Z.; Na, Y.; Idem, R.; Tontiwachwuthikul, P. Experimental analyses of mass transfer and heat transfer of post-combustion CO2 absorption using hybrid solvent MEA–MeOH in an absorber. Chem. Eng. J. 2015, 260, 11–19. [Google Scholar] [CrossRef]
  48. Ling, H.; Gao, H.; Liang, Z. Comprehensive solubility of N2O and mass transfer studies on an effective reactive N, N-dimethylethanolamine (DMEA) solvent for post-combustion CO2 capture. Chem. Eng. J. 2019, 355, 369–379. [Google Scholar] [CrossRef]
  49. Pinsent, B.; Pearson, L.; Roughton, F. The kinetics of combination of carbon dioxide with hydroxide ions. Trans. Faraday Soc. 1956, 52, 1512–1520. [Google Scholar] [CrossRef]
  50. Yi, F.; Zou, H.K.; Chu, G.W.; Shao, L.; Chen, J.F. Modeling and experimental studies on absorption of CO2 by Benfield solution in rotating packed bed. Chem. Eng. J. 2009, 145, 377–384. [Google Scholar] [CrossRef]
  51. Liu, H.; Li, M.; Idem, R.; Tontiwachwuthikul, P.P.T.; Liang, Z. Analysis of solubility, absorption heat and kinetics of CO2 absorption into 1-(2-hydroxyethyl) pyrrolidine solvent. Chem. Eng. Sci. 2017, 162, 120–130. [Google Scholar] [CrossRef]
  52. Borhani, T.N.G.; Azarpour, A.; Akbari, V.; Alwi, S.R.W.; Manan, Z.A. CO2 capture with potassium carbonate solutions: A state-of-the-art review. Int. J. Greenh. Gas Control 2015, 41, 142–162. [Google Scholar] [CrossRef]
  53. Smith, K.H.; Anderson, C.J.; Tao, W.; Endo, K.; Mumford, K.A.; Kentish, S.E.; Qader, A.; Hooper, B.; Stevens, G.W. Pre-combustion capture of CO2—Results from solvent absorption pilot plant trials using 30 wt% potassium carbonate and boric acid promoted potassium carbonate solvent. Int. J. Greenh. Gas Control 2012, 10, 64–73. [Google Scholar] [CrossRef]
Figure 1. Schematic diagram bench-scale packed absorption column.
Sustainability 12 03873 g001
Figure 2. Schematic diagram of packed absorption column in an infinitesimal element for mass balance.
Sustainability 12 03873 g002
Figure 3. Flowchart of simplified rate-based model to determine k l a e and K G a v .
Sustainability 12 03873 g003
Figure 4. (a) CO2 removal efficiency and k l a e ; (b): K G a V profile with trend over various liquid flow rate various liquid flow rate.
Sustainability 12 03873 g004
Figure 5. (a): CO2 removal efficiency; (b): K G a V profile with various and k l a e trend over various gas flow rate gas flow rate.
Sustainability 12 03873 g005
Figure 6. (a): CO2 removal efficiency and k l a e ; (b): K G a V profile with trend over various operational pressure various operational pressure.
Sustainability 12 03873 g006
Figure 7. (a): CO2 removal efficiency and k l a e ; (b): K G a V profile with various trend over various inlet liquid temperature inlet liquid temperature.
Sustainability 12 03873 g007
Figure 8. Comparison between experimental and simulation data [L = 7.22 m3/m2.h, G = 41.72 mol/m2.h, 20% CO2 in NG, P = 4.04 MPa, Liquid inlet temperature = 333 K.
Sustainability 12 03873 g008
Figure 9. CO2 removal efficiency of MDEA and PCGLY.
Sustainability 12 03873 g009
Figure 10. K G a v   profile along the column.
Sustainability 12 03873 g010
Table 1. Specifications of the process parameters for comparative studies.
Operating ParametersValue (Unit)
MDEA concentration 1.3 (kmol/m3)
PCGLY concentration 1.2 (kmol/m3)
Liquid flow rate7.22 (m3/m2.h)
Gas flow rate41.72 (kmol/m2.h)
Operating pressure4.04 (MPa)
CO2 concentration20 (%)
Liquid inlet temperature333 (K)

