A Critical Review of Sustainable Energy Policies for the Promotion of Renewable Energy Sources
by
 ,
,
Yuehong Lu
1,*, 
Zafar A. Khan
2,* ,
,
Manuel S. Alvarez-Alvarado
3,
Yang Zhang
1,
Zhijia Huang
1 and
Muhammad Imran
4
1
Department of Civil Engineering and Architecture, Anhui University of Technology, Ma’anshan 243002, China
2
Department of Electrical Engineering, Mirpur University of Science and Technology, Mirpur (A.K.) 10250, Pakistan
3
Faculty of Engineering in Electricity and Computing, Escuela Superior Politécnica del Litoral, Guayaquil 09-01-5863, Ecuador
4
Mechanical Engineering Department, Aston University, Birmingham B4 7ET, UK
*
Authors to whom correspondence should be addressed.
Sustainability 2020, 12(12), 5078; https://doi.org/10.3390/su12125078
Submission received: 3 May 2020
/
Revised: 31 May 2020
/
Accepted: 10 June 2020
/
Published: 22 June 2020
(This article belongs to the Special Issue Sustainable Conversion of Renewable Energy Sources)
Abstract
:Meeting the rising energy demand and limiting its environmental impact are the two intertwined issues faced in the 21st century. Governments in different countries have been engaged in developing regulations and related policies to encourage environment friendly renewable energy generation along with conservation strategies and technological innovations. It is important to develop sustainable energy policies and provide relevant and suitable policy recommendations for end-users. This study presents a review on sustainable energy policy for promotion of renewable energy by introducing the development history of energy policy in five countries, i.e., the United States, Germany, the United Kingdom, Denmark and China. A survey of the articles aimed at promoting the development of sustainable energy policies and their modelling is carried out. It is observed that energy-efficiency standard is one of the most popular strategy for building energy saving, which is dynamic and renewed based on the current available technologies. Feed-in-tariff has been widely applied to encourage the application of renewable energy, which is demonstrated successfully in different countries. Building energy performance certification schemes should be enhanced in terms of reliable database system and information transparency to pave the way for future net-zero energy building and smart cities.
1. Introduction
Energy plays a key role in both the lives of human beings and the development of economies. There have been three typical transitions for energy application: 1. Coal replaced wood to be the main energy source; 2. Oil replaced coal to be the dominant energy source; 3. The transition from fossil fuels to renewable energy. In 2018, the US Energy Information Administration (EIA) estimated that 80% of the energy was derived from fossil fuels, specifically 36% from petroleum, 13.2% from coal, and 31% from natural gas. Nuclear energy and renewable energy accounted for 11% and 8%, respectively [1]. However, since three major energy crises arose—the 1973 oil crisis, the 1979 energy crisis, and the 1990 oil-price hike—government have been engaged in encouraging consumers to conserve energy and apply renewable energy. Energy usage can cause serious environmental pollution. Excessive burning of fossil fuels results in the depleting natural resources as well as a steady increase of carbon dioxide emissions, which is believed to be responsible for increasing average global temperatures. In the report of the IPCC (2014) [2], the best-case scenario assumes that greenhouse gas emissions peak by 2020 and then decline substantially. Meanwhile, a fall between 0.2 °C and 1 °C above the long-term average may occur in global average temperature in 2100. In the models by Giorgetta et al. [3], one of the worst-case scenarios reflects a doubling of CO2 and shows a rise in mean global temperature of about 3–4 °C by 2100, and it is predicted that global average temperature in 2100 would actually fall between 1.5 °C and 2 °C below the 1950–1980 average. With an increase of 2 °C over pre-industrial levels, a significant world climatic change is expected to occur with detrimental social, human and economic impact. Therefore, to avoid such temperature increase, governments and concerned members of civil society are engaged in implementing appropriate yet practical policies and actions in response. On 2 November 2014 in Copenhagen, the Intergovernmental Panel on Climate Change (IPCC) and the leaders of the United Nations (UN) expressed their concern about the near future and the main findings of the IPCC Fifth Assessment Synthesis Report (IPCC, 2014). The UN Secretary-General declared: ‘Leaders must act, time is not on our side’ [4]. Governments are expected to act immediately to address the issues of energy crisis and environment problems. Indeed, the world’s governments have been slow to respond to this situation. A recent initiative, i.e., the Paris climate accord in 2015, is promising, with the United States and China agreeing to abide by the agreement.
The challenges of growing energy demand and environmental pollution require policies and governance on energy resources [5]. A systemic transition towards more efficient energy regimes requires a strategically designed sequence of actions involving all policy levels, from local to global [6]. A broad range of policy tools have been introduced such as tradable emission rights, taxes, and subsidies, as well as regulation such as feed-in-tariffs for renewable energy production [6]. Given China’s rapid economic growth, the overconsumption of energy and heavy carbonisation of the economy make it an important player in oil and gas markets. The US energy policy has focused on four traditional objectives: 1. Secure, plentiful, diverse energy supply; 2. Robust, reliable energy infrastructure; 3. Affordable and stable energy price; 4. Environmentally sustainable energy production and use [7]. To address the challenge of climate change, the European Union (EU) has adopted a set of quite ambitious policies to bring down greenhouse gas (GHG) emissions in 2020 by 20% with respect to 1990, raise the share of renewables in final energy consumption to 20% in 2020, and realise energy savings of 20% in 2020 compared to an official baseline energy consumption level [7]. How policy frameworks appropriately designed is the key to facilitate sufficient private capital flowing into clean energy investment. It is essential to understand how to create effective frameworks for clean energy investment and the corresponding risk-return.
However, previous studies on energy policy are mostly focusing on the development of a specific energy policy (e.g., building energy performance certification) in different countries or the renewable energy law and policies in a specific country. It is essential to understand the development history of those successive sustainable energy policies in some counties to provide guidance for designing appropriate and effective energy policies for other countries. Overall, the paper provides a unique, unified reference benchmark for future work concerning the development of renewable and sustainable energy policy.
Our paper presents a review of sustainable energy policies in five countries, i.e., United States (US), Germany, United Kingdom (UK), Denmark and China. Then, a summary of how to design a policy is provided with its interaction with economy and environment. Three important sustainable energy policies, i.e., Energy-Efficiency Standard (EES), Feed-in-Tariff (FiT), and Building Energy Performance Certification (BEPC) Schemes, are described in detail in Section 4.
2. Framework of Sustainable Energy Policy
In the EU context, it has repeatedly stated to be at the forefront of global action against climate change. In December 2019, EU has announced new European Climate Law “European Green Deal” which aims to respond to the escalating climate crisis by achieving net-zero greenhouse gas (GHG) emissions from the EU by 2050 [8]. To reach this ambitious goal, a comprehensive policy framework is required, encompassing the climate, energy, environmental, industrial, economic and social aspects of this unprecedented process [9]. The deal’s four pillars would be carbon pricing, sustainable investment, industrial policy, and a just transition [10].
Maya-Drysdale et al. [11] evaluated the vision strategy in EU New Green Deal for the energy planning of eight European cities by applying an analytical framework of critical elements of Strategic Energy Planning for 100% renewable systems. Despite carbon emission reduction ambitions, the cities are not approaching the vision strategy very effectively. The energy planning is still tied to the urban planning paradigm and traditions, which limits the strategic planning and does not fit very well with the vision strategy [11].
The European Green Deal can be successfully implemented by intelligently promoting the deep decarbonisation by accompanying the economic and industrial transformation this necessarily implies, and by ensuring the social inclusiveness of the overall process. However, this is a complicated task which requires a paradigm shift of the economy from fossil fuels to zero-carbon in a way that is socially and politically viable. The European Green Deal can be considered as an efficient reallocation mechanism, fostering investment shifts and labor substitution in key economic sectors, while helping the most vulnerable segments of society throughout the process.
On the basis of the potential consequences of climate change, one of the biggest challenges faced for governments worldwide is the transformation of energy systems from fossil fuels to renewable energies. Climate change is responsible for the increase in extreme weather events, as well as an unbroken series of hottest years on record. In recognition of this, 179 countries and the EU spent two weeks in Paris during December 2015 hammering out an agreement to keep global temperature increase well below 2 °C and if possible, below 1.5 °C. The reduction in temperature can only be achieved through a significant reduction in the emission of greenhouse gases. Known as COP21, (The 21st Conference of the Parties to the UN Framework Convention on Climate Change) it was one of the largest gatherings of world leaders ever seen. The US pledged to cut US climate pollution by 26–28% from 2005 levels. The EU plans to cut emissions by 40% by 2030 on 1990 levels. China’s target is to reach peak CO2 emissions by 2030 at the latest, lower the carbon intensity of GDP by 60% to 65% below 2005 levels by 2030, and to increase the share of non-fossil energy carriers of the total primary energy supply to around 20%. After committing to the Paris Agreement, the reduction of greenhouse gas emissions is assumed to be achieved through the implementation of national energy policies [12]. In June 2019, the UK became the first major economy to enshrine ‘net-zero’ by 2050 in law, as shown in Figure 1, which conveys the accelerating momentum for net-zero globally.
Although the share of electricity from renewable sources is on the raise in most countries after the introduction of substantial subsidies, conventional energy technologies and fossil fuels still dominate the market of electricity generation with approximately 75% market share in the European Union. Three major technological changes have been proposed for the sustainable energy development strategies: energy savings on the demand side [13,14], efficiency improvement in the energy production [15,16], and replacement of fossil fuels by various sources of renewable energy [17,18]. The need for development of sustainable energy policy is driven by the carbon emissions of the countries. The highest global carbon emissions contributed by a single country in 2018 are by China, i.e., 10,065 metric tons, followed by the USA with 5416 metric tons of CO2 emissions. The European Union has the third highest carbon emission levels with Germany as the most significant contributor [19]. The United Kingdom is also considered as a key country for the sustainable development policy with ambitious sustainable energy goals. Considering the above, this study discusses energy policies of five countries, i.e., China, the United States, Germany, the United Kingdom and Denmark, which are the leading countries in development of sustainable energy policies and renewable energy technologies [20]. The presentation of the development of sustainable energy policies in these countries can provide positive guidance on policy design to achieve a sustainable development.
2.1. United States of America Energy Policy Context
Historically, the USA appears in the list of the first countries that incorporated energy policy in its economic system. In its beginning (by the Colonial period), the US energy policy was based on the standing timber for heating and industry [21]. However, with the discovery of coal benefits for industry applications (19th century), such policy changed direction towards an industrial revolution [21]. Over time, the use of coal was reduced with the integration of oil energy source. This is attributed to the fact that oil energy sources were easier and safer to utilise than coal.
Another important aspect that produced energy policy transformation was in 1883 at Niagara Falls (New York, NY, USA), with the construction of the first hydroelectric power source. Hydropower generation (first renewable energy source) opened a pathway for the 20th century to different power plants based on petroleum, natural gas, diesel, and nuclear. During the 20th century, the US economically growth rapidly reaching a peak just after the World War II. The success of its economy was in part due to the regulations based on electrical energy production [22].
Until the 1990s, hydropower and solid biomass were the most used renewable energy. However, this fact changed with the developments of new renewable technologies. Biofuels, solar, and wind energy became very popular at the end of the 20th century. This is attributed to the advantages that they present, such as: (1) low environmental impact; (2) low or no production of emissions of CO2 and other polluting gases into the atmosphere; (3) natural resource with external dependence; (4) suitable option to complement conventional energy sources [23]. The employment of more renewable energies could lead to a more sustainable economy. However, without an adequate policy, this was not going to be possible, as history demonstrated. In 2009, the US became the second largest (after China) country around the globe emissary of carbon dioxide (CO2) with a total of 8413 million metric tons of CO2 as reported in Reference [24]. This fact produced several penalties to the country, leading to a decrement in the US economy. Another problem that the US was facing was the wearing out of the energy sources. Potential solutions to these issues led to the creation of energy policies that could regulate the energy sector; under this need, the US formulated the Energy Independence and Security Act (EISA) [25] and the Energy Policy Act (EPAct) [26]. In the EPAct and IEA analyzed the given problem and proposed (in the beginning of the 2000s) regulations based on energy conservation and efficiency.
The conservation and efficiency strategies given in the EPAct05 and EISA took four milestones: 1. Transportation energy conservation and efficiency provisions; 2. Buildings energy conservation and efficiency provisions; 3. Industry energy conservation and efficiency provisions; 4. Electric power energy conservation and efficiency provisions. The most relevant policy for each sector is presented in Table 1, Table 2, Table 3 and Table 4 [27]. The EPAct05 and EISA leads to an enlargement of US energy conservation, transforming the outlook for US oil imports and carbon emissions.
2.2. Germany Energy Policy Context
Germany is generally recognised to be the pioneer in establishing energy policy for sustainable development, and it is currently the most successful country for the promotion of renewable energy towards a sustainable energy system transition. Research and development of energy policy is the responsibility of the Federal Ministry of Economics and Technology (BMWi). Environmental policies, including nuclear safety, climate change and the impacts of fossil fuel combustion, are undertaken by the Federal Ministry of Environment, Nature Conservation and Nuclear Safety (BMU). The German Energy Agency (DENA) created in 2000 is in charge of the promotion of energy efficiency and energy conservation. The Federal Cartel Office (FCO) or the state-level competition offices is responsible for the regulation of competition in energy and electricity markets. Furthermore, independent expert panels and institutes organise discussions and provide reports for guiding energy policy.
In 2011, German government announced the Energiewende (‘energy transformation’) and decided to reduce the amount of fossil fuels from 80% of energy supply to 20% by 2050. The phase-out of nuclear energy, reduction of fossil fuels and dramatic increase in projected energy efficiency are the three major components of the German Enrgiewende.
Figure 2 provides an overview of electricity production from different energy sources between the period 1990 and 2015 in Germany (adopted from [28,29]). Until 2000, nearly 80% of electricity production came from lignite (25.7%), hard coal (24.8%), nuclear (29.4%) and the rest came from natural gas (8.5%) and renewables (6.6%). The share of renewables has been observed to increase dramatically (from 6.6% in 2000 to 30% in 2015) and the share of nuclear was halved from 29.4% in 2000 to 14.1% in 2015. Since the Fukushima accident, the decision to phase-out nuclear energy may cause the share of nuclear to reach zero by 2022 [29]. Electricity production from nature gas provides less than 10% in 2015 while it was negligible for domestic oil compared to demand.
2.3. United Kingdom Energy Policy Context
The UK has a legal obligation under EU law to generate 20% of all energy consumption from renewable energy sources by 2020, and it has a legally mandated policy goal of an 80% reduction in national greenhouse gas (GHG) emissions to 80% of the base line i.e., 1990 GHG emissions, by 2050. [30,31]. However, later in 2019, the UK government introduced changes to the Climate Change Act 2008 and introduced amendment by introducing the term “Net-Zero”. The amendment states “The amendment in this Order has the effect that the minimum percentage by which the net UK carbon account for the year 2050 must be lower than the 1990 baseline is increased from 80% to 100%” [30,31,32].
The UK has a legal obligation under EU law to generate 20% of all energy consumption from renewable energy sources by 2020, and it has a legally mandated policy goal of an 80% reduction in national climate change emissions by 2050 which was made in 2008, and to reach net-zero carbon emissions by 2050 through an amendment to the law made in 2019 [30,31,32,33]. Over the last two decades, substantial policy instruments have been introduced and amended, including enhanced construction and design standards (e.g., building control regulation), compulsory energy labelling (Energy Performance Certificates (EPC) and Display Energy Certificates), and a fairly unstable range of financial penalties and incentives (e.g., the Green Deal, Feed-in Tariffs, Energy Efficiency Opportunities Scheme, Climate Change Levy) [34]. A summarised description on the UK national energy policy framework towards energy efficiency and renewable energy production is given in Table 5.
In 2011, The Minimum Energy Efficiency Standard (MEES) was introduced in the United Kingdom, based on which the properties or these building materials rated G and F will be removed from the market. According to the report from Department of Energy and Climate Change in 2015, approximately 8% (representing around 200,000 units of the leased commercial stock in England and Wales) of non-domestic buildings had an EPC rating of F, and a further 10% of non-domestic buildings had an EPC rating of G.
2.4. Denmark Energy Policy Context
The establishment of Danish energy policy for renewable energy has a long history that can be traced back to the 1890s. Nowadays, Denmark is a leading country on how sustainable development strategies constituted by a combination of energy savings, efficiency improvement technologies and renewable generation are implemented. Since the energy crisis of the 1970s, Denmark has experienced the transformation of electricity generation from large, centralised thermal power stations to renewable electricity [46,47]. National energy plans were developed through wide discussion on energy security, self-sufficiency, efficiency, and greenhouse gas reductions. Nuclear power was not involved in the alternative plans as there was significant public opposition to the installation of nuclear plants [47].
In 2001, an expert group was formed by the Danish Energy Agency to investigate the problem of excess electricity generation arising from the high penetration of wind generation and combined heating and power plant in the Danish energy system [48]. A series of long-term year 2020 energy system is analyzed by Aalborg University to identify investments in more flexible energy systems in Denmark [49]. A Danish future year 2020 energy system was defined by the expert group in accordance with Danish long-term energy policies and strategies.
Denmark has a leading role in the development of wind power generation which can go back to Poul la Cour who developed and built a wind turbine for electricity production and thus initiated modern wind power development. In 1918, 120 rural wind power stations were established with rated turbine powers between 20 and 35 kW, and wind generation (3 MW) accounted for around 3% of the Danish electricity demand (80 MW). The beginning of the modern phase of Danish wind energy use started from 1975 when a report was proposed on a broad wind energy programme in Denmark published by a committee set up by the Danish Academy of Technical Sciences (ATV) [50]. In 1976, a second report was issued by the Academy to further outline a five-year programme in the field of wind energy [50]. In 1977, the national government and the Danish utilities jointly supported to implement a wind power programme for the development of large-scale electricity-producing wind turbines. In 1996, the Danish government started Danish energy policy for offshore wind power of 4000 MW in 2030 in Energy 21. By the end of 2001, wind generation contributed nearly 12% of gross electricity consumption, while it provided 18.2% of the total gross electricity production in 2005 [46,47]. A share of electricity from renewable sources for Denmark is given in Table 6.
2.5. China Energy Policy Context
Building energy consumption has been widely recognised as one major sector that threatens sustainable development all over the world, and it is expected to continue to increase in the next decades. Since the first building design standard had been issued in 1986, China government has established a systematic design standard for the new buildings in different climate zones, including design standards and acceptance standards for the residential building as well as public building [52] (Table 7). It is noted that the standard is updated every several years, and the newly items are summarised in Table 8.
In China, a series of national plans have been formulated for the development and utilisation of renewable energy, which is also recognised as a political and economic issue (see Figure 3). As important strategies, the national plans provide basic guidelines and periodical targets for China’s renewable energy law and policy system, which greatly accelerate the optimisation of social resources allocation, the improvement of market mechanism and mobilisation of renewable energy investment [57].
In 2017, the National Development and Reform Commission (NDRC) of China issued the 13th Five Year Plan on energy development, and this is the basic outline of China’s energy policy from 2016 to 2020 [58]. The Category of electricity generation from coal, natural gas, wind power and solar power can be found from the report as summarised in Figure 4. The improvement of energy demand and energy supply structure is the pillar of the energy policy in the 13th Five Year Plan, which aims to address the problem of “placing an emphasis on facility construction, but disregarding usage” in the existing renewable energy policy.
In Reference [59], 2656 energy-related province-level laws and regulations are identified and further categorised into specific types of command and control policies; financial incentives; awards; intellectual property rights; and education and information policies.
3. Modelling Sustainable Energy Policy
An effective policy is defined as ‘the extent to which intended objectives are met, for instance, the actual increase in the amount of RE electricity generated or share of RE in total energy supplied within a specified time period’ needs to ‘incite investment’ [61]. The development of sustainable energy is widely acknowledged to depend on related policies determined by policy-makers and the government. It is a vital procedure to design and model an appropriate energy policy scheme since it affects the economic, environment, and technology development, as illustrated in Figure 5. In general, a well-developed policy contains a closed loop involving six major procedures: policy design, policy implementation, policy monitoring, policy assessment, policy feedback and policy amendment. In terms of the development of RE policy, five common criteria (Figure 6) were identified to judge whether it is successful or not [62]:
- Effectiveness (Extent to which the objectives are met);
- Efficiency (Innovation with decrease in costs);
- Equity (Fair distribution of the rents between RE developer and government);
- Institutional feasibility (Extent political support is provided to the policy);
- Replicability (Extent to which the policy can be adopted in other countries).
Modelling of the energy policies requires systemwide analysis of the complexities posed by the new technologies being incorporated in the system. The complex interactions of variables affecting the decision-making process with possible alternatives must be determined for designing an effective policy. Simulation studies containing major modelling methodologies and themes are presented in Table 9 [63].
Several empirical studies conclude that governments and stakeholders need to actively increase RE adoption and promote effective policy incentives and policy controls so as to reduce the CO2 emissions prevalent in their countries and regions [74]. The simplest energy policy is to fix the reward/penalty value for a product or an activity such as feed-in-tariff (FiT) and carbon tax. However, the value for feed-in-tariff or carbon tax is usually different for different places, which has attracted great attention from academic experts as well as the government [75,76,77,78]. The modelling of sustainable energy policy is expected to be a key factor for developing a successful policy.
A review of literature presents many studies proposing such policies. For example, in the study of Lu et al. [79], a segment function was introduced as the model of penalty cost for the design of RES in zero energy buildings, the parameters were determined by trial test for the case of Hong Kong Zero Carbon Building. Then, the authors of Reference [80] further proposed a simple quadratic function as the reward-penalty model, and the effectiveness of the proposed model was investigated based on a single-family house located in Shanghai city, China. In the two cases, the proposed RPM was designed to obtain an environmentally friendly, but economically viable optimum for ZEB owners by rewarding them a bonus and fining them according to the achieved ZEB level. In order to mitigate the overgeneration from the uncontrollable property of renewable sources, a reward/penalty mechanism for the demand response programs is designed for maximizing the benefit of supply side under the constraint the benefit of customer side is not sacrificed, which is solved by using particle swarm optimisation [81]. Wu et al. [82] proposed a simple but transparent exercise with a FiT mechanism of which the subsidy cost is passed through to final consumers by adding a tax or surcharge on electricity consumption, which forms the type of subsidy with a direct price impact on the electricity price. The two types of renewable support schemes, i.e., a subsidy scheme like a feed-in-tariff without price impact and a subsidy scheme with a direct price impact were then evaluated and compared. They found that a support scheme with price impact is much more effective in reducing CO2 emissions while the difference in GDP between the two policies is small [82].
Obrecht and Denac proposed two simplified energy policy models which represent useful tools for greater RES application, more predictable and accurate future energy policy measures, and efficiently satisfy international agreements and objectives, as shown in Figure 7 and Figure 8 [83]. The two models are very similar but Model 2 contains a very different final goal. Model 2 shapes the direction of future energy demand and supply so that it can achieve the transition to more sustainable energy and the legally binding objectives.
Systems dynamics (SD) has been widely applied to the energy policy related problems [63,84,85,86,87] and assessment of environmental impact [88,89,90]. Qudrat-Ullah [63] investigated the modelling and simulation issues in service of energy policy and identified energy policy modelling related issues. The identified issues include the characterisation of energy systems as complex, dynamic system with numerous uncertainties, non-linearities, time lags, and intertwined feedback loops. Qudrat-Ullah suggested that system dynamic modelling can be a viable solution to address these issues. Based on the three traditional categories under classification of energy policy formulation, i.e., strategic, tactical and operational problems, the author further classified energy policy formulation problems into six categories, i.e., energy-economy-environment (3E) problem, energy demand-supply management problem, new product innovation problem, capacity management problem, energy pricing problem, and hybrid energy management problem [91,92]. An in-depth review of some of the sustainable policies is presented in the proceeding section.
4. Effective Policies for Promotion of Sustainable Energy
The key challenges for sustainable development are expanding access to affordable, reliable, and adequate energy supplies while addressing environmental impacts at all levels [93]. The development of energy policies for sustainable development can be ensured by [93].
- Delivering adequate and affordable energy supplies
- Encouraging energy efficiency
- Accelerating the use of new renewables
- Widening the diffusion and use of other advanced energy technologies
Considering the aforementioned guidelines, three key policies are promoted globally to ensure sustainable development. Energy Efficiency Standard (EES) is introduced to encourage energy efficiency, Feed-in-Tariff (FiT) is adopted to incentivise the consumers for acceleration of penetration of renewable energy, and widening the diffusion of new technologies in conjunction with advanced energy technologies is ensured by Building Energy Performance Certification (BEPC) Schemes. A detailed discussion on all three points is presented below.
4.1. Energy Efficiency Standard (EES)
Energy-efficiency standards are a set of programs and regulations that prescribe the energy performance of manufactured products, which are dynamic and determined based on the current available technologies in the market. There are three types of energy-efficiency standards [94]: Prescriptive standards that require a particular feature or device be installed in all new products; Minimum energy performance standards (MEPS) that specify the energy performance (i.e., prescribe minimum efficiencies or maximum energy consumption) in each and every product and Class-average standards that specify the average efficiency of a manufactured product, which allow the variation of the level of efficiency for models if the overall average is achieved. The energy efficiency of a certain product is suggested to be dynamic to ensure manufacturers’ efforts with making gradually improved energy-efficient products.
Energy-efficiency standards can be either mandatory or voluntary. Mandatory programs provide minimum allowable energy efficiency or maximum allowable energy use for products sold in a particular country or region. By contrast, voluntary energy-efficiency standards are alternative options to energy-efficiency regulations. Energy-efficiency codes and related policies adopted for the building sector in various countries are given in Reference [95] and can be categorised as in Table 10. In most countries, the incentives are integrated in the codes and energy conversation are mainly achieved from eight measures (i.e., heating and cooling, design guidelines, construction detail methodology, wall and ceiling insulation, air sealing and ventilation, lighting efficiency, windows U-value and Solar Heat Gain Coefficient-SHGC, and other installations).
4.2. Feed-in-Tariff (FiT)
Feed-in tariff (FiT) is one of the most successful incentive schemes for promoting significant growth in renewable energy technologies, particularly solar and wind. In general, FiTs typically include three key provisions: guaranteed grid access, long-term contracts, and cost-based purchase price [113,114]. Under a FiT, eligible renewable electricity generators (e.g., homeowners, business owners, farmers and private investors) will be paid a cost-based price for the excess generated electricity that was sent to the grid. This provides investors a reasonable return and thus greatly supports diverse technologies (wind, solar, biogas, etc.) to be developed. Over the past two decades, more than 45 countries have implemented FiT programs. The first form of feed-in-tariff was implemented in the US in 1978 under President Jimmy Carter, who signed the National Energy Act (NEA), which aims to encourage energy conservation and to develop new energy resources, including renewables such as wind, solar and geothermal power [115,116]. In 1990, the first European country, German, adopted a feed-in-tariff program with a tariff based on a percentage of the retail rate of electricity. Denmark and Spain implemented their versions of feed-in-tariff program in 1993 and 1994, respectively. Figure 9 depicts the history of feed-in-tariff adopted by different countries.
The FiT rate may differ by technology, size (commercial or residential scale), location (e.g., ground-mounted or rooftop for solar PV projects) and region [89]. There is a growing body of research focusing on how to determine and adjust tariff rates. For instance, simply increasing the FiT rate adjustment frequency could have reduced the curtailed wind power by 23 to 27 billion kwh while maintaining the same reduction level of subsidy between 2009 and 2016 [117]. The UK government announced new feed-in-tariffs for small scale renewable and low carbon electricity, for example, tariff levels for new installations of PV (≤4 kW) and Wind (≤1.5 kW) were 36.1 p/kWh and 34.5 p/kWh respectively in 2010, whereas in 2019, PV (≤10 kW) was set to 3.41 p/kWh whilst Wind (≤50 kW) was changed to 8.24 p/kWh [118]. In the study carried out by Ritzenhofen and Spinler, they assessed the impact of adjustments to FiT schemes by quantifying the relationship between FiT levels, i.e., the propensity to invest in RES and the guaranteed amount paid per quantity of electricity generated. Based on a regime switching model in their study, the impact of regulatory uncertainty considering moves from a FiT scheme to a more market-oriented regime was then quantified [80]. Moore et al. [119] adapted a financial model to identify suitable FiT rates for the generation of electricity from unused biomass in Eastern Ontario, Canada. They suggested that the FiT rate was required to be higher than the current offered rates (i.e., CDN$ 0.13 kW−1h−1) for projects greater than 10 MW. To achieve payback periods of five years, the corresponding FiT must be between CDN$ 0.17 kW−1h−1 and CDN$ 0.22 kW−1h−1 while a FiT rate of approaching CDN$ 0.45 kW−1h−1 was required for a payback period of two years or less. Table 11 presents a summary of literatures on feed-in-tariff (FiT) in different countries.
4.3. Building Energy Performance Certification (BEPC) Schemes
The transformation of existing buildings into Nearly Zero Energy Buildings (NZEBs) by 2050 is an important goal in The Energy Performance of Buildings Directive (EPBD), which requires the development of Energy Performance Certificate (EPC) schemes in the EU to provide a powerful and comprehensive information tool for quantitatively predicting the annual energy demand from the building stock and creating a demand-driven market for energy-effective buildings [139]. In 2002, the Energy Performance Certificate was introduced by the EPBD (Directive 2002/91/EC) [140] as a mandatory requirement when constructing, selling or renting a building or dwelling in the EU member states. The EPC should include the standard values, benchmarks and energy requirements for the building. In addition, the certificate should contain recommendations for energy improvement in the building while considering the cost-effective solutions. In 2010, additional requirements were put forward to strengthen and improve the quality of the EPC in the recast of the EPBD in 2010 (Directive 2010/31/EU) [141]. In particular, if any property is to be sold or rented, the advertisement should include the EPC and the new buyers and tenants should keep the EPC. Subsequently, in the Directive 2012/27/EU [142], it is required that compliance with the energy efficiency requirements for the purchase of buildings by the central government shall be verified by the recast. In 2018, an amendment to Directive 2010/31/EU on the energy performance of buildings and Directive 2012/27/EU on energy efficiency was further proposed in Directive (EU) 2018/844 [143], in which the importance of improving the transparency and quality of the EPC was highlighted. Figure 10 [139] provides a general timeline for the development of EPC in the EU Directives. Each EU member state has proposed its own approaches for developing EPCs and their implementation. Meanwhile, and EPCs are recognised to be among the most important information sources regarding building energy performance in the EU’s building stock [144,145]
It is necessary to develop an EPC database system as it facilitates building energy performance monitoring, building energy planning and building renovation planning. In all EU member states, the assessors are required to upload EPC information into the database [146]. By 2014, 22 member states had established centralised EPC registers and some countries (e.g., Latvia and Poland) are preparing to launch their database systems. These registers vary in terms of data format, data management and sharing, and the data upload procedure. In some countries (e.g., France) and some regions (e.g., in Italy and Belgium), it is an obligatory step to upload data for issuing an EPC. The situation of the EPC database is varied across EU-28 in 2014, as demonstrated in Figure 11 [139]. In some countries, the public can access the database or aggregated results while in other countries, the database is only available for authorities or selected organisations [139].
Credibility and reliability are considered to be the most important two factors for evaluating the successful implementation of the EPC [147,148]. If the data quality is questionable, it would result in a lack of confidence in the return on the investment and make it difficult for policy-makers to develop successful future energy planning policies [139,149]. In this context, a well-functioning system is required to set up for the quality control of the EPC, which is suggested from the perspective of input data, energy assessor and software applied [139]. The situation of quality control for EPC database across E-28 in 2014 is displayed in Figure 12 [139]. Independent quality control of EPCs has been implemented in 21 EU member states. 11 countries have been identified to have finished the quality control for the EPC calculation software. In addition, EPC quality control is conducted in 19 countries through the database, including random sampling and data verification. Control systems have been developed in eight countries for qualified experts who may receive a penalty for false certification. A reliable and trustworthy EPC enhances the confidence of the building owner to upgrade their property into a higher energy level and the potential buyer to purchase a higher energy performance level building [139].
Four elements are introduced in the EPBD recast that affect the quality of EPC systems, qualifications and accreditation of certifiers, methodology, independent quality control, and penalties for non-compliance (see Figure 13). The requirement of the independent qualified and/or accredited experts, who are responsible for carrying out the assessment of a building’s energy performance, is considered an important aspect affecting the quality of the certificate. In most countries, a minimum requirement (minimum education requirements or prior professional experience) has been set for a qualified expert. Moreover, lists of qualified and/or accredited experts and the companies that offer such experts should be made publicly available and regularly updated among Member States. An independent control system was introduced in the EPBD recast (Art. 18) that aims to ensure high quality of EPCs. The EPC verification options, e.g., the validation of the input data, on-site visit of the building or other equivalent measures, verification of results and recommendations, should be taken into account when designing the scheme. Mandatory penalties were introduced for non-compliance (Art. 27) in the EPBD recast, which can further improve the functioning of the EPC system. In the event of infringement, the building owner or qualified expert may receive an effective, proportionate and dissuasive penalty.
5. Concluding Remarks
Policies and regulations are the backup for technology innovation. It is the government and policy-makers who determine the direction of policy and consumers’ investments. To further promote the development of a sustainable society, this study reviewed the development of sustainable energy policy in different countries, particularly in the USA, Germany, the United Kingdom, Denmark and China. The key conclusion of the paper is that to move towards a sustainable energy future, governments and stakeholders need to actively increase renewable energy adoption and promote effective policy incentives and policy controls.
Recommendations for future policy-makers are provided below:
- (1)
- Establish a trustworthy and reliable database system for policy analysisA new energy policy is usually proposed based on the current technology and related database system. To avoid incorrect input data, it is also important to ensure that quality and accuracy of the data in the database is not compromised. Information transfer can be tracked using technologies such as Blockchain Technology. Only a highly reliable database can benefit from effective design of future energy policy and the development of corresponding building renovation strategies. Based on the database system, when and where the policy implementation requires adjustment (e.g., the adjustment of energy-efficiency standards for building materials) can be identified by national and local authorities.
- (2)
- Increase information transparency and provide recommendations for building energy saving measuresThe database should contain at least the basic information, e.g., building type, year of construction, floor area, heated floor area, energy consumption per year, energy label, carbon emission, energy-saving recommendations, as well as the information about the energy assessor. The information updated after renovation should be recorded in the documents over the lifetime of a building. Some aspects of the databases should be accessible to the public to create a user-friendly data-sharing platform for authorities, research entities, homeowners and prospective owners or renters. This can assist them to compare with the assessment from another representative dwelling in the same block and reinforce public awareness of energy efficiency. Recommendations for energy-saving measures significantly influence homeowners’ decisions. Optimised and cost-effective upgradation of the building performance with estimates of energy saving should encourage the homeowners to consider upgradation. Personalised instructions on renovation options to quantify energy savings and related costs can be included in a related energy label certificate such as green building certificate or EPCs.
- (3)
- Provide financial support for building renovationIt is a priority to retrofit the existing building stock for energy saving. However, two major reasons hinder the building-owners from implementing refurbishment: additional costs for energy-saving measures, and a lack of knowledge of the financial benefits after renovation. The refurbishment entails the improvement of building envelope thermal performance as well as the replacement of the old heating systems. Buildings that meet a certain energy level after renovation can be rewarded by subsidies to reduce the perceived risks of investing in energy-efficiency measures.
- (4)
- Develop reward-penalty mechanism for promoting net-zero energy buildingsIt is still a challenge to achieve the target of net-zero energy buildings for all new buildings by the end of 2020 if no financial support is provided. It is therefore necessary to design the reward-penalty mechanism for further promoting net-zero energy buildings. The parameters affecting reward-penalty function should be firstly identified, and different types of reward-penalty function can be further designed and validated. The reward-penalty mechanism can be developed based on annual assessment, monthly assessment or daily assessment. The daily reward-penalty mechanism is supposed to be more effective and efficient to provide incentives for building-owners to actively manage their energy usages.
- (5)
- Encourage the application of smart devices to achieve future smart buildings/citiesThe use of electronic devices and HVAC system contribute significantly to the building energy performance, which is difficult to quantify as the occupants’ behaviors and preference (e.g., internal temperature, hours of operation) are difficult to forecast. The adoption of smart devices can increase energy efficiency and facilitate building energy monitoring, and it is important to ensure the inclusion of these systems in policy development. Indicators like smart readiness indicator can be developed to stimulate investors for technological innovation and promote smart devices in buildings. A great uptake of smart capabilities, such as building automation and control system, smart meters and self-regulation devices will pave the way for future smart buildings and smart cities.
Author Contributions
Conceptualization, Abstract, Section 1 and Section 5 are contributed jointly by Y.L. and Z.A.K. Section 2 is authored by M.S.A.-A. & Z.A.K., Section 3 is written by M.I. and Y.L. and Section 4 is contributed by Y.Z. and Z.H. Paper writing coordination is carried out by Y.L. and editing by Z.A.K. All authors have read and agreed to the published version of the manuscript.
Funding
It is acknowledged that this project received funding from the National Natural Science Foundation of China (Project No. 51608001) and Youth Talent Program in Anhui University of Technology (Project No. DT18200013) to carry out the research work reported in this paper.
Conflicts of Interest
The authors declare no conflict of interest.
References
- U.S. Energy Information Administration. Energy information administration, Total Energy. Available online: http://www.eia.gov/totalenergy/ (accessed on 12 February 2020).
- Pachauri, R.K.; Allen, M.R.; Barros, V.R.; Broome, J.; Cramer, W.; Christ, R.; Church, J.A.; Clarke, L.; Dahe, Q.; Dasgupta, P. Climate Change 2014: Synthesis Report. Contribution of Working Groups I, II and III to the fifth Assessment Report of the Intergovernmental Panel on Climate Change; IPCC: Geneva, Switzerland, 2014. [Google Scholar]
- Giorgetta, M.A.; Jungclaus, J.; Reick, C.H.; Legutke, S.; Bader, J.; Böttinger, M.; Brovkin, V.; Crueger, T.; Esch, M.; Fieg, K. Climate and carbon cycle changes from 1850 to 2100 in MPI-ESM simulations for the Coupled Model Intercomparison Project phase 5. J. Adv. Modeling Earth Syst. 2013, 5, 572–597. [Google Scholar] [CrossRef]
- Doyle, A. Climate change fight affordable, cut emissions to zero by 2100. Mail Online, 2 November 2014. Available online: http://www.reuters.com/article/2014/11/02/climatechange-report-idUSL6N0SS0B820141102(accessed on 7 May 2015).
- Fortuński, B. Sustainable Development and Energy Policy: Actual CO2 Emissions in the European Union in the Years 1997–2017, Considering Trade with China and the USA. Sustainability 2020, 12, 3363. [Google Scholar] [CrossRef] [Green Version]
- Goldthau, A. The Handbook of Global Energy Policy; John Wiley & Sons: Hoboken, NJ, USA, 2016. [Google Scholar]
- Smith, D.W.; Nordhaus, R.R.; Roberts, T.C.; Fidler, S.; Anderson, J.; Danish, K.; Agnew, R.; Chupka, M. Designing a climate-friendly energy policy: Options for the Near Term. 2002. Available online: https://trid.trb.org/view/723994 (accessed on 10 June 2020).
- European Commission. A European Green Deal: Striving to be the First Climate-Neutral Continent; European Commission: Brussels, Belgium, 2019. [Google Scholar]
- Löschel, A. European Green Deal und deutsche Energiewende zusammen denken! Wirtschaftsdienst 2020, 100, 78–79. [Google Scholar] [CrossRef] [Green Version]
- Claeys, G.; Tagliapietra, S.; Zachmann, G. How to make the European Green Deal work. Bruegel Policy Contrib. 2019, 13, 21. [Google Scholar]
- Maya-Drysdale, D.; Jensen, L.K.; Mathiesen, B.V. Energy Vision Strategies for the EU Green New Deal: A Case Study of European Cities. Energies 2020, 13, 2194. [Google Scholar] [CrossRef]
- United Nations Framework Convention on Climate Change. Adoption of the Paris Agreement FCCC/CP/2015/L. 9/Rev. 1; United Nations: Geneva, Switzerland, 2015. [Google Scholar]
- Blok, K. Enhanced policies for the improvement of electricity efficiencies. Energy Policy 2005, 33, 1635–1641. [Google Scholar] [CrossRef]
- Lund, H. Implementation of energy-conservation policies: The case of electric heating conversion in Denmark. Appl. Energy 1999, 64, 117–127. [Google Scholar] [CrossRef]
- Lior, N. Advanced energy conversion to power. Energy Convers. Manag. 1997, 38, 941–955. [Google Scholar] [CrossRef]
- Lior, N. Thoughts about future power generation systems and the role of exergy analysis in their development. Energy Convers. Manag. 2002, 43, 1187–1198. [Google Scholar] [CrossRef]
- Afgan, N.H.; Carvalho, M.G. Multi-criteria assessment of new and renewable energy power plants. Energy 2002, 27, 739–755. [Google Scholar] [CrossRef]
- Afgan, N.H.; Carvalho, M.G. Sustainability assessment of hydrogen energy systems. Int. J. Hydrog. Energy 2004, 29, 1327–1342. [Google Scholar] [CrossRef]
- Global Carbon Atlas. Available online: http://www.globalcarbonatlas.org/en/CO2-emissions (accessed on 27 May 2020).
- Net Zero: The Scorecard. 2020. Available online: https://eciu.net/analysis/briefings/net-zero/net-zero-the-scorecard (accessed on 29 May 2020).
- Bohi, D.R.; Russell, M. Limiting Oil Imports: An Economic History and Analysis; Routledge: London, UK, 2013. [Google Scholar]
- Solomon, B.D.; Krishna, K. The coming sustainable energy transition: History, strategies, and outlook. Energy Policy 2011, 39, 7422–7431. [Google Scholar] [CrossRef]
- Mallon, K. Renewable Energy Policy and Politics: A Handbook for Decision-Making; Earthscan: London, UK, 2006. [Google Scholar]
- International Energy Agency. World Energy Outlook 2018. Available online: https://www.iea.org/reports/world-energy-outlook-2018; (accessed on 18 December 2019).
- International Energy Agency. World Energy Outlook 2019. Available online: https://www.iea.org/reports/world-energy-outlook-2019 (accessed on 2 January 2020).
- Energy Policy Act of 2005; Government Printing Office: Washington, DC, USA, 2005.
- Dixon, R.K.; McGowan, E.; Onysko, G.; Scheer, R.M. US energy conservation and efficiency policies: Challenges and opportunities. Energy Policy 2010, 38, 6398–6408. [Google Scholar] [CrossRef]
- Energiebilanzen, A. Energieverbrauch in Deutschland im Jahre 2015; AGEB Energieverbrauch in Deutschland: Berlin, Germany, 2016. [Google Scholar]
- Renn, O.; Marshall, J.P. Coal, nuclear and renewable energy policies in Germany: From the 1950s to the “Energiewende”. Energy Policy 2016, 99, 224–232. [Google Scholar] [CrossRef]
- Chapter 27. In Crown 2008 Climate Change Act 2008; The Stationary Office Limited: London, UK, 2008. Available online: http://www.opsi.gov.uk/acts/acts2008/pdf/ukpga_20080027_en.pdf (accessed on 29 March 2020).
- European Union. Directive 2009/28/EC of the European Parliament and of the Council of 23 April 2009 on the promotion of the use of energy from renewable sources and amending and subsequently repealing Directives 2001/77/EC and 2003/30/EC. Off. J. Eur. Union 2009, 5, 2009. [Google Scholar]
- The Climate Change Act 2008 (2050 Target Amendment) Order 2019. 2020. Available online: https://www.legislation.gov.uk/uksi/2019/1056/article/1/made (accessed on 19 April 2020).
- Cameron, A.; Claeys, G.; Midões, C.; Tagliapietra, S. How Good is the European Commission’s Just Transition Fund Proposal? Bruegel Policy Contribution Issue n° 4. 2020. Available online: http://aei.pitt.edu/102554/1/PC-04_2020-V2.pdf (accessed on 4 April 2020).
- McAllister, P.; Nase, I. The impact of Minimum Energy Efficiency Standards: Some evidence from the London office market. Energy Policy 2019, 132, 714–722. [Google Scholar] [CrossRef] [Green Version]
- McBurney, S. Ofgem: Administering CERT and CESP, DEKB Conference—“Making It Happen”. Available online: www.dekb.co.uk/Steve%20McBurney.pdf (accessed on 14 November 2010).
- Mallaburn, P.S.; Eyre, N. Lessons from energy efficiency policy and programmesin the UK from 1973 to 2013. Energy Effic. 2014, 7, 23–41. [Google Scholar] [CrossRef]
- Hough, D.; Bolton, P.; Richards, P. The Warm Home Discount Scheme; House of Commons Library: London, UK, 2011. [Google Scholar]
- UK Government. UK Government, Budget 2011; HM Treasury: London, UK, 2011.
- Department of Energy. The Green Deal: A summary of the Government’s Proposals; Department of Energy: Washington, DC, USA, 2010.
- Bureau, C.A. The Green Deal and Energy Company Obligation, Citizens Advice Response to Department for Energy and Climate Change; Citizens Advice: London, UK, 2012. [Google Scholar]
- Energy Act, U.P.G.A. UK Parliamentary Legislation. 2008. Available online: http://www.legislation.gov.uk/ukpga/2008/32/contents (accessed on 5 May 2020).
- Pollitt, M.G. The role of policy in energy transitions: Lessons from the energy liberalisation era. Energy Policy 2012, 50, 128–137. [Google Scholar] [CrossRef]
- Department of Energy & Climate Change. Renewable Heat Incentive; Department of Energy & Climate Change: London, UK, 2011.
- Department of Energy & Climate Change. Renewable Heat Incentive (rhi) Scheme; Update 11 June 2012; Department of Energy & Climate Change: London, UK, 2012.
- National Renewable Energy Action Plan for the United Kingdom: Article 4 of the Renewable Energy Directive 2009/28/EC; Under Obligation Article; UK Government: London, UK, 2010; Volume 4.
- Saidur, R.; Islam, M.; Rahim, N.; Solangi, K. A review on global wind energy policy. Renew. Sustain. Energy Rev. 2010, 14, 1744–1762. [Google Scholar] [CrossRef]
- Mendonça, M.; Lacey, S.; Hvelplund, F. Stability, participation and transparency in renewable energy policy: Lessons from Denmark and the United States. Policy Soc. 2009, 27, 379–398. [Google Scholar] [CrossRef] [Green Version]
- Danish Energy Agency. Rapport fra Arbejdsgruppen om Kraftvarme-og VE-Elektricitet (Report from the Expertgroup on CHP- and RES-Electricity); Danish Energy Agency: Copenhagen, Denmark, 2001.
- Lund, H.; Munster, E. AAU’s analyser (Aalborg University Analyses). In Bilagsrapport fra Arbejdsgruppen om Kraftvarme-og VE-Elektricitet (Attachment Report from the Expertgroup on CHP- and RES-Electricity); Danish Energy Agency: Copenhagen, Denmark, 2001; p. 35. [Google Scholar]
- Danish Academy of Technical Sciences. “Wind power 2—proposal for an active programme”; Danish Academy of Technical Sciences: Copenhagen, Denmark, 1976. (in Danish) [Google Scholar]
- Meyer, N.I. Development of Danish wind power market. Energy Environ. 2004, 15, 657–673. [Google Scholar] [CrossRef]
- Ratinen, M.; Lund, P. Policy inclusiveness and niche development: Examples from wind energy and photovoltaics in Denmark, Germany, Finland, and Spain. Energy Res. Soc. Sci. 2015, 6, 136–145. [Google Scholar] [CrossRef]
- Bureau, B.C. Design standard for energy efficiency of public buildings. 2015. Available online: http://bbs.topenergy.org/ (accessed on 5 May 2016).
- Design Standards for Energy Efficiency of Residential Buildings in cold and frigid Zone. Energy Build. 2010, 36, 1309–1312.
- Design Standard for Energy Efficiency of Residential Building in Hot Summer and Cold Winter Zone; Ministry of Construction: Beijing, China, 2010.
- Design Standard for Energy Efficiency of Residential Building in Hot Hummer and Warm Winter Zone; Ministry of Construction: Beijing, China, 2012.
- Zhang, M.; Zhou, D.; Zhou, P.; Chen, H. Optimal design of subsidy to stimulate renewable energy investments: The case of China. Renew. Sustain. Energy Rev. 2017, 71, 873–883. [Google Scholar] [CrossRef]
- Yatsui, T. China’s Energy Policy and Related Issues Towards 2020; Mitsui Global Strategic Studies Institute Monthly Report; Mitsui Global Strategic Studies Institute: Tokyo, Japan, 2017. [Google Scholar]
- Si, S.; Lyu, M.; Lawell, C.-Y.C.L.; Chen, S. The effects of energy-related policies on energy consumption in China. Energy Econ. 2018, 76, 202–227. [Google Scholar] [CrossRef]
- Liu, J. China’s renewable energy law and policy: A critical review. Renew. Sustain. Energy Rev. 2019, 99, 212–219. [Google Scholar] [CrossRef]
- Mitchell, C.; Sawin, J.; Pokharel, G.; Kammen, D.; Wang, Z.; Fifita, S.; Jaccard, M.; Langniss, O.; Lucas, H.; Nadai, A.; et al. Policy, Financing and Implementation IPCC Special Report on Renewable Energy Sources and Climate Change Mitigation; Cambridge University Press: Cambridge, UK, 2011. [Google Scholar]
- Gungah, A.; Emodi, N.V.; Dioha, M.O. Improving Nigeria’s renewable energy policy design: A case study approach. Energy Policy 2019, 130, 89–100. [Google Scholar] [CrossRef]
- Qudrat-Ullah, H. Modelling and simulation in service of energy policy. Energy Procedia 2015, 75, 2819–2825. [Google Scholar] [CrossRef] [Green Version]
- Foell, W.K. Energy planning in developing countries. Energy Policy 1985, 13, 350–354. [Google Scholar] [CrossRef]
- Fishbone, L.G.; Abilock, H. Markal, a linear-programming model for energy systems analysis: Technical description of the bnl version. Int. J. Energy Res. 1981, 5, 353–375. [Google Scholar] [CrossRef]
- Omu, A.; Choudhary, R.; Boies, A. Distributed energy resource system optimisation using mixed integer linear programming. Energy Policy 2013, 61, 249–266. [Google Scholar] [CrossRef]
- Kydes, A.S.; Shaw, S.H. The National Energy Modelling System: Policy Analysis and Forecasting at the US Department of Energy; U.S. Department of Energy, Office of Scientific and Technical Information: Washington, DC, USA, 1997. [Google Scholar]
- Praetorius, B.; Schumacher, K. Greenhouse gas mitigation in a carbon constrained world: The role of carbon capture and storage. Energy Policy 2009, 37, 5081–5093. [Google Scholar] [CrossRef] [Green Version]
- Wood, F.P.; Geinzer, J.C. The IDEAS model and its use in developing the US climate change action plan. In Systems Modeling Energy Policy; Wiley: Chichester, UK, 1997; pp. 31–46. [Google Scholar]
- Meier, P.; Mubayi, V. Modelling energy-economic interactions in developing countries: A linear programming approach. Eur. J. Oper. Res. 1983, 13, 41–59. [Google Scholar] [CrossRef]
- Islas, J.; Grande, G. Optimization of alternative options for SO2 emissions control in the Mexican electrical sector. Energy Policy 2007, 35, 4495–4503. [Google Scholar] [CrossRef]
- Munasinghe, M.; Meier, P. Energy Policy Analysis and Modelling; Cambridge University Press: Cambridge, UK, 1993. [Google Scholar]
- Amlin, J.S. Simulation of greenhouse gas cap-and-trade systems with energy 2020. In Energy Policy Modeling in the 21st Century; Springer: New York, NY, USA, 2013; pp. 107–122. [Google Scholar]
- Qudrat-Ullah, H. Energy Policy Modeling in the 21st Century; Springer: New York, NY, USA, 2013. [Google Scholar]
- Zhang, M.; Zhou, D.; Zhou, P.; Liu, G. Optimal feed-in tariff for solar photovoltaic power generation in China: A real options analysis. Energy Policy 2016, 97, 181–192. [Google Scholar] [CrossRef]
- Ritzenhofen, I.; Spinler, S. Optimal design of feed-in-tariffs to stimulate renewable energy investments under regulatory uncertainty—A real options analysis. Energy Econ. 2016, 53, 76–89. [Google Scholar] [CrossRef]
- Hitaj, C.; Löschel, A. The impact of a feed-in tariff on wind power development in Germany. Resour. Energy Econ. 2019, 57, 18–35. [Google Scholar] [CrossRef] [Green Version]
- Yang, C.; Ge, Z. Dynamic feed-in tariff pricing model of distributed photovoltaic generation in China. Energy Procedia 2018, 152, 27–32. [Google Scholar] [CrossRef]
- Lu, Y.; Zhang, X.; Huang, Z.; Wang, D.; Zhang, Y. Penalty-cost-based design optimization of renewable energy system for net zero energy buildings. Energy Procedia 2018, 147, 7–14. [Google Scholar] [CrossRef]
- Lu, Y.; Zhang, X.-P.; Li, J.; Huang, Z.; Wang, C.; Luo, L. Design of a reward-penalty cost for the promotion of net-zero energy buildings. Energy 2019, 180, 36–49. [Google Scholar] [CrossRef]
- Md, M.I.; Sun, Z.; Dagli, C. Reward/penalty design in demand response for mitigating overgeneration considering the benefits from both manufacturers and utility company. Proc. Comput. Sci. 2017, 114, 425–432. [Google Scholar]
- Wu, J.; Albrecht, J.; Fan, Y.; Xia, Y. The design of renewable support schemes and CO2 emissions in China. Energy Policy 2016, 99, 4–11. [Google Scholar] [CrossRef]
- Obrecht, M.; Denac, M. A study of key factors for energy policy modelling. Naše Gospod. Our Econ. 2012, 58, 28–37. [Google Scholar] [CrossRef]
- Qudrat-Ullah, H.; Davidsen, P.I. Understanding the dynamics of electricity supply, resources and pollution: Pakistan’s case. Energy 2001, 26, 595–606. [Google Scholar] [CrossRef]
- Peter, R.; Dickie, L.; Peter, V.M. Adoption of photovoltaic power supply systems: A study of key determinants in India. Renew. Energy 2006, 31, 2272–2283. [Google Scholar] [CrossRef]
- Qudrat-Ullah, H.; Seong, B.S. How to do structural validity of a system dynamics type simulation model: The case of an energy policy model. Energy Policy 2010, 38, 2216–2224. [Google Scholar] [CrossRef]
- Trappey, A.J.; Trappey, C.V.; Hsiao, C.-T.; Ou, J.J.; Chang, C.-T. System dynamics modelling of product carbon footprint life cycles for collaborative green supply chains. Int. J. Comput. Integr. Manuf. 2012, 25, 934–945. [Google Scholar] [CrossRef]
- Jan, T.; Hsiao, C. A four-role model of the automotive industry development in developing countries: A case in Taiwan. J. Oper. Res. Soc. 2004, 55, 1145–1155. [Google Scholar] [CrossRef]
- Trappey, C.V.; Trappey, A.J.; Lin, G.Y.; Chang, Y.-S. System dynamics evaluation of renewable energy policies. In Improving Complex Systems Today; Springer: New York, NY, USA, 2011; pp. 133–140. [Google Scholar]
- Mutingi, M.; Matope, S. System dynamics of renewable energy technology adoption. In Proceedings of the 2013 IEEE International Conference on Industrial Technology (ICIT), Cape Town, South Africa, 25–28 February 2013; pp. 1512–1516. [Google Scholar]
- Mutingi, M.; Mbohwa, C. Fuzzy system dynamics: A framework for modeling renewable energy policies. In Energy Policy Modeling in the 21st Century; Springer: New York, NY, USA, 2013; pp. 31–47. [Google Scholar]
- Jebaraj, S.; Iniyan, S. A review of energy models. Renew. Sustain. Energy Rev. 2006, 10, 281–311. [Google Scholar] [CrossRef]
- Jefferson, M. Energy Policies for Sustainable Development; UNDP: London, UK, 2000. [Google Scholar]
- Wiel, S.; McMahon, J.E. Governments should implement energy-efficiency standards and labels—Cautiously. Energy Policy 2003, 31, 1403–1415. [Google Scholar] [CrossRef]
- Chandel, S.; Sharma, A.; Marwaha, B.M. Review of energy efficiency initiatives and regulations for residential buildings in India. Renew. Sustain. Energy Rev. 2016, 54, 1443–1458. [Google Scholar] [CrossRef]
- BCA 2010-6 Star NatHERS Rating for Buildings; IEA: Canaberra, Australia, 2019.
- Instituto Nacional de Metrologia, Normalizaçao e Qualidade Industrial. RegulamentoTécnico da Qualidade Para o Nívelde Eficiência energética Edificações Residenciais (RTQ-R); Portaria n.18, de 16 de janeiro de 2012; INMETRO: Rio de Janeiro, Brazil, 2012; (In Portuguese).
- National Research Council Canada. National Energy Code of Canada for Buildings; National Research Council Canada: Ottawa, ON, Canada, 2017. [Google Scholar]
- Yuan, X.; Zhang, X.; Liang, J.; Wang, Q.; Zuo, J. The development of building energy conservation in china: A review and critical assessment from the perspective of policy and institutional system. Sustainability 2017, 9, 1654. [Google Scholar] [CrossRef] [Green Version]
- Vergne, F. RT2012: Unsurcoût de Construction de 15–20%. 2001. Available online: http://www.lemoniteur.fr/190-metiers/article/actualite/775575-rt-2012-unsurcout-de-construction-de-15-20 (accessed on 1 June 2014).
- Energieeinsparverordnung, EnEV; Vwew Energieverlag GmbH: Offenbach am Main, Germany, 2014.
- EU Energy Performance of Buildings Directive (EPBD); European Commission: Brussels, Belgium, 2018.
- Yu, S.; Evans, M.; Delgado, A. Energy code enforcement and compliance evaluation: Comparative lessons learned from the US and China, and opportunities for India. In Proceedings of the ACEEE2014 Summer Study on Energy Efficiency in Buildings, Pacific Grove, CA, USA, 18–22 August 2014. [Google Scholar]
- Girgis-McEwen, E.; Ullah, R. Energy efficiency measures for net-zero energy ready building codes. In Proceedings of the eSim 2018, the 10th conference of IBPSA, Montreal, QC, Canada, 9–10 May 2018. [Google Scholar]
- Regulation and Licensing Department. New Mexico Energy Conservation Code; Regulation and Licensing Department: Quezon, Mexico, 2009.
- New Zealand Building Code (NZBC)—Clause H1; Building Performance: Wellington, New Zealand, 2015.
- Presidential Decree 2012, State Programme on Energy Savings; President’s Office: Moscow, Russia, 2010.
- South African National Standard SANS 0204: Energy Efficiency in Buildings; SABS: Capetown, South Africa, 2011.
- Building Design Criteria for Energy Saving (BDCES); BCAP: Seul, Korea, 2008.
- Technical Building Code 2007 (Royal Decree 314/2006 of 17 March 2006). Available online: https://www.global-regulation.com/translation/spain/1446654/royal-decree-314-2006%252c-of-march-17%252c-which-approves-the-technical-building-code.html (accessed on 2 December 2009).
- Conservation of fuel and power: Approved Document L. Available online: https://www.gov.uk/government/publications/conservation-of-fuel-and-power-approved-document-l (accessed on 18 January 2020).
- International Code Council. International Residential Code (IRC); International Code Council: Washington, DC, USA, 2018. [Google Scholar]
- Couture, T.D.; Cory, K.; Kreycik, C.; Williams, E. Policymaker’s Guide to Feed-in Tariff Policy Design; National Renewable Energy Lab.: Golden, CO, USA, 2010. [Google Scholar]
- Mendonça, M. Feed-in Tariffs: Accelerating the Deployment of Renewable Energy; Routledge: London, UK, 2009. [Google Scholar]
- Harris, F.; Navarro, P. Policy Options for Promoting Wind Energy Development in California: A Report to the Governor and State Legislature; University of California: Irvine, CA, USA, 1999. [Google Scholar]
- Hirsh, R.F. PURPA: The spur to competition and utility restructuring. Electr. J. 1999, 12, 60–72. [Google Scholar] [CrossRef]
- Xia, F.; Lu, X.; Song, F. The role of feed-in tariff in the curtailment of wind power in China. Energy Econ. 2020, 86, 104661. [Google Scholar] [CrossRef]
- Ofgem. Feed-In Tariff (FIT) Rates. Available online: https://www.ofgem.gov.uk/environmental-programmes/fit/fit-tariff-rates (accessed on 5 February 2020).
- Moore, S.; Durant, V.; Mabee, W.E. Determining appropriate feed-in tariff rates to promote biomass-to-electricity generation in Eastern Ontario, Canada. Energy Policy 2013, 63, 607–613. [Google Scholar] [CrossRef]
- Lan, H.; Cheng, B.; Gou, Z.; Yu, R. An evaluation of feed-in tariffs for promoting household solar energy adoption in Southeast Queensland, Australia. Sustain. Cities Soc. 2020, 53, 101942. [Google Scholar] [CrossRef]
- Buckman, G.; Sibley, J.; Ward, M. The large-scale feed-in tariff reverse auction scheme in the Australian Capital Territory 2012, to 2016. Renew. Energy 2019, 132, 176–185. [Google Scholar] [CrossRef]
- Schmidt, J.; Lehecka, G.; Gass, V.; Schmid, E. Where the wind blows: Assessing the effect of fixed and premium based feed-in tariffs on the spatial diversification of wind turbines. Energy Econ. 2013, 40, 269–276. [Google Scholar] [CrossRef]
- Pacudan, R. Feed-in tariff vs incentivized self-consumption: Options for residential solar PV policy in Brunei Darussalam. Renew. Energy 2018, 122, 362–374. [Google Scholar] [CrossRef]
- Zhang, R.X.X.; Ni, M.; Shen, G.Q.; Wong, J.K. An analysis on the effectiveness and determinants of the wind power Feed-in-Tariff policy at China’s national-level and regional-grid-level. Sustain. Energy Technol. Assess. 2019, 34, 87–96. [Google Scholar] [CrossRef]
- Du, Y.; Takeuchi, K. Does a small difference make a difference? Impact of feed-in tariff on renewable power generation in China. Energy Econ. 2020, 87, 104710. [Google Scholar] [CrossRef] [Green Version]
- Kitzing, L. Risk implications of renewable support instruments: Comparative analysis of feed-in tariffs and premiums using a mean–variance approach. Energy 2014, 64, 495–505. [Google Scholar] [CrossRef] [Green Version]
- Grover, D.; Daniels, B. Social equity issues in the distribution of feed-in tariff policy benefits: A cross sectional analysis from England and Wales using spatial census and policy data. Energy Policy 2017, 106, 255–265. [Google Scholar] [CrossRef] [Green Version]
- Kwon, T.-H. Policy mix of renewable portfolio standards, feed-in tariffs, and auctions in South Korea: Are three better than one? Util. Policy 2020, 64, 101056. [Google Scholar] [CrossRef]
- Ramírez, F.J.; Honrubia-Escribano, A.; Gómez-Lázaro, E.; Pham, D.T. Combining feed-in tariffs and net-metering schemes to balance development in adoption of photovoltaic energy: Comparative economic assessment and policy implications for European countries. Energy Policy 2017, 102, 440–452. [Google Scholar] [CrossRef]
- Winter, S.; Schlesewsky, L. The German feed-in tariff revisited-an empirical investigation on its distributional effects. Energy Policy 2019, 132, 344–356. [Google Scholar] [CrossRef]
- Caralis, G.; Chaviaropoulos, P.; Albacete, V.R.; Diakoulaki, D.; Kotroni, V.; Lagouvardos, K.; Gao, Z.; Zervos, A.; Rados, K. Lessons learnt from the evaluation of the feed-in tariff scheme for offshore wind farms in Greece using a Monte Carlo approach. J. Wind Eng. Ind. Aerodyn. 2016, 157, 63–75. [Google Scholar] [CrossRef]
- Tomar, V.; Tiwari, G. Techno-economic evaluation of grid connected PV system for households with feed in tariff and time of day tariff regulation in New Delhi—A sustainable approach. Renew. Sustain. Energy Rev. 2017, 70, 822–835. [Google Scholar] [CrossRef]
- Bakhshi, R.; Sadeh, J. Economic evaluation of grid–connected photovoltaic systems viability under a new dynamic feed–in tariff scheme: A case study in Iran. Renew. Energy 2018, 119, 354–364. [Google Scholar] [CrossRef]
- Lau, K.; Muhamad, N.; Arief, Y.; Tan, C.; Yatim, A. Grid-connected photovoltaic systems for Malaysian residential sector: Effects of component costs, feed-in tariffs, and carbon taxes. Energy 2016, 102, 65–82. [Google Scholar] [CrossRef]
- Marques, A.C.; Fuinhas, J.A.; Macedo, D.P. The impact of feed-in and capacity policies on electricity generation from renewable energy sources in Spain. Util. Policy 2019, 56, 159–168. [Google Scholar] [CrossRef]
- Li, Y.; Wang, N.; Zhao, W.-J.; Song, N.-Q. Discussion on ‘‘Assessing feed-in tariffs on wind power installation and industry development in Taiwan” (Renewable and Sustainable Energy Reviews 2016; 58: 548–57). Renew. Sustain. Energy Rev. 2018, 92, 638–641. [Google Scholar] [CrossRef]
- Tantisattayakul, T.; Kanchanapiya, P. Financial measures for promoting residential rooftop photovoltaics under a feed-in tariff framework in Thailand. Energy Policy 2017, 109, 260–269. [Google Scholar] [CrossRef]
- Castaneda, M.; Zapata, S.; Cherni, J.; Aristizabal, A.J.; Dyner, I. The long-term effects of cautious feed-in tariff reductions on photovoltaic generation in the UK residential sector. Renew. Energy 2020, 155, 1432–1443. [Google Scholar] [CrossRef]
- Li, Y.; Kubicki, S.; Guerriero, A.; Rezgui, Y. Review of building energy performance certification schemes towards future improvement. Renew. Sustain. Energy Rev. 2019, 113, 109244. [Google Scholar] [CrossRef]
- European Comission. Directive 2002/91/EC of the European Parliament and of the Council of 16 December 2002 on the energy performance of buildings. Offic. J. Eur. Union 2002, L001, 65–71. [Google Scholar]
- Directive, C. Directive 2010/31/EU of the European Parliament and of the Council. Off. J. Eur. Union 2010, 334, 117–119. [Google Scholar]
- Directive 2012/27/EU of the European Parliament and of the Council of 25 October 2012, on energy efficiency, amending Directives 2009/125/EC and 2010/30/EU and repealing Directives 2004/8/EC and 2006/32/EC. Offic. J. Eur. Union 2012, L315/1, 56.
- Directive (EU) 2018/844 of the European Parliament and of the Council of 30 may 2018 amending directive 2010/31/EU on the energy performance of buildings and directive 2012/27/EU on energy efficiency. Offic. J. Eur. Union 2018, L 156/75, 17.
- E.P.C. Across Europe: From Design to Implementation; Building Performance Institute Europe (BPIE): Brussels, Belgium, 2010; pp. 6–7. [Google Scholar]
- Sesana, M.M.; Salvalai, G. A review on Building Renovation Passport: Potentialities and barriers on current initiatives. Energy Build. 2018, 173, 195–205. [Google Scholar] [CrossRef] [Green Version]
- Arcipowska, A.; Anagnostopoulos, F.; Mariottini, F.; Kunkel, S. Energy performance certificates across the EU—A mapping of national approaches. Build. Performace Inst. Eur. Bruss. 2014, 1, 7. [Google Scholar]
- Pasichnyi, O.; Wallin, J.; Levihn, F.; Shahrokni, H.; Kordas, O. Energy performance certificates—New opportunities for data-enabled urban energy policy instruments? Energy Policy 2019, 127, 486–499. [Google Scholar] [CrossRef]
- Jenkins, D.; Simpson, S.; Peacock, A. Investigating the consistency and quality of EPC ratings and assessments. Energy 2017, 138, 480–489. [Google Scholar] [CrossRef]
- Toleikyte, A.; Kranzl, L.; Bointner, R.; Bean, F.; Cipriano, J.; De Groote, M.; Hermelink, A.; Klinski, M.; Kretschmer, D.; Lapilonne, B. ZEBRA 2020—Nearly Zero-Energy Building Strategy 2020: Strategies for a Nearly Zero-Energy Building Market Transition in the European Union; Zebra: Vienna, Austria, 2016; Available online: https://zebra2020.eu/publications/strategies-for-a-nearly-zero-energy-building-market-transition-in-the-european-union/ (accessed on 5 February 2020).
- Arcipowska, A.F.A.; Mariottini, F.; Kunkel, S. Energy Performance Certificates Across the EU; Buildings Performance Institute Europe (BPIE): Berlin, Germany, 2014; pp. 378–388. [Google Scholar]
Figure 1.
Net-zero emissions race [20].
Figure 1.
Net-zero emissions race [20].

Figure 2.
The development of energy sources for electricity production from 1990 to 2015 in Germany (Adopted from [29]).
Figure 2.
The development of energy sources for electricity production from 1990 to 2015 in Germany (Adopted from [29]).

Figure 3.
China’s National plans for renewable energy development [60].
Figure 3.
China’s National plans for renewable energy development [60].

Figure 4.
Energy development of the 13th Five Year Plan [60].
Figure 4.
Energy development of the 13th Five Year Plan [60].

Figure 5.
The policy design cycle (Adopted from [62]).
Figure 5.
The policy design cycle (Adopted from [62]).

Figure 6.
Energy Policy Success Criteria [62].
Figure 6.
Energy Policy Success Criteria [62].

Figure 7.
Energy policy model 1 (adopted from [83]).
Figure 7.
Energy policy model 1 (adopted from [83]).

Figure 8.
Energy policy Model 2 (adopted from [83]).
Figure 8.
Energy policy Model 2 (adopted from [83]).

Figure 9.
History of feed-in-tariff adoption internationally.

Figure 10.
Timeline for the development of Energy Performance Certificate in the EU Directives [115].
Figure 10.
Timeline for the development of Energy Performance Certificate in the EU Directives [115].

Figure 11.
The EPC database across EU-28 in 2014 [146].
Figure 11.
The EPC database across EU-28 in 2014 [146].

Figure 12.
The situation of quality control for EPC database across E-28 in 2014 [146].
Figure 12.
The situation of quality control for EPC database across E-28 in 2014 [146].

Figure 13.
Elements of the quality assurance of EPC systems [150].
Figure 13.
Elements of the quality assurance of EPC systems [150].


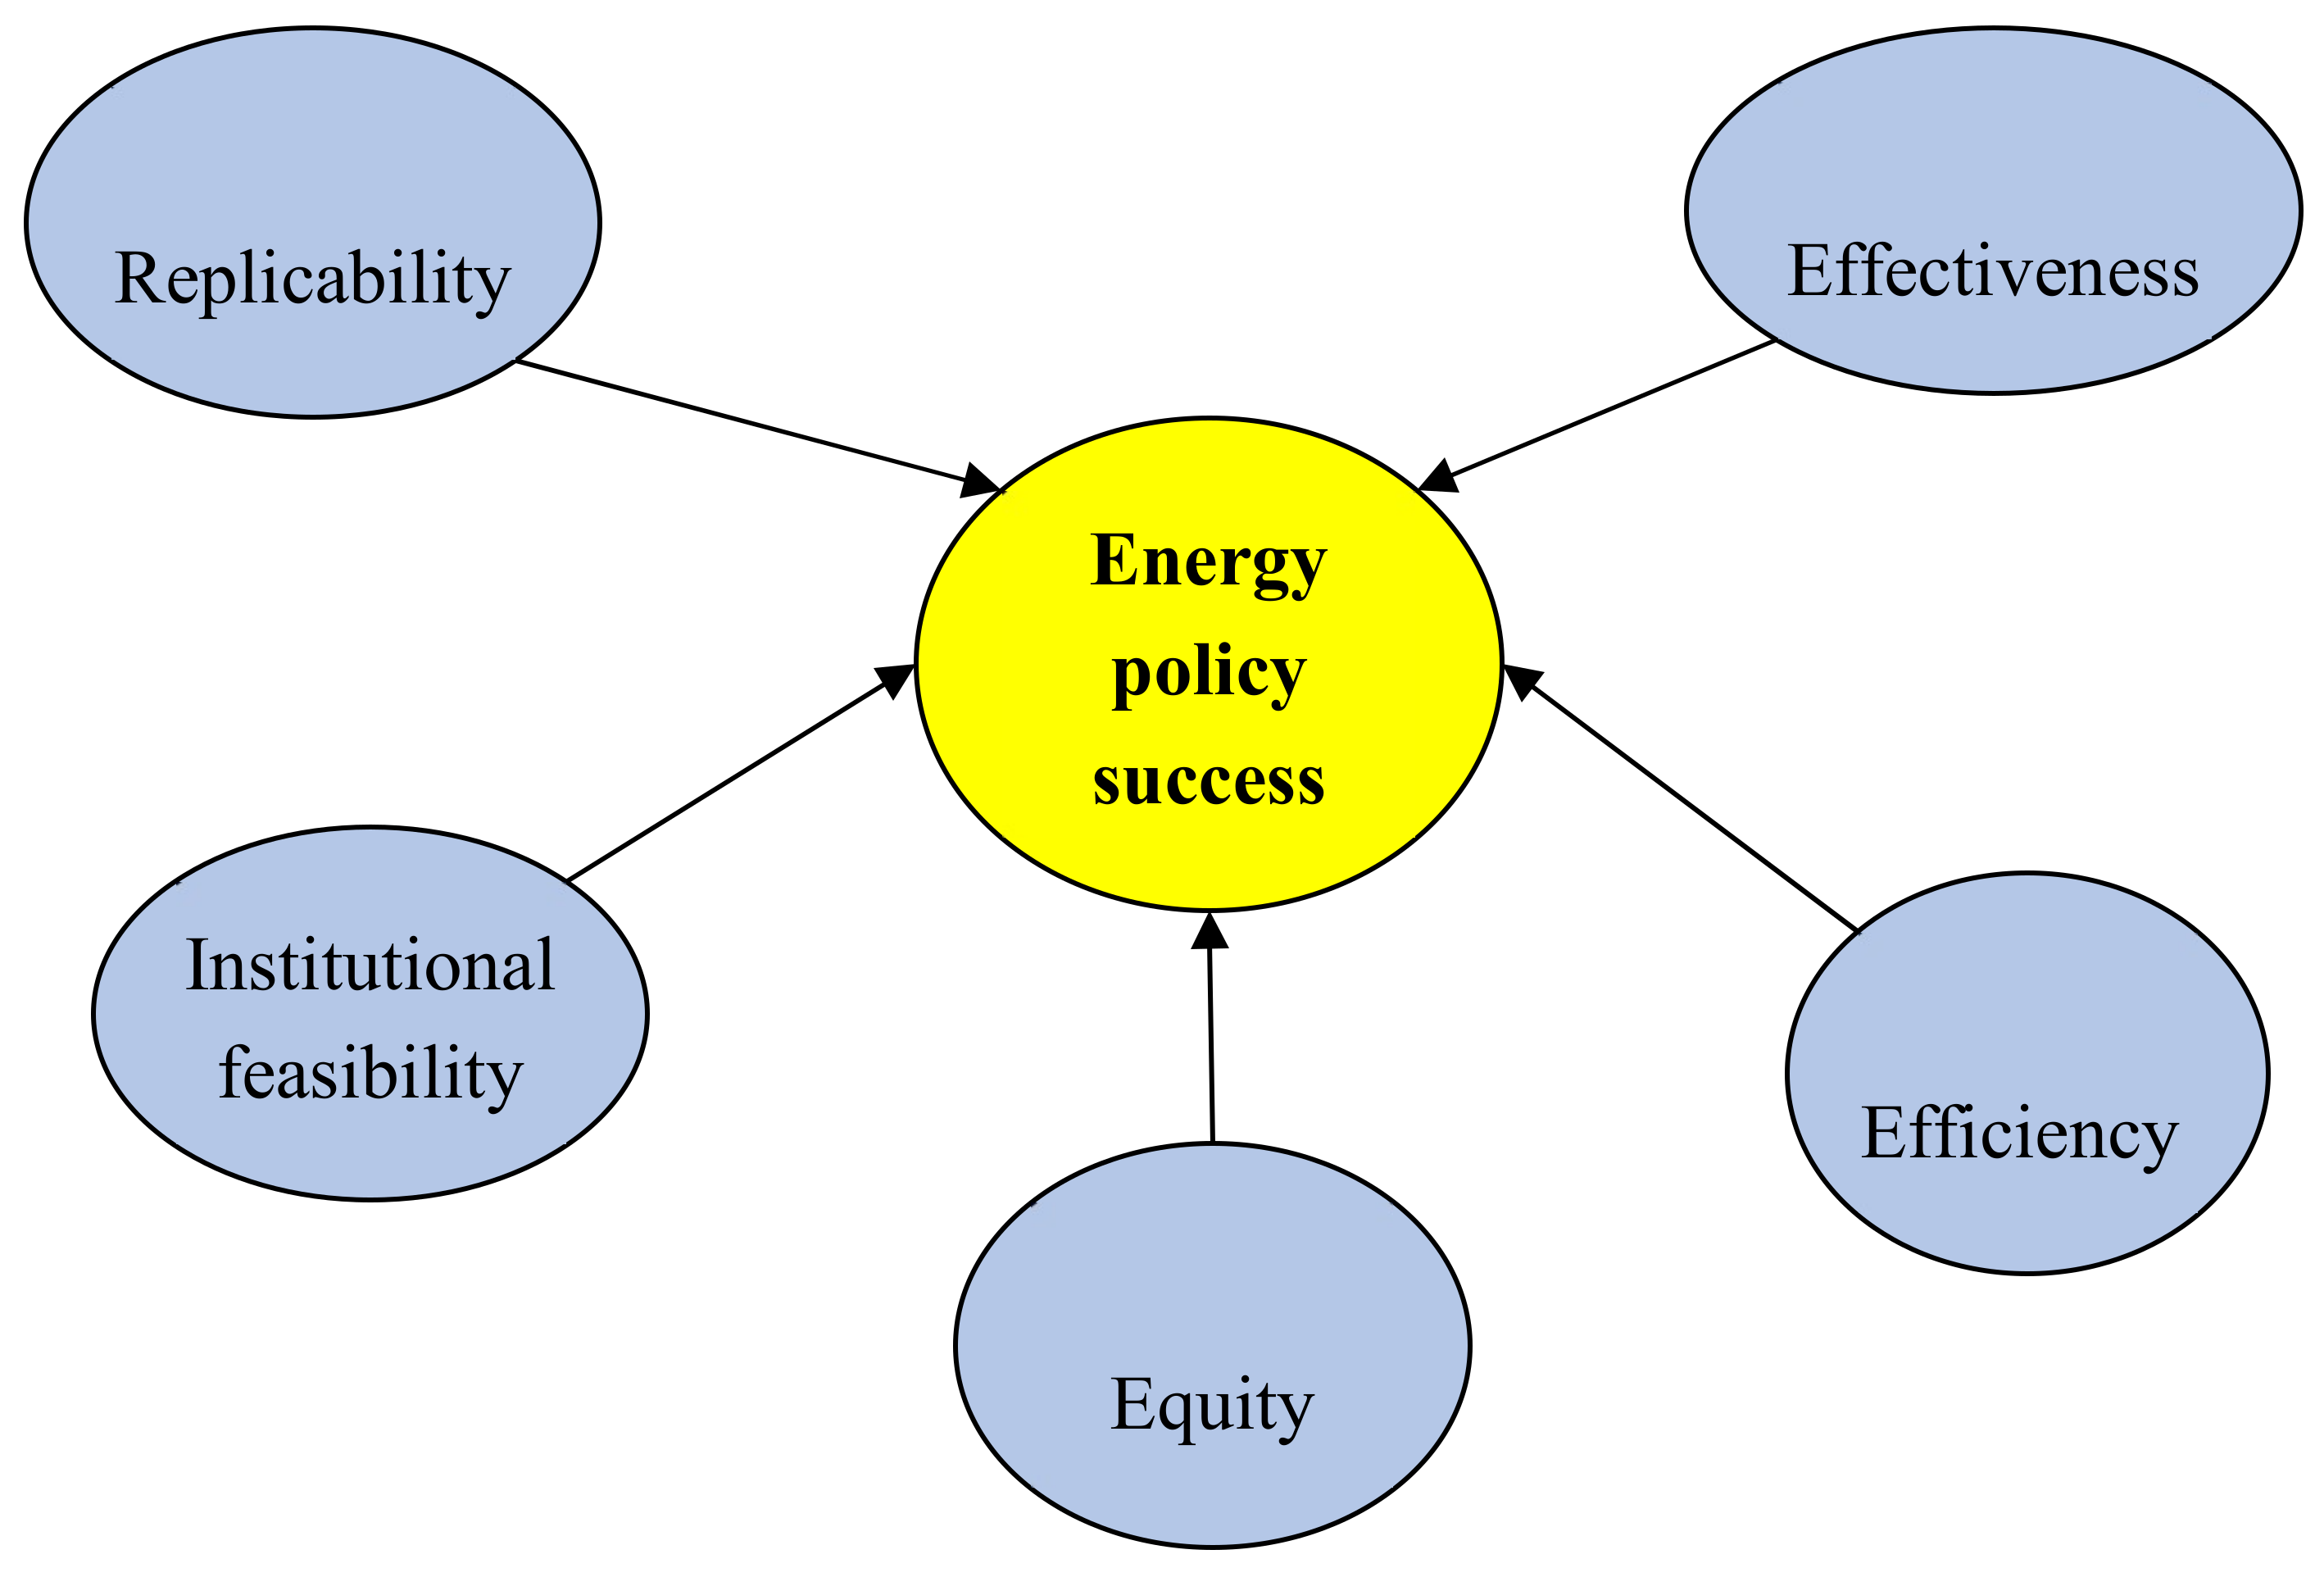
Table 1.
Sector: Transportation energy conservation and efficiency provisions [27].
Table 1.
Sector: Transportation energy conservation and efficiency provisions [27].
| Regulation | Description |
|---|---|
| EPAct 711,712,754 | Authorises Department of Energy (DOE) to accelerate efforts to develop hybrid electric and advanced diesel vehicles. |
| EPAct 751 | Authorises DOE research partnership with Department of Transportation (DOT) and Environment Protection Agency (EPA) to improve railroad efficiency. |
| EPAct 753, 758 | Authorises DOE, DOT, and NASA activities to improve the energy efficiency of aircraft. |
| EPAct 771, 774 | Authorises activities to fund implementation and enforcement of existing fuel economy standards and updating of testing procedures. |
| EPAct 1701-1704 | Authorises load guarantee program for innovative energy technologies including those for transportation energy efficiency. |
| EISA 102, 104 | Establishes new average fuel economy standards for automobiles and certain other vehicles and a trading program to allow manufacturers to earn credits when vehicles exceed standards. |
| EISA 131, 135 | Authorises DOE research and grant program for electric and hybrid electric vehicles and loan guarantees for the manufacture of advanced vehicle batteries and battery systems. |
Table 2.
Sector: Buildings energy conservation and efficiency provisions [27].
Table 2.
Sector: Buildings energy conservation and efficiency provisions [27].
| Regulation | Description |
|---|---|
| EPAct 102, 103, 109 | Establishes new energy reduction goals for federal buildings, including authorisation of metering for measurement and verification, and updated building energy performance standards. |
| EPAct 121–128 | Authorises new funding for state and local programs including weatherisation assistance, appliance rebates, grants to low income communities, and incentives for states to implement energy-efficient building codes. |
| EPAct 135 | Authorises development of energy conservation standards for additional products including, for example, fluorescent lamps, dehumidifiers, battery chargers, illuminated exit signs, vending machines, ceiling fans, and small package commercial air conditioning and heating systems. |
| EPAct 912, 913, 921 | Authorises new DOE programs in solid state lighting, building energy performance, and micro-cogeneration technologies. |
| EISA 301–316 | Authorises expanded set of standards for home appliances and building equipment including external power supplies, residential boilers, walk-in coolers and freezers, and procedures for expedited rulemakings, updated test procedures and regional approaches. |
| EISA 411–413 | Activities for residential buildings including reauthorisation of funding for weatherisation and energy code improvements for manufactured housing. |
| EISA 431–441 and 511–548 | Activities for federal and other government buildings including higher energy reduction goals, and authorisation for high-performance ‘‘green’’ federal buildings, new provisions for energy-saving performance contracting, streamlined procurement provisions, and block grants for state and local governments and Native American tribes. |
Table 3.
Sector: Industry energy conservation and efficiency provisions [27].
Table 3.
Sector: Industry energy conservation and efficiency provisions [27].
| Regulation | Description |
|---|---|
| EPAct 106 | Authorises DOE to establish a voluntary program in collaboration with industrial sector companies to make commitments to reduce industrial energy intensity. |
| EPAct 922 | Authorises DOE to establish a program to improve the efficiency of high-power density facilities including data centers, server farms, and telecommunications facilities. |
| EPAct 1701–1704 | Authorises load guarantee program for innovative energy technologies including those for industrial energy efficiency. |
| EISA 451 | Authorises DOE program to expand activities in waste energy recovery, district energy systems, and combined heat and power through funding for research and development, grants to the states, and outreach to decision makers using regional clean energy application centers. |
| EISA 452 | Authorises DOE programs to support energy-efficiency improvements in the energy-intensive industries through research, development, demonstration, technology transfer, and grants for innovative technologies. |
| EISA 453 | Expands authorities for activities to reduce energy consumption in energy-intensive data centers. |
| EISA 1002 | Authorises workforce training programs for ‘‘green jobs’’ including manufacturing of energy efficiency and renewable energy products through research and state programs. |
Table 4.
Sector: Electric power energy conservation and efficiency provisions [27].
Table 4.
Sector: Electric power energy conservation and efficiency provisions [27].
| Regulation | Description |
|---|---|
| EPA 139 | Authorises a study of energy-efficient electric and natural gas utilities. |
| EPA 921, 925, 925 | Authorises DOE programs for distributed energy and electric transmission and distribution through research, development, demonstration, analysis, and technology transfer. |
| EPA 1701–1704 | Authorises load guarantee program for innovative energy technologies including those for energy efficiency in electric power. |
| EISA 1301–1309 | Authorises programs for “smart grid” technologies, tools, and techniques through research, development, demonstration, technology transfer, cost-shared grants, and interoperability standards to enhance flexibility and functionality of grid operations and enable grid integration of demand response, conservation, energy efficiency, and renewable energy systems. |
| National Policy | Description |
|---|---|
| CERT—Carbon Emissions Reduction Target | Larger energy company supplier targets for energy-efficiency improvements via loft insulation and low energy light bulb distribution. Ended 2012 [35,36]. |
| CESP—Community Energy Saving Programme | Energy companies required to target low income households with improved energy-efficiency standards and lower bills. Additional credit for ‘whole house’ and community approaches. Ended in 2012 [35,36]. |
| Warm Home Discount | Financial support from electricity and gas suppliers for fuel poor households [37]. |
| CRC—Carbon Reduction Commitment | From 2012 large commercial organisations with consumption of more than 6000 MWh of electricity must pay CO2 tax initially set at £12/ton [38]. |
| Green Deal | Owner occupiers can borrow against future household energy bills to pay for home energy-efficiency improvements [35,36,37,38,39,40]. |
| ECO—Energy Company Obligation | From 2013, CERT and CESP replaced by three schemes. Carbon Emissions Obligation requires major suppliers to target ‘hard to treat’ households. Carbon Saving Community Obligation requires suppliers to support community energy-efficiency schemes such as District Heating. Home Heating Cost Reduction Obligations requires targeting of heat energy-efficiency measures (e.g., boiler replacement) on low income and vulnerable customers [38]. |
| FiT—Feed-in-Tariff | This is the renewable electricity generation support scheme for generators with capacity of less than 5 MW. This offers a fixed payment per kWh depending on size and type of technology [41]. |
| CfD—Contract for Difference | The renewable obligation (RO) scheme is due to be replaced by CfDs. This offers insurance payments equal to the difference between the average wholesale market price and a fixed strike price in the CfD for eligible large-scale renewable generation [42]. |
| RHI—Renewable Heat Incentive | From 2011 Renewable Heat Premium Payments were available to both non-domestic and domestic producers of renewable heat, providing partial support for those who install renewable heating systems. The domestic RHI budget was only £15 m in 2011/12 but the total RHI budget was £251 m in 2013/14 [43,44]. |
| The Renewable Obligation scheme | Suppliers meet their obligations by presenting Renewable Obligation Certificates (ROCs) to Ofgem. Where suppliers do not have sufficient ROCs to cover their obligation, a payment is made into the buy-out fund. The extension of the scheme from 2027 to 2037 was declared on 1 April 2010 and is detailed in the National Renewable Energy Action Plan [45]. |
Table 6.
Share of electricity from renewable sources in Denmark [51].
Table 6.
Share of electricity from renewable sources in Denmark [51].
| Shares and Targets | |
|---|---|
| In 1997 | 9% |
| Target for 2010 | 29% |
| Share in 2012 | 39% |
| National targets for renewable electricity | 50% by 2020; 100% by 2050 |
| Wind energy | Cumulative installed capacity: 4.7 GW; Target for 2020: 3.9 GW |
| Photovoltaic | Cumulative installed capacity: 0.548 GW Target for 2020: 0.006 GW |
Table 7.
The standard system for building energy efficiency in new buildings [51].
Table 7.
The standard system for building energy efficiency in new buildings [51].
| Building Energy Efficiency Standard | Key Points | |
|---|---|---|
| Design standard | Design Standards for Energy Efficiency of Residential Buildings in cold and frigid Zone (1986, 1995, 2010, 2018) | Provide specific requirement on energy saving from the aspects of building envelope, heating ventilation and air conditioning system (HVAC) for residential buildings in the heating area |
| Design Standard for Energy Efficiency of Residential Building in Hot Summer and Cold Winter Zone (2001, 2010) | Provide specific requirement on the thermal insulation performance of residential building envelope and energy savings in HVAC system | |
| Design Standard for Energy Efficiency of Residential Building in Hot Hummer and Warm Winter Zone (2003, 2012) | Provide specific requirement on the thermal performance of the wall and roof, the shading and heat insulation performance, and energy savings in HVAC system | |
| Design Standard for Energy Efficiency of Public Buildings (2005, 2015) | Applicable to all climate zones in China, provide specific requirement on energy-saving measures and requirements for different climate zones from the thermal insulation performance of building envelope and HVAC system | |
| Acceptance standard | Acceptance Specification for Construction Quality of Building Energy Conservation Projects (2007, 2014) | Provide specific requirement on related energy conservation projects (wall, curtain wall, door, window, roof, ground heating, ventilation, air conditioning, air conditioning and heating system, cold and heat sources, pipe network distribution and lighting monitoring and control), on-site inspection of building energy conservation project, and quality acceptance for part of the building energy conservation project, etc. |
Table 8.
The items included in building design standard of China.
| Commercial Building | Residential Building | |||
|---|---|---|---|---|
| Public Building (2015) [53] | Cold and Frigid Zone (2018) [54] | Hot Summer and Cold Winter Zone (2010) [55] | Hot Summer and Warm Winter Zone (2012) [56] | |
| Building Envelope | √ | √ | √ | √ |
| HAVC System | √ | √ | √ | √ |
| Hot water and Pump | √ | √ | × | × |
| Lighting | √ | √ | × | √ |
| Electricity | √ | √ | × | × |
| Tradeoffs and Building Performance Calculations | √ | √ | √ | √ |
| New Energy | √ | √ | √ | × |
Table 9.
Modelling Methodologies and Themes [63].
Table 9.
Modelling Methodologies and Themes [63].
| Modelling Methodology | Major Themes | Source |
|---|---|---|
| Linear programming and dynamic programing | Capacity expansion and energy-economy analysis | WASP model [64], and MARKAL model [65] |
| A mixed-integer linear program | Distributed energy resource system | MILP model [66] |
| Econometric methods | Annual energy outlook and the role of carbon capture and storage | NEMS model [67] and SGM model [68] |
| Partial equilibrium model | Develop the US Climate Action Plan | IDEAS model [69] |
| Optimisation | Energy-economy interactions and the options for SO2 control | Meier and Mubayi’s model [70] and Islas and Grande’ s model [71] |
| Scenario analysis | Energy policies | Munasinghe and Meier’s model [72] |
| Agent-based | Quantitative support for climate policy formulation and evaluation | ENGAGE model [73] |
Table 10.
Comparison of energy-efficiency codes for single family and multifamily in various countries [95].
Table 10.
Comparison of energy-efficiency codes for single family and multifamily in various countries [95].
| Country | Energy Regulation Name | Regulation Type | Stringency | Incentives | Energy-Efficiency Measures | |||||||
|---|---|---|---|---|---|---|---|---|---|---|---|---|
| Heating and Cooling | Design Guidelines | Construction Details Methodology | Wall and Ceiling Insulation | Air Sealing and Ventilation | Lighting Efficiency | Windows U-Value and SHGC | Other Installations | |||||
| Australia | BCA 2010-6 Star NatHERS Rating for Buildings [96] | SC | M | Y | Y | Y | N | Y | Y | N | N | Y |
| Brazil | Brazilian Energy Labelling Schemes for Residential Buildings (RTQ-2010) [97] | PU | V | N | N | N | N | N | N | N | N | N |
| Canada | National Energy Code of Canada for Buildings 2017 [98] | SC | Mi | Y | Y | Y | Y | Y | Y | Y | Y | Y |
| China | National Building Energy Standards [99] | PC | M | Y | Y | Y | Y | Y | Y | Y | Y | Y |
| France | RT2012 [100] | CC | M | Y | Y | Y | Y | Y | Y | Y | Y | N |
| Germany | EnEV 2014 [101] | PC | M | Y | Y | Y | Y | Y | Y | Y | Y | Y |
| Italy | EU Energy Performance of Buildings Directive (EPBD) 2018/844 [102] | PC | M | Y | Y | Y | Y | Y | Y | Y | Y | Y |
| India | State/city regulation in few states [103] | PU | Mi | N | Y | Y | N | N | N | N | Y | N |
| Japan | Energy Conservation Policy for Housing 2011 [104] | PU | Mi | Y | Y | Y | Y | Y | Y | N | Y | N |
| Mexico | 2009 New Mexico Energy Conservation Code [105] | SC | M | Y | Y | N | N | Y | N | Y | Y | N |
| New Zealand | New Zealand Building Code (NZBC)-Clause H1 [106] | CC | M | Y | Y | Y | N | Y | N | Y | Y | N |
| Russia | Presidental Decree 2012, State Programme on Energy Savings 2010 [107] | PU | M | Y | Y | Y | Y | Y | Y | Y | Y | N |
| South Africa | South Africa National Standard SANS 0204: Energy Efficiency in Buildings 2011 [108] | PC | M | Y | Y | Y | Y | Y | Y | Y | Y | Y |
| South Korea | Building Design Criteria for Energy Saving (BDCES) 2008 [109] | PU | M | Y | Y | Y | Y | Y | Y | Y | Y | Y |
| Spain | Technical Building Code 2007 [110] | PC | M | Y | Y | Y | Y | Y | Y | Y | Y | Y |
| UK | Building Code on Conservation of Fuel and Power 2018-Part L [111] | SC | M | Y | Y | Y | Y | Y | Y | Y | Y | Y |
| US | 2018 International Residential Code (IRC) [112] | SC | Mi | Y | Y | Y | Y | Y | Y | Y | Y | Y |
Note: SC-Substitute co-regulation, PU-Public, CC-Conditional co-regulation, PC-Prescribed co-regulation; Mi-Mixed (Regulation is enforced mandatory in some parts of a country), M-Mandatory, V-Voluntary; Y-Yes, N-No.
Table 11.
A summary of literatures on feed-in-tariff (FiT) in different countries.
| Authors | Country/Region | Research Purposes |
|---|---|---|
| Lan et al. (2020) [120] | Australia | Apply a rigorous spatial econometric analysis model for the first time to evaluate the effectiveness of Australia’s household solar energy FiT policies. |
| Buckman et al. (2019) [121] | Australia | Compare the processes and outcomes of all 4 FiT reverse auctions conducted by the Australian Capital Territory Government between 2012 and 2016. |
| Schmidt et al. (2013) [122] | Austria | Analyze the effects of two different schemes (i.e., the fixed-price FiT and the premium based FiT) in a policy experiment for Austria. |
| Pacudan (2018) [123] | Brunei Darussalam | Assess policy options for the proposed 5-year rooftop solar PV deployment program in Brunei Darussalam targeting around 1000 households per year or installing a total of 50 MWp1(500,010 kWp) capacity in 5 years. |
| Moore et al. (2013) [119] | Canada | Use On-site data collection, interviews and financial models to determine the FiT rate required to encourage investment in the generation of electricity from currently unused biomass. |
| Zhang et al. (2019) [124] | China | Examine the effectiveness of the current wind FiT policy at a national-level. |
| Du et al. (2020) [125] | China | Investigate the effectiveness of regionally differentiated feed-in tariffs (FiT) for the development of renewable energy in China. |
| Kitzing (2014) [126] | Denmark | Identifies the risk implications of FiT. |
| Grover and Daniels (2017) [127] | England and Wales | Observe which socioeconomic groups are benefitting most and least under the policy. |
| Kwon et al. (2020) [128] | South Korea | Examine the effects of policy mix supporting electricity from renewable energy sources (RES-E) in South Korea. |
| Javier Ramírez et al. (2017) [129] | European countries | Provide a comparative cost effectiveness assessment using feed-in tariffs (FiT) and net-metering (NM) schemes in some representative EU countries. |
| Hitaj and Löschel (2019) [77] | Germany | Estimate the impact of a FiT on wind power investment and emission reductions in Germany from 1996–.2010. |
| Winter and Schlesewsky (2019) [130] | Germany | Investigate how the benefits (and burdens) of this subsidisation scheme are distributed by using micro-data from SOEP for private households during the period of 2010–17. |
| Caralis et al. (2016) [131] | Greece | Investigate the profitability range of offshore wind energy investments in Greece considering the uncertainties faced. |
| Tomar and Tiwari (2017) [132] | India | Discuss the feasibility of grid connected Rooftop/Building integrated photovoltaic (BIPV) system with incorporating feed-in-tariffs/net-metering process along with Tariff of day (ToD) tariff regulation. |
| Bakhshi and Sadeh (2018) [133] | Iran | Investigates the viability of Grid-connected photovoltaic (GCPV) technology under a new dynamic FiT strategy. |
| Lau et al. (2016) [134] | Malaysian | Analyze the effects of component costs, FiTs and carbon taxes on grid-connected PV systems in residential sector. |
| Marques et al. (2019) [135] | Spain | Analyze the impact of feed-in tariffs, feed-in premiums, and capacity payments on electricity generation by source. |
| Li et al. (2018) [136] | Taiwan | Illustrate the structure characteristics of the system dynamics (SD) model and offer suggestions to perfect the historical test proposed in the discussed paper. |
| Tantisattayakul and Kanchanapiya (2017) [137] | Thailand | Perform a feasibility analysis of grid-connected solar PV rooftops for households under the present feed-in-tariff. |
| Castaneda et al. (2020) [138] | United Kingdom | Investigate the long-term effects of cautious feed-in tariff reductions on household’s PV adoption, utilities and solar companies by considering a systems approach. |
© 2020 by the authors. Licensee MDPI, Basel, Switzerland. This article is an open access article distributed under the terms and conditions of the Creative Commons Attribution (CC BY) license (http://creativecommons.org/licenses/by/4.0/).
Share and Cite
MDPI and ACS Style
Lu, Y.; Khan, Z.A.; Alvarez-Alvarado, M.S.; Zhang, Y.; Huang, Z.; Imran, M. A Critical Review of Sustainable Energy Policies for the Promotion of Renewable Energy Sources. Sustainability 2020, 12, 5078. https://doi.org/10.3390/su12125078
AMA Style
Lu Y, Khan ZA, Alvarez-Alvarado MS, Zhang Y, Huang Z, Imran M. A Critical Review of Sustainable Energy Policies for the Promotion of Renewable Energy Sources. Sustainability. 2020; 12(12):5078. https://doi.org/10.3390/su12125078
Chicago/Turabian StyleLu, Yuehong, Zafar A. Khan, Manuel S. Alvarez-Alvarado, Yang Zhang, Zhijia Huang, and Muhammad Imran. 2020. "A Critical Review of Sustainable Energy Policies for the Promotion of Renewable Energy Sources" Sustainability 12, no. 12: 5078. https://doi.org/10.3390/su12125078
Note that from the first issue of 2016, this journal uses article numbers instead of page numbers. See further details here.