Is Honesty the Best Policy? Examining the Role of Price and Production Transparency in Fashion Marketing


1
Department of Design, Housing, and Apparel, College of Design, University of Minnesota, St. Paul, MN 55108, USA
2
Department of Textile and Apparel, Technology and Management, Wilson College of Textiles, North Carolina State University, Raleigh, NC 27606, USA
*
Author to whom correspondence should be addressed.
Sustainability 2020, 12(17), 6800; https://doi.org/10.3390/su12176800
Submission received: 22 June 2020
/
Revised: 31 July 2020
/
Accepted: 19 August 2020
/
Published: 21 August 2020
Abstract
:Transparency is one of the most prominent demands of consumers today. Numerous fashion brands are responding to this demand for transparency by sharing information on the cost-breakdown of products and manufacturing processes. Research shows that transparency can become a vital tool for product, process, and business model innovation. Nonetheless, little is known about the role of transparency and how it affects consumers’ perceptions of a brand in a fashion context. By applying the signaling theory, the purpose of this study is to investigate how consumers react to fashion brands that provide price or production transparency. The study further examines whether the extent of information disclosure and perceived fairness of the information also play a role. An experiment of nine scenarios using a fictitious fashion brand was developed, and data were collected from 349 American consumers through Amazon Mechanical Turk (MTurk). The findings suggest that both price transparency and production transparency positively affect the overall brand equity and consumers’ purchase intentions as long as the information is perceived to be fair regardless of the extent. This study extends our current understanding of the role of transparency as an extrinsic signal and also suggests that brand transparency may be another key dimension of brand equity.
1. Introduction
Transparency is the act of disclosing information to all of the organization’s stakeholders through its reporting mechanisms [1]. This notion of transparency is one of the most prominent demands of consumers today. A study shows that 52% of Millennials always research for background information before purchasing, and 42% say they want to know what goes into products and how the goods are made before they purchase them [2]. Furthermore, Millennials and Generation Z’s are known to seek products that are sustainable and ethical, and search for sustainable products is leading them to adopt new consumption patterns that go beyond a search for good value products [3,4]. Combined with growing concerns about issues such as fair labor and environmental impact of consumption, the emerging generation of consumers are increasingly expressing their desire for transparent business practices and their willingness to support such brands [3,5].
Numerous fashion brands including Everlane, Patagonia, Oliver Cabell, and Arket are responding to this demand for transparency by sharing information on the cost-breakdown of products and manufacturing processes. Defying the popularity of the fast fashion business model, the online apparel retailer Everlane has devoted its marketing efforts to offering customers a glimpse into its factories, giving voice to garment workers, and sharing price details of its products. Everlane has engaged in a practice called ‘Radical Transparency’ since the launch of the company by breaking down various components of production costs including labor, materials, transportation, and duties, for each of their products. Everlane publishes a detailed chronicle containing graphical illustrations from field visits, descriptions of their relationships with vendors, and key initiatives undertaken to benefit the vendor community. By incorporating transparency as a key corporate value, the company achieved $100 million in revenue (2016) only a few years since the launch and is now valued at over $250 million (2019) [6].
Similarly, outerwear brand Patagonia provides transparency by publicly displaying information about its supply chain through a practice called ‘Footprint Chronicles’. Footprint Chronicles features videos showing each step of the supply chain including all textile mills and sewing factories. If any part of the manufacturing process needs improvement, Patagonia acknowledges that directly in the video and invites feedback from customers [7]. The company’s efforts for a transparent business practice seems to have resonated with its target consumers. Patagonia, with its revenue approaching $1 billion a year, was recognized as the UN Champion of Earth, the United Nation’s top environmental honor [8]. Moreover, such efforts toward transparency have allowed both Patagonia and Everlane to build trust with their customers and to hold themselves accountable for their business practices [3,6]. Additionally, according to a recent survey of executives from the apparel and footwear industries, a majority of the companies (56 percent) acknowledged a significant return on investment of transparency efforts given its role in improving the brand reputation and customer loyalty [9].
Research shows that for proactive companies, transparency can also become a vital tool for the product, process, and business model innovation [10]. The issue of transparency is especially critical for fashion brands since the fashion industry is frequently scrutinized for its unethical supply chain [11]. A supply chain is defined as “all the activities involved in delivering a product from raw material through to the consumer, including sourcing raw materials and parts, manufacturing and assembly, warehousing and inventory tracking, order entry and order management, distribution across all channels, delivery to the customer, and the information system necessary to monitor all these activities” [12] (p. 428). Among these activities, the manufacturing or production process is often said to be the most contentious and opaque area of the fashion supply chain as evidenced by controversies surrounding the treatment of workers (e.g., low wage, child labor, unsafe working conditions) [13]. Another area that demands transparency in the fashion industry is pricing. While price is considered to be the single most decisive factor when consuming fashion products, detailed pricing information remains largely hidden from consumers [14,15]. Given the current movement towards sustainability, transparency may become the driving force behind sustainable industry practice.
Despite such significance, little is known about the role of transparency in regard to pricing and production and how it affects consumers’ purchase intentions and equity of a brand during apparel purchase. While prior research has established the importance of transparency in building brand loyalty and reputation [16,17], studies have yet to examine how consumers react to the presence of cost-breakdown or manufacturer information in the apparel consumption context. In addition, although previous studies on transparency focused on the effectiveness of transparency on consumers’ responses [18,19], different conditions of transparency (e.g., level of disclosure, perceived fairness of information) that would generate an optimal consumer response have not been sufficiently addressed yet.
To fill the identified research gap, the purpose of this study is to investigate consumers’ response to companies that provide price or production transparency using the signaling theory. Specifically, this study entails nine experimental scenarios, where the effects of price transparency and production transparency are examined through a hypothetical online shopping scenario. The findings of this research will extend our theoretical understanding of the role of transparency in marketing. Furthermore, it will offer insights for retailers to recognize the importance of transparent business practice and develop marketing strategies accordingly.
2. Literature Review and Hypotheses Development
2.1. Price Transparency
Price transparency exists when a company shares information about its quoted prices with customers in a clear and comprehensive way [20]. Such information may include price-setting, price-changing, or cost breakdown information (e.g., designated mark-up, motive for future price increase, direct unit cost) [21,22]. Previous studies have shown that price transparency offers several advantages for both consumers and companies. First, price transparency helps consumers determine price fairness of the offered product. This, in turn, aids in consumers’ purchase decision-making process as they can use the price fairness judgment in finding the best deals in the market and be more satisfied with their choice [22]. Studies have also demonstrated that price transparency is one of the most salient factors affecting price satisfaction. With the presence of price transparency, consumers’ search and evaluation costs diminish and lead to higher price satisfaction [23,24].
For a company, being transparent about its pricing strategy builds trust among consumers. If a company is opaque with pricing and refuses to disclose information, consumers may think that it has something to hide [25]. The act of sharing confidential information such as a pricing strategy or cost breakdowns signals to consumers that the company is willing to disclose intimate information with them [17]. Hence, price transparency is known to result in higher brand loyalty and even higher sales [17,22]. Furthermore, price transparency is shown to positively affect word-of-mouth sharing intentions and reduce brand switching intentions [24] while strengthening the assurance and reliability of the company [26]. Price transparency is also advantageous when a company has to increase its price. When consumers gain knowledge about how sellers set and change prices, it helps consumers empathize with the pricing decisions. This potentially results in consumers accepting price increases with less negative reactions [21].
2.2. Production Transparency
There has been a growing demand for sustainable business practices across industries, and consumers are increasingly asking for information about sustainability efforts carried out by companies [27,28]. One way to demonstrate such sustainable business practice is to disclose information about the supply chain system, particularly the manufacturing process of a business’ products. Egels-Zandén et al. [18] suggest that supply chain transparency comprises disclosure of three dimensions: (i) the names of the suppliers involved in producing the firm’s products, also referred to as ‘traceability’, (ii) information about the sustainability conditions at these suppliers, and (iii) the buying firms’ purchasing practices (i.e., providing a cost breakdown specifying the cost of the product). Ideally, a transparent company would combine the traceability, sustainability, and purchasing dimensions and publish the names, conditions, and purchasing practices related to each supplier [18].
Maintaining a transparent supply chain is advantageous for companies as it can build legitimacy and strengthen reputation [16]. Similar to having transparent pricing information, Strutnin [19] argued that a transparent supply chain helps build customer loyalty and brand image and is important for assuring product quality and safety. Supply chain transparency also empowers stakeholders including consumers since reducing information asymmetries allows stakeholders to hold firms accountable for their practices [29]. Indeed, studies have shown that consumers’ willingness to purchase increases when a company discloses information on its production process [30]. Bhaduri and Ha-Brookshire [27] asserted that consumers “feel a lot better” if the products have transparent information and business practice and were willing to pay a higher price for such products even if they have to compromise on product quality. Their study was conducted in the apparel industry context and further discovered that consumers considered manufacturing to be the most significant concern of the overall apparel production process. As such, this study focuses on the manufacturing or production aspect of the overall apparel supply chain.
2.3. Signaling Theory
Signaling theory is based upon the situation of information asymmetry between two parties, a person who sends a signal and one who receives a signal [31]. A signal serves as a cue a person can use to assess an object under the condition of information asymmetries [31,32]. In marketing interaction, signaling theory has been often applied to understand how a buyer and seller deal with information in pre-purchase situations [33]. When buyers do not have sufficient information about product quality prior to purchase, sellers with high-quality products may desire to send a signal about their products through advertising [31]. The signal serves as a cue that a seller can use “to convey information credibly about unobservable product quality to the buyer” [34], p. 259. The buyer then uses the signal to judge the products.
Signals in interaction can be categorized into two types: intrinsic and extrinsic cues. Intrinsic cues are inherent attributes of a product that can change fundamental product attributes if altered [35]. Extrinsic cues are product-related characteristics, which are “not inherent to the product being evaluated” [33], p. 375. Thus, changes to the extrinsic attributes do not influence the fundamental nature of the product [35]. Examples of extrinsic cues include brand name [36], retailer reputation [37,38] price and physical appearance [38], country of origin, store name [39,40], and store environments [41]. While both intrinsic and extrinsic cues are used by consumers to evaluate an object, extrinsic cues may be more influential in certain contexts. When consumers have limited time [42] or have a lower need for cognition [43], they tend to rely on extrinsic signals. This is given that extrinsic cues are easier to access and understand than intrinsic cues when consumers have lower involvement or interest to explore the product [38,42].
Signaling theory in branding literature indicates that it is the firm’s marketing mix that shapes a brand signal [44]. In other words, the marketing strategies embedded in a brand serve as an extrinsic cue, signaling product quality information to consumers. As discussed above, consumers tend to have positive perceptions toward companies that provide transparent information [27]. Therefore, this study considers a firm’s pricing and production transparency as positive signals that can attract consumers to the brand and its products.
2.4. Extent of Disclosure & Perceived Fairness
Signals are known to reduce information asymmetry between a signaler (e.g., a firm) and a receiver (e.g., a consumer) [32]. Here, the receivers are outsiders, thus having insufficient information compared to the insiders (i.e., signalers). However, through signaling relevant information, the discrepancy of information between the two parties is decreased [45]. In particular, studies have demonstrated that greater visibility of the signals increases their effectiveness [46]. This is given that a higher number of signals (i.e., a greater amount of information sent by the firm) mitigates uncertainty and subsequently decreases the information gap [47,48].
However, a high level of information disclosure does not always equate effectiveness. Since a signal is often qualitative, requiring interpretations by the receiver [49], its reception may also vary. Therefore, how consumers perceive and interpret a signal should be considered. Specifically, this study investigates the perceived fairness of information. Perceived fairness refers to “consumers’ assessments of whether a seller’s policy, price or service is reasonable or justifiable” [50], p. 250. Earlier research discovered that how the price terms are “handled and explained to the consumer (i.e., pricing procedure)” can determine consumers’ perceived fairness [51], p. 50. Furthermore, a company’s treatment of employees, such as safety procedures, working hours, and additional social benefits, can influence consumer perceived ethicality of the firm’s business practice [52]. However, to the authors’ knowledge, there is a lack of understanding of how the extent of disclosure and consumers’ perceived fairness, which may be critical characteristics of transparency practices, interact to influence consumers’ responses. Therefore, this study investigates whether greater transparency helps consumers form a positive brand image and whether the perceived fairness of information affects consumers’ evaluations of a brand.
2.5. Brand Equity & Purchase Intention
Brand equity has been viewed from a variety of perspectives and has several definitions. According to Aaker [53], brand equity is “a set of brand assets and liabilities linked to a brand, its name, and symbol, that add to or subtract from the value provided by a product or service to a firm and/or to that firm’s customers” (p. 15). He explained that brand equity is composed of dimensions including brand loyalty, awareness, perceived quality, associations, and other proprietary brand assets such as patents, trademarks, channel relationships, etc. [53]. Keller’s [54] consumer-based brand equity is defined as “the differential effect of brand knowledge on consumer response to the marketing of the brand” (p. 1). He suggested that a brand has positive brand equity when “consumers react more favorably to an element of the marketing mix for the brand than they do to the same marketing mix element when it is attributed to a fictitiously named or unnamed version of the product or service” (p. 1). Simply put, brand equity is the incremental value added to the product due to the brand name [55].
Since brand equity is a multidimensional construct, studies have shown that a number of different brand factors (e.g., brand awareness, brand association, perceived quality) affect brand equity. Among them, brand trust has been identified as a key factor in developing brand loyalty and consequently affecting overall brand equity [56]. That is, consumers’ expectations of the brand’s reliability and intentions cultivate a lasting relationship between the consumer and the brand (i.e., brand loyalty), which adds to the brand’s equity. Consequences of having strong brand equity are found to result in increased brand preference and consumers’ purchase intentions [57] as well as the company’s financial performance [58].
Purchase intention takes into account consumers’ interest in a product as well as the possibility of buying a product [59]. Studies have demonstrated that purchase intention strongly relates to one’s attitude and preference toward a brand or a product [60,61,62], hence it is assumed that measuring consumers’ purchase intentions would predict their future behavior based on their attitudes [59].
2.6. Hypotheses Development
Based on the signaling theory, this study posits that the price information disclosed by a firm can serve as a signal for consumers to judge product and company prior to purchase. Earlier studies applied signaling theory and considered transparency as a signal for a firm in the contexts of corporate social responsibility activities [63,64] and a firm’s integrity [65,66]. Carroll and Einwiller [63] stated that the transparency signal is an organizational effort to be transparent and is a balanced communication of the firm’s corporate social responsibility activities. In their study, the positive signals (i.e., balanced, clear, guided, and directed) were associated with the quality of corporate social responsibility reporting. The transparency signal was found to enhance a firm’s integrity as perceived by consumers [65] and internal employees [66]. Specifically, a transparency signal heightened employees’ organizational trust, which consequently increased affective commitment to the organization [66].
Since price transparency results in increased trust and brand loyalty [22], which are fundamental factors that form brand equity, it is expected that the presence of price transparency can influence the overall brand equity of a company. Moreover, people may prefer to purchase products from companies that disclose pricing information over those who do not, as transparent companies seem more genuine, trustworthy, and reliable [25]. Since price transparency affects price satisfaction [24], consumers are also likely to be happier with their purchase decision. Hence, it is postulated that price transparency will affect brand equity and purchase intentions of prospective consumers. However, consumers’ responses can vary by whether the disclosed information about the price is reasonable or not. In particular, perceived price fairness, which is consumers’ evaluation of whether the price is reasonable, acceptable, or justifiable [67], can influence the consumers’ responses to price transparency. For example, a sufficient and reasonable explanation of the price, such as the level of retailer markup, can result in a positive evaluation of the price [21]. Furthermore, when consumers are informed about a detailed breakdown of costs, they may perceive the offer to be fairer [68]. Whereas, a lack of justification for the price can lead to negative consumer responses [69]. Accordingly, this study expects that consumers’ response to price transparency may differ by the extent of disclosure and perceived fairness of the pricing information as follows.
Hypothesis 1 (H1).
If price is perceived to be fair, greater extent of price transparency will positively affect brand equity (H1a) and consumers’ purchase intentions (H1b).
Hypothesis 2 (H2).
If price is perceived to be unfair, greater extent of price transparency will negatively affect brand equity (H2a) and consumers’ purchase intentions (H2b).
Signaling theory states that a signal is advantageous in reducing information asymmetries for sellers with positive information about their products [70]. Accordingly, disclosing supply chain information is known to boost brand loyalty, shape a positive brand image, and increase preference for the brand’s products [19,30]. Similarly, individuals who perceived higher levels of disclosure had stronger trust in the organization [66]. Such advantages will translate into added benefits that help distinguish the brand from its counterparts. Therefore, like price transparency above, production transparency can serve as a signal for consumers to assess a firm and its products.
However, we posit that not all disclosed information related to production will be perceived positively and generate positive reactions of consumers. Rather, since signals can be judged subjectively by the receivers [49], how the disclosed information is perceived and interpreted by consumers can be important in determining consumers’ responses. Previous studies found that positive ethics of a company strengthened consumers’ brand trust [71], brand passion and commitment [72], effect [71,73], brand image [74], and brand equity [74]. On the other hand, negatively perceived ethics and activities of a firm led to a lower purchase intention, corporate image, brand loyalty [75], and even poorer company performance [76]. Therefore, if consumers interpret the production transparency as positive and ethical, they may have a positive evaluation of the firm and its products. In this case, greater transparency and more information (i.e., more signals) would aid in creating a positive image of a firm. On the other hand, a negative signal of transparency (i.e., unfair production) may lead to negative responses to the brand. Here, a greater revelation of negatively perceived information can backfire and hurt the firm’s reputation as suggested by previous studies [75,76]. Consequently, we hypothesize that production transparency will affect brand equity and purchase intentions, depending on the ethicality of the information disclosed.
Hypothesis 3 (H3).
If production is perceived to be ethical, greater extent of production transparency will positively affect brand equity (H3a) and consumers’ purchase intentions (H3b).
Hypothesis 4 (H4).
If production is perceived to be unethical, greater extent of production transparency will negatively affect brand equity (H4a) and consumers’ purchase intentions (H4b).
3. Method
3.1. Stimuli Development
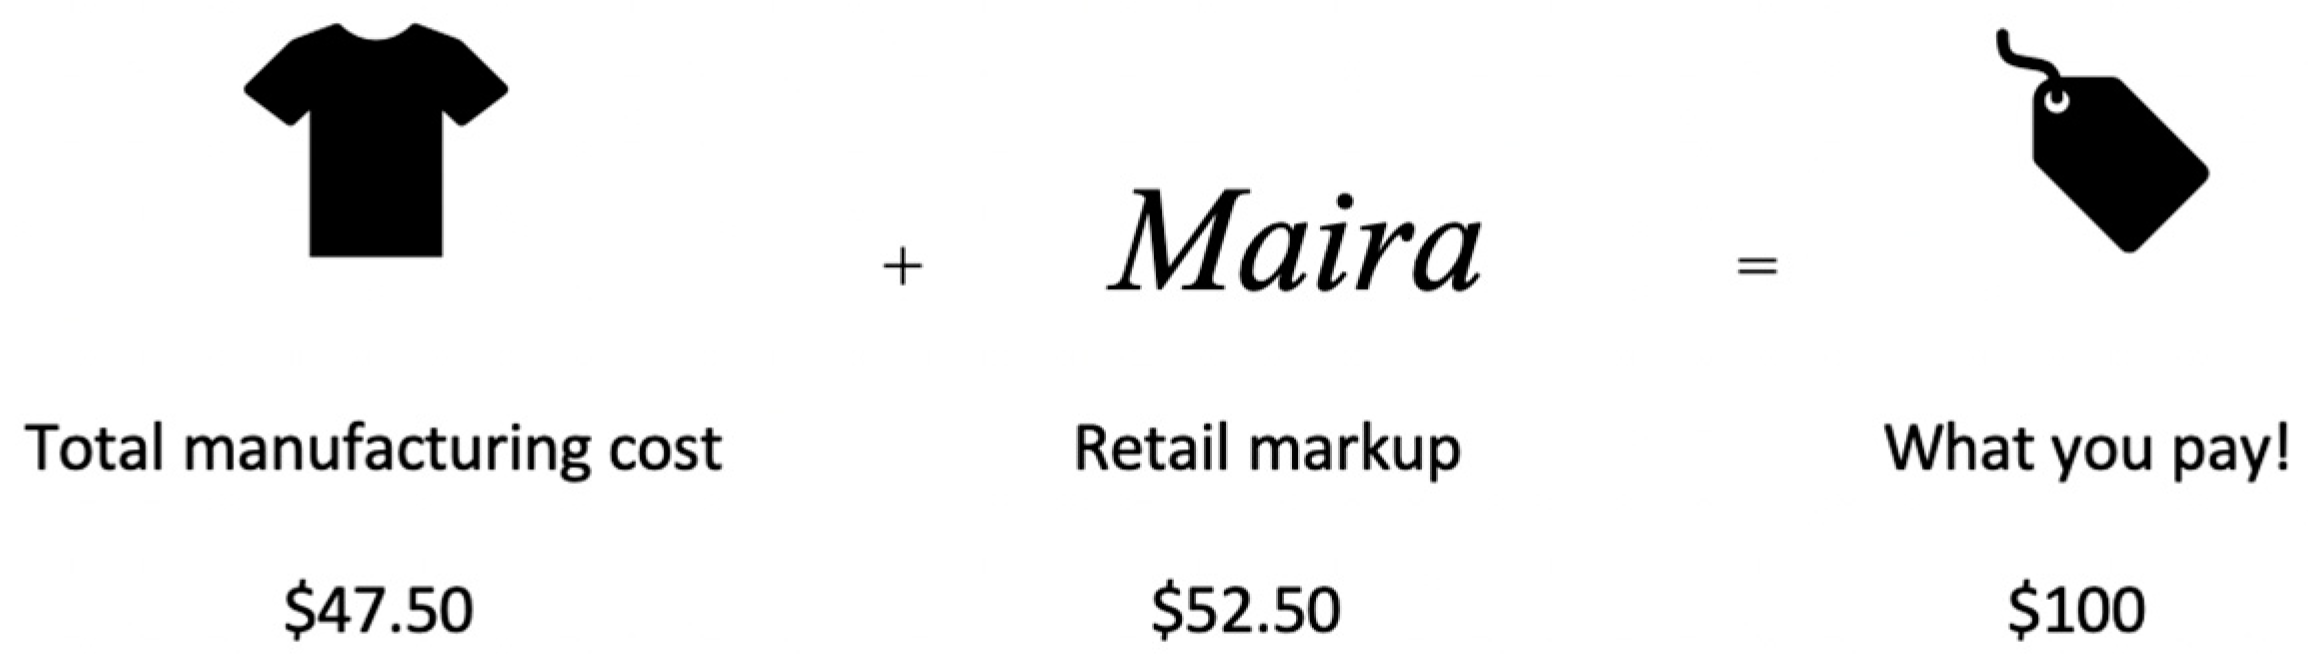
A total of nine scenarios were developed: 2 (price/production information) × 2 (low/high degree of information disclosure) × 2 (fair/unfair condition) plus 1 control group with no price/production information. A fictitious fashion brand was used in order to reduce variation in participants’ prior experience with brands. A brief description of a mock fashion brand Maira was shown at the beginning of the survey. The description included the brand’s style and offering, followed by a product available for sale—a 100% cashmere sweater.
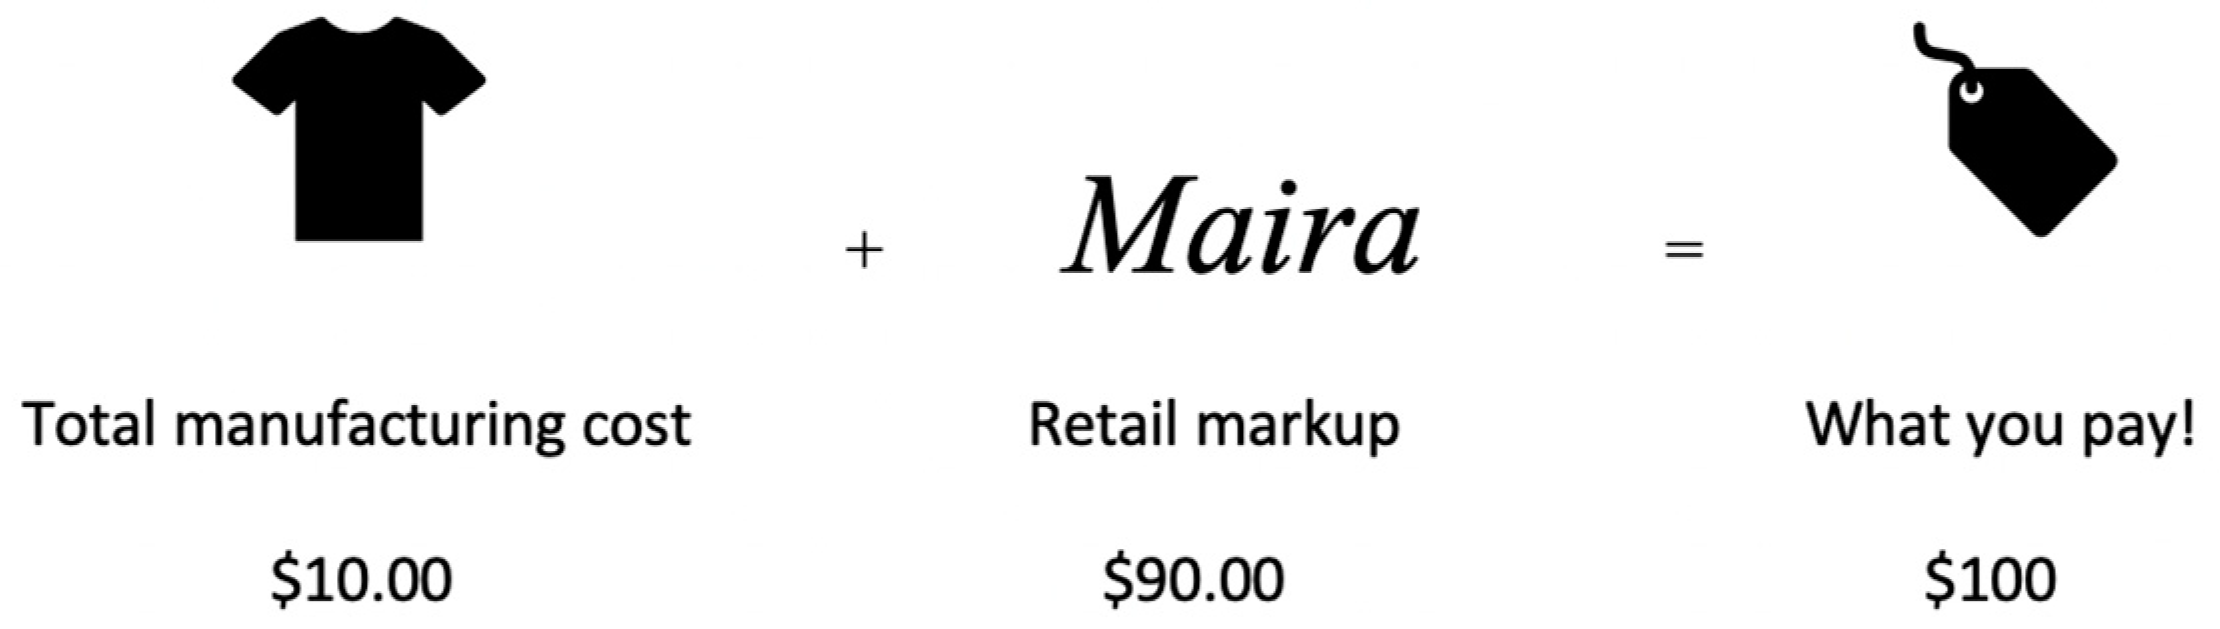
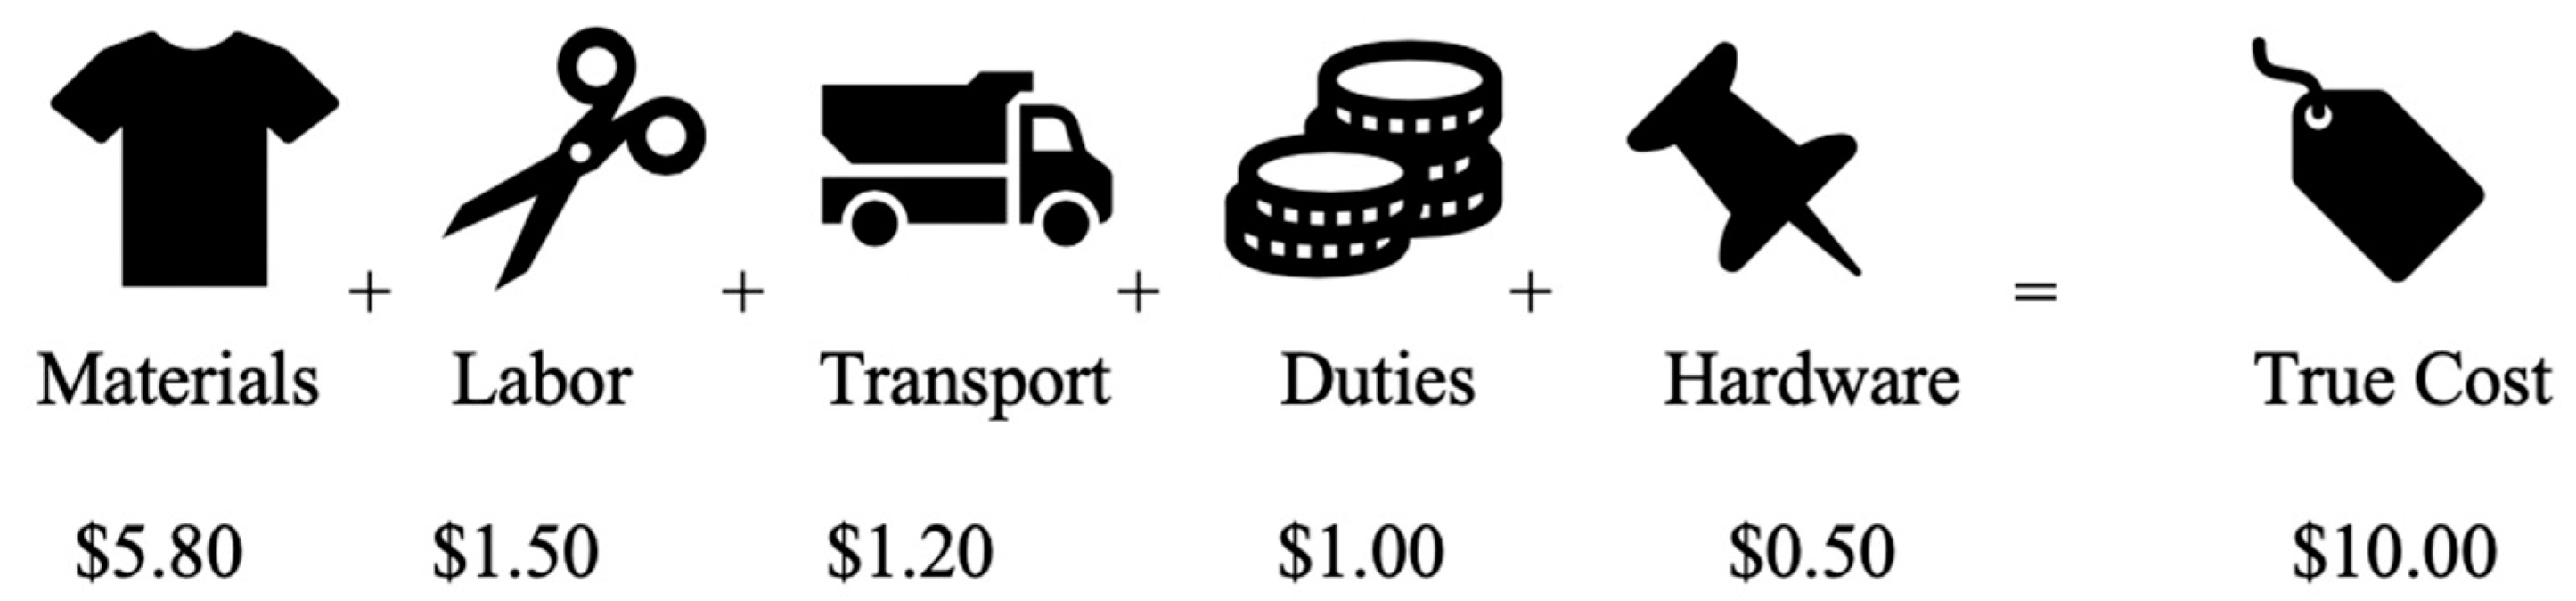
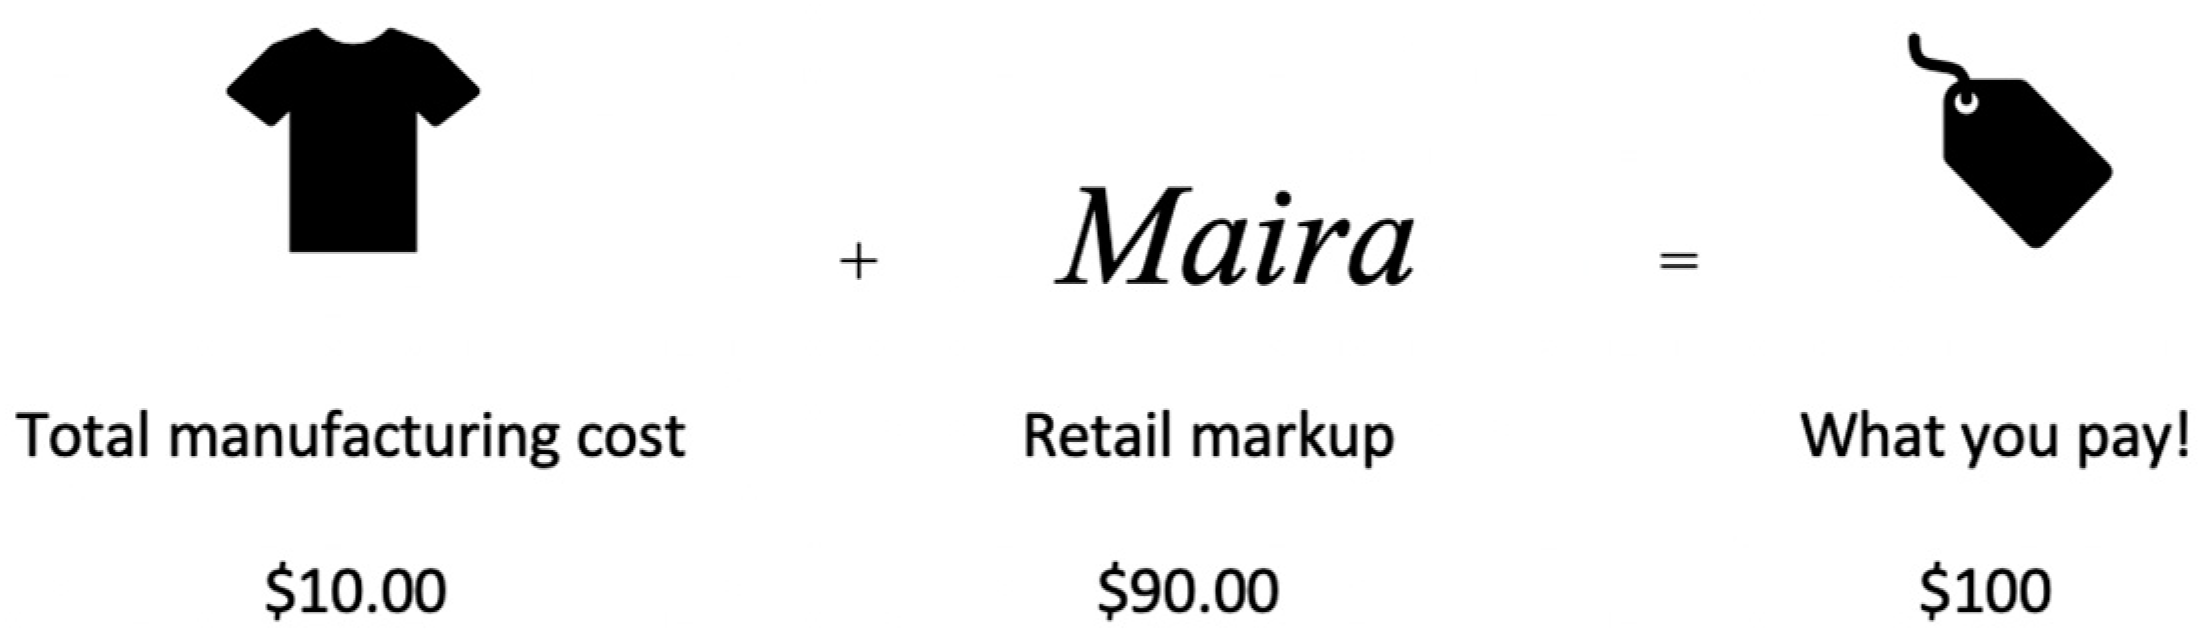
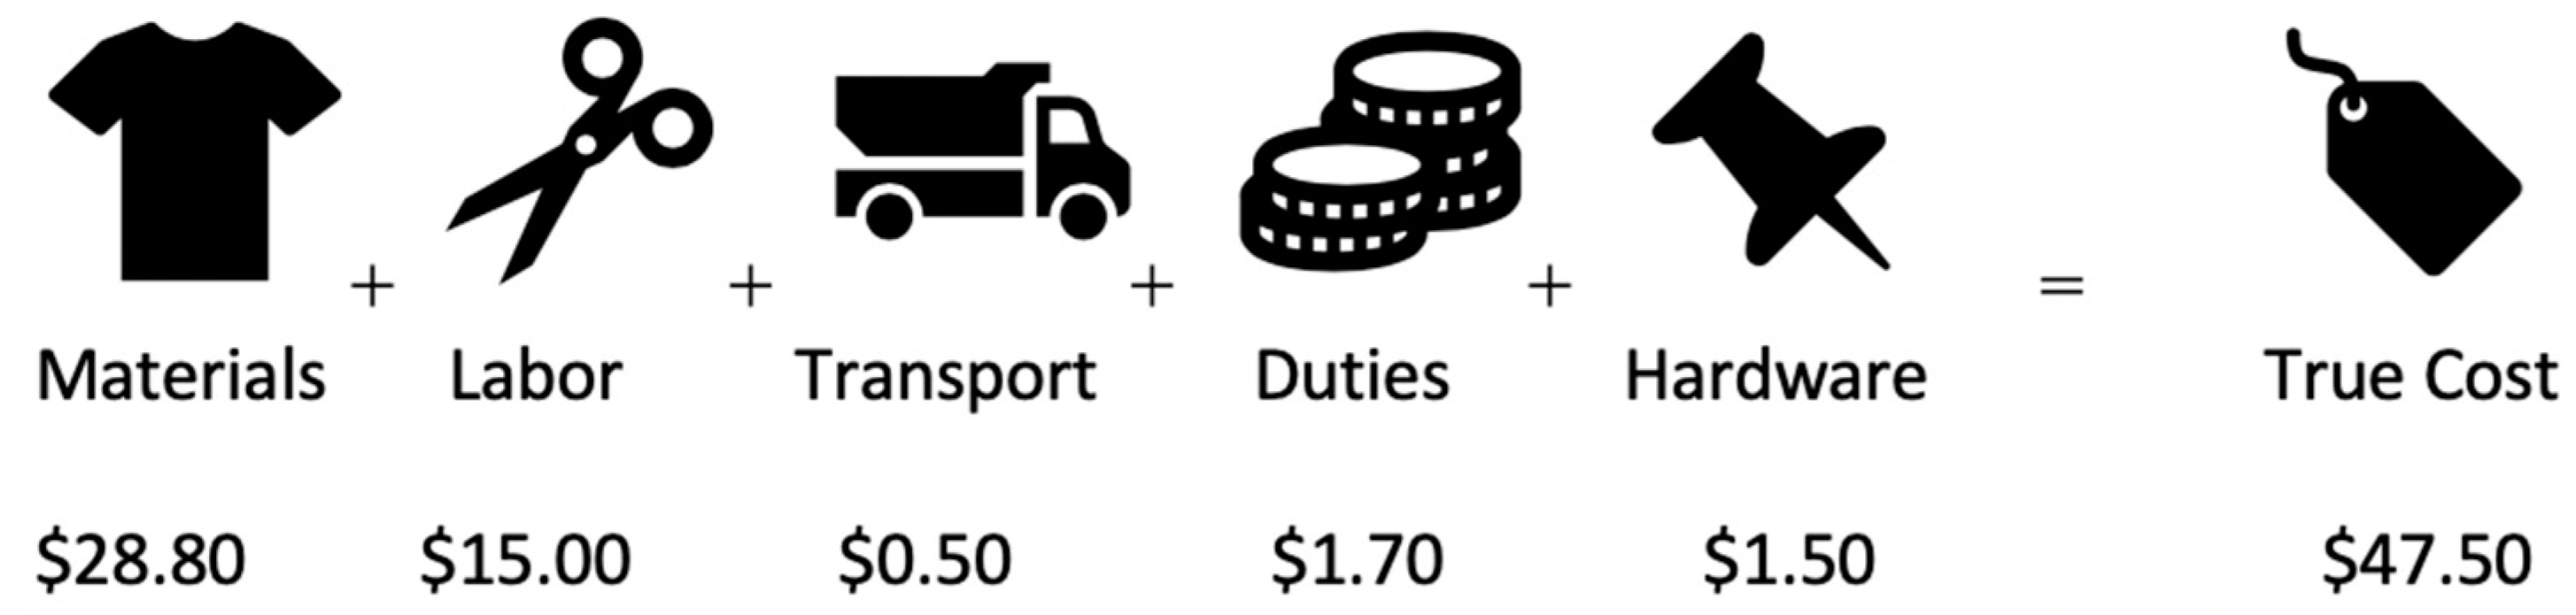
In the brand description, the control scenario indicated that the brand does not disclose information about its price and manufacturing condition. For the treatment groups on price transparency, a cost-breakdown diagram for the cashmere sweater was displayed. The retailer price markup for the ‘fair’ condition was 52.5% (a typical retailer markup rate in the fashion industry), while the markup for the ‘unfair’ condition was 90.0%. The low disclosure group only included information about the cost of manufacturing and retail markup, whereas the high disclosure group included the cost information about materials, labor, transportation, duties, hardware, and retail markup. For the treatment groups of production transparency, information about the sweater’s manufacturer including the location and history of the factory was revealed. The ethical scenario mentioned the factory’s effort to provide exceptional working conditions for its employees while the unethical scenario asserted that the factory had been accused of minor labor rights violations. The high disclosure group expanded on each scenario with greater detail about the product manufacturer (see Appendix A).
3.2. Measurements
The measurement items for this study were adopted from prior research studies (Table 1). The questionnaire consisted of scales that measure brand equity, purchase intentions, perceived fairness of price, and perceived ethicality of manufacturing. A total of four items on brand equity were adapted from Yoo and Donthu [77], asking questions on whether the brand is preferable over other similar brands. The purchase intention scale, consisting of three items, was borrowed from Putrevu and Lord [78]. Brand equity and purchase intention were measured using a 7-point Likert scale (1 = strongly disagree, 7 = strongly agree). To measure perceived fairness of price, a three seven-point semantic differential scale (i.e., very unfair/very fair, not very reasonable/very reasonable, not very justified/very justified) was taken from Bolton, Keh, and Alba [79]. Perceived ethicality of the manufacturing process was measured with the same scale from Bolton et al. [79] with an addition of one item (i.e., not very humane/very humane).
3.3. Sample
U.S. consumers older than 18 years of age were recruited through Amazon Mechanical Turk (hereafter MTurk). Studies suggest that MTurk is appropriate for social science research since they tend to be more attentive to instructions than college students and other traditional subject pools and are demographically diverse [80,81]. Regarding sample size, 30 participants per cell are the general requirement for experimental research [82]. Since not all responses may be usable, we recruited slightly more than the general minimum. After excluding individuals who had incomplete or insincere answers, a total of 349 samples were available for data analysis (around 40 responses per cell).
The sample consisted of 61.3% (n = 214) males, 38.4% (n = 135) females, and 0.3% (n = 1) who identified as neither. The majority of the participants were Caucasians (77.9%), followed by African Americans (8.6%), Asians (5.7%), Hispanics (5.4%), and other (2.3%). The age of the respondents ranged from 18 to 73, with a mean of 35.5. In regard to education level, 72.2% held a bachelor’s degree, 16.9% completed high school or less, and 10.9% had master’s or higher. For the annual individual income, 20.1% earned less than $19,999, 43.3% earned between $20,000 and $49,999, 25.7% earned between $50,000 and $79,999, and the rest 10.9% earned $80,000 or more.
4. Results
4.1. Measurement Reliability
4.2. Manipulation Check
Manipulation checks were conducted in order to ensure the effectiveness of the manipulated variables (i.e., level of transparency and perceived fairness). The level of perceived transparency of the brand’s price and production was asked using two seven-point semantic differential items: “How transparent do you think this brand is in regard to pricing?”, “How transparent do you think this brand is in regard to manufacturing (i.e., how/where the clothes are made)?” The analysis of variance (ANOVA) indicated that the mean perceived fairness significantly differed between the unfair group and fair group for both pricing and production scenarios (see Table 2). Additionally, the ANOVA and Tukey’s HSD post hoc test showed that the mean transparency level differed across the control group, low disclosure of price/production group, and high disclosure of price/production group (see Table 3). Hence, both results demonstrated that the manipulation worked as intended.
4.3. Hypothesis Testing
To test H1, H2, H3, and H4, ANOVA and Tukey’s HSD post hoc test were conducted to compare each treatment group with the control group. The four items of the brand equity scale and three items of the purchase intention scale were averaged respectively to be used as dependent variables.
Table 4 summarizes the result of H1 and H2. For H1a, the ANOVA result was significant, and the mean of brand equity for the low and high price transparency group were greater than that of the control group (Mcontrol = 3.38, Mlow_price_transparency = 4.36, Mhigh_price_transparency = 4.49, F-value = 8.01, p < 0.01). However, the post hoc test revealed that there was no significant difference between the low and high disclosure groups, partially supporting H1a. For H1b, the mean purchase intention for the low and high price transparency group were significantly greater than the control group (Mcontrol = 3.29, Mlow_price_transparency = 4.25, Mhigh_price_transparency = 4.43, F-value = 5.93, p < 0.01). Again, the post hoc test suggested that there was no significant difference between the low and high disclosure groups, partially supporting H1b. In the case of unfair pricing (H2), the ANOVA result for H2a demonstrated that the mean brand equity was significantly lower for the low and high price transparency group than the control group (Mcontrol = 3.38, Mlow_price_transparency = 2.17, Mhigh_price_transparency = 2.51, F-value = 9.93, p < 0.01). The post hoc showed no distinguishing difference between low and high disclosure groups, hence H2a was partially supported. The mean purchase intention for low and high transparency groups were also significantly lower than the control group (Mcontrol = 3.29, Mlow_price_transparency = 2.08, Mhigh_price_transparency = 2.19, F-value = 7.64, p < 0.01), but again with no significant difference across the two disclosure levels. Therefore, H2b was partially supported.
The analysis results for the production transparency scenarios are outlined in Table 5 (H3 & H4). In the ethical production scenarios, the groups with low and high levels of transparency exhibited grater brand equity values than the control group (H3a: Mcontrol = 3.38, Mlow_production_transparency = 4.29, Mhigh_production_transparency = 4.88, F-value = 14.69, p < 0.001). No significant difference was detected between the low and high production transparency groups after the post hoc test. The mean value of purchase intention (H3b), on the other hand, was significantly greater for the high transparency group compared to the low disclosure and the control groups (Mcontrol = 3.29, Mlow_production_transparency = 3.78, Mhigh_production_transparency = 4.84, F-value = 12.57, p < 0.001). The purchase intention for the low-level group was not significantly different from the control group. Thus, H3a and H3b were both partially supported. In the unethical production scenarios, the mean values of both brand equity (H4a: Mcontrol = 3.38, Mlow_production_transparency = 2.40, Mhigh_production_transparency = 2.33, F-value = 6.79, p < 0.01) and purchase intentions (H4b: Mcontrol = 3.29, Mlow_production_transparency = 2.10, Mhigh_production_transparency = 2.02, F-value = 9.75, p < 0.001) were lower for low and high transparency groups than the control group. The post hoc results showed that there was no significant difference between the low and high disclosure levels for both brand equity and purchase intentions. As a result, H4a and H4b were also partially supported.
5. Discussion and Implication
5.1. Summary of Findings
Given the increasing public demand for transparent business practice in the fashion industry, this study examined the role of price and production transparency on brand equity and consumers’ purchase intentions. Furthermore, the study hypothesized different conditions of the transparency information: perceived fairness and extent of disclosure. Through an experimental examination, our findings revealed the proper extent and content of information disclosure for fashion companies. The major findings are discussed below.
First, we found the presence of price transparency positively influencing both the brand equity (H1a) and purchase intentions (H1b) when the price is perceived to be fair. On the other hand, lower brand equity (H2a) and purchase intentions (H2b) resulted when consumers perceived price to be unfair. The levels of disclosure (i.e., low and high) did not influence brand equity and purchase intentions in both fair and unfair conditions. That is, the mere presence of information related to the cost-breakdown of fashion products, regardless of the extent, prompted consumers to display greater purchase intentions for the brand and its product, as long as the price was perceived as fair. Such finding is in accordance with previous literature that price transparency strengthens brand loyalty and brand trust, which are key dimensions of brand equity [17,22]. Furthermore, it also aligns with previous findings that justifiable explanations of the price result in greater perceived price fairness and generates positive consumer responses [21,51,68] while failing to provide the reasons leads to negative consumer responses [69]. Our findings further add empirical evidence that price transparency directly influences brand equity, differentiating the brand from its counterparts, and adding a competitive advantage. Indeed, participants indicated that they would still prefer the transparent brand over another brand when the two brands have the same features. On the other hand, our discovery of how the varying levels of disclosure did not yield any meaningful differences in consumer perceptions is noteworthy. This finding challenges prior research, which discovered that a greater number (or a combination) of product signals increases the effectiveness of the signaling information since they reduce ambiguity [83,84]. In fact, our result suggests that when it comes to pricing information, more information is not necessarily better. Rather, it is the nature of the information presented (i.e., fairness) that truly matters to consumers.
Second, production transparency was also discovered to positively influence brand equity (H3a) as well as consumers’ purchase intentions (H4b) when the production is perceived to be ethical. Specifically, brand equity was enhanced with a simple presence of ethical production information, whereas consumers’ purchase intentions were affected by a greater extent of disclosure. In other words, when a greater amount of information about the apparel product’s manufacturer such as location, history, and working conditions was revealed, consumers displayed greater purchase intentions for the brand’s product. This discovery confirms the findings in prior research that consumers are more willing to purchase a product if the company discloses information of its supply chain [27,30] and adds that transparency builds the overall equity of the brand. It also suggests that brand equity, which may require a weaker level of engagement as a perceptual component of consumer responses than purchase intention [85], was heightened even through a small amount of information. However, the intention to purchase, which involves deeper engagement as a behavioral component of consumer responses [85], warranted a greater amount of disclosure by the firm. Such a finding differs from the result of pricing transparency, wherein even a small amount of pricing information influenced both the brand equity and purchase intentions. It can be concluded that, for production transparency, both the quality (e.g., ethicality) and quantity (e.g., level of disclosure) matter to consumers’ decision-making processes. On the contrary, the unethical production information disclosure was shown to prompt negative brand equity (H4a) as well as lower purchase intention (H4b) no matter how much information was provided. This suggests that once consumers encounter any negative signal of the production process, they will demonstrate negative responses to the brand. Such a result is in accordance with previous studies that people are sensitive to negative results and use that to avoid making wrong purchase decisions [86].
5.2. Theoretical Implications
Theoretically, this study extends our current understanding of the role of transparency in marketing apparel products. Studies on transparency thus far have mainly been associated with healthcare or financial industries. Nonetheless, transparent business practices in the apparel industry have become increasingly critical as the complexity of apparel manufacturing and pricing has grown in recent years. To the authors’ knowledge, this study is one of the earliest attempts to utilize an experimental scenario to investigate how consumers react to the presence of price and production transparency when shopping for fashion items. Our research examined different conditions of transparency including the extent of information disclosure and perceived fairness or ethicality of disclosed messages. Contrary to the authors’ and common beliefs that more information would lead to positive results, it was found that the extent of disclosure had a limited impact on consumer perception, particularly in the context of pricing transparency. The notion of information overload [87] may explain why consumers are better off with a reduced set of signals rather than a large amount of information that can present a taxing cognitive problem [88]. Research on a consumer’s cognitive journey or the decision-making process suggests that consumers often employ a mental information filtering mechanism to decrease the complexity of information to make simpler judgments [89,90]. Our discovery that full information transparency is not always optimal for consumers is a notable contribution to the literature. Furthermore, most prior studies have examined information disclosure only with trust-related factors such as brand trust, reputation, or perceived fairness [16,22,25]. By establishing a direct linkage between information transparency to consumers’ purchase intentions and brand equity, this study addresses an important gap in consumer behavior research in regard to transparency.
In addition, a finding of our study also contributes to brand equity research, suggesting that brand transparency may be another key dimension of brand equity. The dimensions of brand equity are known to consist mainly of brand loyalty, brand awareness, perceived quality of a brand, and brand associations [53]. Researchers have proposed that other factors such as brand trust or credibility are important determinants of brand equity [56,91]. Combined with the increasing consumer demand for the transparent business price, our finding on the direct influence of transparency on brand equity suggests that brand transparency may emerge as another core asset of a brand.
5.3. Managerial Implications
The findings of our study also suggest implications for practitioners. Transparent business practice is a critical issue for consumers. Demand for transparency in the fashion industry has been mainly fueled by Millennials and Gen Z’s. Marketing products as the best value for the money will simply not be enough to satisfy these cohorts of consumers. They expect creative integrity, sustainable supply chains, fair treatment of workers, authenticity, and data protection from fashion brands they consume [2]. Therefore, proactive and transparent communications about business operations and behavioral commitment to sustainability need to be visible. While most brands have traditionally only revealed information about the country-of-origin (COO) or country-of-manufacturer (COM), they should not be hesitant to reveal more price- and supply-chain-related information and have them readily accessible to consumers through the usage of hangtags and labels. Online retailers can consider making the cost-breakdown and production information visible in the product description sections. Such information does not have to be extensive and can be as simple as showing product mark-up or describing the working conditions of the supplier. Doing so will not only appeal to consumers who are looking for greater transparency, but it will also hold the business accountable to adopt more ethical business practices throughout the supply chain.
However, companies should ensure that the disclosed information is perceived as fair and ethical by consumers. If any part of the supply chain seems unethical, companies should not send unnecessary signals by disclosing too much information as it may result in a backlash. The case of the Swedish fast-fashion giant H&M illustrates this point. In 2019, H&M introduced a transparency layer for all of its garments by sharing information including the production country, supplier names, factory names and addresses, and the number of workers in the factories [92]. While this initiative has been initially applauded by some, many have criticized the brand, questioning whether improvements like this are even worthwhile if the brand’s unsustainable, low-cost production system continues on [93]. This backlash against transparency efforts suggests that mere disclosure of the production information does not guarantee a positive impact unless the actual business practice aligns with the publicized ethical values. For example, disclosing the name and the number of factory workers can be quite meaningless if consumers think that these workers are not paid a fair living wage. Thus, brands should carefully examine whether the disclosed information is indeed seen as ethical and essential to consumers and ensure that they are not overburdening consumers with an overload of superfluous information.
5.4. Limitations and Future Studies
The limitations of this study suggest directions for future research. While our study only compared cases of price and manufacturing information, there may exist additional parts of transparency that could influence consumer’s perception of a brand. For example, transparency along the entire supply chain, such as design and purchasing processes, not just production can be investigated. Second, it is recommended that future studies use participants with different cultural backgrounds or other demographics to strengthen the generalizability of the findings to different consumer groups. Third, the study focused on the fashion industry, hence future research in other fields is recommended. Food and electronic good sectors could be potential examples given their complexities around the supply chain and growing demand for transparency. Lastly, future research can use real brands to examine the effects of transparency rather than the fictitious ones like in this study to better reflect the reality and complexity of actual consumption settings.
Author Contributions
N.L.K., designed and planned the study; N.L.K., collected and analyzed data; N.L.K., G.K., and L.R. wrote the final manuscript; all authors read and approved the final manuscript. All authors have read and agreed to the published version of the manuscript.
Funding
The APC was funded by Lori Rothenberg’s institute.
Acknowledgments
One of the authors received internal funding for data collection.
Conflicts of Interest
The authors declare no conflict of interest.
Appendix A
Appendix A.1. Scenario #1 (Control)
Maira is a fashion brand that offers premium quality clothing for men and women. Maira offers versatile, contemporary classics including classic styled suits, separates, dresses, shoes, and accessories. The brand’s commitment to design and fit ensures exceptional comfort and quality. Maira’s 100% cashmere sweater for both men and women is priced at $100.
Appendix A.2. Scenario #2 (Low Pricing Disclosure & Unfair)
Control Message + Maira believes that the customers have a right to know how much their clothes cost to make. Therefore, the cost-breakdown for all products—from materials to labor—are revealed. Maira’s 100% cashmere sweater for both men and women is priced at $100. The cost-breakdown for this cashmere sweater is shown below.
Figure A1.
The cost-breakdown for this cashmere sweater.

Appendix A.3. Scenario #3 (Low Pricing Disclosure & Fair)
Same message as Scenario #2 with below figure.
Figure A2.
The cost-breakdown for this cashmere sweater.

Appendix A.4. Scenario #4 (High Pricing Disclosure & Unfair)
Same message as Scenario #2 with below figure.
Figure A3.
The cost-breakdown for this cashmere sweater.

Figure A4.
The cost-breakdown for this cashmere sweater.

Appendix A.5. Scenario #5 (High Pricing Disclosure & Fair)
Same message as Scenario #2 with below figure.
Figure A5.
The cost-breakdown for this cashmere sweater.

Figure A6.
The cost-breakdown for this cashmere sweater.

Appendix A.6. Scenario #6 (Low Production Disclosure & Unethical)
Control Message + Maira’s 100% cashmere sweater, for both men and women, is priced at $100. This sweater is made from a factory in China. The factory has been accused of minor labor rights violations.
Appendix A.7. Scenario #7 (Low Production Disclosure & Ethical)
Control Message + Maira’s 100% cashmere sweater for both men and women is priced at $100. This sweater is made from a factory in China. The factory maintains exceptional working conditions for its employees.
Appendix A.8. Scenario #8 (High Production Disclosure & Unethical)
Control Message + Maira believes that the customers have a right to know where and how their clothes are made. Therefore, for every product, detailed information about the factory, its location, and history is revealed. Maira’s 100% cashmere sweater for both men and women is priced at $100. This sweater is made from Guanglin Factory located in the southeastern part of China. Established in 1995, this factory is a family-run business that employs 500 people in the city of Guanglin. The factory has been accused of not compensating workers working overtime and using cotton that relies on pesticide usage.
Appendix A.9. Scenario #9 (High Production Disclosure & Ethical)
Control Message + Maira believes that the customers have a right to know where and how their clothes are made. Therefore, for every product, detailed information about the factory, its location, and history is revealed. Maira takes great effort to ensure all products are produced under safe, fair, and humane working conditions. Maira’s 100% cashmere sweater for both men and women is priced at $100. This sweater is made from Guanglin Factory located in the southeastern part of China. Established in 1995, this factory is a family-run business that employs 500 people in the city of Guanglin. The factory strives to improve working conditions while producing high-quality products through investment in technologies.
References
- Martinez, E.O.; Crowther, D. Is disclosure the right way to comply with stakeholders? The Shell case. Bus. Ethics. 2008, 17, 13–22. [Google Scholar] [CrossRef]
- Amed, I.; Berg, A.; Balchandani, A.; Andersson, J.; Hedrich, S.; Young, R. The State of Fashion 2019. McKinsey & Co. 2018. Available online: https://cdn.businessoffashion.com/reports/The_State_of_Fashion_2019.pdf (accessed on 16 May 2020).
- Gazzola, P.; Colombo, G.; Pezzetti, R.; Nicolescu, L. Consumer empowerment in the digital economy: Availing sustainable purchasing decisions. Sustainability 2017, 9, 693. [Google Scholar] [CrossRef] [Green Version]
- Su, C.H.J.; Tsai, C.H.K.; Chen, M.H.; Lv, W.Q. US sustainable food market generation Z consumer segments. Sustainability 2019, 11, 3607. [Google Scholar] [CrossRef] [Green Version]
- Su, J.; Watchravesringkan, K.T.; Zhou, J.; Gil, M. Sustainable clothing: Perspectives from US and Chinese young Millennials. Int. J. Retail. Distrib. 2019, 47, 1141–1162. [Google Scholar] [CrossRef]
- Gerlick, J.A. Transparency in apparel Everlane as a barometer for global positive impact. Int. J. Ethical Leadersh. 2019, 6, 87–95. [Google Scholar]
- Richman, J. 5 Examples of Companies Succeeding Through Transparency. Entrepreneur. 27 May 2016. Available online: https://www.entrepreneur.com/article/274636 (accessed on 16 May 2020).
- UN Environment Programme. US Outdoor Clothing Brand Patagonia Wins UN Champions of the Earth Award. 24 September 2019. Available online: https://www.unenvironment.org/news-and-stories/press-release/us-outdoor-clothing-brand-patagonia-wins-un-champions-earth-award#:~:text=24%20September%202019%20%2D%2D%20US,of%20its%20successful%20business%20model (accessed on 16 July 2020).
- Salfino, C. Why being Transparent is Vital—And Profitable—For Fashion. Sourcing Journal. 6 June 2019. Available online: https://sourcingjournal.com/topics/lifestyle-monitor/why-being-transparent-is-vital-and-profitable-for-fashion-155114/ (accessed on 16 July 2020).
- Singh, N. Commentary: What’s behind the price tag: Understanding cost transparency? Eur. J. Mark. 2015, 49, 1987–1991. [Google Scholar] [CrossRef]
- Amed, I.; Balchandani, A.; Beltrami, M.; Berg, A.; Hedrich, S.; Rölkens, F. What Radical Transparency could Mean for the Fashion Industry. McKinsey & Co. 14 Februrary 2019. Available online: https://www.mckinsey.com/industries/retail/our-insights/what-radical-transparency-could-mean-for-the-fashion-industry (accessed on 16 May 2020).
- Lummus, R.; Krumwiede, D.; Vokurka, R. The relationship of logistics to supply chain management: Developing a common industry definition. Ind. Manag. Data Syst. 2001, 101, 426–432. [Google Scholar] [CrossRef]
- Joy, A.; Sherry, J.F., Jr.; Venkatesh, A.; Wang, J.; Chan, R. Fast fashion, sustainability, and the ethical appeal of luxury brands. Fash. Theory 2012, 16, 273–295. [Google Scholar] [CrossRef]
- Han, J.; Seo, Y.; Ko, E. Staging luxury experiences for understanding sustainable fashion consumption: A balance theory application. J. Bus. Res. 2017, 74, 162–167. [Google Scholar] [CrossRef]
- Joergens, C. Ethical fashion: Myth or future trend? J. Fash. 2006, 10, 360–371. [Google Scholar] [CrossRef] [Green Version]
- Carter, C.R.; Rogers, D.S. A framework of sustainable supply chain management: Moving toward new theory. Int. J. Phys. Distrib. 2008, 38, 360–387. [Google Scholar] [CrossRef]
- Mohan, B.; Buell, R.W.; John, L.K. Lifting the Veil: The Benefits of Cost Transparency; (working paper); Harvard Business School NOM Unit Working Paper: Cambridge, MA, USA, 2014; pp. 15–17. [Google Scholar]
- Egels-Zandén, N.; Hulthén, K.; Wulff, G. Trade-offs in supply chain transparency: The case of Nudie Jeans Co. J. Clean. Prod. 2015, 107, 95–104. [Google Scholar] [CrossRef]
- Strutnin, R. Managing brands through supply chain visibility. Chin. Bus. Rev. 2008, 35, 30–33. [Google Scholar]
- Diller, H. Preis-management im Zeichen des Beziehungsmarketing. Die Betr. 1997, 57, 749–763. [Google Scholar]
- Ferguson, J.L. Implementing price increases in turbulent economies: Pricing approaches for reducing perceptions of price unfairness. J. Bus. Res. 2014, 67, 2732–2737. [Google Scholar] [CrossRef]
- Simintiras, A.C.; Dwivedi, Y.K.; Kaushik, G.; Rana, N.P. Should consumers request cost transparency? Eur. J. Mark. 2015, 49, 1961–1979. [Google Scholar] [CrossRef] [Green Version]
- Matzler, K.; Renzl, B.; Faullant, R. Dimensions of price satisfaction: A replication and extension. Int. J. Bank Mark. 2007, 25, 394–405. [Google Scholar] [CrossRef]
- Matzler, K.; Würtele, A.; Renzl, B. Dimensions of price satisfaction: A study in the retail banking industry. Int. J. Bank Mark. 2006, 24, 216–231. [Google Scholar] [CrossRef]
- Bertini, M.; Gourville, J.T. Pricing to create shared value. Harv. Bus. Rev. 2012, 90, 96–104. [Google Scholar]
- Mittal, D.; Agrawal, S.R. Price transparency reflects assurance and reliability. J. Retail. Consum. Serv. 2016, 31, 43–51. [Google Scholar] [CrossRef]
- Bhaduri, G.; Ha-Brookshire, J.E. Do transparent business practices pay? Exploration of transparency and consumer purchase intention. Text. Res. J. 2011, 29, 135–149. [Google Scholar] [CrossRef]
- Fraser, I.J.; Müller, M.; Schwarzkopf, J. Transparency for multi-tier sustainable supply chain management: A case study of a multi-tier transparency approach for SSCM in the automotive industry. Sustainability 2020, 12, 1814. [Google Scholar] [CrossRef] [Green Version]
- Dingwerth, K.; Eichinger, M. Tamed transparency: How information disclosure under global reporting initiative fails to empower. Glob. Environ. Polit. 2010, 10, 74–96. [Google Scholar] [CrossRef]
- Egels-Zandén, N.; Hansson, N. Supply chain transparency as a consumer or corporate tool: The case of Nudie Jeans Co. J. Consum. Policy 2016, 39, 377–395. [Google Scholar] [CrossRef]
- Spence, M. Marketing-Signaling; Harvard University Press: Cambridge, MA, USA, 1974. [Google Scholar]
- Kirmani, A.; Rao, A.R. No pain, no gain: A critical review of the literature on signaling unobservable product quality. J. Mark. 2000, 64, 66–79. [Google Scholar] [CrossRef]
- Wells, J.D.; Valacich, J.S.; Hess, T.J. What signal are you sending? How website quality influences perceptions of product quality and purchase intentions. Manag. Inf. Syst. Q. 2011, 35, 373–396. [Google Scholar] [CrossRef] [Green Version]
- Rao, A.R.; Qu, L.; Ruekert, R.W. Signaling unobservable product quality through a brand ally. J. Mark. Res. 1999, 36, 258–268. [Google Scholar] [CrossRef]
- Richardson, P.S.; Dick, A.S.; Jain, A.K. Extrinsic and intrinsic cue effects on perceptions of store brand quality. J. Mark. 1994, 58, 28–36. [Google Scholar] [CrossRef]
- Erdem, T.; Swait, J. Brand equity as a signaling phenomenon. J. Consum. Psychol. 1998, 7, 131–157. [Google Scholar] [CrossRef]
- Chu, W.; Chu, W. Signaling quality by selling through a reputable retailer: An example of renting the reputation of anther agent. Mark. Sci. 1994, 13, 177–189. [Google Scholar] [CrossRef]
- Dawar, N.; Parker, P. Marketing universals: Consumers’ use of brand name, price, physical appearance, and retail reputation as signals of product quality. J. Mark. 1994, 58, 81–95. [Google Scholar]
- Teas, R.K.; Agarwal, S. The effects of extrinsic product cues on consumers’ perceptions of quality, sacrifice, and value. J. Acad. Mark. Sci. 2000, 28, 278–290. [Google Scholar] [CrossRef]
- Ophuis, P.A.M.O.; Trijp, H.C.M.V. Perceived quality: A market driven and consumer oriented approach. Food Qual. Prefer. 1995, 6, 177–183. [Google Scholar] [CrossRef]
- Baker, J.; Grewal, D.; Parasuraman, A. The influence of store environment on quality inferences and store image. J. Acad. Mark. Sci. 1994, 22, 328–340. [Google Scholar] [CrossRef]
- Zeithml, V. Consumer perceptions of price, quality and value: A means-end model and synthesis of evidence. J. Mark. 1988, 53, 2–22. [Google Scholar] [CrossRef]
- Chatterjee, S.; Heath, T.; Mishra, D. Communicating quality through signals and substantive messages: The effect of supporting information and need for cognition. Adv. Consum. Res. 2002, 29, 228–229. [Google Scholar]
- Meyer, R.J.; Sathi, A. A multiattribute model of consumer choice during product learning. Mark. Sci. 1985, 4, 1–50. [Google Scholar] [CrossRef]
- Connelly, B.L.; Certo, S.T.; Ireland, R.D.; Reutzel, C.R. Signaling theory: A review and assessment. J. Manag. 2011, 37, 39–67. [Google Scholar] [CrossRef]
- Miller, T.; Triana, M.D.C. Demographic diversity in the boardroom: Mediators of the board diversity—Firm performance relationship. J. Manag. Stud. 2009, 46, 755–786. [Google Scholar] [CrossRef]
- Chung, W.; Kalnins, A. Agglomeration effects and performance: A test of the Texas lodging industry. Strateg. Manag. J. 2001, 22, 969–988. [Google Scholar] [CrossRef] [Green Version]
- Gulati, R.; Higgins, M.C. Which ties matter when? The contingent effects of interorganizational partnerships on IPO success. Strateg. Manag. J. 2003, 24, 127–144. [Google Scholar] [CrossRef]
- Perkins, S.J.; Hendry, C. Ordering top pay: Interpreting the signals. J. Manag. Stud. 2005, 42, 1443–1468. [Google Scholar] [CrossRef]
- Pei, Z.; Paswan, A.; Yan, R. E-tailer’s return policy, consumer’s perception of return policy fairness and purchase intention. J. Retail. Consum. Serv. 2014, 21, 249–257. [Google Scholar] [CrossRef]
- Herrmann, A.; Xia, L.; Monroe, K.B.; Huber, F. The influence of price fairness on customer satisfaction: An empirical test in the context of automobile purchases. Pricing Strategy Pract. 2007, 16, 49–58. [Google Scholar] [CrossRef]
- Brunk, K.H. Exploring origins of ethical company/brand perceptions—A consumer perspective of corporate ethics. J. Bus. Res. 2010, 63, 255–262. [Google Scholar] [CrossRef]
- Aaker, D.A. Managing Brand Equity: Capitalizing on the Value of a Brand Name; The Free Press: New York, NY, USA, 1991. [Google Scholar]
- Keller, K.L. Conceptualizing, measuring, and managing customer-based brand equity. J. Mark. 1993, 57, 1–22. [Google Scholar] [CrossRef]
- Farquhar, P.H. Managing brand equity. Mar. Res. 1989, 1, 24–33. [Google Scholar]
- Delgado-Ballester, E.; Luis Munuera-Alemán, J. Does brand trust matter to brand equity? J. Prod. Brand. Manag. 2005, 14, 187–196. [Google Scholar] [CrossRef] [Green Version]
- Cobb-Walgren, C.J.; Ruble, C.A.; Donthu, N. Brand equity, brand preference, and purchase intent. J. Advert. 1995, 24, 25–40. [Google Scholar] [CrossRef]
- Kim, H.B.; Kim, W.G.; An, J.A. The effect of consumer-based brand equity on firms’ financial performance. J. Consum. Mark. 2003, 20, 335–351. [Google Scholar] [CrossRef]
- Kim, A.J.; Ko, E. Do social media marketing activities enhance customer equity? An empirical study of luxury fashion brand. J. Bus. Res. 2012, 65, 1480–1486. [Google Scholar] [CrossRef]
- Brown, M.; Pope, N.; Voges, K. Buying or browsing? An exploration of shopping orientations and online purchase intention. Eur. J. Mark. 2003, 37, 1666–1684. [Google Scholar] [CrossRef] [Green Version]
- Kim, H.Y.; Chung, J.E. Consumer purchase intention for organic personal care products. J. Consum. Mark. 2011, 28, 40–47. [Google Scholar]
- Laroche, M.; Kim, C.; Zhou, L. Brand familiarity and confidence as determinants of purchase intention: An empirical test in a multiple brand context. J. Bus. Res. 1996, 37, 115–120. [Google Scholar] [CrossRef]
- Carroll, C.E.; Einwiller, S.A. Disclosure alignment and transparency signaling in CSR reports. In Communication and Language Analysis in the Corporate World; Hart, R.P., Ed.; IGI global: Hershey, PA, USA, 2014; pp. 249–270. [Google Scholar]
- Rim, H.; Kim, J.; Dong, C. A cross-national comparison of transparency signaling in corporate social responsibility reporting: The United States, South Korea, and China cases. Corp. Soc. Responsib. Environ. Manag. 2019, 26, 1517–1529. [Google Scholar] [CrossRef]
- Cambier, F.; Poncin, I. Inferring brand integrity from marketing communications: The effects of brand transparency signals in a consumer empowerment context. J. Bus. Res. 2020, 109, 260–270. [Google Scholar] [CrossRef]
- Klimchak, M.; Bartleet, A.K.W.; MacKenzie, W. Building trust and commitment through transparency and HR competence: A signaling perspective. Pers. Rev. 2020. [Google Scholar] [CrossRef]
- Xia, L.; Monroe, D.B.; Cox, J.L. The price is unfair! A conceptual framework of price fairness perceptions. J. Mark. 2004, 68, 1–15. [Google Scholar] [CrossRef]
- Bearden, W.O.; Carlson, J.P.; Hardesty, D.M. Using invoice price information to frame advertised offers. J. Bus. Res. 2003, 56, 355–366. [Google Scholar] [CrossRef]
- Mohammed, R. Why Online Retailers’ New Pricing Strategy Will Backfire. Harvard Business Review. 19 December 2012. Available online: https://hbr.org/2012/12/why-online-retailers-new-prici (accessed on 16 May 2020).
- Pee, L.G.; Jiang, J.; Klein, G. Signaling effect of website usability on repurchase intention. Int. J. Inf. 2018, 39, 228–241. [Google Scholar] [CrossRef]
- Singh, J.J.; Iglesias, O.; Bastista-Foguet, J.M. Does having and ethical brand mattter? The influence of consumer perceived ethicality in trust, affect, and loyalty. J. Bus. Ethics 2012, 111, 543–549. [Google Scholar] [CrossRef]
- Das, G.; Agarwal, J.; Malhotra, N.K.; Varshneya, G. Does brand experience translate into brand commitment? A mediated moderation model of brand passion and perceived brand ethicality. J. Bus. Res. 2019, 95, 479–490. [Google Scholar] [CrossRef]
- Sierra, V.; Iglesias, O.; Markovic, S.; Singh, J.J. Does ethical image build equity in corporate services brands? The influence of customer perceived ethicality on affect, perceived quality, and equity. J. Bus. Ethics 2017, 144, 661–676. [Google Scholar] [CrossRef]
- Iglesias, O.; Markovic, S.; Singh, J.J.; Sierra, V. Do customer perceptions of corporate services brand ethicality improve brand equity? Considering the roles of brand heritage, brand image, and recognitions benefits. J. Bus. Ethics 2019, 154, 441–459. [Google Scholar] [CrossRef]
- Jin, C.; Lee, J. The halo effect of CSR activity: Types of CSR activity and negative information effects. Sustainability 2019, 11, 2067. [Google Scholar] [CrossRef] [Green Version]
- Kang, K.H.; Lee, S.; Huh, C. Impacts of positive and negative corporate social responsibility activities on company performance in the hospitality industry. Int. J. Hosp. Manag. 2010, 29, 72–82. [Google Scholar] [CrossRef]
- Yoo, B.; Donthu, N. Developing and validating a multidimensional consumer-based brand equity scale. J. Bus. Res. 2001, 52, 1–14. [Google Scholar] [CrossRef]
- Putrevu, S.; Lord, K.R. Comparative and noncomparative advertising: Attitudinal effects under cognitive and affective involvement conditions. J. Advert. 1994, 23, 77–91. [Google Scholar] [CrossRef]
- Bolton, L.; Keh, H.T.; Alba, J.W. How do price fairness perceptions differ across culture? J. Mark. Res. 2010, 47, 564–576. [Google Scholar] [CrossRef]
- Buhrmester, M.; Kwang, T.; Gosling, S.D. Amazon’s Mechanical Turk: A new source of inexpensive, yet high-quality, data? Prospect Psychol. Sci. 2011, 6, 3–5. [Google Scholar] [CrossRef] [PubMed]
- Hauser, D.J.; Schwarz, N. Attentive Turkers: MTurk participants perform better on online attention checks than do subject pool participants. Behav. Res. Methods 2016, 48, 400–407. [Google Scholar] [CrossRef] [PubMed]
- Hair, J.F.; Black, W.C.; Babin, B.J.; Anderson, R.E. Multivariate Data Analysis, 7th ed.; Prentice Hall: Upper Saddle River, NJ, USA, 2010. [Google Scholar]
- Li, H.; Fang, Y.; Wang, Y.; Lim, K.H.; Liang, L. Are all signals equal? Investigating the differential effects of online signals on the sales performance of e-marketplace sellers. Inf. Technol. People 2015, 28, 699–723. [Google Scholar] [CrossRef]
- Mavlanova, T.; Benbunan-Fich, R.; Koufaris, M. Signaling theory and information asymmetry in online commerce. Inf. Manag. 2012, 49, 240–247. [Google Scholar] [CrossRef]
- Foroudi, P.; Jin, Z.; Gupta, S.; Foroudi, M.M.; Kitchen, P.J. Perceptual components of brand equity: Configuring the symmetrical and asymmetrical paths to brand loyalty and brand purchase intention. J. Bus. Res. 2018, 89, 462–474. [Google Scholar] [CrossRef] [Green Version]
- Kahneman, D.; Tversky, A. Prospect theory: An analysis of decision under risk. Econometrica 1979, 47, 263–292. [Google Scholar] [CrossRef] [Green Version]
- Jacoby, J.; Speller, D.E.; Kohn, C.A. Brand choice behavior as a function of information load. J. Mark. Res. 1974, 11, 63–69. [Google Scholar] [CrossRef]
- Montgomery, A.L.; Hosanagar, K.; Krishnan, R.; Clay, K.B. Designing a better shopbot. Manag. Sci. 2004, 50, 189–206. [Google Scholar] [CrossRef] [Green Version]
- Jacoby, J. Perspectives on information overload. J. Consum. Res. 1984, 10, 432–435. [Google Scholar] [CrossRef]
- Chen, Y.C.; Shang, R.A.; Kao, C.Y. The effects of information overload on consumers’ subjective state towards buying decision in the internet shopping environment. Electron. Commer. Res. Appl. 2009, 8, 48–58. [Google Scholar] [CrossRef]
- Spry, A.; Pappu, R.; Bettina Cornwell, T. Celebrity endorsement, brand credibility and brand equity. Eur. J. Mark. 2011, 45, 882–909. [Google Scholar] [CrossRef]
- H&M (23 April 2019) H&M First Major Fashion Retailer to Bring Product Transparency to Scale. Available online: https://about.hm.com/news/financial-reports/2019/4/3275581.html (accessed on 21 July 2020).
- Paton, E.; Maheshwari, S. (18 December 2019) H&M’s Different Kind of Clickbait. New York Times. Available online: https://www.nytimes.com/2019/12/18/fashion/hms-supply-chain-transparency.html (accessed on 21 July 2020).

Table 1.
Results of Exploratory Factor Analysis and Reliability Check.
| Factor | Items | Factor Loading | Eigen Value | % of Variance | Cronbach’s α |
|---|---|---|---|---|---|
| Brand Equity | 1. It makes sense to buy Maira instead of any other brand, even if they are the same. | 0.909 | 3.492 | 87.311 | 0.951 |
| 2. Even if another brand has the same features as Maira, I would prefer to buy Maira. | 0.950 | ||||
| 3. If there is another brand as good as Maira, I prefer to buy Maira. | 0.937 | ||||
| 4. If another brand is not different from Maira in any way, it seems smarter to purchase Maira. | 0.941 | ||||
| Purchase Intention | 1. It is very likely that I will purchase from Maira. | 0.958 | 2.693 | 89.772 | 0.943 |
| 2. I will purchase clothes from Maira the next time I purchase clothes. | 0.951 | ||||
| 3. I will definitely purchase Maira’s clothes. | 0.933 |
Table 2.
Results of the Manipulation Check for Perceived Fairness.
| Group | N | Mean | SD | t-Value | p-Value |
|---|---|---|---|---|---|
| Unfair Pricing | 76 | 2.33 | 1.80 | 8.42 | 0.00 *** |
| Fair Pricing | 80 | 5.23 | 1.57 | ||
| Unfair Manufacturing | 74 | 2.89 | 1.70 | 6.90 | 0.00 *** |
| Fair Manufacturing | 78 | 5.09 | 1.50 |
*** p < 0.001.
Table 3.
Results of the Manipulation Check for Transparency Level.
| Group | N | Mean | SD | F-Value | p-Value |
|---|---|---|---|---|---|
| No Price Transparency | 41 | 2.68 | 2.15 | 65.75 | 0.00 *** |
| Low Price Transparency | 74 | 4.61 | 2.08 | ||
| High Price Transparency | 82 | 6.07 | 1.40 | ||
| No Production Transparency | 41 | 2.22 | 1.50 | 116.00 | 0.00 *** |
| Low Production Transparency | 76 | 3.87 | 1.82 | ||
| High Production Transparency | 76 | 5.87 | 1.44 |
*** p < 0.001.
Table 4.
Results of analysis of variance (ANOVA) for Price Transparency.
| Condition | Dependent Variable | Group | N | M | SD | F-Value | p-Value |
|---|---|---|---|---|---|---|---|
| Fair | Brand Equity (H1a) | No Transparency | 41 | 3.38 | 1.42 | ||
| Low Transparency | 38 | 4.36 | 1.42 | 8.01 | 0.001 ** | ||
| High Transparency | 42 | 4.49 | 1.26 | ||||
| Purchase Intention (H1b) | No Transparency | 41 | 3.29 | 1.68 | |||
| Low Transparency | 38 | 4.25 | 1.52 | 5.93 | 0.004 ** | ||
| High Transparency | 42 | 4.43 | 1.58 | ||||
| Unfair | Brand Equity (H2a) | No Transparency | 41 | 3.38 | 1.42 | ||
| Low Transparency | 36 | 2.17 | 1.67 | 9.93 | 0.001 ** | ||
| High Transparency | 40 | 2.51 | 1.36 | ||||
| Purchase Intention (H2b) | No Transparency | 41 | 3.29 | 1.68 | |||
| Low Transparency | 36 | 2.08 | 1.57 | 7.64 | 0.001 ** | ||
| High Transparency | 40 | 2.19 | 1.30 |
** p < 0.01.
Table 5.
Results of ANOVA for Production Transparency.
| Condition | Dependent Variable | Group | N | M | SD | F-Value | p-Value |
|---|---|---|---|---|---|---|---|
| Fair | Brand Equity (H3a) | No Transparency | 41 | 3.38 | 1.42 | ||
| Low Transparency | 40 | 4.29 | 1.11 | 14.69 | 0.000 *** | ||
| High Transparency | 38 | 4.88 | 1.16 | ||||
| Purchase Intention (H3b) | No Transparency | 41 | 3.29 | 1.68 | |||
| Low Transparency | 40 | 3.78 | 1.12 | 12.57 | 0.000 *** | ||
| High Transparency | 38 | 4.84 | 1.31 | ||||
| Unfair | Brand Equity (H4a) | No Transparency | 41 | 3.38 | 1.42 | ||
| Low Transparency | 36 | 2.40 | 1.52 | 6.79 | 0.002 ** | ||
| High Transparency | 38 | 2.33 | 1.34 | ||||
| Purchase Intention (H4b) | No Transparency | 41 | 3.29 | 1.68 | |||
| Low Transparency | 36 | 2.10 | 1.38 | 9.75 | 0.000 *** | ||
| High Transparency | 38 | 2.02 | 1.19 |
** p < 0.01, *** p < 0.001.
© 2020 by the authors. Licensee MDPI, Basel, Switzerland. This article is an open access article distributed under the terms and conditions of the Creative Commons Attribution (CC BY) license (http://creativecommons.org/licenses/by/4.0/).
Share and Cite
MDPI and ACS Style
Kim, N.L.; Kim, G.; Rothenberg, L. Is Honesty the Best Policy? Examining the Role of Price and Production Transparency in Fashion Marketing. Sustainability 2020, 12, 6800. https://doi.org/10.3390/su12176800
AMA Style
Kim NL, Kim G, Rothenberg L. Is Honesty the Best Policy? Examining the Role of Price and Production Transparency in Fashion Marketing. Sustainability. 2020; 12(17):6800. https://doi.org/10.3390/su12176800
Chicago/Turabian StyleKim, Naeun L., Gwia Kim, and Lori Rothenberg. 2020. "Is Honesty the Best Policy? Examining the Role of Price and Production Transparency in Fashion Marketing" Sustainability 12, no. 17: 6800. https://doi.org/10.3390/su12176800
Note that from the first issue of 2016, this journal uses article numbers instead of page numbers. See further details here.