Direct and Indirect Loss Evaluation of Storm Surge Disaster Based on Static and Dynamic Input-Output Models


1
School of Economics, Ocean University of China, Qingdao 266100, China
2
Institute for the Oceans and Fisheries, University of British Columbia, 2202 Main Mall, Vancouver, BC V6T 1Z4, Canada
3
Ocean Development Research Institute, Major Research Base of Humanities and Social Sciences of Ministry of Education, Ocean University of China, Qingdao 266100, China
4
School of Public Policy and Global Affairs, University of British Columbia, 2202 Main Mall, Vancouver, BC V6T 1Z4, Canada
5
Institute for Environment and Development (LESTARI), Universiti Kebangsaan Malaysia, Bangi 43600, Selangor, Malaysia
6
Institute of Marine Economy and Management, Shandong University of Finance and Economics, Jinan 250014, China
7
School of Management Science and Engineering, Shandong University of Finance and Economics, Jinan 250014, China
*
Author to whom correspondence should be addressed.
Sustainability 2020, 12(18), 7347; https://doi.org/10.3390/su12187347
Submission received: 19 July 2020
/
Revised: 24 August 2020
/
Accepted: 4 September 2020
/
Published: 8 September 2020
(This article belongs to the Section Hazards and Sustainability)
Abstract
:Storm surge disaster is one of the biggest threats to coastal areas. Over the years, it has brought serious losses to the economy and environment of China’s coastal areas. In this paper, Guangdong Province is taken as the research object to evaluate the damage caused by storm surge disasters. First of all, regarding the three-industry classification standards of the National Bureau of Statistics, combined with the storm surge disaster assessment index system, the 10-sector storm surge disaster loss input-output table is compiled and analyzed. Secondly, the indirect economic losses of storm surge disasters between 2007–2017 are determined by calculating the direct and indirect consumption coefficients. Thirdly, based on the static input-output model, considering the time factor, the dynamic input-output model of storm surge disaster assessment is established to calculate the cumulative output loss under different recovery periods (30 days, 90 days, 120 days, 180 days, 360 days). The results indicate that: (1) the losses, after a storm surge, in the agricultural economy have the greatest impact on the manufacturing sector, and conversely, they have less effect on the science, education and health service sectors; as well as the construction sector; (2) taking the industry with the biggest loss ratio as an example, the recovery of damaged industries is relatively rapid in the early stage and tends to be stable in the later stage of recovery; (3) the total output loss calculated using the static input-output model is greater than that computed using the dynamic input-output model. Researching the assessment of the direct and indirect loss due to storm surge disasters is of great value and practical significance for the scientific and rational planning of the country’s production layout, the maintenance of social and economic stability and the protection of life and property.
1. Introduction
The coastal areas of the world are home to more than 60% of the world’s population, with people living in large and medium-sized cities located within a range of less than 100 km from the coastline. The coastal areas are also China’s densely populated urban areas, with 14% of the country’s land area accounting for nearly 45% of China’s cities and 51% of the urban population, also accounting for 55% (2019) of the country’s GDP and 57% (2019) of the fiscal revenue. Coastal areas have become the core and leading areas for China’s economic development [1]. The marine economy has become the engine for the coordinated development of China’s regional economy.
Coastal areas face a series of disasters, including climate change [2,3], sea-level rise and their related impacts [4,5,6]. Storm surge disasters are one of the most devastating marine disasters in coastal countries around the world [7,8]. They have a very serious impact on countries in the coastal zone all over the world [9,10], and storm surge damages have been increasing [11]. The United States, Japan, Australia, India and the Bay of Bengal are all affected by storm surge disasters [12,13]. Against the background of global warming and the sea level rising [14,15], the outburst of the storm surge disaster chain effect has become increasingly prominent, the loss caused to countries in the world has shown a rising trend year by year [16,17]. China is one of the countries in the world suffering the most frequently and seriously from storm surges [18,19]. According to the statistics reported in China’s Marine Disaster Bulletin, 633 storm surge disasters occurred in China from 1949 to 2019, bringing direct economic losses of up to USD 47.88 billion. Among them, there were 158 storm surge disasters from 2000–2019, accounting for more than 90% of marine disaster losses. In 2019, 11 storm surges occurred along the coast of China, resulting in a direct economic loss of USD 1.68 billion, 1.34 times the average value of the past decade (USD 1.25 billion). Storm surge disasters have had a serious impact on the social and economic development in the coastal areas in China, and especially on marine economic security [20]. Carrying out research on storm surges and their impact on the socio-economic development and assessing the damage caused has practical significance for improving the capability of national disaster prevention and mitigation and is also a major demand for safeguarding national social stability and national economic security [21,22,23].
In the study of disaster damage assessment, researchers started early and had more results, but mostly focused on floods [24,25,26,27,28,29], typhoons [30,31] and landslide disasters [32], specific studies of storm surge disasters were less than the other disasters. As the cyclone of storm surge disasters and losses continues to grow, more and more scholars pay attention to the study of storm surge disasters [33,34,35,36,37,38,39]. Most scholars focus on the risks and ways to forecast them [40], few scholars have evaluated the economic losses. Especially, the research results of measuring the indirect disaster loss are few and are mostly qualitative descriptions [41,42]. The United Nations and the World Bank have defined indirect loss due to disasters as a decline in social production, a decrease in income, an increase in expenditures, etc. before the disaster recovery. At present, the methods of estimating the indirect economic loss due to disasters include system dynamics, econometrics, input-output, production function and general equilibrium modeling. Among them, the input-output (I-O) model and the computable general equilibrium (CGE) model are the two most commonly used methods [43,44,45,46,47,48,49]. In recent years, some scholars combine the input-output model with other methods to study loss assessment of natural disasters [50,51]. However, the model has the disadvantages of linear constraint and constant price. In disaster impact analysis, the input-output and CGE models are combined with agent-based models to improve the representation of migration [52]. Combined with meteorological, epidemiological and economic analysis, the macro-economic impact of a heatwave was studied using the supply-driven input-output model [53]. According to the econometric model group [54], a storm surge disaster was divided and the loss was evaluated. Using the depth loss curve, Cobb–Douglas production function and an input-output model [55], a comprehensive evaluation method of asset loss, production capacity loss and inter-sector fluctuation loss under the extreme rainstorm and flood scenario was established. The vulnerability of the interdependent sectors was assessed [56]. The most popular single-region input-output model was adopted for disaster impact evaluation [57]. A multi-sectoral CGE model and I-O model was constructed to assess the disaster loss caused by the Beijing “7.21 Rainstorm” in 2012 [58].
During the review, we found that there is much literature on the study of natural disaster loss, but few studies on the loss due to storm surges. Most of them focus on the measurement of overall economic loss from disaster and not on the indirect economic loss among industries. The input-output model is seldom applied in the field of indirect losses from storm surges and no comparative study on the static and dynamic input-output model was found.
This paper has the following innovations in the research on the losses from storm surges (Appendix A). To overcome the shortcomings, using the concept of time series, the static input-output model was extended to a dynamic input-output model to assess the economic loss. The input-output tables were designed to deal with storm surge disasters. The indirect economic losses from storm surges between 2007–2017 were determined by calculating the direct and indirect consumption coefficients. The static and dynamic loss values of the indirect economic losses were also measured, in contrast, to better guide disaster prevention and reduction work. Researching the assessment of storm surge (indirect) loss is of great significance to the protection of life and property, the ability and level of disaster prevention and mitigation of marine power disasters, with important overall strategic and forward-looking scientific value, application value and social significance.
The rest of the paper is structured as follows: The next section introduces the basic concepts of the static and the dynamic input-output model and builds an input-output table suitable for storm surge disasters. The third section empirically analyzes storm surges based on the static input-output model. While the fourth part is about the application of a dynamic input-output model. The discussion and conclusions are presented in the last section.
2. Data and Methods
2.1. Study Area
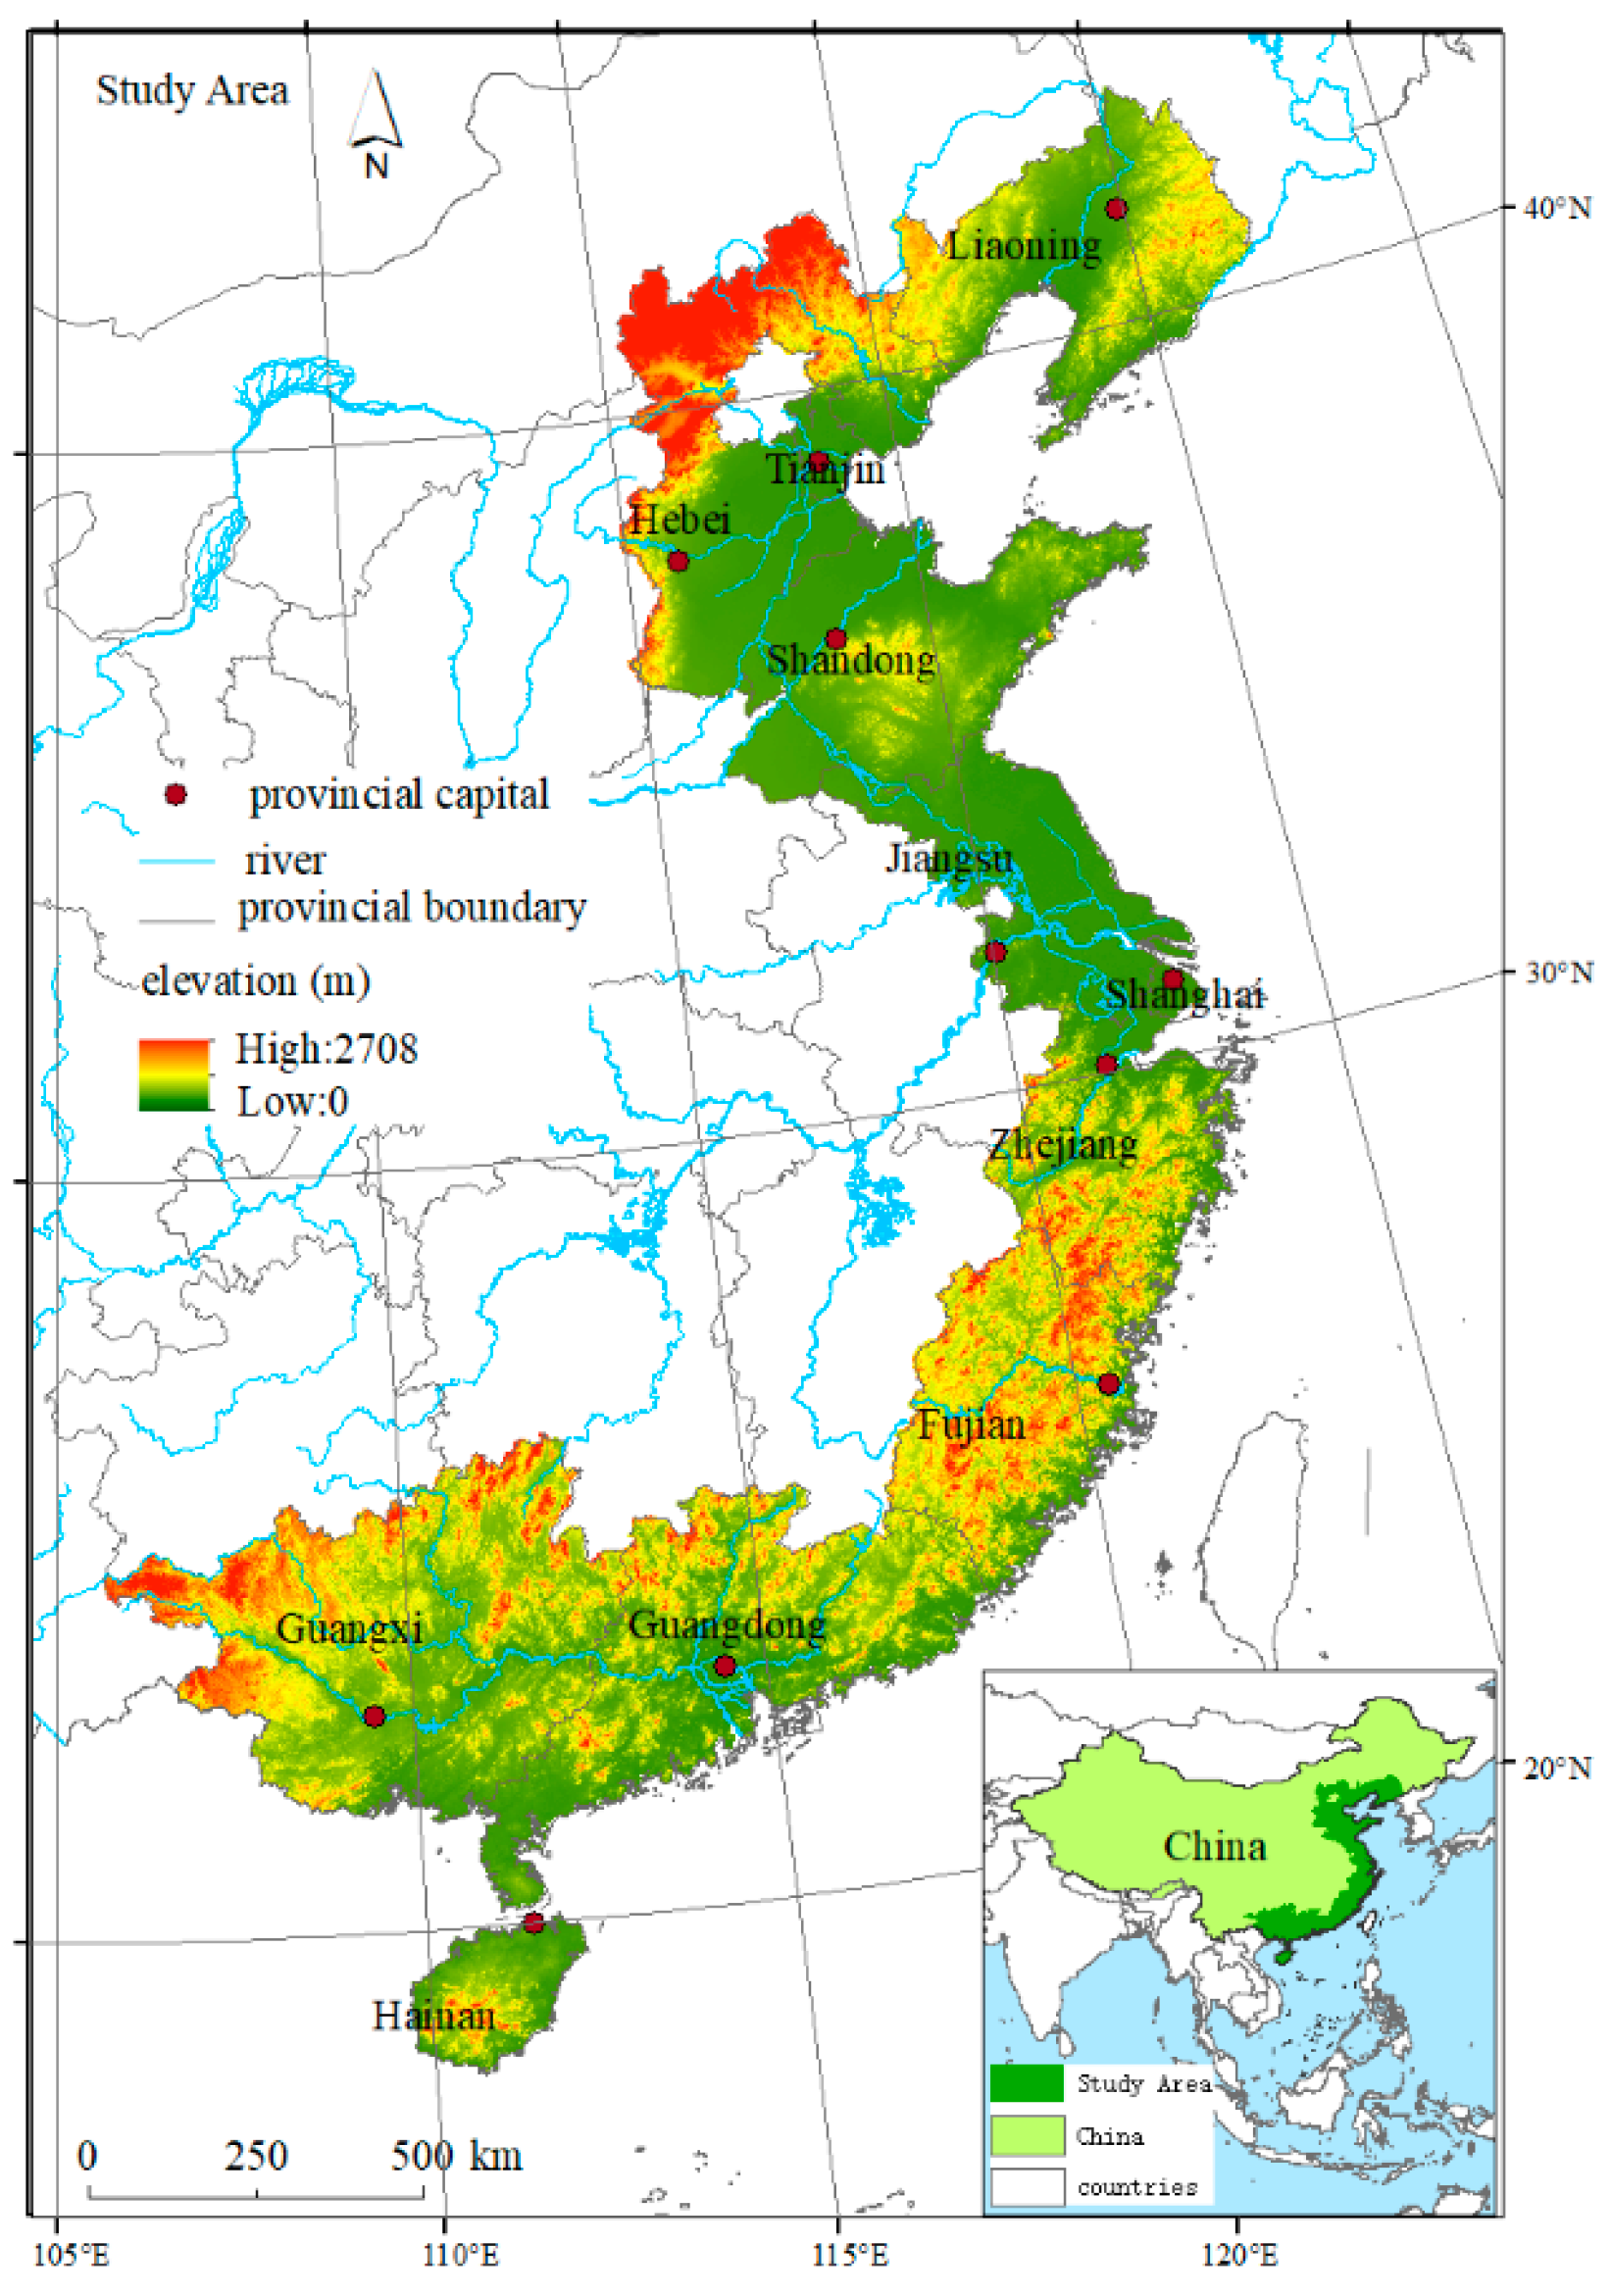
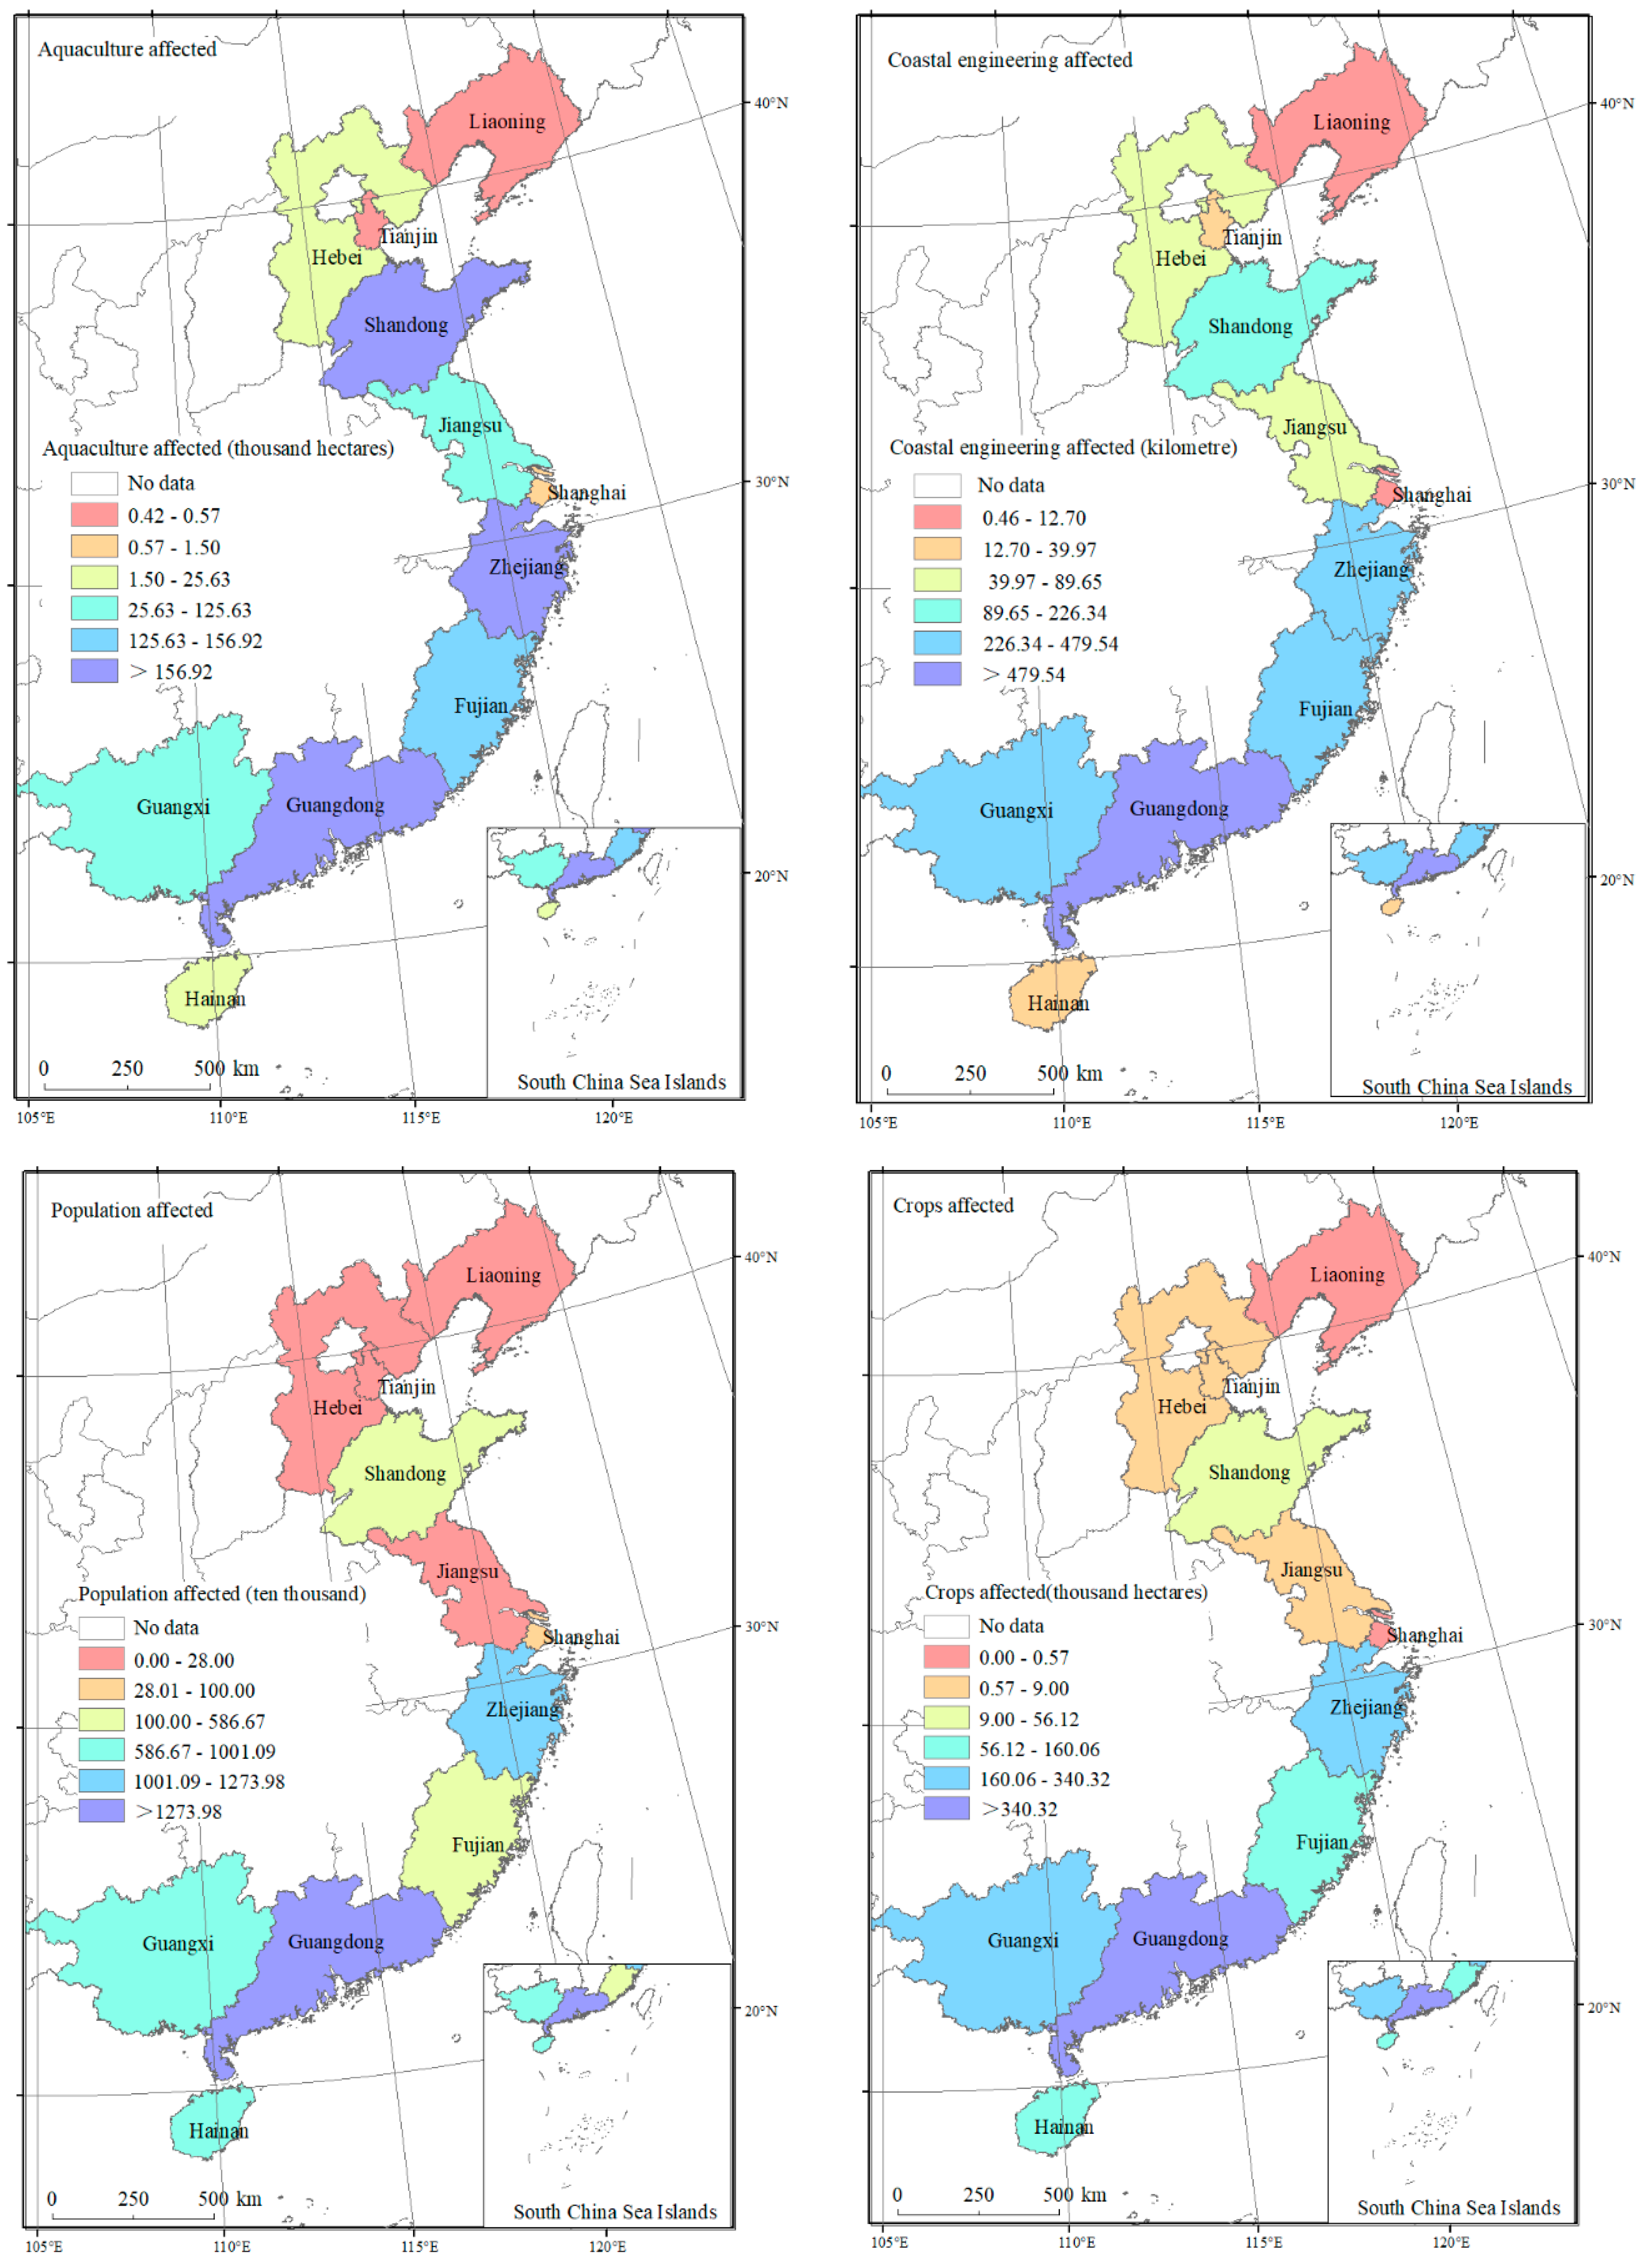
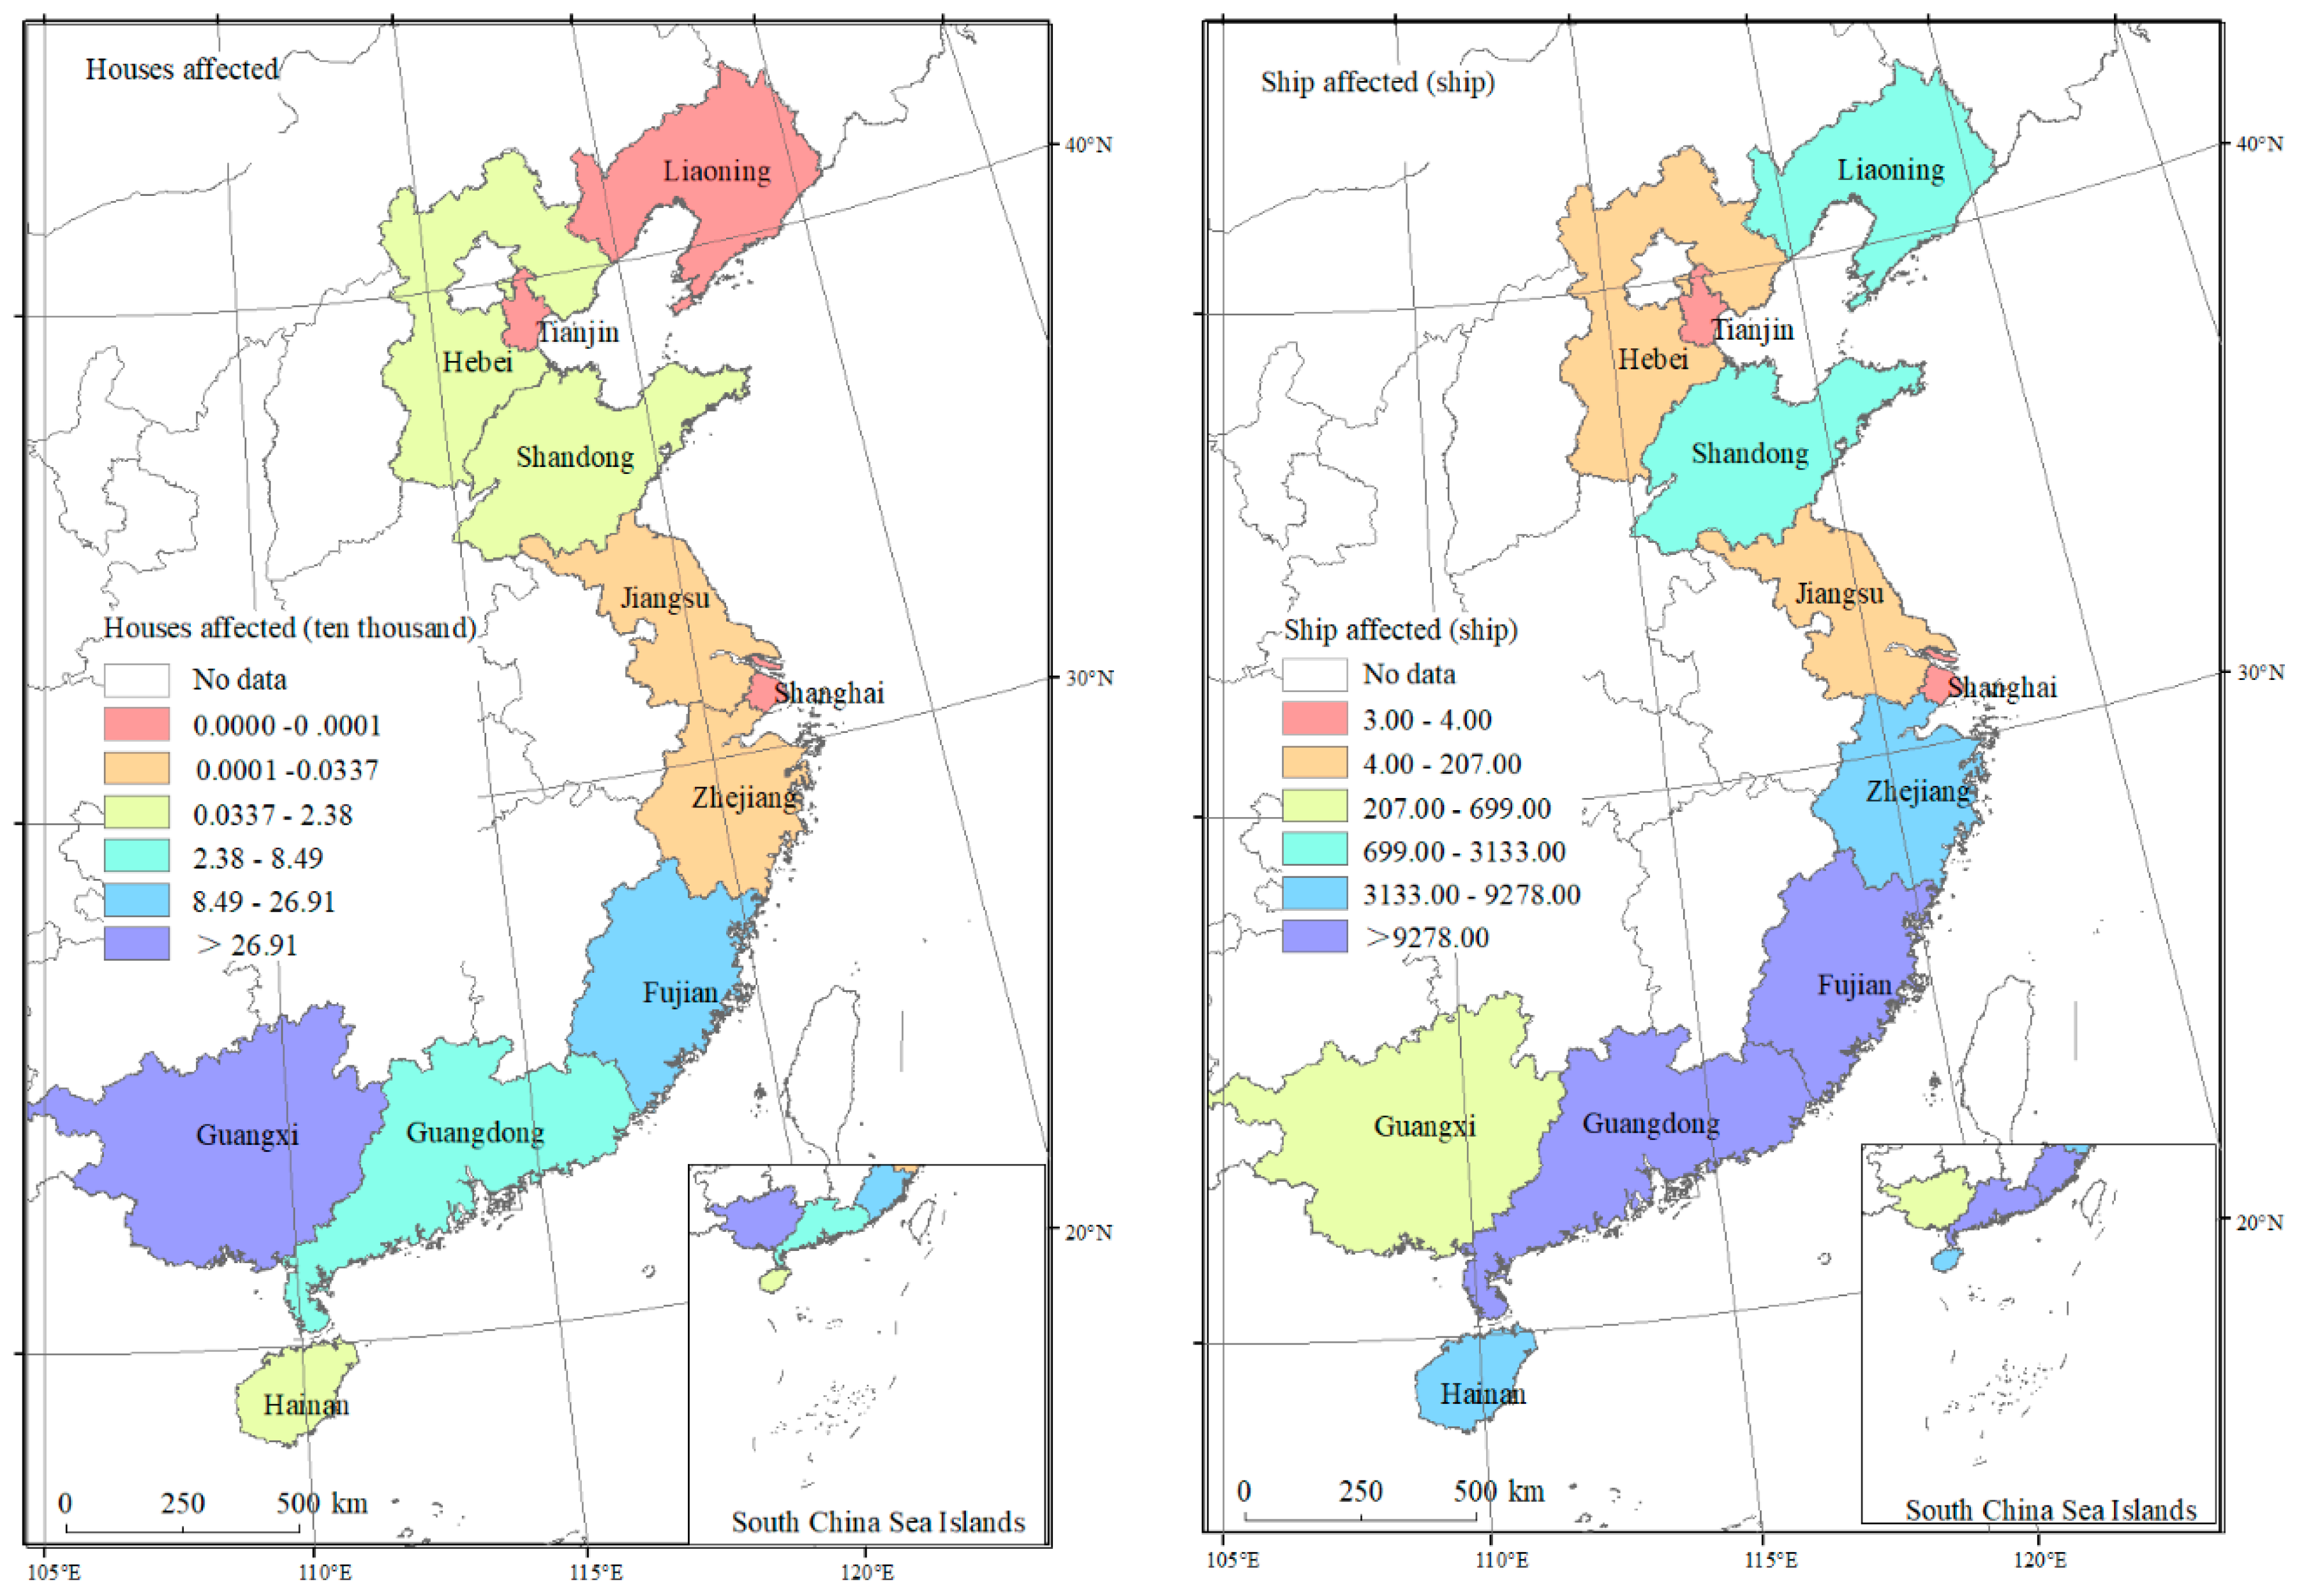
According to the China Marine disaster Bulletin, storm surge disasters cause great damage and serious losses to coastal provinces and cities (Figure 1) every year. According to the analysis of disaster losses such as population, crops, aquaculture, houses, coastal engineering and ships in coastal provinces and cities from 2007 to 2017, the temporal and spatial distribution characteristics of six different disaster losses in the coastal provinces of China are scientifically understood (Figure 2).
Guangdong Province is located on the southern tip of mainland China, where storm surges are common. In this paper, Guangdong Province, as an object of study, was used to evaluate the indirect loss caused by storm surges, and the loss and related links were analyzed. The dataset references are from China’s Marine Disaster Bulletin, the National Bureau of Statistics and the Chinese Input-Output Association.
2.2. Methods
2.2.1. Static Input-Output Model Construction
- (1)
- Coefficient
Elements in the physical-value input-output table were measured in monetary units, among which rows and columns can be added to reflect the physical relationship between social product and the process of social product value formation. From the input-output table, the vertical is representative of the input source and the horizontal is representative of the use of the product. The input-output table is a checkerboard balance table consisting of rows and columns [59].
The value-based input-output table was unified for the unit of measurement of the whole table data to establish the relationship between the row direction and the column direction. After expanding its performance ability, the corresponding mathematical model was also enriched. Many of the economic factors derived from the input-output table made the data in the table closely linked, thus playing a more extensive role than the physical model.
The direct consumption coefficient, also known as the input coefficient, is denoted by . It refers to the value of the goods or services in the product sector, consumed directly by the unit output of the product sector during production and operation. The form of the table will be the direct consumption coefficient matrix or direct consumption coefficient table, generally expressed as the letter . The direct consumption coefficient matrix is calculated as follows: using the total investment of the product sector to remove the value of the goods or services of the product sector is directly consumed in the production and management of the product sector , expressed as:
The complete consumption coefficient, also known as , is the sum of the direct and indirect consumption of goods or services in the product sector for each unit of the product that provides one unit for final use. The complete consumption coefficient matrix can be calculated by directly consuming the coefficient matrix , the formula is:
- (2)
- Static Input-Output Model [60]
According to the static input-output model, the final output value can be obtained through the total output value of each sector of the economy. Similarly, from the loss of the final product, we can calculate the total output loss in each sector.
The total loss of agricultural products is recorded as . Assuming that the final product of the sectors other than the agricultural sector remains unchanged, the changes in the production capacity of other sectors are calculated based on the changes in the productive capacity of the agricultural sector, as expressed below:
Since , is the complete consumption coefficient matrix, is the direct consumption coefficient matrix:
The output change of the entire economic system is:
In the above system of equations, the first equation is , thus . That is, the final product of the agricultural sector is reduced by , The middle loss due to the decrease in agricultural production capacity is . The reduction in intermediate consumption in other sectors will result from a decrease in the final agricultural output, while the decrease in total output in other sectors will be:
The total loss due to the decrease in gross agricultural output is expressed by :
The decrease in total output, except for this sector, resulting from the reduction of the final product in other sectors is:
Total loss from reductions in total output in other sectors:
The total loss caused by the reduction of the total output of fisheries and other sectors was recorded as , the total loss: .
2.2.2. Dynamic Input-Output Model Construction
- (1)
- Coefficient
To connect the whole process of social reproduction through fixed capital formation, it is necessary to carry out a comprehensive analysis of the quantity, structure and effect of fixed capital formation, and introduce the coefficient to establish a dynamic input and output model. There are investments and fund occupancy coefficients, this paper mainly introduces the investment coefficient.
The investment matrix table (Table 1) is based on the total capital formation column vector of the second quadrant of the input-output table.
The investment matrix maintains the same inventory increase of products but expands the formation of fixed capital into an Investment Matrix named . represents the amount of i-type investment products used in the sector , the amount of i-type investment products needed by sector to expand its production scale. represents the total amount of product that the sector uses for fixed capital formation. represents the total amount of fixed capital formation used by the sector . is the number of products the sector uses as inventory increases.
Based on the investment matrix, the investment coefficient is calculated as:
represent the number of investment products required for the expansion of production scale; represents the sector of the annual increase in production scale, in quantity:
represents the number of products required for the increase of the unit output of the sector, namely the investment coefficient of the sector to the product:
The investment coefficient is calculated directly using investment products, which are flow indicators. The flow indicator is an interval value reflecting changes in magnitude that occur over time. This indicator is additive, the sum of the indexes in the segmentations of a period is equal to the index value of the whole period. The investment coefficient, which represents the consumption quota, is linked to capital construction activities and reflected in the degree of demand for investment products in expanding the production scale.
- (2)
- Dynamic Input-Output Model
The dynamic input-output model is a mathematical model that is built directly from the interdependence of dynamics and the quantification of causal relationships. In 1965 Leontief established a dynamic input-output model:
where is the investment coefficient matrix; is the productive investment; is the Final net demand .
Order matrix gets:
Order is the total loss ratio of the sector , represents the total loss in sector caused by disasters, represents the total output size of the sector . The demand loss ratio of the sector is , represents the loss of demand for the sector caused by the disaster, is the element of the matrix , . The above equation can be expressed as:
where
the general solution of the Formula (8) is:
Making the final demand of various sectors constant, , while , The loss suffered by the sector has been restored over time. Only for the specific sector ,
The total economic loss during the recovery period of the sector is:
where means the sector output value in unit time .
2.3. Establishment of Storm Surge Disaster Input-Output Table
According to the marine disaster bulletin, combined with disaster economics theory, disaster economic loss assessment theory and sustainable development theory [61], the analytic hierarchy process (AHP) was used to analyze layer by layer, and the indicators were screened and stratified according to the interpretative structure model. The indirect loss assessment index system of storm surge disasters was constructed [62].
Input-output sectors were selected based on industry division [63] combined with the storm surge disaster assessment index system (Table 2) while referring to “The preparation method of input-output tables in China 2007”, “The sector classification and national economic industry classification code comparison table of China 2007”, “The preparation method of input-output tables in China 2012” and “The sector classification and national economic industry classification code comparison table of China 2012” [59,60]. Comprehensively considering the characteristics and types of disaster losses, the input and output sectors in the storm surge affected areas were merged into 10 industrial sectors.
The main research object of this paper is the economic loss caused by storm surge disasters. The major industrial sectors involved include agriculture and fishery, extractive, manufacturing, construction, transportation and postal services. According to the research needs, the relevant industries were re-divided and merged, and the input-output sectors of storm surge disaster loss assessment were obtained (Table 3).
3. Empirical Analysis of Storm Surge Damage Based on a Static Input-Output Model
3.1. Input-Output Table Structure of Storm Surge Disaster Loss
This paper takes the characteristics and effects of storm surges into consideration and evaluates the losses they cause. Based on the input-output table of storm surge disaster loss and “135 sector input-output table in 2007, Guangdong Province”, “42 sector input-output table in 2007, Guangdong Province”, “135 sector input-output table in 2012, Guangdong Province”, “42 sector input-output table in 2012, Guangdong Province”, and the storm surge disaster loss data of Guangdong Province over the years, the industry sector was divided into 10, as shown in Table 4 and Table 5.
3.2. Input-Output Table Data Processing
This paper applies direct consumption and complete consumption coefficients, which are widely used in the field. Based on the input-output table of storm surges, and the calculation principle of the direct and total consumption coefficients of 42 sectors in input-output tables in 2007 and 2012, the direct consumption and complete consumption coefficient of the input-output table of storm surges in Guangdong Province were obtained according to Formula (1) and Formula (2). The results are shown in Table 6, Table 7, Table 8 and Table 9.
3.3. Analysis of the Static Input-Output Model Result
By referring to the China Maritime Disaster Bulletin, the direct economic losses caused by the storm surges in Guangdong Province in 2007–2017 were USD 349.86 million, USD 2235.07 million, USD 565.07 million, USD 443.77 million, USD 183.04 million, USD 253.19 million, USD 1075.36 million, USD 875.51 million, USD 416.81 million, USD 134.20 million and USD 776.96 million (Figure 3), among which the more serious loss-facing industries were the aquaculture industry and agriculture. By reading the relevant materials, this paper estimates the agricultural (agricultural, forestry, animal husbandry and fishery) total output economic loss based on 80% of the direct economic loss due to the storm surge disasters published by the State Oceanic Administration. According to Formula (3) to Formula (8), selecting 2007 as the base year, we assumed that the input-output relationship among the various branches of the national economy will remain unchanged. We analyzed and calculated the total output loss of agriculture and the indirect economic loss in Guangdong Province from 2007 to 2011 with the input-output model. Selecting 2012 as the base year, we analyzed and calculated the total output loss of agriculture and the indirect economic loss from 2012 to 2017, as shown in Table 10.
By analyzing the above table, conclusions were drawn as follows:
- (1)
- The total agricultural output losses caused by the storm surges in Guangdong Province from 2007 to 2016 were USD 279.88 million, USD 1788.06 million, USD 452.06 million, USD 355.01 million, USD 146.43 million, USD 202.55 million, USD 860.29 million, USD 700.41 million, USD 333.45 million, USD 107.36 million and USD 621.57 million. In 2008, the loss of agricultural final product was USD 1542.09 million, and the indirect economic loss due to storm surge was the largest, which was USD 1634.77 million.
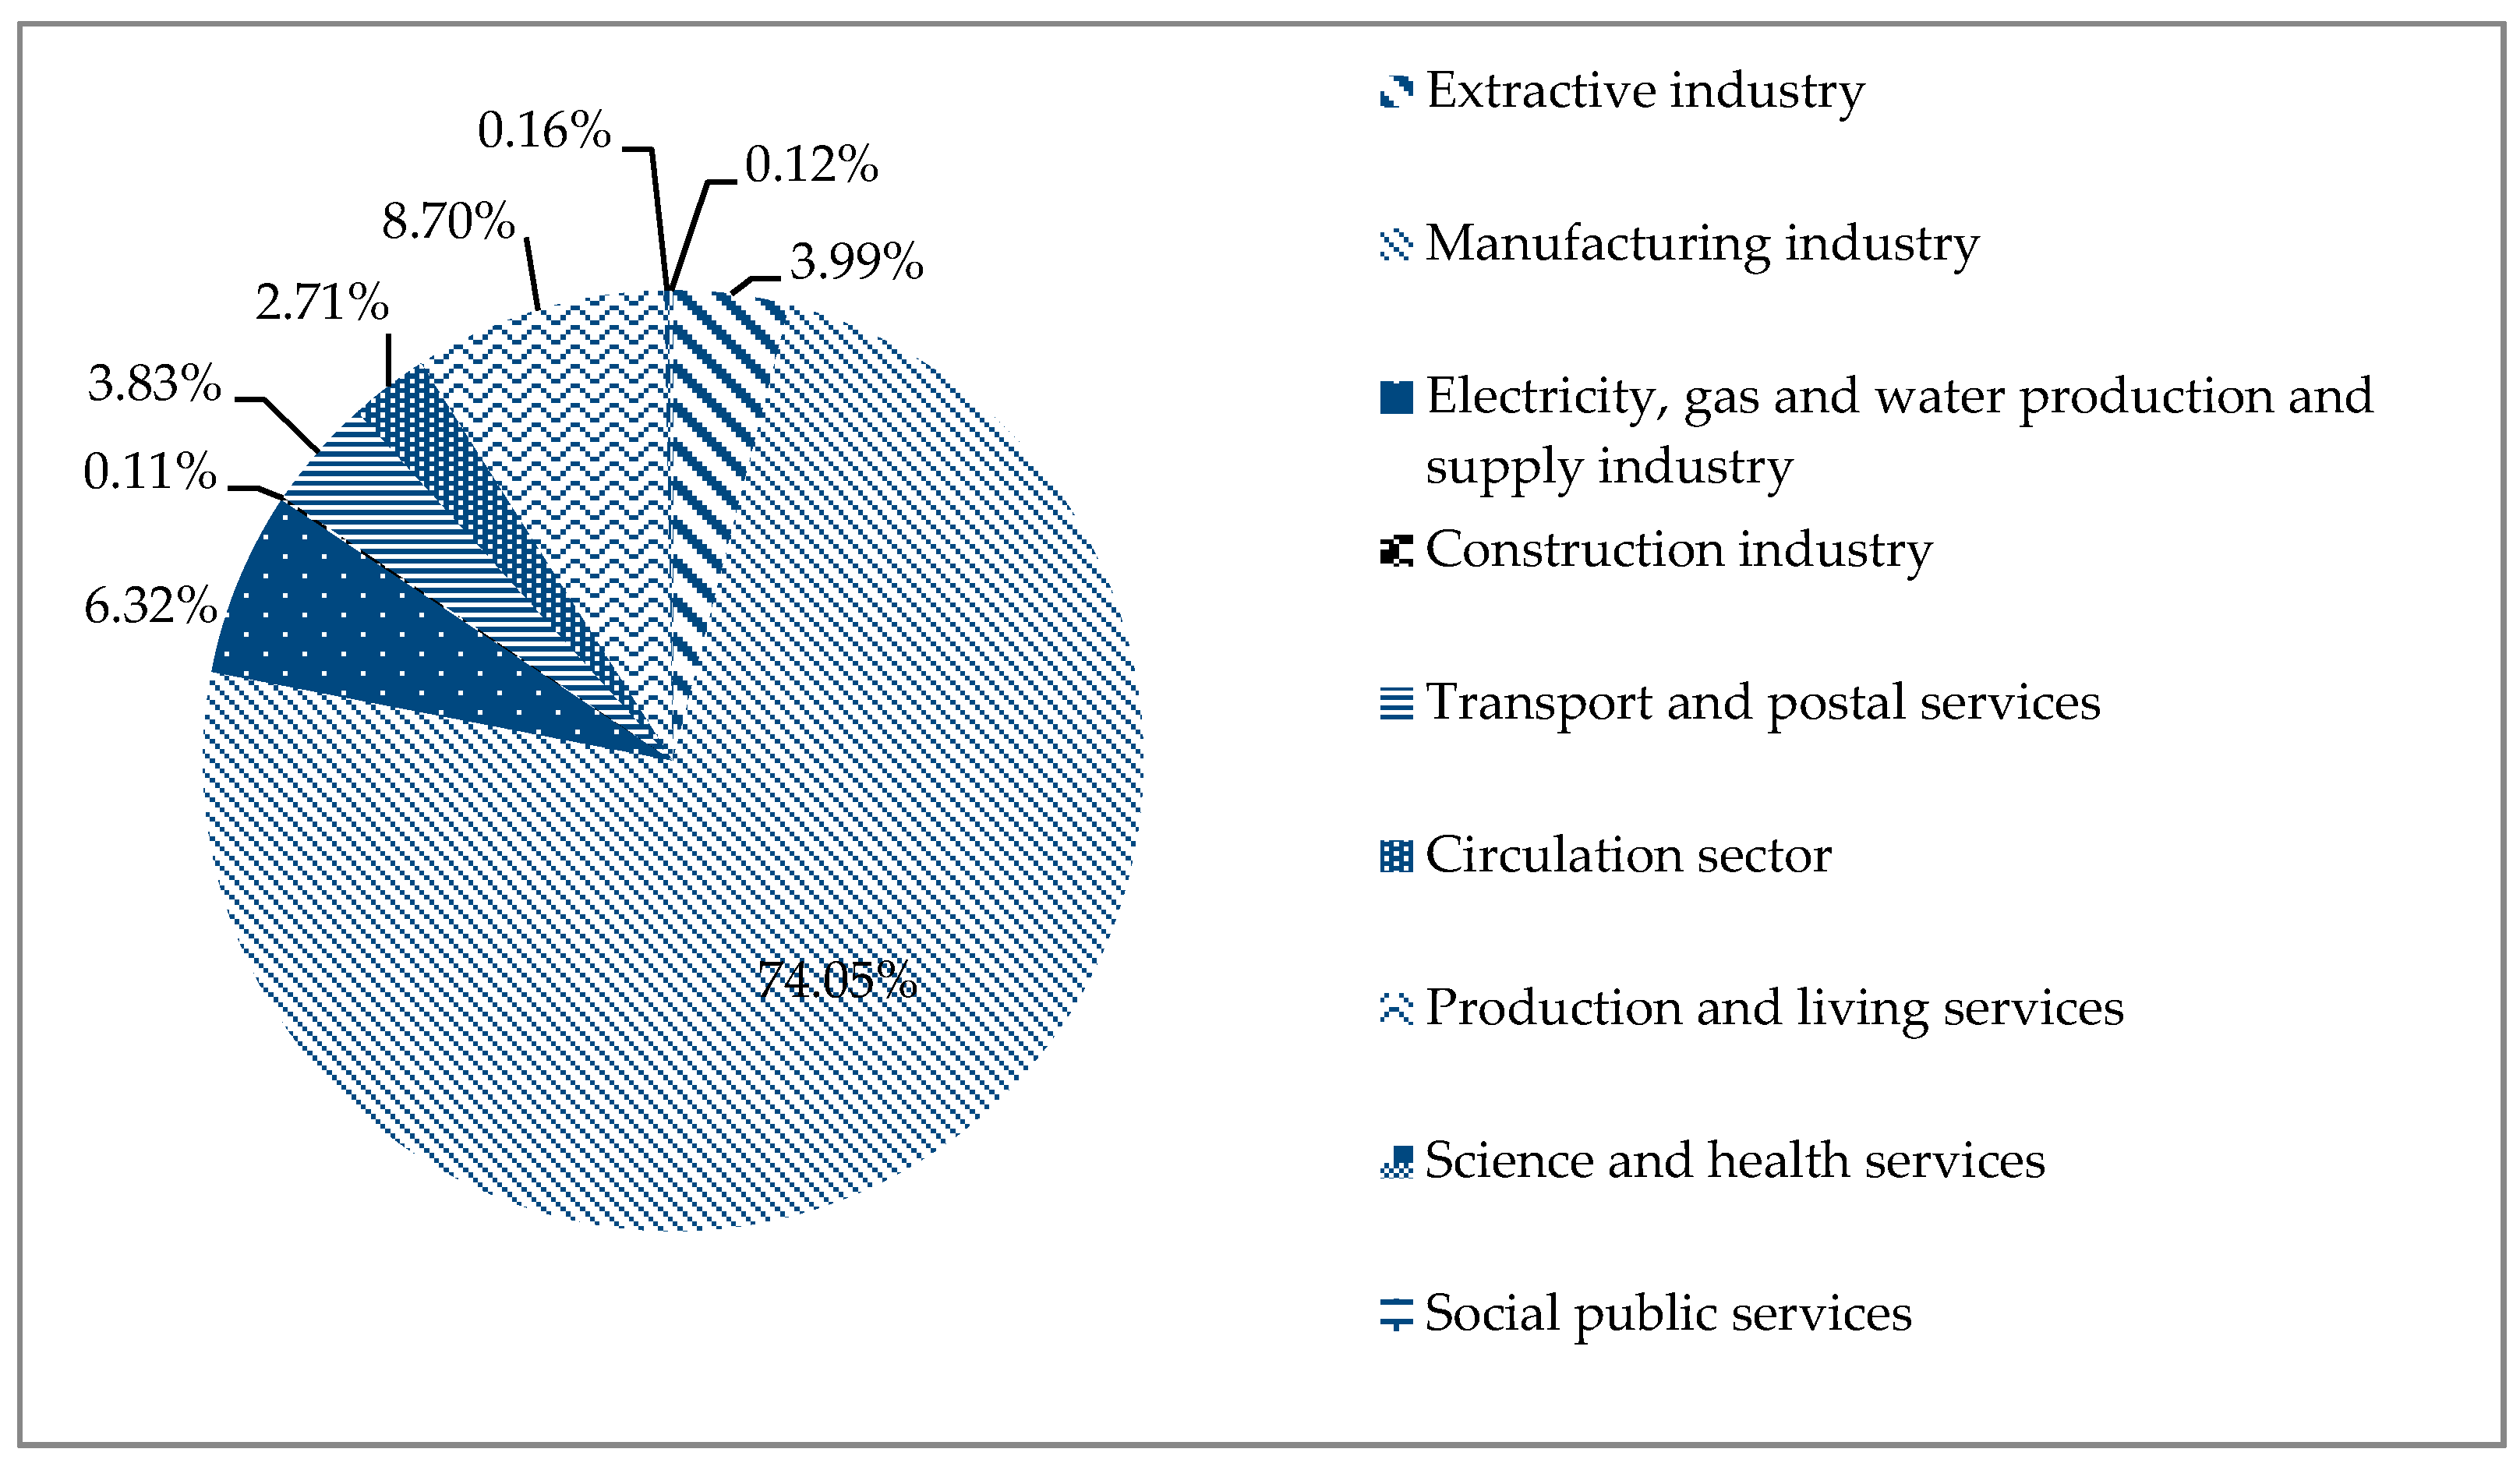
- (2)
- Industries ranked from top-down according to the indirect loss caused by agricultural loss are as follows: manufacturing, production and living services, electricity, gas and water production and supply industry, extractive industry, transport and postal services, circulation sector, science and health services, social public services sector, construction industry. The impact of agricultural economic loss on the manufacturing sector is the strongest, indicating that the economic loss of agriculture is related to the economic loss in the manufacturing industry. The impact of agricultural economic loss on health education sectors, social and public service sectors and construction sectors shows that the agricultural economy is less than 0.2% in all sectors of the industry. Its impact on these industries can be neglected in a rough calculation. The specific results of the impact of the economic loss on the industries are shown in Figure 4 and Figure 5.
- (3)
- According to the input-output table in 2007, indirect economic loss accounted for 73.14% of the direct economic loss, accounting for 42.24% of the total economic loss. According to the input-output table in 2012, indirect economic loss accounted for 73.64% of the direct economic loss, accounting for 42.41% of the total economic loss. The indirect loss caused by storm surges accounted for a large proportion of the total loss. Attention should be paid to the prevention and reduction of indirect disasters.
4. Empirical Analysis of Storm Surge Damage Based on a Dynamic Input-Output Model
4.1. Model Data Processing
Taking the disaster data of Guangdong Province in 2017 as an example, and other years share the same calculation process. Based on the year 2012, assuming that the input-output relationship between the various sectors of the national economy is unchanged, the data of the storm surge disasters were derived from the China Marine Disaster Bulletin. The direct economic loss caused by storm surge in Guangdong Province amounted to USD 7.8 billion in 2017. According to the input-output table of storm surge damage (Table 5), the total output of different sectors except agriculture can be obtained as shown in Table 11.
Based on the direct consumption coefficient (Table 7), combined with the input-output table, the matrix was calculated according to Formula (12) to Formula (15) in dynamic input-output model construction. The total output loss ratio in Guangdong Province was calculated as shown in Table 12.
The proportion of total output loss from large to small is as follows: extractive industry, electricity, gas and water production and supply, manufacturing, circulation, transportation and post and telecommunications, production and living services, social and public services, science and health services, construction industry. The proportion of total output loss reflects the proportion of the economic loss generated by storm surges in the year in the total production of the sector, which in turn reflects the overall impact on the sector. At the same time, the rate of industrial economic recovery and cumulative production is calculated. The loss value is based on the data.
4.2. Analysis of the Dynamic Input-Output Model Result
Judging from the total loss ratio, the extractive industry was most affected by the storm surge disasters in 2017. The extractive industry was selected for dynamic input-output model evaluation and analysis. The analysis of other industries was similar to that of the extractive industry.
The loss ratio of the extractive industry is 0.1106%, . It was assumed that after 60 days the extractive industry will recover to 99.95% of the original output, putting , into the Formula (17) it can be calculated that . The extractive industry functional recovery situation is: . During the 60-day recovery period, the recovery curve of the extractive industry is shown in Figure 6.
From Formula (18) we can see that when the recovery of extractive industry production takes 60 days, the accumulated output value of the sector is USD 0.66 million (Figure 7). Based on this, we can calculate the value of accumulated output loss in other industries. The total accumulated output loss in the entire economic system is the sum of the accumulated output loss in various industries. If the recovery period is changed to 30 days, 90 days, 120 days, 180 days and 360 days respectively, the cumulative output loss values of the extractive industry under each recovery period are as shown in Table 13.
Analyzing the recovery period of the excavation industry in Figure 6, it can be seen that the early recovery period of the industry is relatively fast, while the later period tends to be stable. In general, the proportion of the extractive industry loss is within a proper range. With the improvement of the contingency plans of the relevant sectors and the further escalation of preventive measures, we can expect that the recovery period after storm surges will be further shortened and economic loss will be reduced accordingly.
On the one hand, with the extension of the recovery period, the recovery rate of the industrial economic system gradually decreases, and the decrease is weakening. This indicates that the recovery rate of the sector has gradually reduced, but as the recovery period is extended, the recovery rate decline will decrease. This is because while the recovery period is extended, the amount of economic recovery per unit of time is not fixed, we can easily find this conclusion through the recovery curve. On the other hand, the accumulated output loss value increases gradually with the extension of the recovery period. This is because the recovery period is prolonged and the recovery is slowing down. The sector is unable to produce its normal production, thus exacerbating economic loss. Therefore, after a storm surge, the relevant sectors should take timely measures to coordinate the damaged sector and reduce the recovery period to effectively reduce the storm surge economic loss.
5. Discussion
The calculation of indirect economic loss due to natural disasters usually uses the empirical coefficient method which is simple and easy to operate. However, due to its strong subjectivity, it is unable to conduct a comprehensive quantitative study and thus cannot accurately reflect the loss estimation. The foreign models of indirect economic loss estimation due to natural disasters mainly include the system dynamics model, econometric model, input-output model, production function model, general equilibrium model, etc.
At present, the measurement of indirect economic loss is not unified, the statistics and related research on indirect economic loss are insufficient. Therefore, the related research on the indirect economic loss due to storm surges is still in the stage of exploration, and a comprehensive evaluation system is not formed. This paper introduces the sector input-output approach to calculate indirect economic loss.
Wassily W. Leontief believes that “the characteristic and advantage of input-output analysis is that it can systematically analyze and study the relationship between different sectors of a complex economy quantitatively.” At present, input-output analysis is mainly used in structural analysis, economic prediction and economic benefit analysis [64].
Compared with other methods, the input-output model is more suitable for the assessment of indirect economic losses caused by marine disasters. Firstly, the input-output table reflects the local actual input-output volume, the data is true and consistent with the actual situation, and the application precision of the model is high. Secondly, the input-output model can comprehensively reflect the influence relationship among various industries in the national economic system, which is convenient for the comparison between industries, and the model results are more convenient to obtain. Finally, through the input-output table of different product sectors, the analysis can achieve the purpose of the study, and the calculation difficulty of the model is low.
The dynamic input-output model focuses on the economic dynamic model of structural change of economic sectors, including the time-varying factors. It focuses on the analysis of the quantitative relationship between the total amount and composition of investment in the forward period of the national economy and the scale and structure of product production in various economic sectors in the follow-up period, which reflects not only the total amount change but also the structural change.
The static I-O model reflects the economic quantitative relationship in a specific period, excluding the influence of time factors. The dynamic model is established based on the static model. While retaining the basic quantitative relationship in the static model, the basic task of the dynamic model is to connect the different periods of the national economy through the model, and the link in the formation of fixed capital. The analysis of the quantity, structure and effect of fixed capital formation is the key to establishing the dynamic input-output model.
A dynamic input-output model is established based on the static model. When calculating storm surge disaster loss using a dynamic model with the changes in time, the effect of resilience should be taken into consideration. This is the primary difference between the static model and the dynamic model. Taking the extractive industry as an example, the influence of resilience on loss assessment results is analyzed.
In the situation of a storm surge, the indirect economic loss in the extractive industry will be affected by both the recovery of the extractive industry and the recovery of the economic system. The rapidity and redundancy of the system determine the speed and process of the recovery force of the extractive industry, while external factors determine the size of indirect economic loss. Economic resilience refers to the ability of various industrial sectors in the economic system to adjust and restore balance after the external shock. Given the impact of resilience, when there is a shortage of demand or supply of the extractive industry, each industry sector can mitigate potential loss through alternative resources. In the dynamic input-output model, economic resilience refers to the decline in the input of the extractive industry required by the unit output due to the alternative enhancement of resources.
The dynamic input-output model makes up for the static input-output model’s limitation that it cannot reflect the change with time, but only reflect the economic and social sectors in the short-term related links, without long-term relationships. However, the application of the input-output model requires certain assumptions, that the input-output relationship between the various sectors of the national economy remains the same. These assumptions are often not well satisfied in real life, which will have an impact on the assessment of indirect loss.
6. Conclusions
Storm surges have become one of the most important natural disasters to economic development. Once a storm surge takes place, there will be a huge economic loss, and how to estimate the loss has become an important problem plaguing the relevant researchers.
In this paper, according to the national statistical bureau’s classification criteria for the three industries, the storm surge disaster input and output sectors were merged into 10 industrial sectors, with the consideration of the storm surge hazard assessment index system, and the characteristics of storm surge disaster loss. The 10 sectors’ input-output table of storm surge disaster loss was designed. Based on the year 2007, the total output loss of agriculture and the indirect economic loss in various sectors were obtained from 2007 to 2011 in Guangdong Province. Based on 2012, the total output loss of agricultural output from 2012 to 2016 and the indirect economic losses of various sectors were obtained. The conclusion was that the storm economy has the greatest impact on the agricultural sector and has conversely little impact on the social and public services sector, the health education service sector and the construction sector.
Based on the static input-output model, considering the time factor, the dynamic input-output model of storm surge disaster assessment was constructed. As it had the largest proportion of total output loss, the extractive industry was selected as the object to calculate cumulative output loss value under different recovery periods (30 days, 90 days, 120 days, 180 days, 360 days). The dynamic model loss value of the extractive industry was compared with the static input-output model. The results showed that the longer the production recovery period is, the greater the output loss value is, and the total output loss value of the dynamic input-output model is smaller than that of the static model.
The dynamic input-output model is a development of the static model, revealing the quantitative relationship and causality of the change in the development process. The concrete comparison result is as follows: In the case of the different recovery periods in Table 13, it shows that the accumulated output loss in the industry is proportional to the recovery period of production and becomes larger as the recovery period becomes longer. The total output loss calculated by the static input-output model is larger than that of the dynamic input-output model. This is because the industrial loss rate of the static model is the instantaneous value, which is obtained from the industrial loss rate by multiplying the industrial output value (recovery period is one year). Dynamic model loss is obtained from the loss rate by multiplying the industrial output value by a cumulative number of days from the recovery period, so the total loss is relatively small.
Author Contributions
Conceptualization, X.J. and K.Y.; Formal analysis, Methodology, Writing—original draft, X.J.; Supervision, U.R.S. and K.Y.; Writing—review and editing, U.R.S. and K.Y. All authors have read and agreed to the published version of the manuscript.
Funding
This research was funded by the National Social Science Foundation of China (Grant No.18CJY018).
Acknowledgments
The authors thank the International Postdoctoral Exchange Fellowship Program. We offer our sincere thanks to the editor and anonymous reviewers for their constructive comments, suggestions, and help in enhancing the manuscript.
Conflicts of Interest
The authors declare no conflict of interest.
Appendix A. Highlights
- The 10 sectors’ input-output table of storm surge disaster loss was designed.
- The indirect economic loss due to storm surges between 2007–2017 was determined by calculating the direct and indirect consumption coefficients.
- Based on the static input-output model, considering the time factor, the dynamic input-output model of storm surge disaster assessment was constructed.
- Cumulative output loss value was calculated under different recovery periods (30 days, 90 days, 120 days, 180 days, 360 days).
- The dynamic model loss value of the industry was compared with the static input-output model.
References
- Jin, X.; Yin, K.; Li, X. Grey relational analysis on the land-sea economy in China. Grey Syst. Theory Appl. 2017, 7, 31–44. [Google Scholar] [CrossRef]
- Sumaila, U.R.; Cheung, W.W.; Lam, V.W.; Pauly, D.; Herrick, S. Climate change impacts on the biophysics and economics of world fisheries. Nat. Clim. Chang. 2011, 1, 449–456. [Google Scholar] [CrossRef]
- Lam, V.W.Y.; Allison, E.H.; Bell, J.D.; Blythe, J.; Cheung, W.W.L.; Frölicher, T.L.; Gasalla, M.A.; Sumaila, U.R. Climate change, tropical fisheries and prospects for sustainable development. Nat. Rev. Earth Environ. 2020, 1–15. [Google Scholar] [CrossRef]
- Howe, P.D. Hurricane preparedness as anticipatory adaptation: A case study of community businesses. Glob. Environ. Chang. 2011, 21, 711–720. [Google Scholar] [CrossRef]
- Neumann, B.; Vafeidis, A.T.; Zimmermann, J.; Nicholls, R.J. Future coastal population growth and exposure to sea-level rise and coastal flooding—A global assessment. PLoS ONE 2015, 10, e0118571, Erratum in 2015, 10, e0131375. [Google Scholar] [CrossRef]
- Sumaila, U.R.; Tai, T.C.; Lam, V.W.Y.; Cheung, W.W.L.; Bailey, M.; Cisneros-Montemayor, A.; Chen, O.L.; Gulati, S.S. Benefits of the Paris Agreement to ocean life, economies, and people. Sci. Adv. 2019, 5, eaau3855. [Google Scholar] [CrossRef] [Green Version]
- Berz, G. Windstorm and storm surges in Europe: Loss trends and possible counter-actions from the viewpoint of an international reinsurer. Philos. Trans. A Math. Phys. Eng. Sci. 2005, 363, 1431–1440. [Google Scholar] [CrossRef]
- Olbert, A.I.; Comer, J.; Nash, S.; Hartnett, M. High-resolution multi-scale modeling of coastal flooding due to tides, storm surges and rivers inflows. A Cork City example. Coast. Eng. 2017, 121, 278–296. [Google Scholar] [CrossRef]
- Le, K.T. An analysis of the recent severe storm surge disaster events in China. Nat. Hazards 2000, 21, 215–223. [Google Scholar]
- Guan, H.J.; Zhao, A.W.; Shi, G.Q. Research on E-Commerce Precision Poverty Alleviation; Economic Science Press: Beijing, China, 2019; p. 8. [Google Scholar]
- Ceres, R.L.; Forest, C.E.; Keller, K. Understanding the detectability of potential changes to the 100-year peak storm surge. Clim. Chang. 2017, 145, 221–235. [Google Scholar] [CrossRef]
- Sadri, A.M.; Ukkusuri, S.V.; Gladwin, H. Modeling joint evacuation decisions in social networks: The case of Hurricane Sandy. J. Choice Model. 2017, 25, 50–60. [Google Scholar] [CrossRef]
- Mahapatra, M.; Ratheesh, R.; Rajawat, A.S. Storm surge vulnerability assessment of Saurashtra coast, Gujarat, using GIS techniques. Nat. Hazards 2017, 86, 821–831. [Google Scholar] [CrossRef]
- Hodge, J.; Williams, H. Deriving spatial and temporal patterns of coastal marsh aggradation from hurricane storm surge marker beds. Geomorphology 2016, 274, 50–63. [Google Scholar] [CrossRef] [Green Version]
- Hoffman, R.N.; Dailey, P.; Hopsch, S.; Ponte, R.M.; Quinn, K.; Hill, E.M.; Zachry, B. An estimate of increases in storm surge risk to property from sea level rise in the first half of the twenty-first century. Weather Clim. Soc. 2010, 2, 271–293. [Google Scholar] [CrossRef]
- Kron, W. Flood disasters—A global perspective. Water Policy 2015, 17, 6–24. [Google Scholar] [CrossRef]
- Yan, B.Y.; Li, S.S.; Wang, J. Socio-economic vulnerability of the megacity of Shanghai (China) to sea-level rise and associated storm surges. Reg. Environ. Chang. 2016, 16, 1443–1456. [Google Scholar] [CrossRef]
- Shi, X.; Liu, S.; Yang, S.; Liu, Q.; Tan, J.; Guo, Z. Spatial–temporal distribution of storm surge damage in the coastal areas of China. Nat. Hazards 2015, 79, 237–247. [Google Scholar] [CrossRef]
- Fang, J.; Liu, W.; Yang, S.; Brown, S.; Nicholls, R.J.; Hinkel, J.; Shi, X.; Shi, P. Spatial-temporal changes of coastal and marine disasters risks and impacts in Mainland China. Ocean Coast. Manag. 2017, 109, 125–140. [Google Scholar] [CrossRef]
- Yang, S.; Liu, X.; Liu, Q. A storm surge projection and disaster risk assessment model for China coastal areas. Nat. Hazards 2016, 84, 649–667. [Google Scholar] [CrossRef]
- Ji, F.; Hou, Y. Storm surge disaster evaluation model based on an artificial neural network. Chin. J. Oceanol. Limnol. 2011, 29, 1142–1146. [Google Scholar] [CrossRef]
- Feng, Q.; Liu, Q. Pre-assessment for the loss caused by storm surge based on the SVM-BP neural network. Mar. Environ. Sci. 2017, 36, 615–621. [Google Scholar]
- Jin, X.; Yin, K.D.; Meng, Z.S. Review of storm surge disaster monitoring and early warning in China’s coastal areas. Mar. Environ. Sci. 2017, 36, 149–154. [Google Scholar]
- Guo, E.; Zhang, J.; Ren, X.; Zhang, Q.; Sun, Z. Integrated risk assessment of flood disaster based on improved set pair analysis and the variable fuzzy set theory in central Liaoning Province, China. Nat. Hazards 2014, 74, 947–965. [Google Scholar] [CrossRef]
- Chen, Y.; Ding, J.; Zhao, Y.H. Assessment of flood disaster in Sichuan Province based on the principle of projection pursuit method. J. Hydraul. Eng. 2010, 4, 220–225. [Google Scholar]
- Mendoza-Tinoco, D.; Guan, D.; Zeng, Z.; Xia, Y.; Serrano, A. Flood footprint of the 2007 floods in the UK: The case of the Yorkshire and The Humber region. J. Clean. Prod. 2017, 168, 655–667. [Google Scholar] [CrossRef] [Green Version]
- Hu, X.; Pant, R.; Hall, J.W.; Surminski, S.; Huang, J.S. Multi-Scale Assessment of the Economic Impacts of Flooding: Evidence from Firm to Macro-Level Analysis in the Chinese Manufacturing Sector. Sustainability 2019, 11, 1933. [Google Scholar] [CrossRef] [Green Version]
- Li, M.; Zhang, F.; Barnes, S.; Wang, X.H. Assessing storm surge impacts on coastal inundation due to climate change: Case studies of Baltimore and Dorchester County in Maryland. Nat. Hazards 2020. [Google Scholar] [CrossRef]
- Huq, M.E.; Hossain, M.A. Vulnerability Framework for Flood Disaster Management. J. Geogr. Environ. 2014, 11, 51–67. [Google Scholar]
- Yu, D.J. Intuitionistic fuzzy theory based typhoon disaster evaluation in Zhejiang Province, China: A comparative perspective. Nat. Hazards 2015, 75, 2559–2576. [Google Scholar] [CrossRef]
- Gong, Z.W.; Hu, L. Influence factor analysis of typhoon disaster assessment. J. Nat. Dis. 2015, 24, 203–213. [Google Scholar]
- Nayyer, S.; Huq, M.; Nana Yaw Danquah, T.; Akib, J.; Asif, S. Parameters Derived from and/or Used with Digital Elevation Models (DEMs) for Landslide Susceptibility Mapping and Landslide Risk Assessment: A Review. ISPRS Int. J. GeoInf. 2019, 8, 545. [Google Scholar]
- Petak, W.J.; Atkisson, A.A. Natural hazards risk assessment and public policy: Anticipating the unexpected with 89 figures. Mnemosyne 1968, 21, 94–96. [Google Scholar]
- Rao, A.D.; Chittibabu, P.; Murty, T.S.; Dube, S.K.; Mohanty, U.C. Vulnerability from storm surges and cyclone wind fields on the coast of Andhra Pradesh. India Nat. Hazards 2007, 41, 515–529. [Google Scholar] [CrossRef]
- Mohammed, F.K.; Mimura, N. Impacts of climate change and sea-level rise on cyclonic storm surge floods in Bangladesh. Glob. Environ. Chang. 2008, 18, 490–500. [Google Scholar]
- Kumar, V.S.; Babu, V.R.; Babu, M.T.; Dhinakaran, G.; Rajamanickam, G.V. Assessment of storm surge disaster potential for the Andaman Islands. J. Coast. Res. 2008, 24, 171–177. [Google Scholar] [CrossRef]
- Anfuso, G.; Benavente, J.; Del, R.L.; Graci, F.J. An approximation to short-term evolution and sediment transport pathways along the littoral of Cadiz Bay (SW Spain). Environ. Geol. 2008, 56, 69–79. [Google Scholar] [CrossRef]
- Yin, K.; Zhang, Y.; Li, X. Research on storm-tide disaster losses in China using a new grey relational analysis model with the dispersion of panel data. Int. J. Environ. Res. Public Health 2017, 14, 1330. [Google Scholar] [CrossRef] [Green Version]
- Ghanbari, M.; Arabi, M.; Obeysekera, J. Chronic and Acute Coastal Flood Risks to Assets and Communities in Southeast Florida. J. Water Resour. Plan. Manag. 2020, 146, 04020049. [Google Scholar] [CrossRef]
- Pardowitz, T.; Osinski, R.; Kruschke, T.; Ulbrich, U. An analysis of uncertainties and skill in forecasts of winter storm losses. Nat. Hazards Earth Syst. Sci. 2016, 16, 2391–2402. [Google Scholar] [CrossRef]
- Brookshire, D.S.; Chang, S.E.; Cochrane, H.; Olson, R.A.; Rose, A.; Steenson, J. Direct and indirect economic losses from earth-quake damage. Earthq. Spectra 1997, 13, 683–701. [Google Scholar] [CrossRef]
- Jr, R.T.B.; Dumas, C.F.; Farrell, C.H.; Hall, W.W. Impact of low-intensity hurricanes on regional economic Activity. Nat. Hazards Rev. 2002, 3, 118–125. [Google Scholar]
- Leontief, W.W. Input-Output Economics. Oper. Res. Q. 1951, 185, 15–21. [Google Scholar] [CrossRef]
- Kawashima, K.; Sugita, H.; Kanoh, T. Estimation of earthquake induced economic damage. Rep. Public Work Res. Inst. 1991, 86, 1–57. [Google Scholar]
- Cole, S. Closure in Cole’s Reformulated Leontief Model: A Response to R.W. Jackson, M. Madden, and H.A. Bowman. Pap. Reg. Sci. 1997, 76, 29–42. [Google Scholar] [CrossRef]
- Rose, A.; Benavides, J.; Chang, S.E.; Szczesniak, P.; Lim, D. The regional economic impact of an earthquake: Direct and indirect effects of electricity lifeline disruptions. J. Reg. Sci. 1997, 37, 437–458. [Google Scholar] [CrossRef]
- Ataei, N.; Arnold, C.D.; Padgett, J.E. Regional assessment of hurricane risk to Houston bridge infrastructure. Appl. Stat. Probab. Civ. Eng. 2011, 1398–1406. [Google Scholar] [CrossRef]
- Hallegatte, S.; Ranger, N.; Mestre, O.; Dumas, P.; Corfee-Morlot, J.; Herweijer, C.; Wood, R.M. Assessing climate change impacts, sea level rise and storm surge risk in port cities: A case study on Copenhagen. Clim. Chang. 2011, 104, 113–137. [Google Scholar] [CrossRef] [Green Version]
- Kunz, M.; Muhr, B.; Kunz-Plapp, T.; Daniell, J.E.; Khazai, B.; Wenzel, F.; Vannieuwenhuyse, M.; Comes, T.; Elmer, F.; Schroeter, K. Investigation of superstorm Sandy 2012 in a multi-disciplinary approach. Nat. Hazards Earth Syst. Sci. 2013, 13, 2579–2598. [Google Scholar] [CrossRef] [Green Version]
- Koks, E.E.; Thissen, M. A Multiregional impact assessment model for disaster analysis. Econ. Syst. Res. 2016, 28, 429–449. [Google Scholar] [CrossRef] [Green Version]
- Wang, G.Z.; Chen, R.R.; Chen, J.B. Direct and indirect economic loss assessment of typhoon disasters based on EC and IO joint model. Nat. Hazards 2017, 87, 1751–1764. [Google Scholar] [CrossRef]
- Husby, T.G.; Koks, E.E. Household migration in disaster impact analysis: Incorporating behavioural responses to risk. Nat. Hazards 2017, 87, 1–19. [Google Scholar] [CrossRef] [Green Version]
- Xia, Y.; Li, Y.; Guan, D.; Tinoco, D.M.; Xia, J.J.; Yan, Z.W.; Yang, J.; Liu, Q.Y.; Huo, H. Assessment of the economic impacts of heatwaves: A case study of Nanjing, China. J. Clean. Prod. 2018, 171, 811–819. [Google Scholar] [CrossRef] [Green Version]
- Jin, X.; Shi, X.; Gao, J.; Xu, T.; Yin, K. Evaluation of loss due to storm surge disasters in china based on econometric model groups. Int. J. Environ. Res. Public Health 2018, 15, 604. [Google Scholar] [CrossRef] [PubMed] [Green Version]
- Li, W.; Wen, J.; Xu, B.; Li, X.; Du, S. Integrated assessment of economic losses in manufacturing industry in Shanghai Metropolitan Area under an extreme storm flood scenario. Sustainability 2019, 11, 126. [Google Scholar] [CrossRef] [Green Version]
- Khalid, M.A.; Ali, Y. Economic impact assessment of natural disasters with multi-criteria decision making for interdependent infrastructures. Environ. Dev. Sustain. 2019, 1–25. [Google Scholar] [CrossRef]
- Avelino, A.F.T.; Dall’Erba, S. Comparing the economic impact of natural disasters generated by different input-output models: An application to the 2007 Chehalis River Flood (WA). Risk Anal. 2019, 39, 85–104. [Google Scholar] [CrossRef] [PubMed] [Green Version]
- Tan, L.; Wu, X.; Xu, Z.; Li, L. Comprehensive economic loss assessment of disaster based on CGE model and IO model—A case study on Beijing “7.21 Rainstorm”. Int. J. Dis. Risk Reduct. 2019, 39, 101246. [Google Scholar] [CrossRef]
- Chines Input-Output Association. Available online: http://www.stats.gov.cn/ztjc/tjzdgg/trccxh/zlxz/trccb/ (accessed on 12 June 2020).
- Department of National Economic Accounting. National Bureau of Statistics, Compilation Method of China’s Input-Output Table in 2012; China Statistical Press: Beijing, China, 2014; p. 3.
- Xie, Y.G. Research on Disaster Economics; Economic Science Press: Beijing, China, 2006. [Google Scholar]
- Yin, K.D.; Sun, W.J. Study on economic loss evaluation index system of storm surge disaster. Fish. Econ. China 2011, 29, 87–90. [Google Scholar]
- China National Bureau of Statistics. Available online: http://www.stats.gov.cn/ (accessed on 16 July 2020).
- Dyck, A.; Sumaila, U. Economic impact of ocean fish populations in the global fishery. J. Bioecon. 2010, 12, 227–243. [Google Scholar] [CrossRef]
Figure 1.
The coastal provinces of China.

Figure 2.
Divisions of six types of storm surge disaster damage in coastal provinces in 2007–2017.


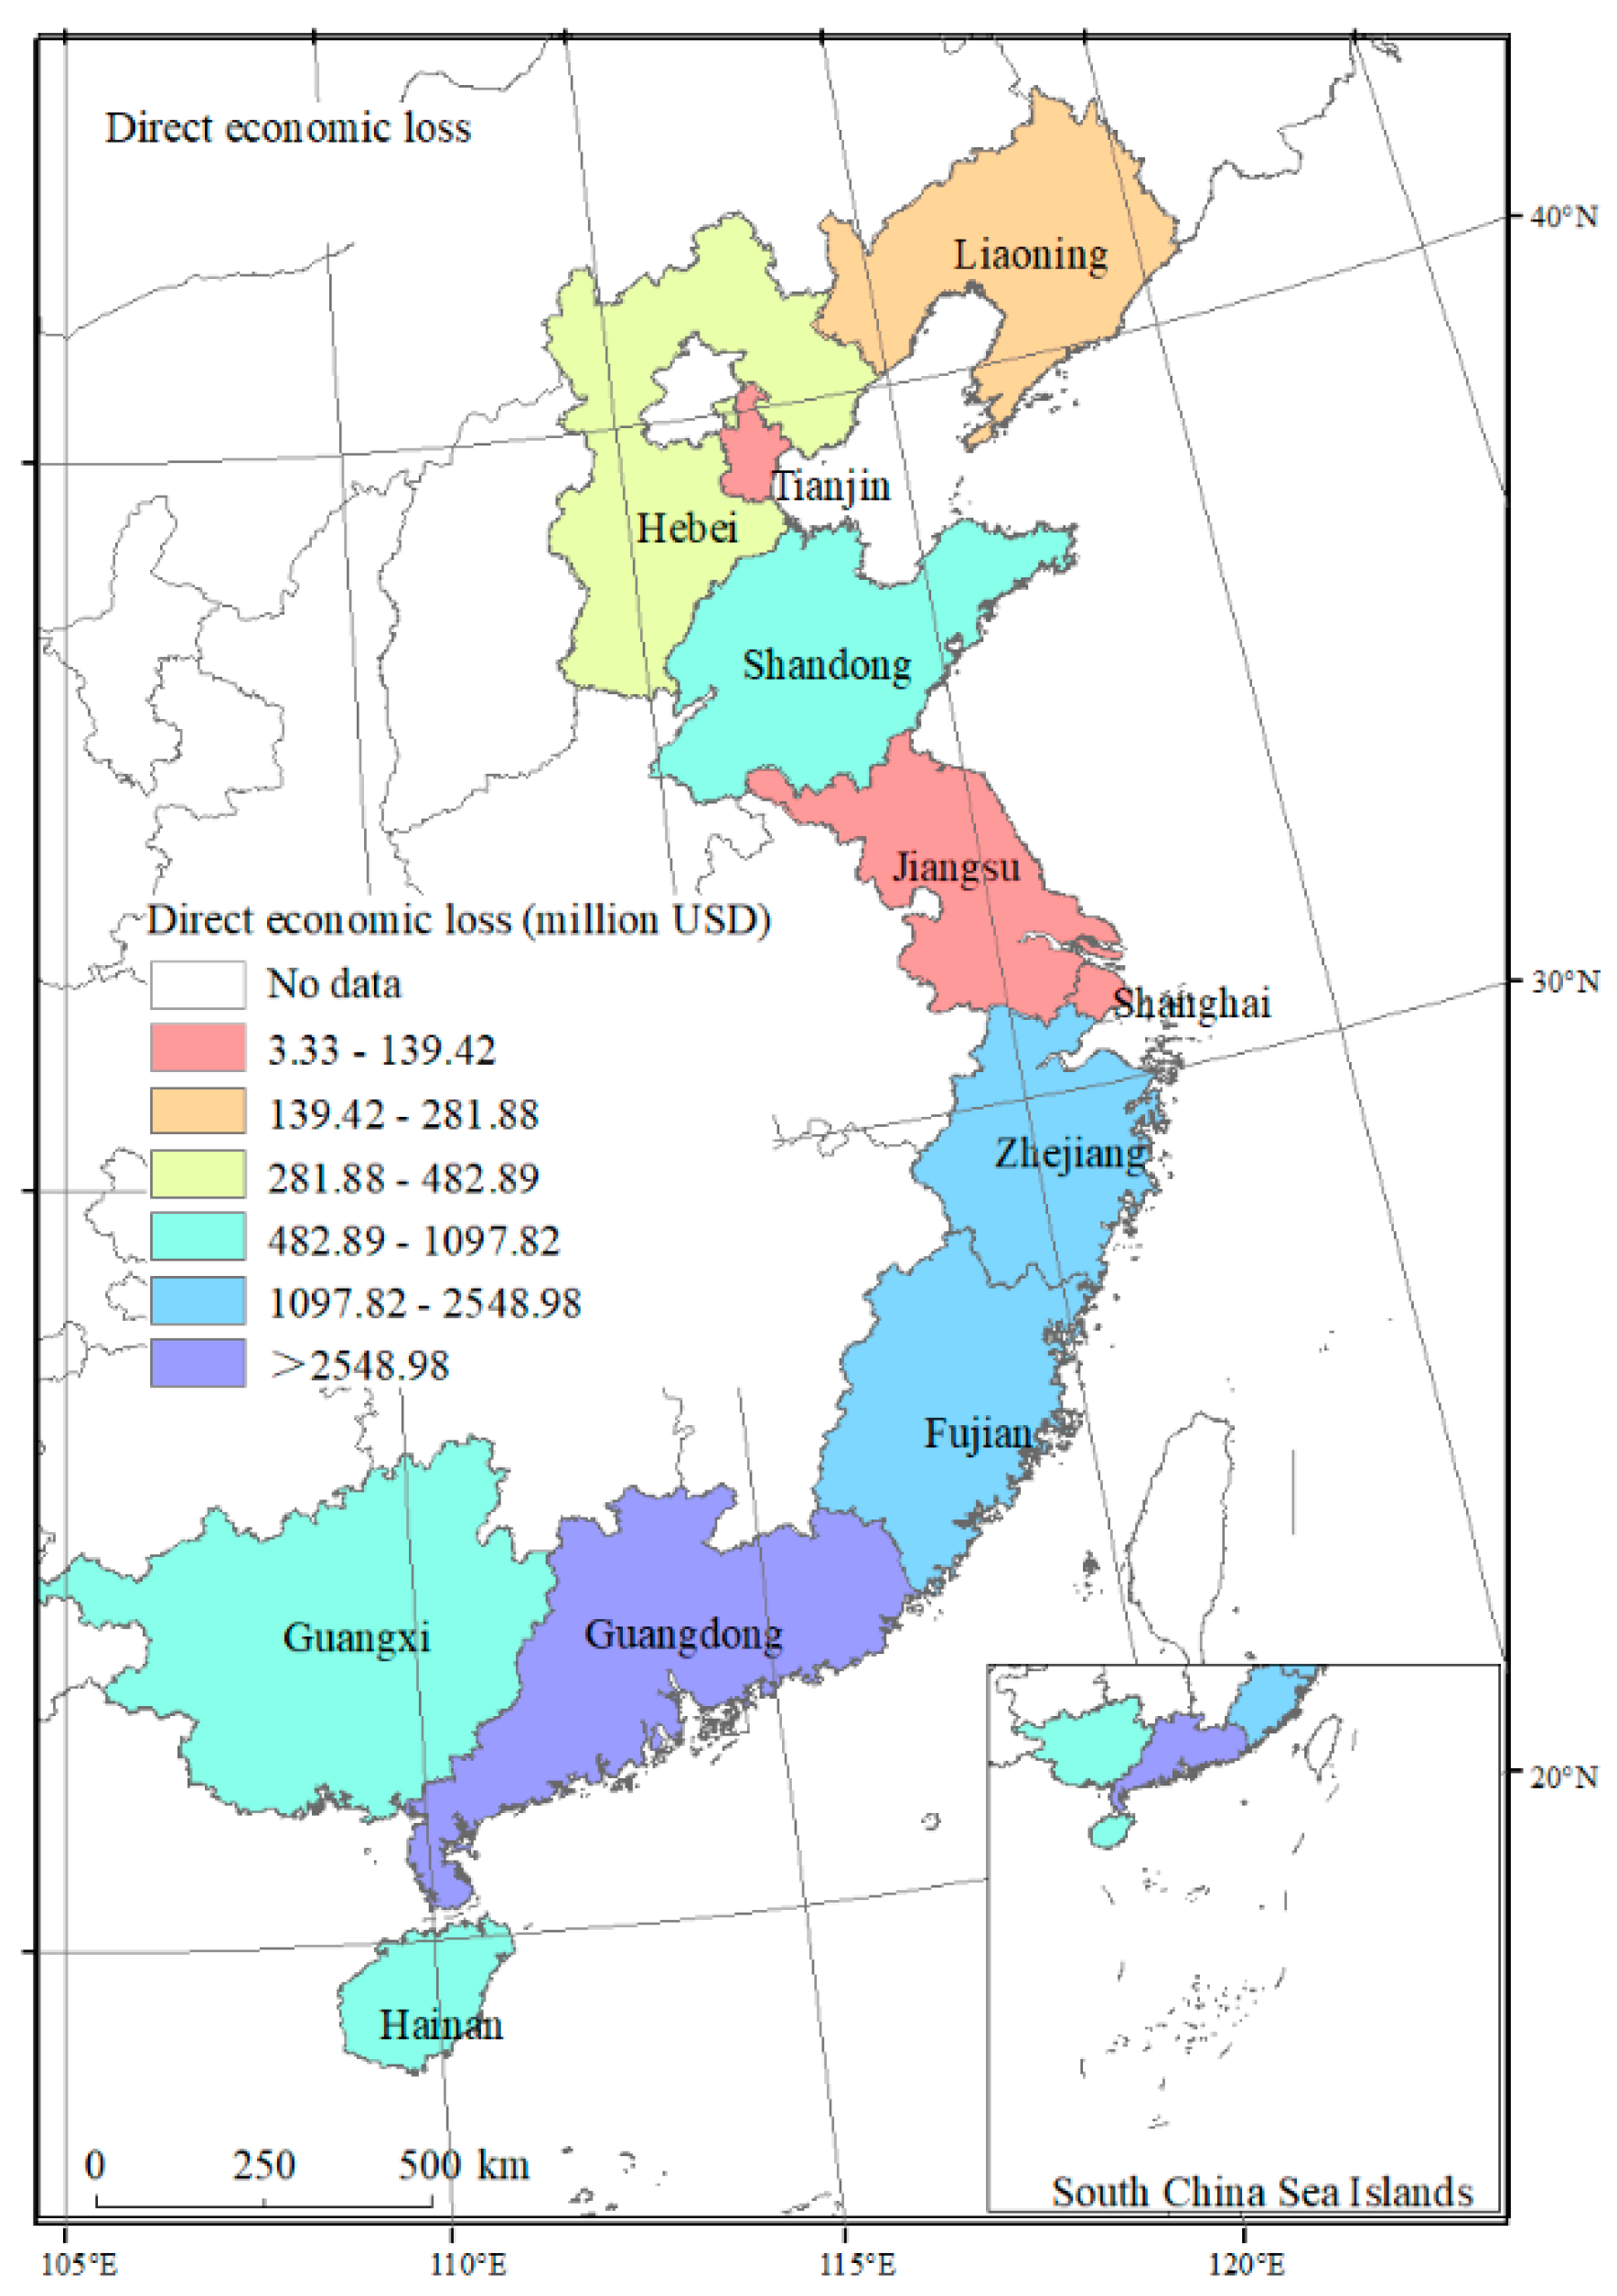
Figure 3.
Direct economic loss in coastal provinces in 2007–2017.

Figure 4.
The proportion of the impact of the agricultural economic loss on other industries in 2007–2011.
Figure 4.
The proportion of the impact of the agricultural economic loss on other industries in 2007–2011.

Figure 5.
The proportion of the impact of the agricultural economic loss on other industries in 2012–2017.
Figure 5.
The proportion of the impact of the agricultural economic loss on other industries in 2012–2017.

Figure 6.
The recovery curve of the extractive industry.

Figure 7.
The accumulated output loss value.


Table 1.
Investment Matrix.
| Investment Sector | Fixed Capital Formation | Inventory Increased | Total | |
|---|---|---|---|---|
| Investment Elements | 1, 2, …, n, Subtotal | |||
| 1 | , , …, , | |||
| 2 | , , …, , | |||
| … | …, …, …, … | … | … | |
| N | , , …, , | |||
| Total | , , …, , | |||
Table 2.
Assessment index system of economic loss due to storm surge disasters.
| Direct economic loss | Direct economic loss in fishing and agriculture | Inundated crop area, damaged crop area, damaged area of marine aquaculture, value of damaged aquaculture facility |
| Direct economic loss in the industry | Total area of damaged plants, value of damaged production equipment, value of damaged finished products, value of damaged unfinished products, raw material, offshore oil and gas mining equipment, oil field equipment, salt pan | |
| Direct economic loss in construction | Building material, buildings in construction, building equipment | |
| Direct economic loss in transport and postal services | Vessels, length of damaged urban road, wharf, submerged containers, posts and telecommunication equipment, dams, water conservancy and power supply facilities | |
| Direct economic loss in the tourist industry | Public facilities like park roads, buildings of sites, attractions of vegetation, casualties and other loss value | |
| Direct economic loss in living facilities | Collapsed buildings, value of indoor property damage | |
| Direct economic loss in human resources | Affected population, number of injuries, number of deaths | |
| Indirect economic loss | Indirect economic loss in fishing and agriculture | Value loss due to salinization of farmland soil, fish pond stop-production, input of aquaculture facility rebuilding |
| Indirect economic loss in the industry | Shut down days of damaged factories, factory shutdown loss, input of workshop rebuilding | |
| Indirect economic loss in construction | Days of stopped construction of building sites, loss due to delay of construction progress | |
| Indirect economic loss in transport and postal services | Communication interruption, traffic interruption, terminals out of service, coastal protection program rebuilding | |
| Indirect economic loss in the tourist industry | Attraction rebuilding, days of attractions shut down | |
| Indirect economic loss in living facilities | House rebuilding, restoration of living facilities | |
| Disaster relief | Rescue medical vehicle, sanitation facilities, medical aid, rescue service vehicles, rescue base station, government relief supplies, input of volunteers, government disaster-relief grants, corporate grants, donation of charitable funds, personal donation, government relief workers | |
| Ecological environment costs | Damaged mangrove area, biosphere damage, coast erosion, wetland destruction | |
| Derived disaster input | Groundwater pollution, disposal of post-disaster waste, prevention of disease, input of treatment |
Table 3.
Input-output sectors of storm surge disaster loss assessment.
| Serial Number | Industry Segment | Detailed Division |
|---|---|---|
| 01 | Agriculture | Farming, forestry, animal husbandry and fishery |
| 02 | Extractive industry | Mining and washing of coal |
| Petroleum and natural gas extraction | ||
| Metal mining and dressing | ||
| Nonmetal mineral mining and dressing | ||
| 03 | Manufacturing industry | Food production and tobacco processing |
| Textile industry | ||
| Textiles and clothing, footwear, leather and its products | ||
| Timber processing and furniture manufacturing | ||
| Paper printing, educational and sports goods | ||
| Petroleum processing, coking and processing of nuclear fuel | ||
| Chemical industry | ||
| Nonmetal mineral products | ||
| Smelting and pressing of metals | ||
| Metal product manufacturing | ||
| General and special equipment manufacturing | ||
| Manufacture of transport equipment | ||
| Manufacture of electric machinery and equipment | ||
| Communication equipment, computer and other electronic equipment manufacturing | ||
| Instruments meters, cultural and office machinery | ||
| Manufacture of artwork and other manufacturing | ||
| Waster and flotsam | ||
| 04 | Electricity, gas and water production and supply industry | Production and supply of electric power and thermal power |
| Production and supply of gas | ||
| Production and supply of water | ||
| 05 | construction industry | Construction industry |
| 06 | Transport and postal services | Transportation, warehousing, postal industry |
| 07 | Circulation sector | Wholesale and retail trade |
| Hotels and catering services | ||
| 08 | Production and living services | Information service industry |
| Finance industry | ||
| Real estate | ||
| Leasing and business services | ||
| Compositive technical services | ||
| Resident services and other services | ||
| Water conservation, environment and public facilities management | ||
| 09 | Science and health services | Education |
| Public health, social security and social welfare | ||
| Culture, sports and entertainment | ||
| 10 | Social public services | Public management and social organization |
Table 4.
Storm surge disaster input and output table in 2007 (unit: 10 thousand USD).
| Flowmeter | Agriculture, Forestry, Animal Husbandry and Fishery | Extractive Industry | Manufacturing Industry | Electricity, Gas and Water Production and Supply Industry | Construction Industry | Transport and Postal Services | Circulation Sector | Production and Living Services | Science and Health Services | Social Public Services | Intermediate Use Part | Total Output |
|---|---|---|---|---|---|---|---|---|---|---|---|---|
| Agriculture, forestry, animal husbandry and fishery | 4,949,118 | 8797 | 20,503,089 | 0 | 777,152 | 14,022 | 3,381,143 | 440,692 | 0 | 164,037 | 10,649,487 | 40,887,536 |
| Extractive industry | 14,666 | 1,975,404 | 31,962,550 | 7,739,739 | 1,171,414 | 2195 | 23,180 | 565 | 3045 | 4252 | −28,870,674 | 14,026,336 |
| Manufacturing industry | 8,586,971 | 2,375,796 | 582,315,915 | 5,959,328 | 28,534,127 | 1,161,2676 | 85,54,421 | 21,702,776 | 8,783,386 | 2,479,463 | 236,690,791 | 917,595,650 |
| Electricity, gas and water production and supply industry | 531,911 | 575,775 | 24,459,363 | 25,089,216 | 8,932,648 | 130,609 | 1,785,029 | 1,154,274 | 419,677 | 505,481 | −2,422,903 | 61,161,079 |
| Construction industry | 8484 | 3914 | 192,036 | 19,954 | 0 | 159,278 | 160,900 | 825,529 | 133,401 | 117,958 | 61,009,994 | 62,513,613 |
| Transport and postal services | 721,190 | 193,084 | 192,036 | 266,205 | 2,203,251 | 2,929,182 | 2,431,733 | 2,642,403 | 275,633 | 383,183 | 11,014,895 | 38,688,229 |
| Circulation sector | 298,527 | 157,758 | 17,168,547 | 291,265 | 1,781,004 | 1039789 | 2,248,808 | 4,573,103 | 766,703 | 1,103,768 | 46,484,811 | 75,914,084 |
| Production and living services | 1,149,991 | 479,871 | 33,923,501 | 2,951,324 | 4,105,809 | 4,535,041 | 11,713,723 | 27,885,859 | 1,875,243 | 2,218,009 | 65,140,335 | 157,087,263 |
| Science and health services | 8037 | 18,032 | 798,668 | 204,482 | 94,010 | 82,563 | 163,722 | 563,706 | 136,579 | 362,327 | 27,426,835 | 29,858,961 |
| Social public services | 45,163 | 0 | 0 | 0 | 0 | 542 | 0 | 20,634 | 1428 | 2503 | 18,236,418 | 18,306,688 |
| Intermediate input part | 16,314,058 | 6,006,047 | 726,081,745 | 0 | 47,599,415 | 20,505,896 | 41,069,434 | 49,202,766 | 12,395,094 | 7,340,982 | ||
| Total input | 40,887,536 | 14,026,336 | 917,595,650 | 61,161,079 | 62,513,613 | 38,688,229 | 99,948,744 | 133,052,602 | 29,858,961 | 18,306,688 |
Table 5.
Storm surge disaster input and output table in 2012 (unit: thousand USD).
| Flowmeter | Agriculture, Forestry, Animal Husbandry and Fishery | Extractive Industry | Manufacturing Industry | Electricity, Gas and Water Production and Supply Industry | Construction Industry | Transport and Postal Services | Circulation Sector | Production and Living Services | Science and Health Services | Social Public Services | Intermediate Use Part | Total Output |
|---|---|---|---|---|---|---|---|---|---|---|---|---|
| Agriculture, forestry, animal husbandry and fishery | 7,178,588 | 1490 | 28,642,071 | 2899 | 1,097,490 | 4778 | 3,627,921 | 3,695,460 | 47,780 | 0 | 44,298,477 | 67,490,580 |
| Extractive industry | 22,182 | 2,961,224 | 41,221,937 | 20,070,319 | 2,315,533 | 489 | 163,980 | 15,200 | 0 | 0 | 66,770,864 | 20,448,975 |
| Manufacturing industry | 16,234,887 | 2,289,019 | 960,270,172 | 2,969,958 | 70,293,650 | 25,049,498 | 19,493,148 | 47,304,213 | 12,275,925 | 1,976,248 | 1,158,156,719 | 1,525,426,573 |
| Electricity, gas and water production and supply industry | 875,779 | 776,580 | 35,089,639 | 43,545,385 | 2,078,054 | 3,612,106 | 4,252,794 | 4,730,371 | 1,004,862 | 1,000,340 | 96,965,909 | 102,134,355 |
| Construction industry | 2782 | 0 | 762,727 | 411,606 | 6,350,039 | 82,060 | 392,387 | 903,671 | 180,818 | 181,265 | 9,267,355 | 126,871,594 |
| Transport and postal services | 604,897 | 309,847 | 762,727 | 2,182,869 | 3,261,883 | 13,435,762 | 8,907,226 | 6,005,760 | 957,158 | 931,707 | 66,166,152 | 88,466,232 |
| Circulation sector | 780,276 | 309,847 | 51,555,206 | 734,759 | 8,401,935 | 2,555,350 | 7,833,325 | 12,167,584 | 2,175,728 | 2,432,808 | 674,192 | 161,620,954 |
| Production and living services | 504,260 | 1,031,991 | 42,299,888 | 5,840,385 | 5,521,588 | 9,275,563 | 29,030,691 | 56,320,124 | 7,051,389 | 4,519,513 | 161,395,391 | 311,671,594 |
| Science and health services | 3398 | 30,173 | 797,639 | 65,108 | 127,538 | 128,860 | 396,482 | 1,858,591 | 1,159,939 | 454,316 | 5,022,043 | 61,998,261 |
| Social public services | 18,892 | 556 | 206,935 | 1645 | 19,537 | 10,687 | 30,451 | 300,719 | 16,689 | 513,515 | 1,119,627 | 35,790,145 |
| Intermediate input part | 26,225,942 | 8,519,120 | 1,189,606,863 | 75,824,934 | 99,467,246 | 54,155,152 | 74,128,406 | 133,301,692 | 24,870,290 | 12,009,710 | ||
| Total input | 67,490,580 | 20,448,975 | 1,525,426,573 | 102,134,355 | 126,871,594 | 88,466,232 | 161,620,954 | 311,671,594 | 61,998,261 | 35,790,145 |
Table 6.
Storm surge tide direct consumption coefficient in 2007.
| Flowmeter | Agriculture, Forestry, Animal Husbandry and Fishery | Extractive Industry | Manufacturing Industry | Electricity, Gas and Water Production and Supply Industry | Construction Industry | Transport and Postal Services | Circulation Sector | Production and Living Services | Science and Health Services | Social Public Services |
|---|---|---|---|---|---|---|---|---|---|---|
| Agriculture, forestry, animal husbandry and fishery | 0.1210 | 0.0006 | 0.0223 | 0.0000 | 0.0124 | 0.0004 | 0.0445 | 0.0028 | 0.0000 | 0.0090 |
| Extractive industry | 0.0004 | 0.1408 | 0.0348 | 0.1265 | 0.0187 | 0.0001 | 0.0003 | 0.0000 | 0.0001 | 0.0002 |
| Manufacturing industry | 0.2100 | 0.1694 | 0.6346 | 0.0974 | 0.4564 | 0.3002 | 0.1127 | 0.1382 | 0.2942 | 0.1354 |
| Electricity, gas and water production and supply industry | 0.0130 | 0.0410 | 0.0267 | 0.4102 | 0.1429 | 0.0034 | 0.0235 | 0.0073 | 0.0141 | 0.0276 |
| Construction industry | 0.0002 | 0.0003 | 0.0002 | 0.0003 | 0.0000 | 0.0041 | 0.0021 | 0.0053 | 0.0045 | 0.0064 |
| Transport and postal services | 0.0176 | 0.0293 | 0.0161 | 0.0044 | 0.0352 | 0.0757 | 0.0320 | 0.0210 | 0.0092 | 0.0209 |
| Circulation sector | 0.0073 | 0.0112 | 0.0187 | 0.0048 | 0.0285 | 0.0269 | 0.0296 | 0.0291 | 0.0257 | 0.0603 |
| Production and living services | 0.0281 | 0.0342 | 0.0370 | 0.0483 | 0.0657 | 0.1172 | 0.1543 | 0.1775 | 0.0628 | 0.1212 |
| Science and health services | 0.0002 | 0.0013 | 0.0009 | 0.0033 | 0.0015 | 0.0021 | 0.0022 | 0.0036 | 0.0046 | 0.0198 |
| Social public services | 0.0011 | 0.0000 | 0.0000 | 0.0000 | 0.0000 | 0.0000 | 0.0000 | 0.0001 | 0.0000 | 0.0001 |
Table 7.
Storm surge tide direct consumption coefficient in 2012.
| Flowmeter | Agriculture, Forestry, Animal Husbandry and Fishery | Extractive Industry | Manufacturing Industry | Electricity, Gas and Water Production and Supply Industry | Construction Industry | Transport and Postal Services | Circulation Sector | Production and Living Services | Science and Health Services | Social Public Services |
|---|---|---|---|---|---|---|---|---|---|---|
| Agriculture, forestry, animal husbandry and fishery | 0.1064 | 0.0001 | 0.0188 | 0.0000 | 0.0087 | 0.0001 | 0.0224 | 0.0119 | 0.0008 | 0.0000 |
| Extractive industry | 0.0003 | 0.1448 | 0.0270 | 0.1965 | 0.0183 | 0.0000 | 0.0010 | 0.0000 | 0.0000 | 0.0000 |
| Manufacturing industry | 0.2406 | 0.1119 | 0.6295 | 0.0291 | 0.5541 | 0.2832 | 0.1206 | 0.1518 | 0.1980 | 0.0552 |
| Electricity, gas and water production and supply industry | 0.0130 | 0.0380 | 0.0230 | 0.4264 | 0.0164 | 0.0408 | 0.0263 | 0.0152 | 0.0162 | 0.0280 |
| Construction industry | 0.0000 | 0.0000 | 0.0005 | 0.0040 | 0.0501 | 0.0009 | 0.0024 | 0.0029 | 0.0029 | 0.0051 |
| Transport and postal services | 0.0090 | 0.0152 | 0.0005 | 0.0214 | 0.0257 | 0.1519 | 0.0551 | 0.0193 | 0.0154 | 0.0260 |
| Circulation sector | 0.0116 | 0.0152 | 0.0338 | 0.0072 | 0.0662 | 0.0289 | 0.0485 | 0.0390 | 0.0351 | 0.0680 |
| Production and living services | 0.0075 | 0.0505 | 0.0277 | 0.0572 | 0.0435 | 0.1048 | 0.1796 | 0.1807 | 0.1137 | 0.1263 |
| Science and health services | 0.0001 | 0.0015 | 0.0005 | 0.0006 | 0.0010 | 0.0015 | 0.0025 | 0.0060 | 0.0187 | 0.0127 |
| Social public services | 0.0003 | 0.0000 | 0.0001 | 0.0000 | 0.0002 | 0.0001 | 0.0002 | 0.0010 | 0.0003 | 0.0143 |
Table 8.
Storm surge disaster complete consumption coefficient in 2007.
| Flowmeter | Agriculture, Forestry, Animal Husbandry and Fishery | Extractive Industry | Manufacturing Industry | Electricity, Gas and Water Production and Supply Industry | Construction Industry | Transport and Postal Services | Circulation Sector | Production and Living Services | Science and Health Services | Social Public Services |
|---|---|---|---|---|---|---|---|---|---|---|
| Agriculture, forestry, animal husbandry and fishery | 0.1595 | 0.0208 | 0.0816 | 0.0207 | 0.0595 | 0.0321 | 0.0679 | 0.0218 | 0.0281 | 0.0304 |
| Extractive industry | 0.0422 | 0.2102 | 0.1464 | 0.2875 | 0.1361 | 0.0544 | 0.0334 | 0.0312 | 0.0514 | 0.0373 |
| Manufacturing industry | 0.7845 | 0.7046 | 2.043 | 0.7209 | 1.6088 | 1.0909 | 0.542 | 0.587 | 0.9779 | 0.5956 |
| Electricity, gas and water production and supply industry | 0.0669 | 0.1199 | 0.1555 | 0.7527 | 0.3323 | 0.0671 | 0.0745 | 0.0493 | 0.0779 | 0.0856 |
| Construction industry | 0.0012 | 0.0014 | 0.0021 | 0.0019 | 0.0021 | 0.0062 | 0.0039 | 0.0072 | 0.0058 | 0.0082 |
| Transport and postal services | 0.0406 | 0.0552 | 0.0665 | 0.0353 | 0.0805 | 0.1111 | 0.0542 | 0.043 | 0.0349 | 0.0433 |
| Circulation sector | 0.0287 | 0.0331 | 0.0691 | 0.0321 | 0.0727 | 0.0602 | 0.0511 | 0.0519 | 0.0522 | 0.083 |
| Production and living services | 0.093 | 0.1051 | 0.1793 | 0.1611 | 0.2068 | 0.2288 | 0.2401 | 0.275 | 0.145 | 0.2075 |
| Science and health services | 0.0017 | 0.0032 | 0.0043 | 0.0076 | 0.0053 | 0.0046 | 0.004 | 0.0055 | 0.0065 | 0.0218 |
| Social public services | 0.0013 | 0.0000 | 0.0001 | 0.0000 | 0.0001 | 0.0001 | 0.0002 | 0.0001 | 0.0002 | 0.0002 |
Table 9.
Storm surge disaster complete consumption coefficient in 2012.
| Flowmeter | Agriculture, Forestry, Animal Husbandry and Fishery | Extractive Industry | Manufacturing Industry | Electricity, Gas and Water Production and Supply Industry | Construction Industry | Transport and Postal Services | Circulation Sector | Production and Living Services | Science and Health Services | Social Public Services |
|---|---|---|---|---|---|---|---|---|---|---|
| Agriculture, forestry, animal husbandry and fishery | 0.1381 | 0.0125 | 0.0659 | 0.0129 | 0.0545 | 0.0282 | 0.0434 | 0.032 | 0.0203 | 0.0124 |
| Extractive industry | 0.0414 | 0.2086 | 0.1235 | 0.4277 | 0.1094 | 0.0678 | 0.0408 | 0.0357 | 0.039 | 0.0373 |
| Manufacturing industry | 0.8128 | 0.4675 | 1.9065 | 0.4313 | 1.8189 | 1.0916 | 0.5876 | 0.6239 | 0.7102 | 0.3428 |
| Electricity, gas and water production and supply industry | 0.0662 | 0.1062 | 0.1368 | 0.8009 | 0.1269 | 0.1442 | 0.0906 | 0.0684 | 0.0712 | 0.0791 |
| Construction industry | 0.0011 | 0.0012 | 0.0029 | 0.0086 | 0.0552 | 0.0033 | 0.0044 | 0.0048 | 0.0046 | 0.0069 |
| Transport and postal services | 0.0194 | 0.0301 | 0.0189 | 0.061 | 0.0526 | 0.1958 | 0.0811 | 0.0374 | 0.031 | 0.0454 |
| Circulation sector | 0.047 | 0.0425 | 0.1139 | 0.0461 | 0.1503 | 0.0872 | 0.0881 | 0.0777 | 0.0735 | 0.0967 |
| Production and living services | 0.0581 | 0.1115 | 0.1442 | 0.1856 | 0.174 | 0.2244 | 0.2791 | 0.2724 | 0.1938 | 0.2049 |
| Science and health services | 0.0011 | 0.003 | 0.003 | 0.0034 | 0.0038 | 0.0041 | 0.005 | 0.0084 | 0.021 | 0.015 |
| Social public services | 0.0005 | 0.0002 | 0.0006 | 0.0003 | 0.0006 | 0.0005 | 0.0006 | 0.0014 | 0.0006 | 0.0148 |
Table 10.
Storm surge disaster loss in various industries in 2007–2017 (unit: million USD).
| Loss of Output in Each Sector | Loss in 2007 | Loss in 2008 | Loss in 2009 | Loss in 2010 | Loss in 2011 | Loss in 2012 | Loss in 2013 | Loss in 2014 | Loss in 2015 | Loss in 2016 | Loss in 2017 | |
|---|---|---|---|---|---|---|---|---|---|---|---|---|
| Direct Economic Loss | 349.86 | 2235.07 | 565.07 | 443.77 | 183.04 | 253.19 | 1075.36 | 875.51 | 416.81 | 134.2 | 776.96 | |
| Agriculture | Agricultural total output loss | 279.88 | 1788.06 | 452.06 | 355.01 | 146.43 | 202.55 | 860.29 | 700.41 | 333.45 | 107.36 | 621.57 |
| Final products of agriculture | 241.38 | 1542.09 | 389.87 | 306.18 | 126.29 | 177.97 | 755.9 | 615.42 | 292.99 | 94.33 | 546.14 | |
| Intermediate loss of agriculture | 38.5 | 245.96 | 62.18 | 48.84 | 20.14 | 24.58 | 104.39 | 84.99 | 40.46 | 13.03 | 75.42 | |
| Associated Industries Sector | Extractive industry | 10.19 | 65.08 | 16.45 | 12.92 | 5.33 | 7.37 | 31.29 | 25.48 | 12.13 | 3.91 | 22.61 |
| Manufacturing industry | 189.37 | 1209.77 | 305.86 | 240.2 | 99.08 | 144.66 | 614.4 | 500.21 | 238.14 | 76.68 | 443.9 | |
| Electricity, gas and water production and supply industry | 16.15 | 103.17 | 26.08 | 20.48 | 8.45 | 11.78 | 50.04 | 40.74 | 19.4 | 6.24 | 36.15 | |
| Construction industry | 0.29 | 1.85 | 0.47 | 0.37 | 0.15 | 0.2 | 0.83 | 0.68 | 0.32 | 0.1 | 0.6 | |
| Transport and postal services | 9.8 | 62.61 | 15.83 | 12.43 | 5.13 | 3.45 | 14.66 | 11.94 | 5.68 | 1.83 | 10.6 | |
| Circulation sector | 6.93 | 44.26 | 11.19 | 8.79 | 3.62 | 8.37 | 35.53 | 28.92 | 13.77 | 4.43 | 25.67 | |
| Production and living services | 22.45 | 143.41 | 36.26 | 28.48 | 11.74 | 10.34 | 43.92 | 35.76 | 17.02 | 5.48 | 31.73 | |
| Science and health services | 0.41 | 2.62 | 0.66 | 0.52 | 0.21 | 0.2 | 0.83 | 0.68 | 0.32 | 0.1 | 0.6 | |
| Social public services | 0.31 | 2 | 0.51 | 0.4 | 0.16 | 0.09 | 0.38 | 0.31 | 0.15 | 0.05 | 0.27 | |
| Total indirect loss | 255.89 | 1634.77 | 413.3 | 324.58 | 133.88 | 186.44 | 791.88 | 644.71 | 306.93 | 98.82 | 572.14 | |
Table 11.
The total output of various sectors in 2017 (unit: USD thousand).
| Sector | Total Output |
|---|---|
| Extractive industry | 2,044,898 |
| Manufacturing industry | 152,542,657 |
| Electricity, gas and water production and supply industry | 10,213,435 |
| Construction industry | 12,687,159 |
| Transport and postal services | 8,846,623 |
| Circulation sector | 16,162,095 |
| Life and production services | 31,167,159 |
| Science and health services | 6,199,826 |
| Social public services | 3,579,014 |
Table 12.
The proportion of total output loss in 2017.
| Sector | Total Output Loss Ratio (%) |
|---|---|
| Extractive industry | 0.110569 |
| Manufacturing industry | 0.029100 |
| Electricity, gas and water production and supply industry | 0.035399 |
| Construction industry | 0.000474 |
| Transport and postal services | 0.011977 |
| Circulation sector | 0.015882 |
| Life and production services | 0.010181 |
| Science and health services | 0.000969 |
| Social public services | 0.000763 |
Table 13.
The excavation industry’s accumulated output loss under different recovery periods.
| Recovery Period/Days | 30 | 60 | 90 | 120 | 180 | 360 |
|---|---|---|---|---|---|---|
| The industrial economic system recovery rate | 0.0307 | 0.0154 | 0.0102 | 0.0077 | 0.0051 | 0.0026 |
| Accumulated output loss value (unit: million USD) | 0.3308 | 0.6624 | 0.9911 | 1.3214 | 1.9821 | 3.9642 |
© 2020 by the authors. Licensee MDPI, Basel, Switzerland. This article is an open access article distributed under the terms and conditions of the Creative Commons Attribution (CC BY) license (http://creativecommons.org/licenses/by/4.0/).
Share and Cite
MDPI and ACS Style
Jin, X.; Sumaila, U.R.; Yin, K. Direct and Indirect Loss Evaluation of Storm Surge Disaster Based on Static and Dynamic Input-Output Models. Sustainability 2020, 12, 7347. https://doi.org/10.3390/su12187347
AMA Style
Jin X, Sumaila UR, Yin K. Direct and Indirect Loss Evaluation of Storm Surge Disaster Based on Static and Dynamic Input-Output Models. Sustainability. 2020; 12(18):7347. https://doi.org/10.3390/su12187347
Chicago/Turabian StyleJin, Xue, U. Rashid Sumaila, and Kedong Yin. 2020. "Direct and Indirect Loss Evaluation of Storm Surge Disaster Based on Static and Dynamic Input-Output Models" Sustainability 12, no. 18: 7347. https://doi.org/10.3390/su12187347
Note that from the first issue of 2016, this journal uses article numbers instead of page numbers. See further details here.