Assessment of the Impact of the Spatial Extent of Land Subsidence and Aquifer System Drainage Induced by Underground Mining


The Department of Mining Surveying and Environmental Engineering, AGH University of Science and Technology, 30-059 Kraków, Poland
*
Author to whom correspondence should be addressed.
Sustainability 2020, 12(19), 7871; https://doi.org/10.3390/su12197871
Submission received: 13 August 2020
/
Revised: 20 September 2020
/
Accepted: 21 September 2020
/
Published: 23 September 2020
(This article belongs to the Special Issue Contributions of Geological Research to Sustainability)
Abstract
:The environmental impact assessment of underground mining usually includes the direct effects of exploitation. These are damage to rock mass and land subsidence. Continuous dewatering of the aquifer system is, however, necessary to carry out underground mining operations. Consequently, the drainage of the aquifer system is observed at a regional scale. The spatial extent of the phenomenon is typically much wider than the direct impact of the exploitation. The research presented was, therefore, aimed at evaluating both the direct and the indirect effects of underground mining. Firstly, the spatial extent of land subsidence was determined based on the Knothe theory. Secondly, underground mining-induced drainage of the aquifers was modeled. The 3D finite-difference hydrogeological model was constructed based on the conventional groundwater flow theory. The values of model hydrogeological parameters were determined based on literature and empirical data. These data were also used for model calibration. Finally, the results of the calculations were compared successfully with the field data. The research results presented indicate that underground mining’s indirect effects cover a much larger area than direct effects. Thus, underground mining requires a broader environmental assessment. Our results can, therefore, pave the way for more efficient management of groundwater considering underground mining.
1. Introduction
The environmental impacts of mining can occur through direct and indirect mining practices at local, regional, and global scales [1]. Impacts can result in erosion [2], sinkholes [3], loss of biodiversity, or soil [4], groundwater [5], and surface water contamination from the chemicals emitted from mining processes [6]. Nevertheless, one of the most significant direct impacts of underground mining is land subsidence, which can cause surface and underground infrastructure damage, and even threat to surface user safety [1,7,8]. The spatial extent of land subsidence and its value depends primarily on the depth of exploitation, the seam thickness, rock mass geomechanical conditions, and post-mining void reclamation method [7]. During recent years, a lot of research has been presented documenting the phenomenon of land subsidence resulting from mining [9,10,11,12,13,14,15]. It can therefore be stated that the spatial extent of land subsidence can cover an area of approximately several km2 [9] to tens of km2 [16], whereas the phenomenon values may vary from a few mm/year [17] to several cm/day [14].
Mining-induced ground movements can be accurately predicted with many geomechanical [18,19,20], stochastic [21,22,23] or, recently, AI (Artificial Intelligence)-based models [24,25,26]. However, the influence function method is one of the most frequently used models applied across the world [21]. Such methods support the effective prediction of ground movements induced by mining without involving much labor and calculation power. The methods enable reliable forecast results to be obtained and, therefore, the spatial extent and value of land subsidence to be successfully determined [21]. Noticeably, the results of such studies are usually the basic (and often the only) element that is taken into consideration in terms of determining the boundaries of mining areas [27,28]. These are the places, on and beneath the land, used or disturbed in activity related to the extraction, removal or recovery of mineral resources form its natural deposits, where the mining corporation is responsible for the occurrence of underground mining negative effects [29,30,31,32,33,34].
However, dewatering of the aquifer system is generally necessary for underground mining operations [7,8]. The groundwater pumping results in a change in the hydraulic conductivity and storage properties of the aquifer. Therefore, a decrease in the hydrostatic pressure and groundwater head at large-scale depression cone is observed. As a result, watercourses and surface reservoirs may vanish and confined aquifer systems may be depleted. The decrease in the groundwater head also results in the compaction of the aquifer. Hence, land subsidence induced by groundwater pumping occurs [16,35,36]. Importantly, the spatial extent of the depression cone is usually much larger than the direct impacts of underground mining. Consequently, the depression cone often extends beyond the limits of the mining areas [37,38]. For this reason, to maintain sustainable mineral resource exploitation, the impact of underground mining on the aquifer system needs to be thoroughly assessed.
Hydrogeological models are built to identify the impacts of groundwater pumping. Based on the models, a change in the groundwater flow direction and the head is calculated [39,40,41,42,43]. The methods currently used mainly involve the conventional theory of groundwater flow implemented through numerical solutions [35]. These allow a considerable diversity of the aquifer system, hydrogeological conditions, and groundwater pumping rate to be considered, varying in time and space. The drainage of the aquifer system, however, has different origins and course, hence numerical methods used to determine the spatio-temporal extent of the depression cone require strict adaptation to the local conditions under which the process occurs [36,44].
Apart from areas of less complicated hydrogeological conditions, where groundwater is pumped from single wells, the issue of groundwater flow in underground mines is a challenging research problem [42,45]. Mining operations disturb the original geomechanical equilibrium of the aquifer system by deforming the rock mass. Analyses have confirmed that such deformations can significantly impact the integrity of the rock mass [46,47,48,49]. The thickness of the damaged and the fractured zone that overlies the post-extraction void can be as much as 50 times the extracted deposit thickness. Importantly, such zone propagation can last from a few days to hundreds of years [7,48]. Development of the crack zone may facilitate the inflow of groundwater into post-mining voids, resulting in the rapid depletion of the overlying aquifers and thus the vanishing of surface watercourses [48,50]. This effect can also result in compressive strains occurrence that implies a reduction in the diameter of the original structural discontinuities of the rock mass. As a result, natural groundwater flow paths change [51].
Accordingly, the significant uncertainty or lack of source data is a major challenge while building hydrogeological models for underground mines [42,52,53,54,55,56]. This problem stems from the limited possibility that hydrogeological conditions can be fully recognized at substantial depths that characterize the rock mass. The specific problem is associated with determining the location of the natural structural discontinuities, e.g., faults or fractures. Even on a regional scale, their presence could impact groundwater flow. Problems may also arise when determining hydrogeological conditions, including storage coefficient and groundwater head, as well as correct simulation of the volume and location of groundwater extraction rates. The development of the rock mass cracking in time also implies significant changes in the horizontal and vertical conductivity of the aquifer system [48]. Much research has revealed that the values of these parameters may even be 100 times different from the initial values as the result of geomechanical changes in the rock mass [39,57,58]. Such large variability in hydraulic conductivity can affect the results of computed groundwater head changes and should be considered in hydrogeological models [59]. Given these requirements, the hydrogeological models of the underground mines are partially based on literature data and the results of previous research carried out at mining sites [60]. Moreover, the hydrogeological parameters of the aquifer systems can be determined, e.g., based on InSAR (Interferometric Synthetic-Aperture Radar; [5,35,61,62,63,64,65]).
Given the increasing importance of issues related to groundwater resources [66] and the environmental impact of underground mining [1], the main objectives of the paper comprise the following:
- To determine the spatio-temporal extent of land subsidence induced by underground mining;
- To model aquifer system drainage resulting from the studied phenomenon;
- To analyze and discuss the conjugated regional-scale impact of underground mining on the environment.
The present research is conducted at a hard coal extraction mine. The mining operation in this area is carried out at a considerable depth of about 1 km, in complex geological and mining conditions, changing over time and space (varying hydrogeological parameters of the rock mass). In the case of aquifer deformation resulting from rock mass drainage induced by underground mining, the advanced numerical groundwater flow models are currently not commonly used. The lack of a uniform algorithm for modeling such deformations and their negative impacts demonstrate the need for continuous optimization and the search for new solutions that will allow more effective management of the indirect effects of mining operations on the aquifer system.
2. Study Area
The research works presented in this paper were carried out at Bogdanka Hard Coal Mine in the eastern part of Poland, approximately 30 km NE from the city of Lublin (Figure 1A). The topography of the study area is relatively flat and gently sloping. The surface morphology was shaped mainly by the fluvioglacial processes associated with the Quaternary glaciations. The altitude ranges from 170 to 191 masl (meters above sea level). The research area is mainly covered by arable fields, forests, and lakes (Figure 1B). The buildings comprise small villages and towns of between 500 and 18,600 inhabitants [67]. The surface and underground infrastructures are relatively poorly developed.
2.1. Regional Geology and Hydrogeology
Rock strata grouped in the Quaternary, Cretaceous, Albian, and Jurassic formations dominate in the analyzed area (Table 1; [68,69]). They constitute a caprock for the extracted Carboniferous coal beds. Its thickness totals 650 m in the eastern part of the research area to monoclonal increase to about 745 m in the west. The hard coal deposit is located in a synclinorium characterized by a flat bottom and asymmetrical system of wings—small dip angles in the NE wing and a steep course in the SW direction. The stratigraphic throw rates of recognized faults are relatively small, i.e., less than 2.6 m (Figure 1C and Figure 2).
Four aquifers can be distinguished in the study area ([69]; Figure 2). There are unconfined Quaternary-Upper Cretaceous and confined Lower Cretaceous-Upper Jurassic, Middle Jurassic, and Carboniferous aquifers. The thickness of these aquifers varies between 2–17 m, 0–3 m, 45–102 m, and 2–9 m, respectively (Table 2). Therefore, the Middle Jurassic aquifer is the dominant one. It is made of loose sands and strongly karstic limestones. The aquifer is completely separated from the roof by a series of practically impermeable carbonate layers of the Upper Jurassic as well as very thick Middle and Lower Cretaceous beds. The thickness of the series in the entire study area exceeds 350 m, to a maximum of 680 m.
There are many backyard wells drilled in the Quaternary-Upper Cretaceous aquifer that provide drinking water for residents in the study area. The other aquifers are not exploited for domestic purposes. However, the groundwater pumped out of the Middle Jurassic aquifer is partly used for technological processes carried out during mining operations. Nevertheless, much of the groundwater extracted from this aquifer is discharged directly into the surface water system.
Pressure in the rock mass caused a fracture zone resulting from a mining operation to disappear completely at a depth of about 300 m [69]. With an increase in depth, a constant decrease in the average hydraulic conductivity of the aquifer system can be observed. As the Jurassic and Cretaceous formations are very thick and are characterized by a very low hydraulic conductivity, they comprise an almost impermeable hydrogeological barrier that hinders the infiltration of groundwater from the nearby surface strata. The Quaternary-Upper Cretaceous aquifer is, therefore, isolated from the confined aquifers. As a result, no groundwater infiltration into the confined aquifer is observed from the Quaternary-Upper Cretaceous aquifer.
2.2. Damage to Rock Mass and Groundwater Extraction
The extraction of hard coal from the Bogdanka mine began in 1982. Hard coal was extracted from panels 2500 m in length and 350 m in width. By 2020, the extraction was concentrated mainly in the central and northwestern portions of the analyzed area. At that time, the mining operation was conducted in the depths of approximately 820 m to 1005 m from a deposit of 1.6 m to 3.5 m thick. In 2020, the area of the exploitation amounted to approximately 51 km2 (Figure 3A). According to Witkowski et al., the total value of the land subsidence resulting directly from hard coal mining was 5.5 m in the years 1982–2013 [70]. The future scenario of mining operations assumes that hard coal mining will also take place in the southern part of the analyzed area by the end of 2030. Mining operations will be conducted in the depths of approximately 900 m to 1000 m from a 1.3 m to 2.9 m thick deposit. The total area of exploitation will, therefore, be approximately 76 km2 in 2030 (Figure 3A).
The groundwater pumping started in June 1976 and is continuously carried out in four drainage wells located in the central part of the mining area (Figure 3A,B). The mine drainage scheme implemented assumes that the boreholes are drilled from the roof of the mining operations and from the shafts to the Middle Jurassic aquifer. These boreholes aim to extract groundwater from the aquifer. It can therefore be inferred that the pumping wells are located directly in the Middle Jurassic aquifer and not at the mine excavation level. As expected, the groundwater from the Jurassic complex flows through the fracture zone to the mine and is drained out of the workings through the shafts. However, the volume of such groundwater is relatively small in comparison to the direct drainage of the Middle Jurassic complex.
Initially, only rock strata were drained near the drilled mine shafts. As the opening-up work progressed and hard coal extraction developed, the aquifer drainage was extended to the mine-induced area and the cracked zones overlying mining panels. The total amount of groundwater pumped out in the years 1976–2016 exceeded 180 million m3 (Figure 4). However, the average inflow of groundwater into the underground mining voids varied over time. In the years 1976–1978, when the shafts were drilled, there was a total of about 2800 m3/day. In the period 1978–1990, when the deposit was intensely cut with the opening-out, the groundwater inflow rapidly increased to about 16,000 m3/day in 1990. In successive years this value has slightly decreased and is now maintained at a constant level of approximately 14,500–16,000 m3/day.
The observation network was established mostly before groundwater pumping to monitor changes in groundwater resulting from aquifer system drainage induced by underground mining exploitation (Figure 3B and Figure 5). It consists of 56 piezometers located in the Lower Cretaceous-Upper Jurassic and Middle Jurassic aquifers. Also, continuous monitoring of the groundwater table in the Quaternary-Upper Cretaceous aquifer is carried out in 34 wells distributed irregularly in the study area. The results of the observations revealed that the Lower Cretaceous-Jurassic and the Middle Jurassic aquifers are continually dewatered (Figure 3B and Figure 5). The Middle Jurassic aquifer, however, is exposed to the most intense drainage. The aquifer is permanently dewatered by mine shafts and boreholes drilled from the mining panels. Before groundwater pumping began, the initial groundwater head in the Lower Cretaceous-Upper Jurassic and Middle Jurassic aquifers varied between 140–170 masl and 130–150 masl, respectively [69]. The observed decrease in the Middle Jurassic aquifer reached a maximum of about 550 m, leading to a significant drop in the hydrostatic pressure. The depression cone has an irregular shape due to the geological configuration of the rock mass (see Section 2.1). It assumed the form of a large dewatering cone, extending 7.5 km southwest to approximately 20 km to the northeast of the drainage center (Figure 3B). In the Lower Cretaceous-Upper Jurassic aquifer, a relati
ely small decrease (up to 30 m) in the groundwater head is observed only in the mine shaft drainage center. This is the result of a rapid flow of quicksand into underground mine voids at the initial stage of the mining operation. The data on the change in the groundwater head in the Carboniferous aquifer are fragmentary, therefore the spatial extent and the value of the depression cone in this aquifer are only assumed.
3. Assessment of the Environmental Impact of Underground Mining
The methodology of the research presented consisted of three stages. The spatial extent of land subsidence resulting from underground mining was determined in the first part of the research work (Section 3.1). The maximum supposed spatial extent of the depression cone in the Middle Jurassic aquifer was calculated in the second part of the research work (Section 3.2). Subsequently, the computed spatial extent of the depression cone was used to determine the boundaries of the hydrogeological model. Finally, groundwater head change modeling in the Middle Jurassic aquifer was carried out in the third, main part of the research (Section 4).
Calculations of the spatial extent of the land subsidence were made for the period from the beginning of the mining operation, i.e., 1982 to 2030, as the exploitation is already planned for the next 10 years to be carried out. The maximum supposed spatial extent of depression cone in the Middle Jurassic aquifer was therefore also determined for the year 2030. Given the above, the numerical modeling of the changes in the groundwater head for the period 1975–2020 was carried out. Based on the calibrated model, the prediction of the groundwater head in the aquifer in the years 2020–2030 was also made.
3.1. Determination of the Spatial Extent of Land Subsidence
The determination of the spatial extent of land subsidence induced by underground hard coal exploitation was carried out with the use of the stochastic model based on the Knothe influence function [21,71,72]. Models based on influence function use a limited number of parameters. Therefore, these methods can serve as a comprehensive tool, especially when describing phenomena that require a significant degree of parameterization [73]. Many studies have shown that the application of influence function-based methods might indicate similar accuracy in predicting the spatial extent and values of land subsidence as the results of numerical modeling based on the most commonly used theoretical models [74].
The model based on the Knothe influence function is based on the division of the geological structure into elementary cuboids, i.e., reservoir elements [22]. In such models, the exploitation of the elementary cuboids and the horizontal plane generates the elementary subsidence at point A, expressed in the following Equation (1):
where is the elementary subsidence at point A; is the influence function; are the horizontal coordinates of point A and is the elementary area of the reservoir element.
Implementing the principle of superposition, it has been assumed that the subsidence at point A is the sum of the elementary subsidence derived from all the elementary volumes in the area of Exploitation (2):
where is the subsidence at point A.
Assuming the limited range of influence of the exploitation and introducing of the parameter , the generalized influence function in Knothe model has the form of Equation (3):
where is the maximum subsidence and is the radius of the influence range, which take the form of Equation (4):
where is the depth of exploitation and is the parameter corresponding to geomechanical properties of the rock mass.
The spatial extent of land subsidence in the hard coal mine of Bogdanka was calculated based on Equation (4). To assess the past impact of the mining operations, as well as predict the future exploitation scenario, the calculations were carried out between 1982 and 2030. The depth of the exploitation values was obtained from the geodetic measurements carried out and made available by the Mining and Surveying Department of the mine. Due to the inability to conduct field research and to obtain information on geomechanical rock mass parameters in the study area, the value of the parameter was obtained based on research conducted by [38,70]. It was set to 1.6.
3.2. Estimation of the Supposed Spatial Extent of the Depression Cone
The radius of influence is defined as the maximum distance at which groundwater drawdown can be detected with the usual field measuring devices. The size of the depression cone is influenced by the hydrogeological conditions of the aquifer system, the volume of the pumped groundwater, and the pumping time. Although the spatial extent of the depression cone is currently determined primarily based on numerical modeling, to quickly estimate its spatial extent, simple empirical formulas can be used [75].
In the research presented, the supposed spatial extent of the depression cone in the Middle Jurassic aquifer was determined with the use of empirical Weber Equation (5):
where is the thickness of the confined aquifer; is the hydraulic conductivity; is time; and is the porosity.
The values of the parameters used in the calculations were determined based on field measurements carried out by the Mine and Surveying Department of the Bogdanka hard coal mine as well as literature data [69].
4. Modeling of Aquifer System Dewatering
4.1. Mathematical Model
Groundwater flow in a porous medium is governed by two laws: the conservation of mass and the conservation of momentum [75,76]. These laws are expressed in two basic physical quantities: the hydraulic head (6):
where is the hydrostatic pressure at a point with the coordinates ; is the density of the water and is the gravity acceleration; and the specific discharge, defined as the volume of groundwater flowing in 1 s through 1 m2 of the surface perpendicular to the direction of flow. It takes the form of Equation (7):
where is the specific discharge in the coordinates direction.
Specific discharge is directly related to the superficial flow velocity (8):
The law of conversation of groundwater mass in a porous medium expresses the continuity equation. It can take the form of Equation (9):
The left side of Equation (9) represents the rate of accumulation of groundwater per unit volume of the porous medium, whereas the right-hand side of this equation expresses the excess volume of groundwater flowing into the porous medium per unit of time concerning the unit volume of the porous medium. Noticeably, the accumulation of groundwater in a saturated 3D porous medium is always associated with an increase in hydrostatic pressure. Empirically, the change in hydrostatic pressure induced by groundwater accumulation was found to be proportional to the rate of groundwater accumulation per unit volume of the porous medium [76,77]. It is expressed in Equation (10):
where is the specific storage.
If the water density is constant, the 3D groundwater flow continuity equation most often assumes the following form (11):
The law of conservation of momentum of groundwater in the porous medium takes the form of Darcy law. According to this law, there is a linear relationship at each point in the space between the specific discharge and the force moving the groundwater to flow per unit volume of the medium. The Darcy law has the form (12):
where is the permeability of a medium and is the dynamic viscosity of water.
If the water density is constant, the right-hand side of the Equation (12) can be expressed by the hydraulic head. Thus, the Darcy law takes a simple and most commonly used form of Equation (13):
where is the hydraulic conductivity expressed in the Equation (14):
The equation describing the transient 3-D flow in a saturated porous medium can be derived by substituting the Darcy law for the continuity Equation (15):
The groundwater flow equation in the 3D saturated porous medium is, therefore, expressed in the form of (16):
The determination of the solution of Equation (16) is the starting point for all quantitative and qualitative analyses of hydrogeological changes, in particular those considered to be man-made induced impacts on the aquifer system. The dependence of the hydraulic conductivity on the spatial coordinates in Equation (16) enables this parameter to be differentiated in aquifers. The groundwater flow equation can, therefore, be applied successfully to heterogeneous aquifers.
In general, it is not possible to find an unequivocal solution to Equation (16). For this reason, approximate methods are used to solve the groundwater flow equation. The necessary and sufficient condition of the . solution is that it simultaneously meets the following conditions:
- Initial conditions characterizing the spatial variation of the hydraulic head within the entire groundwater flow area at a time using known, assumed, or estimated function;
- Boundary conditions describing the variation in the time of the hydraulic head or its derivative on all segments of the edge of the groundwater flow area .
The groundwater flow in the specific discharge is defined by differential equations using continuous variables. To build a numerical model, these equations must be transformed into a discreet form [78,79]. The discreet form of equations means that their approximate solutions are determined only at discrete points in space and at discrete moments in time.
In the research presented, the solution of the groundwater flow equation was carried out using the finite difference method. It is based on the approximation of the derivatives in the groundwater flow equation employing the differential quotients of the values of the desired function in the nodes of the discretization grid. For the first and second derivatives of function concerning , the simplest discrete approximation has the form of Equations (17) and (18), respectively:
where are the desired values of the function in the discreet nodes of the discretization grid.
Replacing derivatives with difference quotients (17) and (18) leads to a system of algebraic equations for unknowns , where is the number of discretization nodes. Usually, the values of the sought function are defined in the mesh nodes and the parameters in the respective equations are defined in the spaces between the nodes. An approximate solution is obtained by solving algebraic equations with unknown for discreet moments in time. An appropriate discreet scheme for variable enables the transition from solutions obtained for a certain time to solutions for a subsequent time. As a result, the spatial-temporal characteristics of the approximate solution are achieved. If approximate solutions meet the desired accuracy criteria, the results obtained can be the basis for hydrogeological analysis.
4.2. Numerical Modeling
IMOD software, the OpenSource GUI version of MODFLOW [79], was used to simulate the change in the groundwater head in the study area [81]. IMOD is a simulation system that models groundwater flow with rapid, flexible, and consistent sub-domain modeling techniques that implement the modular 3D finite-difference groundwater models MODFLOW 2005 and MODFLOW 6 of the U.S. Geological Survey. Application of MODFLOW to the description and prediction of the hydrogeological conditions of the aquifer systems has increased significantly and covers various types of research problems that have occurred worldwide [5,41,42,82,83,84,85,86,87,88].
4.2.1. Numerical Representation of the Aquifer System
- Model Conceptualization
The construction of a numerical hydrogeological model that would allow the assessment of the past and current impact, as well as predict future changes in the aquifer system in the conditions of underground hard coal mining, required many simplifications, reflecting the existing hydrogeological conditions. These simplifications are the result of the lack of sufficient recognition of the hydrogeological conditions and the complexity of these conditions, as well as the lack of need for their accurate mapping due to the modeling objectives assumed.
The hydrogeological conceptualization assumed the following: the Quaternary-Upper Cretaceous aquifer is completely isolated from the underlying aquifers by a thick series of almost impermeable Cretaceous strata; mining-induced drainage includes Lower Cretaceous-Upper Jurassic, Middle Jurassic, and Carboniferous aquifers; the main aquifer undergoing mining-induced drainage is the Middle Jurassic aquifer. Due to the low thickness of the Lower Cretaceous-Upper Jurassic and Carboniferous aquifers (see Table 1 and Figure 3), the inflow of groundwater into the mine voids from these aquifers was considered to be insignificant and therefore negligible; the crack zone occurred in the area of mining operations. Due to the presence and spatial propagation of the zone, the infiltration of groundwater from the Middle Jurassic and the Lower Cretaceous-Upper Jurassic aquifers increased; there is a direct hydraulic conductivity between the Lower Cretaceous-Upper Jurassic and the Middle Jurassic aquifers at the bottom of the Lower Cretaceous-Upper Jurassic aquifer, the Namurian complex outcrops and the crack zone over the hard coal mining area.
Given the foregoing, the following hydrogeological scheme for the research area was implemented: it was decided to map the Lower Cretaceous-Upper Jurassic and the Middle Jurassic aquifers as one groundwater complex; due to the hydrogeological complexity of the Quaternary-Upper Cretaceous aquifer, its isolation from the underlying aquifers and, therefore, no impact of mine-induced drainage on that aquifer, the Quaternary-Upper Cretaceous aquifer was not modeled in the research presented; regional groundwater inflow into the Jurassic aquifer was assumed to be not fully recognized due to a lack of empirical data; the surface water infiltration was mapped by the recharge of the top of the Cretaceous aquitard.
- Model Area and Finite Element Mesh
The model consisted of three layers: Cretaceous aquitard at the top (aquitard 1), Jurassic aquifer at the middle (aquifer 1), and Carboniferous aquitard at the bottom (aquifer 3; Figure 6). The model boundaries were determined based on the supposed maximum spatial extent of the depression cone in the Middle Jurassic aquifer in 2030 (see Section 3, Figure 7). Consequently, the impact of mining-induced drainage did not influence the model boundaries. The model covered the entire mining area, whereas all three layers covered the entire modeling area. The model was of regular shape with a dimension of 60 km by 60 km. It covered an area of 3600 km2 and was divided into a regular mesh of 240 rows and 240 columns. The size of the cell was 250 m by 250 m, whereas the total number of cells was 57,600.
- Geological and Initial Groundwater Head Input Data
The elevation data of the top and the bottom of model layers were determined based on the results of laboratory tests of the geological cores carried out by the Polish Geological Institute-National Research Institute. They were obtained from 532 geological profiles which were distributed almost-regularly across the entire study area (Figure 1). Elevation maps of the model layers were generated by kriging interpolation. Due to the low value of Carboniferous stratigraphic throws (Figure 1), they were not included in the interpolation. Simultaneously, the initial groundwater head in aquifer 1 was obtained by interpolating the observational data from 41 piezometers located in the Middle Jurassic aquifer (see Figure 3 for the location of piezometers) and literature data [69] with the use of kriging.
- Boundary Conditions
The Dirichlet boundary conditions for the aquifer 1 were assumed. Thus, groundwater was simulated as moving in or out of the aquifer at a rate sufficient to maintain the specified head. It was assumed that the values of the groundwater head in the aquifer beyond the depression cone are constant and correspond to the initial values.
Mining-induced drainage of the aquifer system was modeled by setting four drainage wells in aquifer 1. The volume of pumped groundwater was determined based on data provided by the Mine and Surveying Department of the Bogdanka hard coal mine (see Section 2.2 and Figure 4). Due to data scarcity describing the volume of groundwater pumped after 2016, a constant drainage value of 15,000 m3/day was assumed in 2017–2030. The extraction values of the individual wells were calculated by comparing the total volume of water pumped out of the rock mass with the values of the depression cone in the Middle Jurassic aquifer at a given time.
According to the assumed conceptualization scheme, the infiltration of surface water at the top of aquitard 1 was assumed. The rate of the infiltration was assumed based on the literature data provided by Bocheńska et al. [69] and estimated as a single value of approximately 1.4 mm/year. The bottom of aquitard 2 is the impermeable bedrock. Hence, it was regarded as the no-flow boundary. Therefore, the boundaries of the layer were treated as Dirichlet boundary.
- Hydraulic Parameters
The hydraulic properties of the model layers were determined by horizontal hydraulic conductivity , vertical horizontal conductivity , and storage coefficient .
According to the literature data, several zones with different horizontal hydraulic conductivity values were distinguished for aquifer 1 and aquitard 2 ([69]; Figure 7). Due to the determination of these parameters only in parts of the model (hard coal deposits), the data were extrapolated to all blocks of layers 2 and 3 using the kriging method. For aquitard 1, due to data scarcity, a single horizontal hydraulic conductivity value was assigned. The values of the vertical hydraulic conductivity of all model layers were estimated as 1–2 orders of magnitude smaller than the values of the horizontal hydraulic conductivity [75].
The storage coefficient of aquifer 1 was estimated by comparing the volume of groundwater pumped from the Middle Jurassic aquifer with the observed values of the depression cone (19):
where is the volume of groundwater released from storage; is the unit drop in the groundwater head; and is the unit area of the hydrostratigraphic unit.
The storage coefficient of aquitards 1 and 2 was estimated based on literature data using Equation (20):
where is the thickness of the hydrostratigraphic unit; is the vertical skeletal compressibility; and is the compressibility of water.
4.2.2. Model Calibration, Verification, and Future Scenario
Model calibration and validation were achieved using a manual test-and-error procedure by matching the observed groundwater head with the simulated values to determine the set of best-fit parameters. The hydraulic head was fitted by varying horizontal and vertical hydraulic conductivity and storage coefficient. The calibration of each model should first set a target with an acceptable error. The range of the error depends mainly on the purpose of the model. During calibration, the user should focus on parameters that have been determined with less accuracy or are assumed and only slightly modify those parameters that are more certain. Most other parameters are less sensitive and need only be changed within a specific realistic range [89]. Therefore, during the calibration of the model presented, we tried to distinguish mostly the parameters assigned to aquitard 1 and 3. These layers were relatively poorly recognized.
Firstly, the model was calibrated under unsteady conditions. Such calibration typically involves groundwater heads recorded in piezometers during long-term aquifer dewatering. Storage properties of the aquifer are critical for transient calibration. For this purpose, the groundwater head data recorded in 30 piezometers located in the Middle Jurassic aquifer were used from January 1976 to January 1995. This interval was divided into 20 time steps with a length of 1 year. The groundwater head estimated for the period before groundwater pumping and hard coal mining started was used as the initial condition. Numerous executions of the model were carried out to obtain optimal hydrogeological parameters values (approximately 170 executions). There was a good agreement between the observed and the calculated groundwater heads. The final values of the hydromechanical parameters selected for the model layer simulation are summarized in Table 3.
Secondly, the model was verified for the period from January 1995 to January 2020. Therefore, for model validation, 26 time steps were used and each time step covered one year. The groundwater head, estimated for January 1995 during the calibration process, was used as the initial condition. Similarly, the groundwater heads observed in 34 piezometers in the Middle Jurassic aquifer were used for model verification. The calculated and observed groundwater heads in piezometers showed similar trends in general, and the calculated heads were mostly consistent with the observed data. However, a quantification of the model error for the different statistical parameters was carried out. These include the root mean square error (RMSE) and the determination coefficient (R2; [90,91]). The results of the study were RMSE = 0.59 and R2 = 0.64. Due to data scarcity and complex hydrogeological conditions, the accuracy of the model was not very high. These values were, however, assumed to be acceptable and reliable [91].
To illustrate the results of the model calibration and validation, two piezometers were selected for which quasi-continuous groundwater head data were available. These piezometers were located near the drainage center and in the outlying area of the depression cone (see Figure 3 for piezometer location). The time-series presented show acceptable agreement between the modeling results and the empirical data (Figure 8). The absolute values of the difference between observed and modeled values did not exceed 4.3 and 5.1 m for J/5451 and J/5443 piezometers in the period 1976–1995 and 5.8 m and 7.2 m in the period 1995–2000, respectively.
Based on the calibrated and verified model, a prediction of a decrease in the groundwater head in the Middle Jurassic aquifer was made. It was carried out for the year 2030. Due to the central location of the hard coal mining area in successive years concerning the drainage center and the model boundaries, the model conditions were assumed to be the same as during the calibration and validation period. The initial conditions for the calculations were the results of the model validation obtained for January 2020.
5. Results and Discussion
5.1. Spatio-Temporal Extent of Land Subsidence Induced by Underground Mining
The calculated values of the radius of the influence range, based on the Knothe theory, varied between 521 and 625 m, which is related to the variable depth at which hard coal is exploited. The total area of direct effects of underground mining in the study area was therefore approximately 16, 33, 53, and 82 km2, respectively, in 1990, 2000, 2010, and 2020 (Figure 9A–D). The expected spatial extent of land subsidence will reach approximately 86 km2 in 2030 (Figure 9E). The spatial extent of the land subsidence resulting from mining in the successive years is consistent with the current boundaries of the mining area. This indicates that the direct effects of mining activities are restricted only to the immediate vicinity of mining shafts and mining panels. This is consistent with theories explaining land surface movements as a result of underground mining [7].
Due to the lack of access to more detailed data, computation of land subsidence resulting directly from mining activities was not introduced in the article presented. However, based on the precision leveling data provided by the Mine and Surveying Department and the study of such measurement data carried out by Witkowski et al. [92], it can be stated that the total value of the land subsidence resulting from hard coal mining was 5.5 m in the years 1982–2013. Based on this work, it can be concluded that land subsidence has occurred within the limits of the current mining area. It should be noted that this area is of agricultural use mostly (Figure 9F). It is covered by a dense network of farmland, meadows, pastures, and forests. This area covers a few small villages with a population of not more than a few hundred inhabitants. The only town—Puchaczów—is located on the border of the mining area. The mining area includes over a dozen industrial buildings, as well as an industrial railroad used for the transport of hard coal.
Although the land subsidence values determined by Witkowski et al. are significant, owing to the relatively large area and the long period in which they were observed, no discontinuous deformations and substantial compressive or tensile strains occurred in the study area. For this reason, due to the direct effects of hard coal mining, no significant threat to the surface infrastructure is expected. It should be noted, however, that the observed land subsidence caused a slight change in the watercourse profiles. However, this is related also to the extremely low land nature of the analyzed area. As a result, the local marshes occurred. These changes have been continually remedied by the mining entrepreneur. Nevertheless, owing to the further progress of the planned mining operation in the south-east by 2030, similar issues are expected to occur in the area under analysis.
It should be noted that the spatial extent of the land subsidence determined in subsequent years includes the mining shaft area (Figure 9A–E). However, mining shafts are highly sensitive to the impacts of mining operations and are therefore subject to special protection. This protection shall be implemented by the establishment of the pillars of protection. The protection pillar is a rock mass area where mining is not expected to have any impact that could adversely affect the geomechanical stability of the construction site. Therefore, the protective pillars are established as a rock mass where no mining is carried out. Due to the lack of access to information on the established mining pillars, we have not been able to include this issue in our research. The results obtained are, therefore, partially incorrect. This should be taken into account when the calculations are carried out in the case of an occurrence in the analyzed area of a building which is particularly sensitive to mining damage and therefore intended to be protected.
5.2. Aquifer System Drainage Resulting from Underground Mining
The results of the numerical modeling carried out in the study presented indicate that the Middle Jurassic Aquifer was heavily drained between 1976 and 2020 (Figure 8 and Figure 10A). The maximum decrease in the groundwater head was observed at the drainage center and was 604 m. The depression cone has been developing most intensively in the north-east and south-east direction. As a result, a large drainage center related to drainage shafts was identified in 2020. The groundwater head in this area was approximately 400 mbsl. The spatial extent of the depression cone is approximately 8 km to the south-west, 16 km to the north-east, 11 km to the north-west, and 14 km south-east of the drainage center. The depression cone covers an area of around 548 km2 in 2020.
To present the dynamics of the development of the depression cone in the Middle Jurassic aquifer, two piezometers were selected. In point J/5443, it can be noted that the greatest decrease in the groundwater head was observed only during the initial calculation period, in the years 1975–1995, and amounted to 230 m (Figure 8A). From 1995 to 2020, the time series of the groundwater head showed a slighter decrease in the piezometric level. Such dynamics indicate practically complete depletion of the Middle Jurassic aquifer in the drainage center in 2020, i.e., approximately 45 years after the groundwater extraction began. The analysis of changes in the groundwater head in the J/5451 piezometer showed that the depression cone in this area had been developing intensively in the first years of the mining exploitation (Figure 8B). The piezometric level decreased by 72 m between 1975 and 1995. In the period 1995–2020, the dynamics of the decrease in the groundwater head were much lower.
Based on the modeling results, it can be concluded that the development of the depression cone has a strong time-based relationship with the exploitation of hard coal and, to a limited extent, with the geological structure of the deposit. In the area of the damage of rock layers caused by mining operations characterized by the highest hydraulic conductivity, the decrease in the groundwater head was the greatest (compare Figure 7 and Figure 10). Furthermore, the cone of depression is characterized by a certain asymmetry. It is most likely related to the synclinical geological structure of the hard coal deposit and higher hydraulic conductivity in the Middle Jurassic aquifer to the north and north-east from the drainage center. However, the asymmetry of the depression cone can also arise from regional groundwater flow, which is not completely recognised due to lack of data. The depression cone observed in 2020 and the geological structure of the study area suggest that the regional groundwater flow could be from the south-east to the north-west. However, this direction of water flow may be greatly influenced by the drainage of the main aquifer. Nonetheless, there are no comprehensive empirical data that could support the claim. Therefore, further research is needed to determine the impact of underground mining operations on the groundwater flow direction.
The results of the model prediction indicate that the depression cone will continue to develop along with the progress of hard coal mining in the years to come (Figure 8 and Figure 10B). The maximum decrease in the groundwater head will be 644 m in 2030 in the area of drainage center. The depression cone will extend approximately 15 km north, 20 km north-east, and 12 km south of the drainage center. The total area of the depression cone will cover around 756 km2 in 2030. It will, therefore, be about 208 km2 greater than in 2020. The depression cone predicted for 2030 would be similar in shape to the currently observed decrease in the groundwater head in the Middle Jurassic aquifer.
5.3. Analysis and Discussion of the Conjugated Regional-Scale Impact of Underground Mining on the Environment
The spatial extent of the direct effects of underground coal mining is much less than the depression cone (see Figure 9 and Figure 10C). In 2020, the area of the depression cone in the Middle Jurassic aquifer is about 6.7 times larger than the spatial extent of the land subsidence directly related to the mining operation. This factor will amount to approximately 8.8 in 2030. Significant land subsidence has occurred within the boundaries of the current mining area, resulting directly from the exploitation of hard coal and the formation of a post-mining void in the rock mass. However, the depression cone in the Middle Jurassic aquifer caused a substantial drop in hydrostatic pressure and is therefore probably related to the progressive drainage-induced compaction of the aquifer system. Although the mine-induced drainage does not affect the surface water and the Quaternary-Upper Cretaceous aquifer, the underlying aquifers have been intensively dewatered. The decrease in the groundwater head modeled for the years 2020 and 2030 is the greatest near the drainage center (Figure 11 and Figure 12).
Based on the research presented, it can be concluded that the area of approximately 2.3 km2 near the mine shafts was significantly drained by 2020 (Figure 11A and Figure 12). In this region, the groundwater in the Middle Jurassic aquifer was up to 24 m below the top surface of the aquifer. The thickness of the aquifer in the area is approximately 123 m. It is therefore expected that the depression cone center will be further drained in the years to come as mining works progress. In 2030, the modeled groundwater head will be 482 mbsl, i.e., 66 m below the upper surface of the Middle Jurassic aquifer (Figure 11B and Figure 12). The total spatial extent of the groundwater head, which is less than the upper surface of the Middle Jurassic aquifer, will be approximately 5.6 km2.
As a result of such a significant drop in the groundwater level of the Middle Jurassic aquifer, part of the drainage center area has been completely drained. Subsequently, it should be assumed that the rock mass could be disintegrated. This phenomenon is associated with irreversible aquifer system compaction. It should be noted, however, that the overall size of this area is relatively small (Figure 11 and Figure 12).
A number of studies have shown that most of the developed groundwater basins are subject to inelastic deformation that occurs over the years (elastic deformation is usually seasonal) [93,94,95,96]. This is due to over-extraction of groundwater. Reducing hydrostatic pressure in the pores and cracks of the aquifer system is inevitably accompanied by some deformation of the aquifer system. Almost all permanent subsidence is due to irreversible consolidation during the generally slow process of aquifer drainage [97]. The relationship between changes in ground-water heads and compaction of the aquifer system is based on the principle of effective stress proposed by Terzaghi [98]. Under this theory, when the support provided by the fluid pressure is reduced, such as when groundwater is lowered, the support previously provided by the hydrostatic pressure is transferred to the skeleton of the aquifer system which compresses to a certain degree. The maximum level of past stress of the skeletal of the aquifer is referred to as pre-consolidation stress. When the load on the aquitard skeleton exceeds the pre-consolidation stress, the aquitard skeleton may undergo major, permanent rearrangement, resulting in irreversible compaction. As drainage-induced compaction of the susceptible aquifer was not a key point of the article presented, for a more detailed discussion of the issue please refer to [16,35,36].
There has also been a decline in the groundwater head beyond the existing mining area. Therefore, land subsidence caused by aquifer drainage can also be assumed to occur in the entire analyzed region. This has been shown by the research carried out by Witkowski et al. [38], who predicted surface deformations due to groundwater extraction in the Bogdanka hard coal mine using a stochastic model. Based on the findings of this study, the maximum value of vertical displacement in the study area reached 0.56 m in the years 1976–2013. Nevertheless, the estimated value of the land subsidence resulting from the main aquifer drainage in the study area is not known in the following years.
It should be noted, however, that although the expected land subsidence values resulting from the drainage of the Middle Jurassic aquifer are much smaller than the land subsidence directly linked to hard coal mining, the spatial extent of the aquifer drainage is much wider. Therefore, it can also have a much wider effect on the environment. It should be noted that, under Polish law, the mining contractor is responsible for the negative effects of mining activities only in the mining area. Given that the decrease in the groundwater head extends significantly outside the mining area, it would be advisable to carry out more comprehensive research that would confirm and accurately determine the values of the drainage-induced land subsidence, especially outside the mining area established based on the direct impacts of mining workings.
Owing to the lack of hydraulic connections between the Lower Quaternary-Upper Createcous aquifer and the underlying aquifers, the drainage of the Middle Jurassic aquifer would not affect the depletion of the surface watercourses. However, due to the minor variations in land elevation (see Section 2), the drainage-induced land subsidence, which may occur outside the mining area, could in the years to come interrupt the surface runoff of the watercourses and alter the lake boundary. Noticeably, the depression cone modeled for 2020 and 2030 covers many protected areas (Figure 12). These include ‘Poleski’ National Park and three landscape parks: ‘Poleski’, ‘Nadwieprzański’, and ‘Pojezierze Łęczyńskie’. The ecosystems which dominate the landscape of the parks comprise swamps and peat-bogs. Such ecosystems are considered very delicate and can easily be influenced by outside factors. Nonetheless, there is no threat of draining water from protected areas due to the complete lack of hydraulic connections between the Middle Jurassic aquifer and surface water. However, the drainage-induced compaction of the aquifer system can lead to an increase of floodplains in protected areas, thereby enriching the local ecosystem [99]. Nevertheless, it is advisable to carry out more comprehensive research in the field of assessing the overall effect of rock mass drainage and the aquifer system compaction on the natural environment, including the land surface.
6. Concluding Remarks
Underground mining results in major and long-term changes in the conditions of the water environment. These changes could also be irreversible. It is therefore important to properly predict the impact of mining operations on the aquifer system through model tests to mitigate damage to that ecosystem, improve rock mass drainage processes, and reduce groundwater-related hazards. Reliable representation of processes taking place in aquifers involves the selection of appropriate tools to allow accurate mapping of several complex processes, rapid integration with other numerical models, and adaptation of the software to individual needs. As a result, a comprehensive assessment of the environmental impact of underground mining is a complex research issue. It requires the identification of the direct and indirect effects of mining operations. These primarily include land subsidence and aquifer system drainage.
Many methods may be used to determine the spatial extent of land subsidence. The function of influence-based method is most frequently used. This method allows for obtaining satisfactory results of such calculations. Besides this, due to low parametrization, this method is relatively easy to implement. However, the modeling of groundwater head changes in underground mines remains a challenge. The main problems associated with the construction of hydrogeological models are linked to the determination at the considerable depth of the hydrogeological parameters of the aquifer system. The presence of structural discontinuities, rock strata dips, or local thickness fluctuations has a significant impact on groundwater flow. For this reason, the authors searched for methods that would optimize the modeling of the phenomenon being studied.
Our process-based approach, using the estimation of the spatial extent of land subsidence resulting from underground mining as well as the spatial extent and values of the depression cone in the Middle Jurassic aquifer, has enabled us to compare the direct and indirect effects of underground mining on the regional environment. This is an important step towards a thorough recognition of the combined effects of underground mining. The approach also facilitates the analysis of the dynamics of the groundwater head decrease in the Middle Jurassic aquifer and the corresponding development of the mining operations. The local hydrogeological model was built based on the integration of qualitative and quantitative data from different sources.
As mining continues to develop in the study area, groundwater exploitation is likely to continue in the coming decades. The results of the model calibration and forecasting of the groundwater head in the Middle Jurassic aquifer could be considered to be acceptable and at least consistent with the empirical data. Predicted values of the depression cone formed as a result of the post-mining drainage assumed the shape of a large dewatering trough. This was consistent with the expected decrease in the groundwater head in the area during the analysis period. Our modeling results indicate that the hydrogeological system has been transformed from undisturbed to human-impacted aquifer depletion due to an increase in groundwater extraction over the past almost 45 years. Depletion of the aquifer system has exceeded the limits of the mining area. Although the values of the drainage-induced land subsidence are generally much lower than the direct impact of mining operations, the spatial extent of the aquifer depletion may influence the aquifer system far away from the drainage center and the mining area.
However, there are also significant limitations to the approach presented. The obtained depression cone values may show very good congruence with the empirical data, as the study area was well recognized geologically. Detailed altitude maps of geological strata were generated based on a wide range of data. It should also be noted that the degree of reliability of the model calibration and the accuracy of the forecast analysis should be spatially diversified. The results of the research have the highest level of certainty close to the observation points. Notably, the hydrogeological model was parameterized based on unknown groundwater flow direction values and partly based on literature data not directly describing local hydrogeological conditions. However, the reliability of the results of the calculation can be fully determined based on the analysis of changes in the groundwater head, accurate analyses, and uncertainty assessments. Where sufficient hydrological and geological data are available, this modeling approach can be applied to other underground mining areas worldwide facing local and regional impacts of groundwater-related environmental impacts.
The results of the research presented contribute to a more reliable environmental impact assessment of the underground hard coal mining. They point out that the environmental impact is much wider than the direct land subsidence. Research results clearly show that the depression cone extends considerably beyond the mining area. The combined spatial scale of land subsidence and aquifer dewatering should therefore be included in a comprehensive analysis of the impact of underground mining on the environment. The 3D numerical model presented in this study has the potential to provide highly relevant predictions of the mining-induced drainage of the aquifer system to be computed. This type of analysis can be used to understand the regional-scale processes that occur in the aquifer system due to mine-induced drainage. It should be noted that the recognition of hydrogeological phenomena and their dependence on the local characteristics of the aquifer is a prerogative of proper assessment of the effects of hydrogeological hazards, rational planning of mineral extraction, and protection in underground mining areas.
With future research in mind, it is worth paying attention to the difficulties associated with distinguishing land subsidence caused directly by mining from drainage-induced land subsidence. This problem concerns, in particular, the areas above exploitation, near post-mining voids, where these influences overlap. In the case of drainage-induced land subsidence, InSAR and GRACE (Gravity Recovery and Climate Experiment) seem to be useful tools for detecting this type of phenomenon. They have been successfully used to determine the full spatial extent of the direct and indirect environmental effects groundwater pumping in many parts of the world. However, further research is still needed to better implement such measurement techniques in terms of deep, underground mining.
Author Contributions
Conceptualization, A.G.; methodology, A.G.; formal analysis, A.G.; investigation, A.G.; data curation, A.G.; writing—original draft preparation, A.G.; writing—review and editing, A.G.; visualization, A.G.; supervision, A.A.M.; project administration, A.G.; funding acquisition, A.G. and A.A.M. All authors have read and agreed to the published version of the manuscript.
Funding
The presented investigation is part of the research project “Modeling of land surface movements due to rock mass drainage” funded by the National Science Center in Poland, PRELUDIUM-17 Grant No. 2019/33/N/ST10/00724.
Acknowledgments
We wish to thank the Mine and Surveying Department of the Bogdanka hard coal mine as well as the Polish Geological Institute-National Research Institute for access to mining, geological, and hydrogeological data. We would also like to thank John Lambert and Hans van Meerten of the Department of Geotechnical Engineering of Deltares, Delft, The Netherlands, for their kindness, hospitality, substantial support and inspiration at the literature review stage and numerical research using IMOD software during the research internship in The Netherlands. Finally, we thank the anonymous reviewers who thoroughly revised the manuscript and therefore substantially helped to improve the quality of the original research paper. This work is a contribution to the UNESCO Land Subsidence International Initiative (LaSII; www.landsubsidence-unesco.org) and is listed on the following webpage: www.landsubsidence-unesco.org/publications/.
Conflicts of Interest
The authors declare no conflict of interest. The funders had no role in the design of the study; in the collection, analyses, or interpretation of data; in the writing of the manuscript; or in the decision to publish the results.
References
- Jain, R.K.; Cui, Z.; Domen, J.K. Environmental Impact of Mining and Mineral Processing: Management, Monitoring, and Auditing Strategies; Butterworth-Heinemann: Oxford, UK, 2015. [Google Scholar] [CrossRef]
- Jarsjö, J.; Chalov, S.R.; Pietroń, J.; Alekseenko, A.V.; Thorslund, J. Patterns of Soil Contamination, Erosion and River Loading of Metals in a Gold Mining Region of Northern Mongolia. Reg. Environ. Chang. 2017, 17, 1991–2005. [Google Scholar] [CrossRef]
- Malinowska, A.A.; Witkowski, W.T.; Hejmanowski, R.; Chang, L.; van Leijen, F.J.; Hanssen, R.F. Sinkhole Occurrence Monitoring over Shallow Abandoned Coal Mines with Satellite-Based Persistent Scatterer Interferometry. Eng. Geol. 2019, 262, 105336. [Google Scholar] [CrossRef]
- De Castro Pena, J.C.; Goulart, F.; Wilson Fernandes, G.; Hoffmann, D.; Leite, F.S.F.; Britto dos Santos, N.; Soares-Filho, B.; Sobral-Souza, T.; Humberto Vancine, M.; Rodrigues, M. Impacts of Mining Activities on the Potential Geographic Distribution of Eastern Brazil Mountaintop Endemic Species. Perspect. Ecol. Conserv. 2017, 15, 172–178. [Google Scholar] [CrossRef]
- Mahmoudpour, M.; Khamehchiyan, M.; Nikudel, M.R.; Ghassemi, M.R. Numerical Simulation and Prediction of Regional Land Subsidence Caused by Groundwater Exploitation in the Southwest Plain of Tehran, Iran. Eng. Geol. 2016, 201, 6–28. [Google Scholar] [CrossRef]
- Chopard, A.; Marion, P.; Mermillod-Blondin, R.; Plante, B.; Benzaazoua, M. Environmental Impact of Mine Exploitation: An Early Predictive Methodology Based on Ore Mineralogy and Contaminant Speciation. Minerals 2019, 9, 397. [Google Scholar] [CrossRef] [Green Version]
- Whittaker, B.N.; Reddish, D.J. Subsidence: Occurrence, Prediction, and Control; Elsevier: Amsterdam, The Netherlands, 1989. [Google Scholar]
- Kratzsch, I.H. Mining Subsidence Engineering. Environ. Geol. Water Sci. 1986, 8, 133–136. [Google Scholar] [CrossRef]
- Blachowski, J.; Kopec, A.; Milczarek, W.; Owczarz, K. Evolution of Secondary Deformations Captured by Satellite Radar Interferometry: Case Study of an Abandoned Coal Basin in SW Poland. Sustainability 2019, 11, 884. [Google Scholar] [CrossRef] [Green Version]
- Blachowski, J.; Jiránková, E.; Lazecký, M.; Kadlečík, P.; Milczarek, W. Application of Satellite Radar Interferometry (PSInSAR) in Analysis of Secondary Surface Deformations in Mining Areas. Case Studies from Czech Republic and Poland. Acta Geodyn. Geomater. 2018, 173–185. [Google Scholar] [CrossRef] [Green Version]
- Milczarek, W.; Blachowski, J.; Grzempowski, P. Application of PSInSAR for Assessment of Surface Deformations in Post-Mining Area—Case Study of the Former Walbrzych Hard Coal Basin (SW Poland). Acta Geodyn. Geomater. 2017, 14, 41–52. [Google Scholar] [CrossRef]
- Cigna, F.; Osmanoǧlu, B.; Cabral-Cano, E.; Dixon, T.H.; Ávila-Olivera, J.A.; Garduño-Monroy, V.H.; DeMets, C.; Wdowinski, S. Monitoring Land Subsidence and Its Induced Geological Hazard with Synthetic Aperture Radar Interferometry: A Case Study in Morelia, Mexico. Remote Sens. Environ. 2012, 117, 146–161. [Google Scholar] [CrossRef]
- Ishwar, S.G.; Kumar, D.; Malik, K.K. Mine Surface Subsidence Monitoring Due to Impacts of Underground Mining Using Persistent Scatterer Interferometry. Imaging Sci. J. 2017, 20, 151–161. [Google Scholar] [CrossRef]
- Pawluszek-Filipiak, K.; Borkowski, A. Integration of DInSAR and SBAS Techniques to Determine Mining-Related Deformations Using Sentinel-1 Data: The Case Study of Rydultowy Mine in Poland. Remote Sens. 2020, 12, 242. [Google Scholar] [CrossRef] [Green Version]
- Pawluszek-Filipiak, K.; Borkowski, A. Monitoring Mining-Induced Subsidence by Integrating Differential Radar Interferometry and Persistent Scatterer Techniques. Eur. J. Remote Sens. 2020, 1–13. [Google Scholar] [CrossRef]
- Galloway, D.L.; Burbey, T.J. Review: Regional Land Subsidence Accompanying Groundwater Extraction. Hydrogeol. J. 2011, 19, 1459–1486. [Google Scholar] [CrossRef]
- Malinowska, A.; Hejmanowski, R.; Witkowski, W.T.; Guzy, A. Mapping of Slow Vertical Ground Movement Caused by Salt Cavern Convergence with Sentinel-1 Tops Data. Arch. Min. Sci. 2018, 63. [Google Scholar] [CrossRef]
- Szostak-Chrzanowski, A.; Chrzanowski, A.; Ortiz, E. Modeling of Ground Subsidence in Oil Fields. Tech. Sci. J. 2006, 9, 133–146. [Google Scholar]
- Guo, W.; Xu, F. Numerical Simulation of Overburden and Surface Movements for Wongawilli Strip Pillar Mining. Int. J. Min. Sci. Technol. 2016, 26, 71–76. [Google Scholar] [CrossRef]
- Chrzanowski, A.; Monahan, C.; Roulston, B.; Szostak-Chrzanowski, A. Integrated Monitoring and Modelling of Ground Subsidence in Potash Mines. Int. J. Rock Mech. Min. Sci. 1997, 34, 55.e1–55.e16. [Google Scholar] [CrossRef]
- Malinowska, A.; Hejmanowski, R.; Dai, H.Y. Ground Movements Modeling Applying Adjusted Influence Function. Int. J. Min. Sci. Technol. 2020, 30, 243–249. [Google Scholar] [CrossRef]
- Sroka, A.; Hejmanowski, R. Subsidence Prediction Caused by the Oil and Gas Development. In Proceedings of the 3rd IAG Symposium on Geodesy for Geotechnical and Structural Engineering and 12th FIG Symposium on Deformation Measurements, Baden, Germany, 22–24 May 2006. [Google Scholar]
- Hejmanowski, R.; Malinowska, A.A. Land Subsidence Inversion Method Application for Salt Mining-Induced Rock Mass Movement. Gospod. Surowcami Miner. 2017, 33, 179–200. [Google Scholar] [CrossRef] [Green Version]
- Lee, S.; Park, I.; Choi, J.K. Spatial Prediction of Ground Subsidence Susceptibility Using an Artificial Neural Network. Environ. Manag. 2011, 49, 347–358. [Google Scholar] [CrossRef] [PubMed]
- Park, I.; Choi, J.; Jin Lee, M.; Lee, S. Application of an Adaptive Neuro-Fuzzy Inference System to Ground Subsidence Hazard Mapping. Comput. Geosci. 2012, 48, 228–238. [Google Scholar] [CrossRef]
- Yu, Y.; Chen, S.E.; Deng, K.Z.; Wang, P.; Fan, H.D. Subsidence Mechanism and Stability Assessment Methods for Partial Extraction Mines for Sustainable Development of Mining Cities—A Review. Sustainability 2018, 10, 113. [Google Scholar] [CrossRef] [Green Version]
- Kapelus, P. Mining, Corporate Social Responsibility and the “Community”: The Case of Rio Tinto, Richards Bay Minerals and the Mbonambi. J. Bus. Ethic 2002, 39, 275–296. [Google Scholar] [CrossRef]
- Basu, P.K.; Hicks, J.; Krivokapic-Skoko, B.; Sherley, C. Mining Operations and Corporate Social Responsibility: A Case Study of a Large Gold Mine in Regional Australia. Extr. Ind. Soc. 2015. [Google Scholar] [CrossRef]
- Guo, H.; Zhang, Z.; Cheng, G.; Li, W.; Li, T.; Jiao, J.J. Groundwater-Derived Land Subsidence in the North China Plain. Environ. Earth Sci. 2015, 74, 1415–1427. [Google Scholar] [CrossRef]
- Faunt, C.C.; Hanson, R.T.; Martin, P.; Schmid, W. Planned Updates and Refinements to the Central Valley Hydrologic Model, with an Emphasis on Improving the Simulation of Land Subsidence in the San Joaquin Valley. In Proceedings of the 2011 World Environmental and Water Resources Congress: Bearing Knowledge for Sustainability, Palm Springs, CA, USA, 22–26 May 2011. [Google Scholar] [CrossRef]
- Faunt, C.C.; Hanson, R.T.; Belitz, K.; Schmid, W.; Predmore, S.P.; Rewis, D.L.; McPherson, K. Numerical Model of the Hydrologic Landscape and Groundwater Flow in California’s Central Valley. USGS Professional Paper 1766. 2009, pp. 121–212. Available online: https://www.researchgate.net/publication/255565123_Chapter_C_Numerical_model_of_the_hydrologic_landscape_and_groundwater_flow_in_California’s_Central_Valley (accessed on 2 September 2020).
- Faunt, C.C.; Sneed, M.; Traum, J.; Brandt, J.T. Water Availability and Land Subsidence in the Central Valley, California, USA. Hydrogeol. J. 2015, 24, 675–684. [Google Scholar] [CrossRef] [Green Version]
- Luo, J.; Diersch, H.J.G.; Monninkhoff, L.M.M. 3D Modeling of Saline Groundwater Flow and Transport in a Flooded Salt Mine in Stassfurt, Germany. Mine Water Environ. 2012, 31, 104–111. [Google Scholar] [CrossRef]
- Surinaidu, L.; Gurunadha Rao, V.V.S.; Srinivasa Rao, N.; Srinu, S. Hydrogeological and Groundwater Modeling Studies to Estimate the Groundwater Inflows into the Coal Mines at Different Mine Development Stages Using MODFLOW, Andhra Pradesh, India. Water Resour. Ind. 2014, 49–65. [Google Scholar] [CrossRef] [Green Version]
- Guzy, A.; Malinowska, A.A. State of the Art and Recent Advancements in the Modelling of Land Subsidence Induced by Groundwater Withdrawal. Water 2020, 12, 2051. [Google Scholar] [CrossRef]
- Gambolati, G.; Teatini, P. Geomechanics of Subsurface Water Withdrawal and Injection. Water Resour. Res. 2015, 51, 3922–3955. [Google Scholar] [CrossRef]
- Guzy, A.; Ahmed, A.W.; Malinowska, A. Spatio-Temporal Distribution of Land Subsidence and Water Drop Caused by Underground Exploitation of Mineral Resources. In Proceedings of the International Multidisciplinary Scientific GeoConference Surveying Geology and Mining Ecology Management, Vienna, Austria, 3–6 December 2018. [Google Scholar] [CrossRef]
- Witkowski, W.T.; Hejmanowski, R. Software for Estimation of Stochastic Model Parameters for a Compacting Reservoir. Appl. Sci. 2020, 10, 3287. [Google Scholar] [CrossRef]
- Schmid, W.; Hanson, R.T.; Leake, S.A.; Hughes, J.D.; Niswonger, R.G. Feedback of Land Subsidence on the Movement and Conjunctive Use of Water Resources. Environ. Model. Softw. 2014, 62, 253–270. [Google Scholar] [CrossRef]
- Zhou, Y. A Critical Review of Groundwater Budget Myth, Safe Yield and Sustainability. J. Hydrol. 2009, 370, 207–213. [Google Scholar] [CrossRef]
- Habermehl, M.A. Review: The Evolving Understanding of the Great Artesian Basin (Australia), from Discovery to Current Hydrogeological Interpretations. Hydrogeol. J. 2019, 28, 13–36. [Google Scholar] [CrossRef]
- Rapantova, N.; Grmela, A.; Vojtek, D.; Halir, J.; Michalek, B. Ground Water Flow Modelling Applications in Mining Hydrogeology. Mine Water Environ. 2007, 26, 264–270. [Google Scholar] [CrossRef]
- Hang, Y.; Zhang, G.L.; Yang, G.Y. Numerical Simulation of Dewatering Thick Unconsolidated Aquifers for Safety of Underground Coal Mining. Min. Sci. Technol. 2009, 19, 312–316. [Google Scholar] [CrossRef]
- Doulati Ardejani, F.; Singh, R.N.; Baafi, E.; Porter, I. A Finite Element Model to Simulate Groundwater Rebound Problems in Backfilled Open Cut Mines. Mine Water Environ. 2003, 22, 39–44. [Google Scholar] [CrossRef]
- Krčmář, D.; Sracek, O. MODFLOW-USG: The New Possibilities in Mine Hydrogeology Modelling (or What Is Not Written in the Manuals). Mine Water Environ. 2014, 33, 376–383. [Google Scholar] [CrossRef]
- Booth, C.J. Strata-Movement Concepts and the Hydrogeological Impact of Underground Coal Mining. Groundwater 1986, 24, 507–515. [Google Scholar] [CrossRef]
- Singh, R.P.; Yadav, R.N. Prediction of Subsidence Due to Coal Mining in Raniganj Coalfield, West Bengal, India. Eng. Geol. 1995, 39, 103–111. [Google Scholar] [CrossRef]
- Hebblewhite, B. Fracturing, Caving Propagation and Influence of Mining on Groundwater above Longwall Panels—A Review of Predictive Models. Int. J. Min. Sci. Technol. 2020, 30, 49–54. [Google Scholar] [CrossRef]
- Wang, J.; Lu, C.; Sun, Q.; Xiao, W.; Cao, G.; Li, H.; Yan, L.; Zhang, B. Simulating the Hydrologic Cycle in Coal Mining Subsidence Areas with a Distributed Hydrologic Model. Sci. Rep. 2017, 7, 39983. [Google Scholar] [CrossRef] [PubMed] [Green Version]
- McNally, G.; Evans, R. Impacts of Longwall Mining on Surface Water and Groundwater, Southern Coalfield NSW. Report 2007. Available online: https://ewater.org.au/uploads/files/McNally_Evans-2007-Longwall_mining.pdf (accessed on 2 September 2020).
- Iannacchione, A.; Tonsor, S.; Witkowski, M.; Benner, J.; Hale, A.; Shenge, M. The Effects of Subsidence Resulting from Underground Bituminous Coal Mining on Surface Structures and Features and on Water Resources, 2003 to 2008. Bitum. Mine Subsid. Land Conserv. Act 2011, 54. [Google Scholar] [CrossRef]
- Szczepiński, J. The Significance of Groundwater Flow Modeling Study for Simulation of Opencast Mine Dewatering, Flooding, and the Environmental Impact. Water 2019, 11, 848. [Google Scholar] [CrossRef] [Green Version]
- Brown, K.; Trott, S. Groundwater Flow Models in Open Pit Mining: Can We Do Better? Mine Water Environ. 2014, 33, 187–190. [Google Scholar] [CrossRef]
- Gambolati, G.; Freeze, R.A. Mathematical Simulation of the Subsidence of Venice: 1. Water Resour. Res. 1973, 9, 721–733. [Google Scholar] [CrossRef]
- Larson, K.J.; Basagaoglu, H.; Mariño, M. Numerical Simulation of Land Subsidence in the Los Banos-Kettleman City Area, California. Contrib. Univ. Calif. Water Resour. Cent. 2001. Available online: https://escholarship.org/uc/item/5h60p535 (accessed on 2 September 2020).
- Jafari, F.; Javadi, S.; Golmohammadi, G.; Karimi, N.; Mohammadi, K. Numerical Simulation of Groundwater Flow and Aquifer-System Compaction Using Simulation and InSAR Technique: Saveh Basin, Iran. Environ. Earth Sci. 2016, 75. [Google Scholar] [CrossRef]
- Booth, C.J. Groundwater as an Environmental Constraint of Longwall Coal Mining. Environ. Earth Sci. 2006, 49, 796–803. [Google Scholar] [CrossRef]
- Hawkins, J.W.; Smoyer, J.J. Hydrologic Impacts of Multiple Seam Underground and Surface Mining: A Northern Appalachia Example. Mine Water Environ. 2011, 30, 263–273. [Google Scholar] [CrossRef]
- Newman, C.; Agioutantis, Z.; Boede Jimenez Leon, G. Assessment of Potential Impacts to Surface and Subsurface Water Bodies Due to Longwall Mining. Int. J. Min. Sci. Technol. 2017, 27, 57–64. [Google Scholar] [CrossRef]
- Laronne Ben-Itzhak, L.; Gvirtzman, H. Groundwater Flow along and across Structural Folding: An Example from the Judean Desert, Israel. J. Hydrol. 2005, 312, 51–69. [Google Scholar] [CrossRef]
- Switzman, H.; Coulibaly, P.; Adeel, Z. Modeling the Impacts of Dryland Agricultural Reclamation on Groundwater Resources in Northern Egypt Using Sparse Data. J. Hydrol. 2015, 520, 420–438. [Google Scholar] [CrossRef]
- Bonì, R.; Meisina, C.; Teatini, P.; Zucca, F.; Zoccarato, C.; Franceschini, A.; Ezquerro, P.; Béjar-Pizarro, M.; Fernández-Merodo, J.A.; Guardiola-Albert, C.; et al. Understanding the Dynamic Behaviour for the Madrid Aquifer (Spain): Insights from the Integration of A-DInSAR and 3-D Groundwater Flow and Geomechanical Models. Proc. Int. Assoc. Hydrol. Sci. 2020, 382, 409–414. [Google Scholar] [CrossRef] [Green Version]
- Gharehdaghi, M.; Fakher, A.; Cheshomi, A. The Combined Use of Long-Term Multi-Sensor Insar Analysis and Finite Element Simulation to Predict Land Subsidence. Int. Arch. Photogramm. Remote Sens. Spat. Inf. Sci. 2019, 42, 421–427. [Google Scholar] [CrossRef] [Green Version]
- Ezquerro, P.; Guardiola-Albert, C.; Herrera, G.; Fernández-Merodo, J.A.; Béjar-Pizarro, M.; Bonì, R. Groundwater and Subsidence Modeling Combining Geological and Multi-Satellite SAR Data over the Alto Guadalentín Aquifer (SE Spain). Geofluids 2017, 2017, 1359325. [Google Scholar] [CrossRef]
- Bonì, R.; Meisina, C.; Cigna, F.; Herrera, G.; Notti, D.; Bricker, S.; McCormack, H.; Tomás, R.; Béjar-Pizarro, M.; Mulas, J.; et al. Exploitation of Satellite A-DInSAR Time Series for Detection, Characterization and Modelling of Land Subsidence. Geosciences 2017, 7, 25. [Google Scholar] [CrossRef] [Green Version]
- Wada, Y.; Bierkens, M.F.P. Sustainability of Global Water Use: Past Reconstruction and Future Projections. Environ. Res. Lett. 2014, 9, 104003. [Google Scholar] [CrossRef]
- Statistics Poland. Available online: https://stat.gov.pl/en/ (accessed on 2 September 2020).
- Philpott, K.D. Evaluation of the Bogdanka Mine, Poland. Polish Geol. Inst. Spec. Pap. 2002, 7, 199–206. [Google Scholar]
- Wilk, Z.; Bocheńska, T. Hydrogeology of Polish Mineral Deposit and Mining Water Problems. 2; AGH Uczelniane Wydawnictwa Naukowo-Dydaktyczne: Kraków, Poland, 2003. [Google Scholar]
- Witkowski, W.T. Modelowanie Zmian Obniżeń w Niecce Odwodnieniowej z Wykorzystaniem Metody Trendu. Prz. Gor. 2013, 7, 35–40. [Google Scholar]
- Knothe, S. Equation of the Subsidence Profile. Arch. Min. Metall. 1953, 1, 22–38. [Google Scholar]
- Knothe, S. Observations of Surface Movements under Influence of Mining and Their Theoretical Interpretation. In Proceedings of the European Congress on Ground Movement, Leeds, UK, 9–12 April 1957; pp. 210–218. [Google Scholar]
- Fokker, P.A.; Orlic, B. Semi-Analytic Modelling of Subsidence. Math. Geol. 2006, 38, 565–589. [Google Scholar] [CrossRef]
- Ren, G.; Buckeridge, J.; Li, J. Estimating Land Subsidence Induced by Groundwater Extraction in Unconfined Aquifers Using an Influence Function Method. J. Water Resour. Plan. Manag. 2015, 141, 04014084. [Google Scholar] [CrossRef]
- Fetter, C.W. Applied Hydrogeology; Waveland Press: Long Grove, IL, USA, 2001. [Google Scholar]
- Verruijt, A. Theory of Groundwater Flow; Macmillan Education: London, UK, 1970. [Google Scholar] [CrossRef] [Green Version]
- Bear, J. Dynamics of Fluids in Porous Media. Soil Sci. 1975, 120, 162–163. [Google Scholar] [CrossRef] [Green Version]
- Wang, H.F.; Anderson, M.P. Introduction to Groundwater Modeling: Finite Difference and Finite Element Methods. Freeman 1982, 63, 778. [Google Scholar] [CrossRef]
- Harbaugh, A.W. MODFLOW-2005, The U.S. Geological Survey Modular Ground-Water Model—The Ground-Water Flow Process; U.S. Geological Survey Techniques and Methods 6-A16: Reston, VA, USA, 2005. Available online: https://pdfs.semanticscholar.org/8f66/c41c163e48f97c00319045275210c8556ae1.pdf?_ga=2.55128226.807264787.1600849870-984853360.1600849870 (accessed on 2 September 2020).
- Freeze, R.A.; Cherry, A.J. Groundwater; Prentice Hall: Upper Saddle River, NJ, USA, 1979. [Google Scholar]
- Vermeulen, P.T.M.; Roelofsen, F.J.; Minnema, B.; Burgering, L.M.T.; Verkaik, J.; Janssen, G.M.C.M.; Romero Verastegu, B. IMOD User Manual Version 5.1; Deltares: Delft, The Netherlands, 2020. [Google Scholar]
- Tonkin, M.; Hill, M.; Maxwell, R.M.; Zheng, C. Groundwater Modeling and Beyond: MODFLOW-and-More-2019 Special Issue. Groundwater 2020, 58, 325–326. [Google Scholar] [CrossRef]
- Aghlmand, R.; Abbasi, A. Application of MODFLOW with Boundary Conditions Analyses Based on Limited Available Observations: A Case Study of Birjand Plain in East Iran. Water 2019, 11, 1904. [Google Scholar] [CrossRef] [Green Version]
- Mohammadi, K. Groundwater Table Estimation Using MODFLOW and Artificial Neural Networks. In Practical Hydroinformatics; Abrahart, R.J., See, L.M., Solomatine, D.P., Eds.; Water Science and Technology Library, 68; Springer: Berling/Heidelberg, Germany, 2008. [Google Scholar] [CrossRef]
- Minderhoud, P.S.J.; Erkens, G.; Pham, V.H.; Bui, V.T.; Erban, L.; Kooi, H.; Stouthamer, E. Impacts of 25 Years of Groundwater Extraction on Subsidence in the Mekong Delta, Vietnam. Environ. Res. Lett. 2017, 12, 064006. [Google Scholar] [CrossRef]
- Cao, G.; Han, D.; Moser, J. Groundwater Exploitation Management under Land Subsidence Constraint: Empirical Evidence from the Hangzhou-Jiaxing-Huzhou Plain, China. Environ. Manag. 2013, 51, 1109–1125. [Google Scholar] [CrossRef]
- Shi, X.; Fang, R.; Wu, J.; Xu, H.; Sun, Y.Y.; Yu, J. Sustainable Development and Utilization of Groundwater Resources Considering Land Subsidence in Suzhou, China. Eng. Geol. 2012, 124, 77–89. [Google Scholar] [CrossRef]
- Shih, D.S.; Chen, C.J.; Li, M.H.; Jang, C.S.; Chang, C.M.; Liao, Y.Y. Statistical and Numerical Assessments of Groundwater Resource Subject to Excessive Pumping: Case Study in Southwest Taiwan. Water 2019, 11, 360. [Google Scholar] [CrossRef] [Green Version]
- Kresic, N.; Mikszewski, A. Hydrogeological Conceptual Site Models; CRC Press: Boca Raton, FL, USA, 2012. [Google Scholar] [CrossRef]
- Nash, J.E.; Sutcliffe, J.V. River Flow Forecasting through Conceptual Models. J. Hydrol. 1970, 10, 282–290. [Google Scholar] [CrossRef]
- Andrews, C.B. Effective Groundwater Model Calibration: With Analysis of Data, Sensitivities, Predictions, and Uncertainty. Groundwater 2007, 46, 5. [Google Scholar] [CrossRef]
- Hejmanowski, R.; Sopata, P.; Stoch, T.; Wójcik, A.; Witkowski, W.T. Wpływ odwodnienia górotworu węglowego na osiadanie powierzchni terenu. Prz. Gor. 2013, 69, 38–43. [Google Scholar]
- Botzan, T.M.; Mariño, M.A.; Basagaoglu, H. Drought Subsidence Prediction Model for the Western San Joaquin Valley, California. Water Int. 1999, 24, 221–228. [Google Scholar] [CrossRef]
- Haghshenas Haghighi, M.; Motagh, M. Ground Surface Response to Continuous Compaction of Aquifer System in Tehran, Iran: Results from a Long-Term Multi-Sensor InSAR Analysis. Remote Sens. Environ. 2019, 221, 534–550. [Google Scholar] [CrossRef]
- Miller, M.M.; Shirzaei, M. Spatiotemporal Characterization of Land Subsidence and Uplift in Phoenix Using InSAR Time Series and Wavelet Transforms. J. Geophys. Res. Solid Earth 2015, 120, 5822–5842. [Google Scholar] [CrossRef] [Green Version]
- Dehghani, M. Interferometric Measurements of Ground Surface Subsidence Induced by Overexploitation of Groundwater. J. Appl. Remote Sens. 2010, 4, 041864. [Google Scholar] [CrossRef]
- Tolman, C.F.; Poland, J.F. Ground-water, Salt-water Infiltration, and Ground-surface Recession in Santa Clara Valley, Santa Clara County, California. Trans. Am. Geophys. Union 1940, 21, 23–35. [Google Scholar] [CrossRef]
- Terzaghi, K. Principles of Soil Mechanics: IV-Settlement and Consolidation of Clay. Eng. News Rec. 1925, 95, 874–878. [Google Scholar]
- Ciosmak, M. The Anthropogenic Inundated Area “Szczecin” in the Zone of Active Underground Exploitation of Hard Coal in the Lublin Coal Basin. J. Ecol. Eng. 2016, 17, 70–80. [Google Scholar] [CrossRef]
Figure 1.
(A) The location of the study area on the map of Poland; (B) the main built-up areas and the surface infrastructure; (C) the geological and tectonic settings of the area of interest without Quaternary and Cretaceous deposits on a cutting plane of 750 mbsl (meters below surface level), the spatial distribution of boreholes; source of data: the Mine and Surveying Department of the Bogdanka hard coal mine, the Polish Geological Institute-National Research, Open Street Map.

Figure 2.
Schematic cross-section of geological and hydrogeological formations in the study area (see Figure 1C for the location of the profile); modified after [69]; source of data: the Polish Geological Institute-National Research.

Figure 3.
(A) Mining panels exploited in the years 1982–2020 and planned hard coal exploitation in the years 2020–2030; (B) supposed spatial extent of depression cone in the Middle Jurassic aquifers in successive years determined based on groundwater head maps provided by the Mine and Surveying Department of the Bogdanka hard coal mine; distribution of drainage wells in the mining area, as well as piezometers in the Quaternary-Upper Cretaceous, Lower Cretaceous-Upper Jurassic and Middle Jurassic aquifers; source of data: the Mine and Surveying Department of the Bogdanka hard coal mine, the Polish Geological Institute-National Research, Open Street Map.

Figure 4.
Cumulated rate of groundwater pumped from the Middle Jurassic aquifer in the years 1976–2016; source of data: the Mine and Surveying Department of the Bogdanka hard coal mine.
Figure 4.
Cumulated rate of groundwater pumped from the Middle Jurassic aquifer in the years 1976–2016; source of data: the Mine and Surveying Department of the Bogdanka hard coal mine.

Figure 5.
Time-series of (A) the groundwater table in the years 1974–2020 in the Quaternary-Upper Cretaceous aquifer, the groundwater head in the years 1978–2020 in (B) the Lower Cretaceous-Upper Jurassic, and (C) the Middle Jurassic aquifer (see Figure 3 for the location of piezometers). Note, there is no substantial change in the groundwater table in the Quaternary-Upper Cretaceous aquifer, therefore one can state no impact of confined aquifer dewatering induced by mining operations on the unconfined aquifer in the study area (see Section 2.1 for explanation); source of data: the Mine and Surveying Department of the Bogdanka hard coal mine, the Polish Geological Institute-National Research.

Figure 6.
3D discretization of the hydrogeological model of the Bogdanka hard coal mine built with the use of IMOD software.
Figure 6.
3D discretization of the hydrogeological model of the Bogdanka hard coal mine built with the use of IMOD software.

Figure 7.
The supposed maximum spatial extent of the depression cone in the Middle Jurassic aquifer determined based on the Weber empirical formula; the spatial distribution of the hard coal deposit zones for which different values of horizontal hydraulic conductivity were estimated; source of data: the Polish Geological Institute-National Research Institute.

Figure 8.
Observed and predicted groundwater head in the Middle Jurassic aquifer for calibration (1975–1995), validation (1995–2020), and prediction period (2020–2030) in selected piezometers located in (A) the vicinity of the drainage center and (B) the outlying area of depression cone (see Figure 3 for piezometer location); source of data: Polish Geological Institute—National Research Institute.

Figure 9.
Environmental impact of the underground exploitation of hard coal in the Bogdanka mine: the spatial extent of the land subsidence in (A) 1990, (B) 2000, (C) 2010, (D) 2020, and (E) 2030, computed based on the Knothe influence function method; (F) the surface infrastructure, land use and distribution of the main built-up areas in the study area.

Figure 10.
Environmental impact of the underground exploitation of hard coal in the Bogdanka mine: spatial extent and value of the depression cone in the Middle Jurassic aquifer in (A) 2020 and (B) 2030, calculated based on the numerical hydrogeological model; (C) distribution of protected areas as well as land infrastructure and land use in the area of the impact of the depression cone on the regional-scale environmental system.

Figure 11.
Environmental impact of the underground exploitation of hard coal in the Bogdanka mine: a comparison of the altitude of the groundwater head in the Middle Jurassic aquifer and the top surface of that aquifer in the years (A) 2020 and (B) 2030. Note that in the area of drainage center, marked by the yellow circle, groundwater head of the Middle Jurassic Aquifer is lower than the upper surface of that aquifer.

Figure 12.
Environmental impact of the underground exploitation of hard coal in the Bogdanka mine: cross-sections of the groundwater head decrease in the Middle Jurassic aquifer in (A) 2020 and (B) 2030 (see Figure 11 for the location of profiles); a comparison of the altitude of the groundwater head in the Middle Jurassic aquifer, the terrain surface, the upper and lower surfaces, as well as the terrain surface and initial groundwater head in the aquifer under analysis.


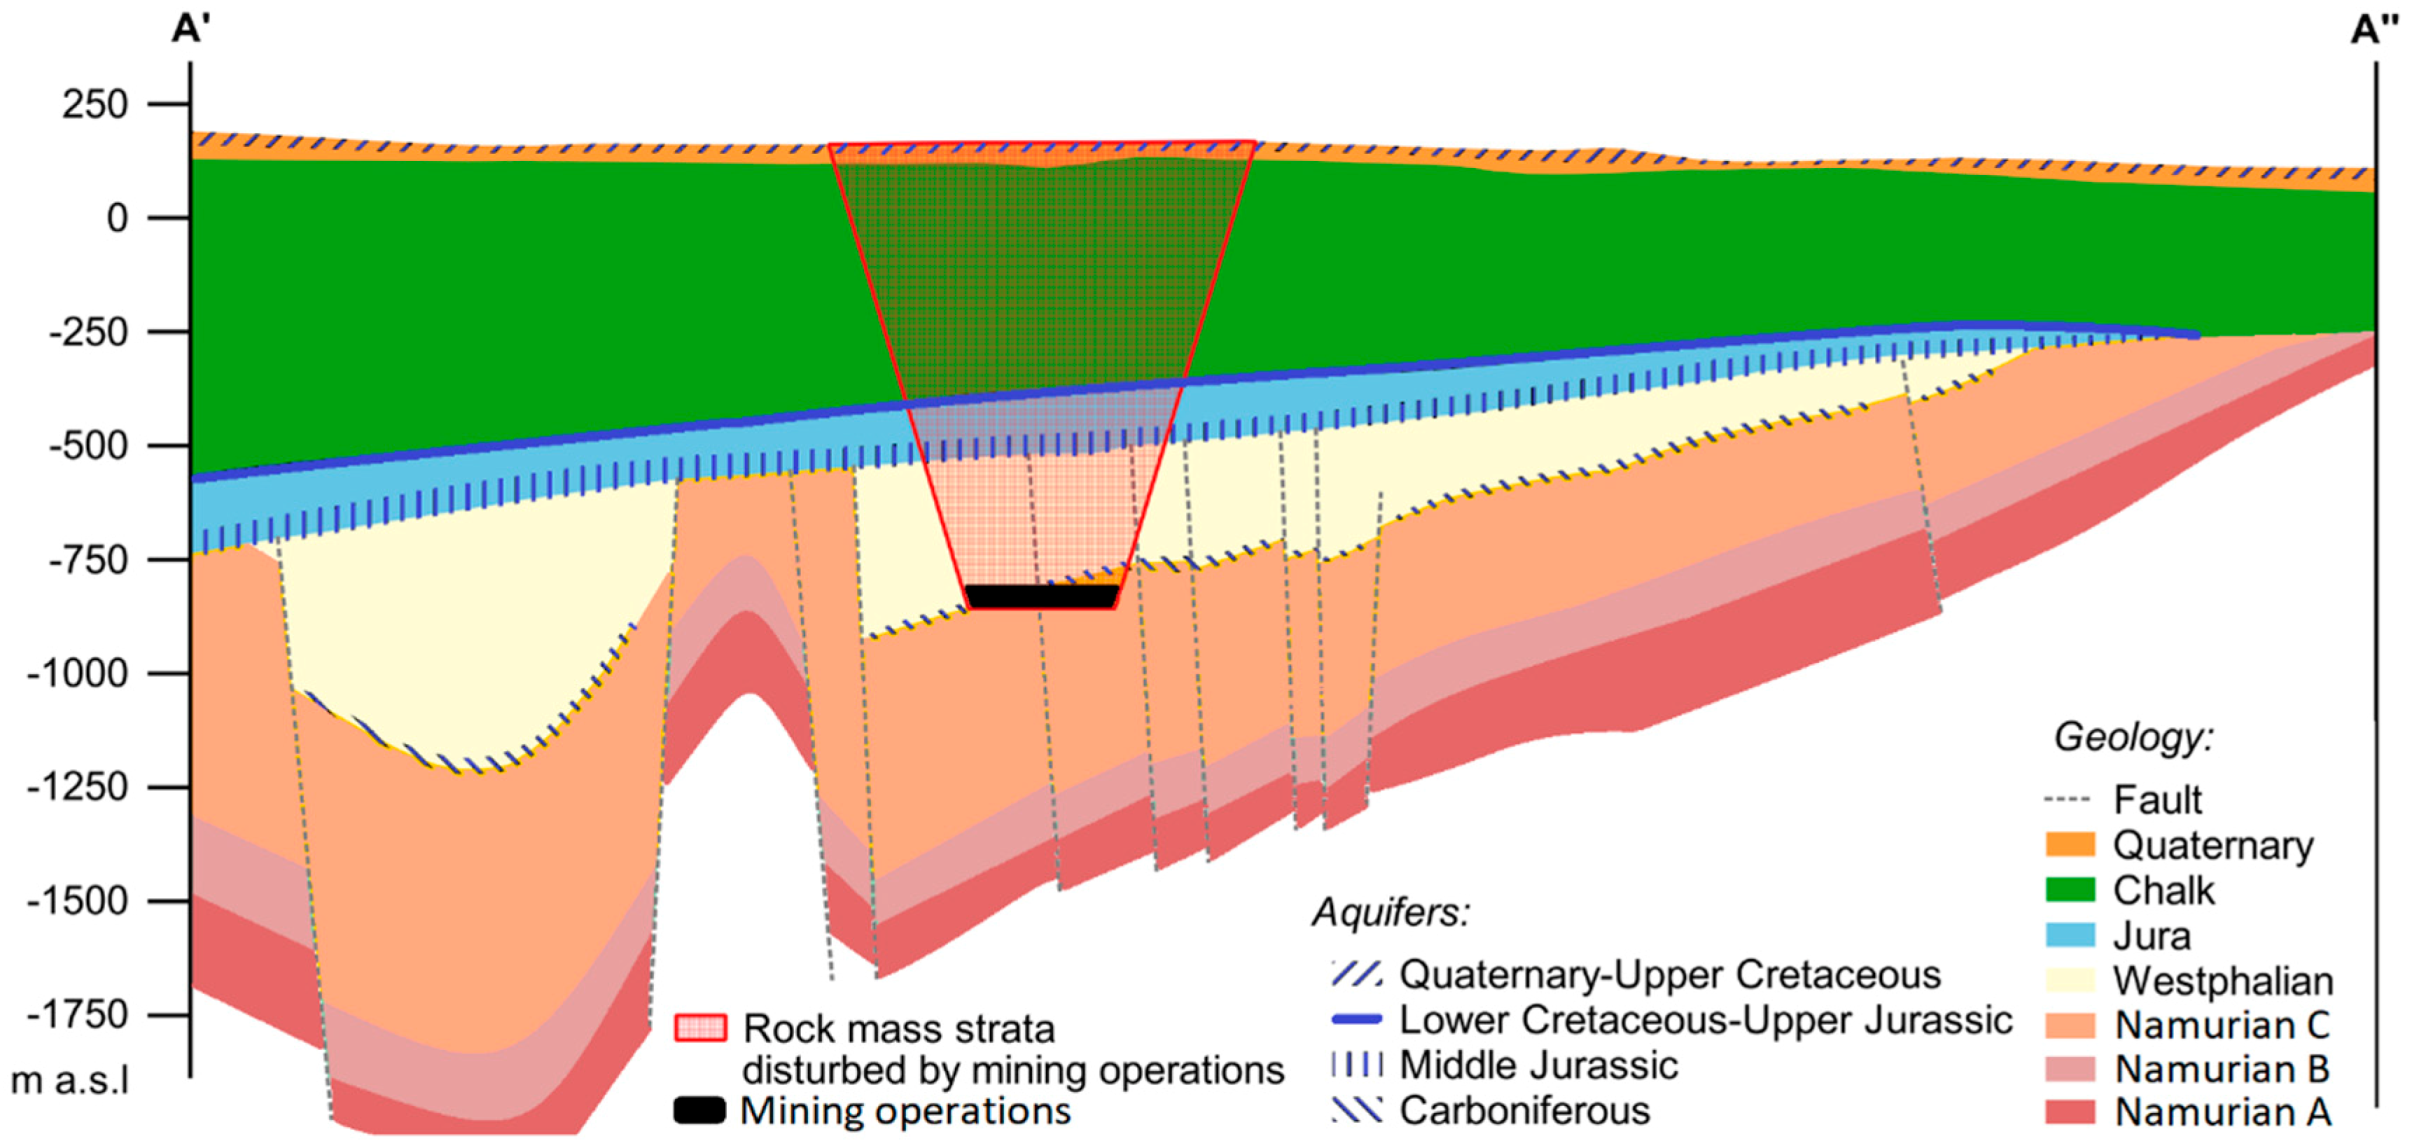
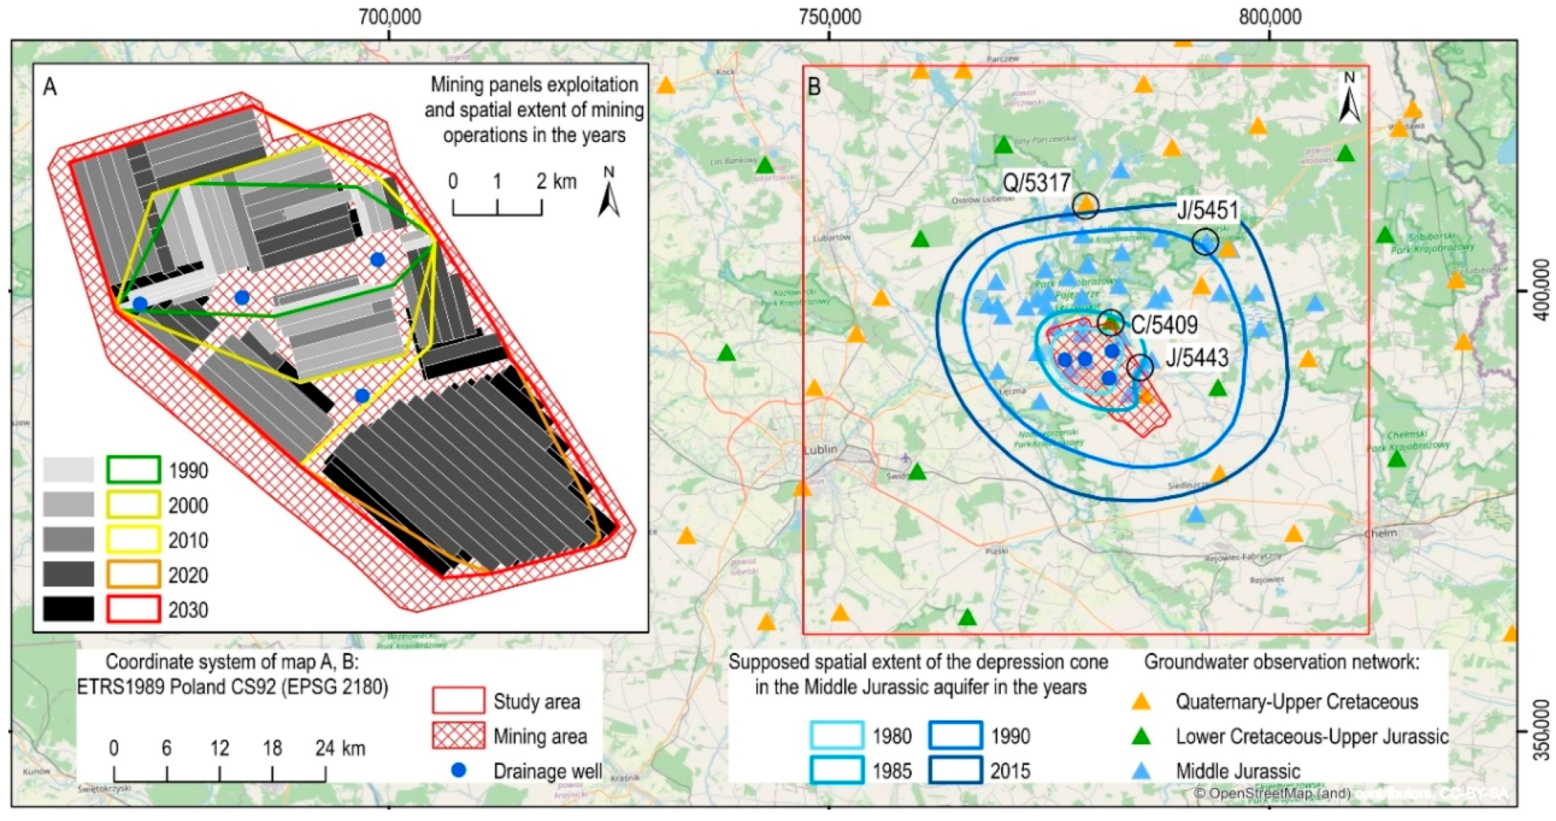
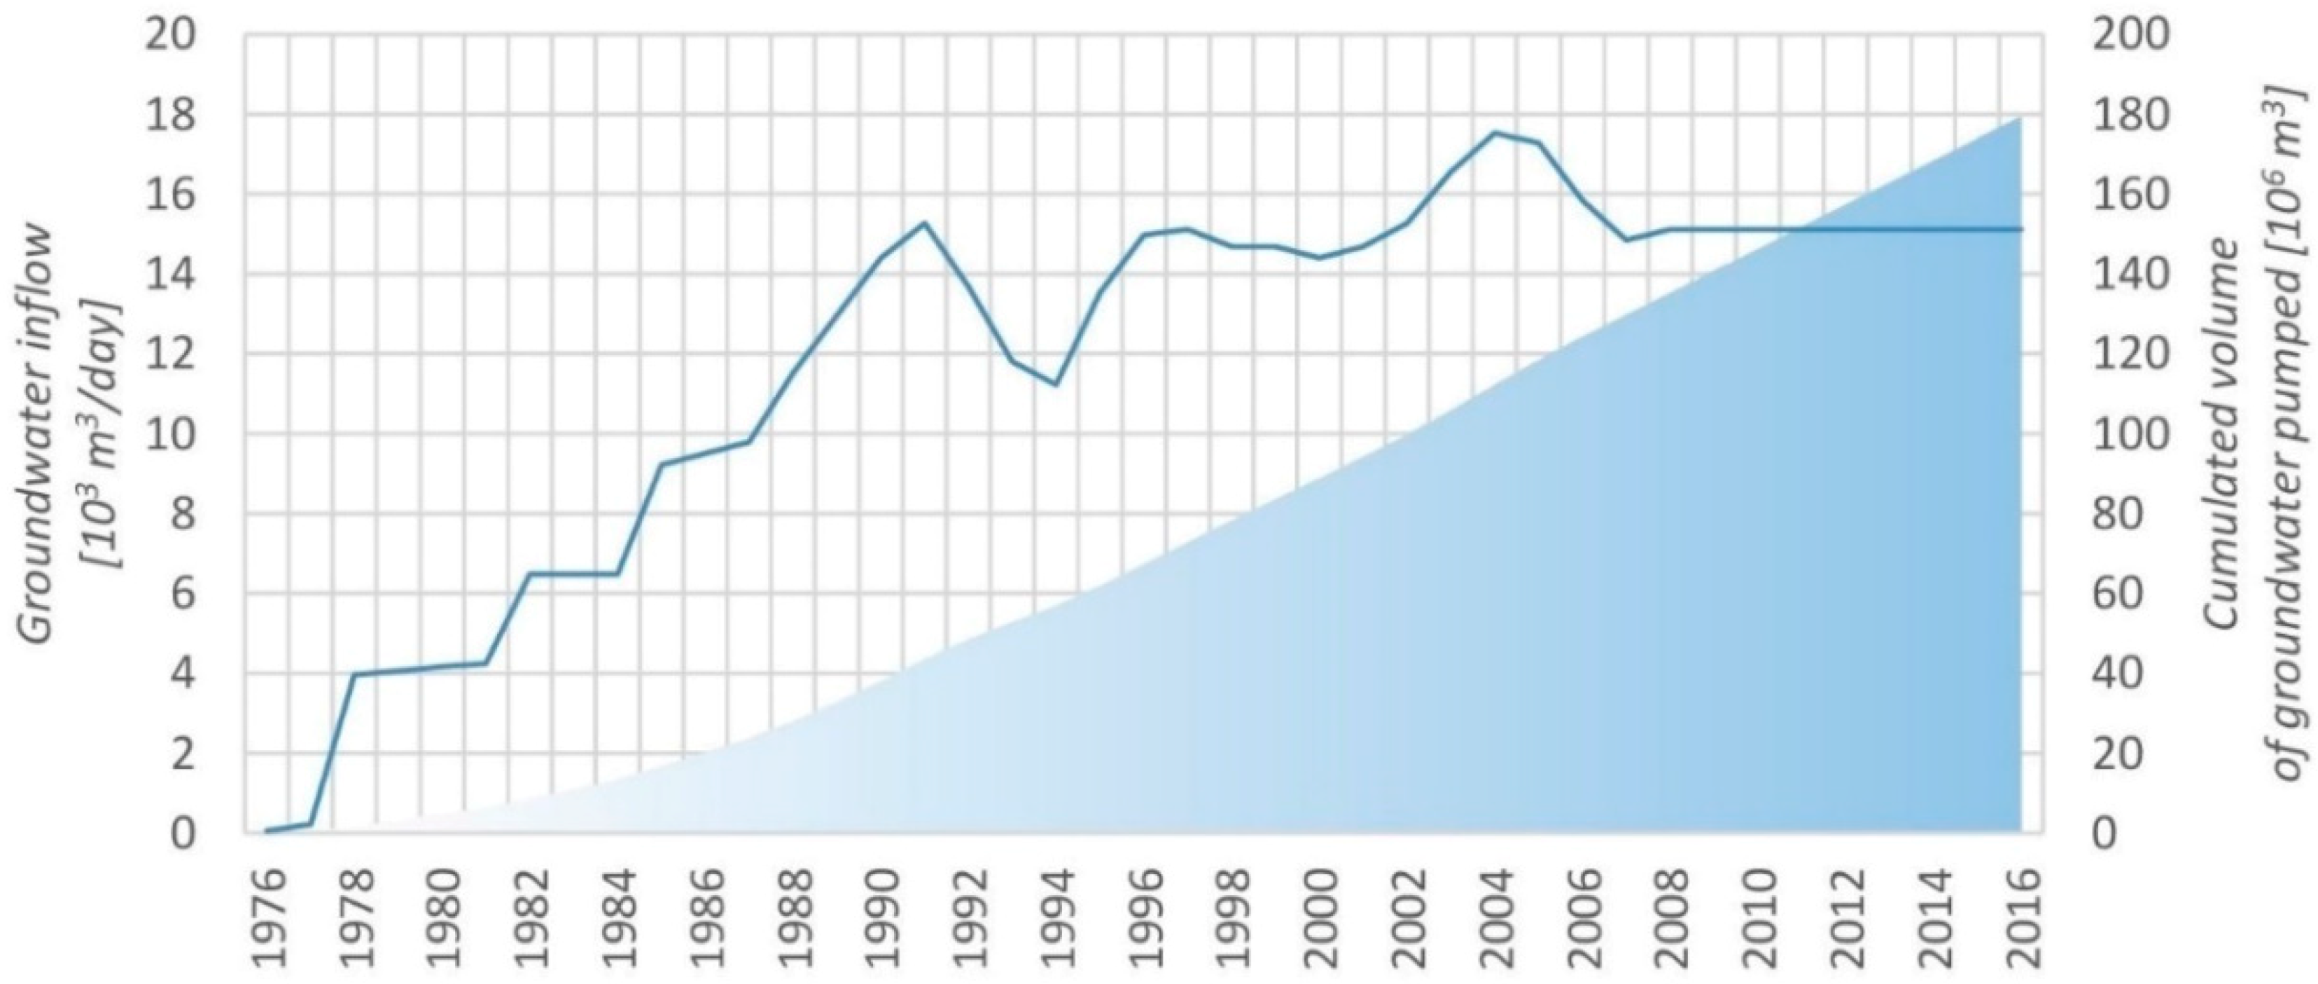
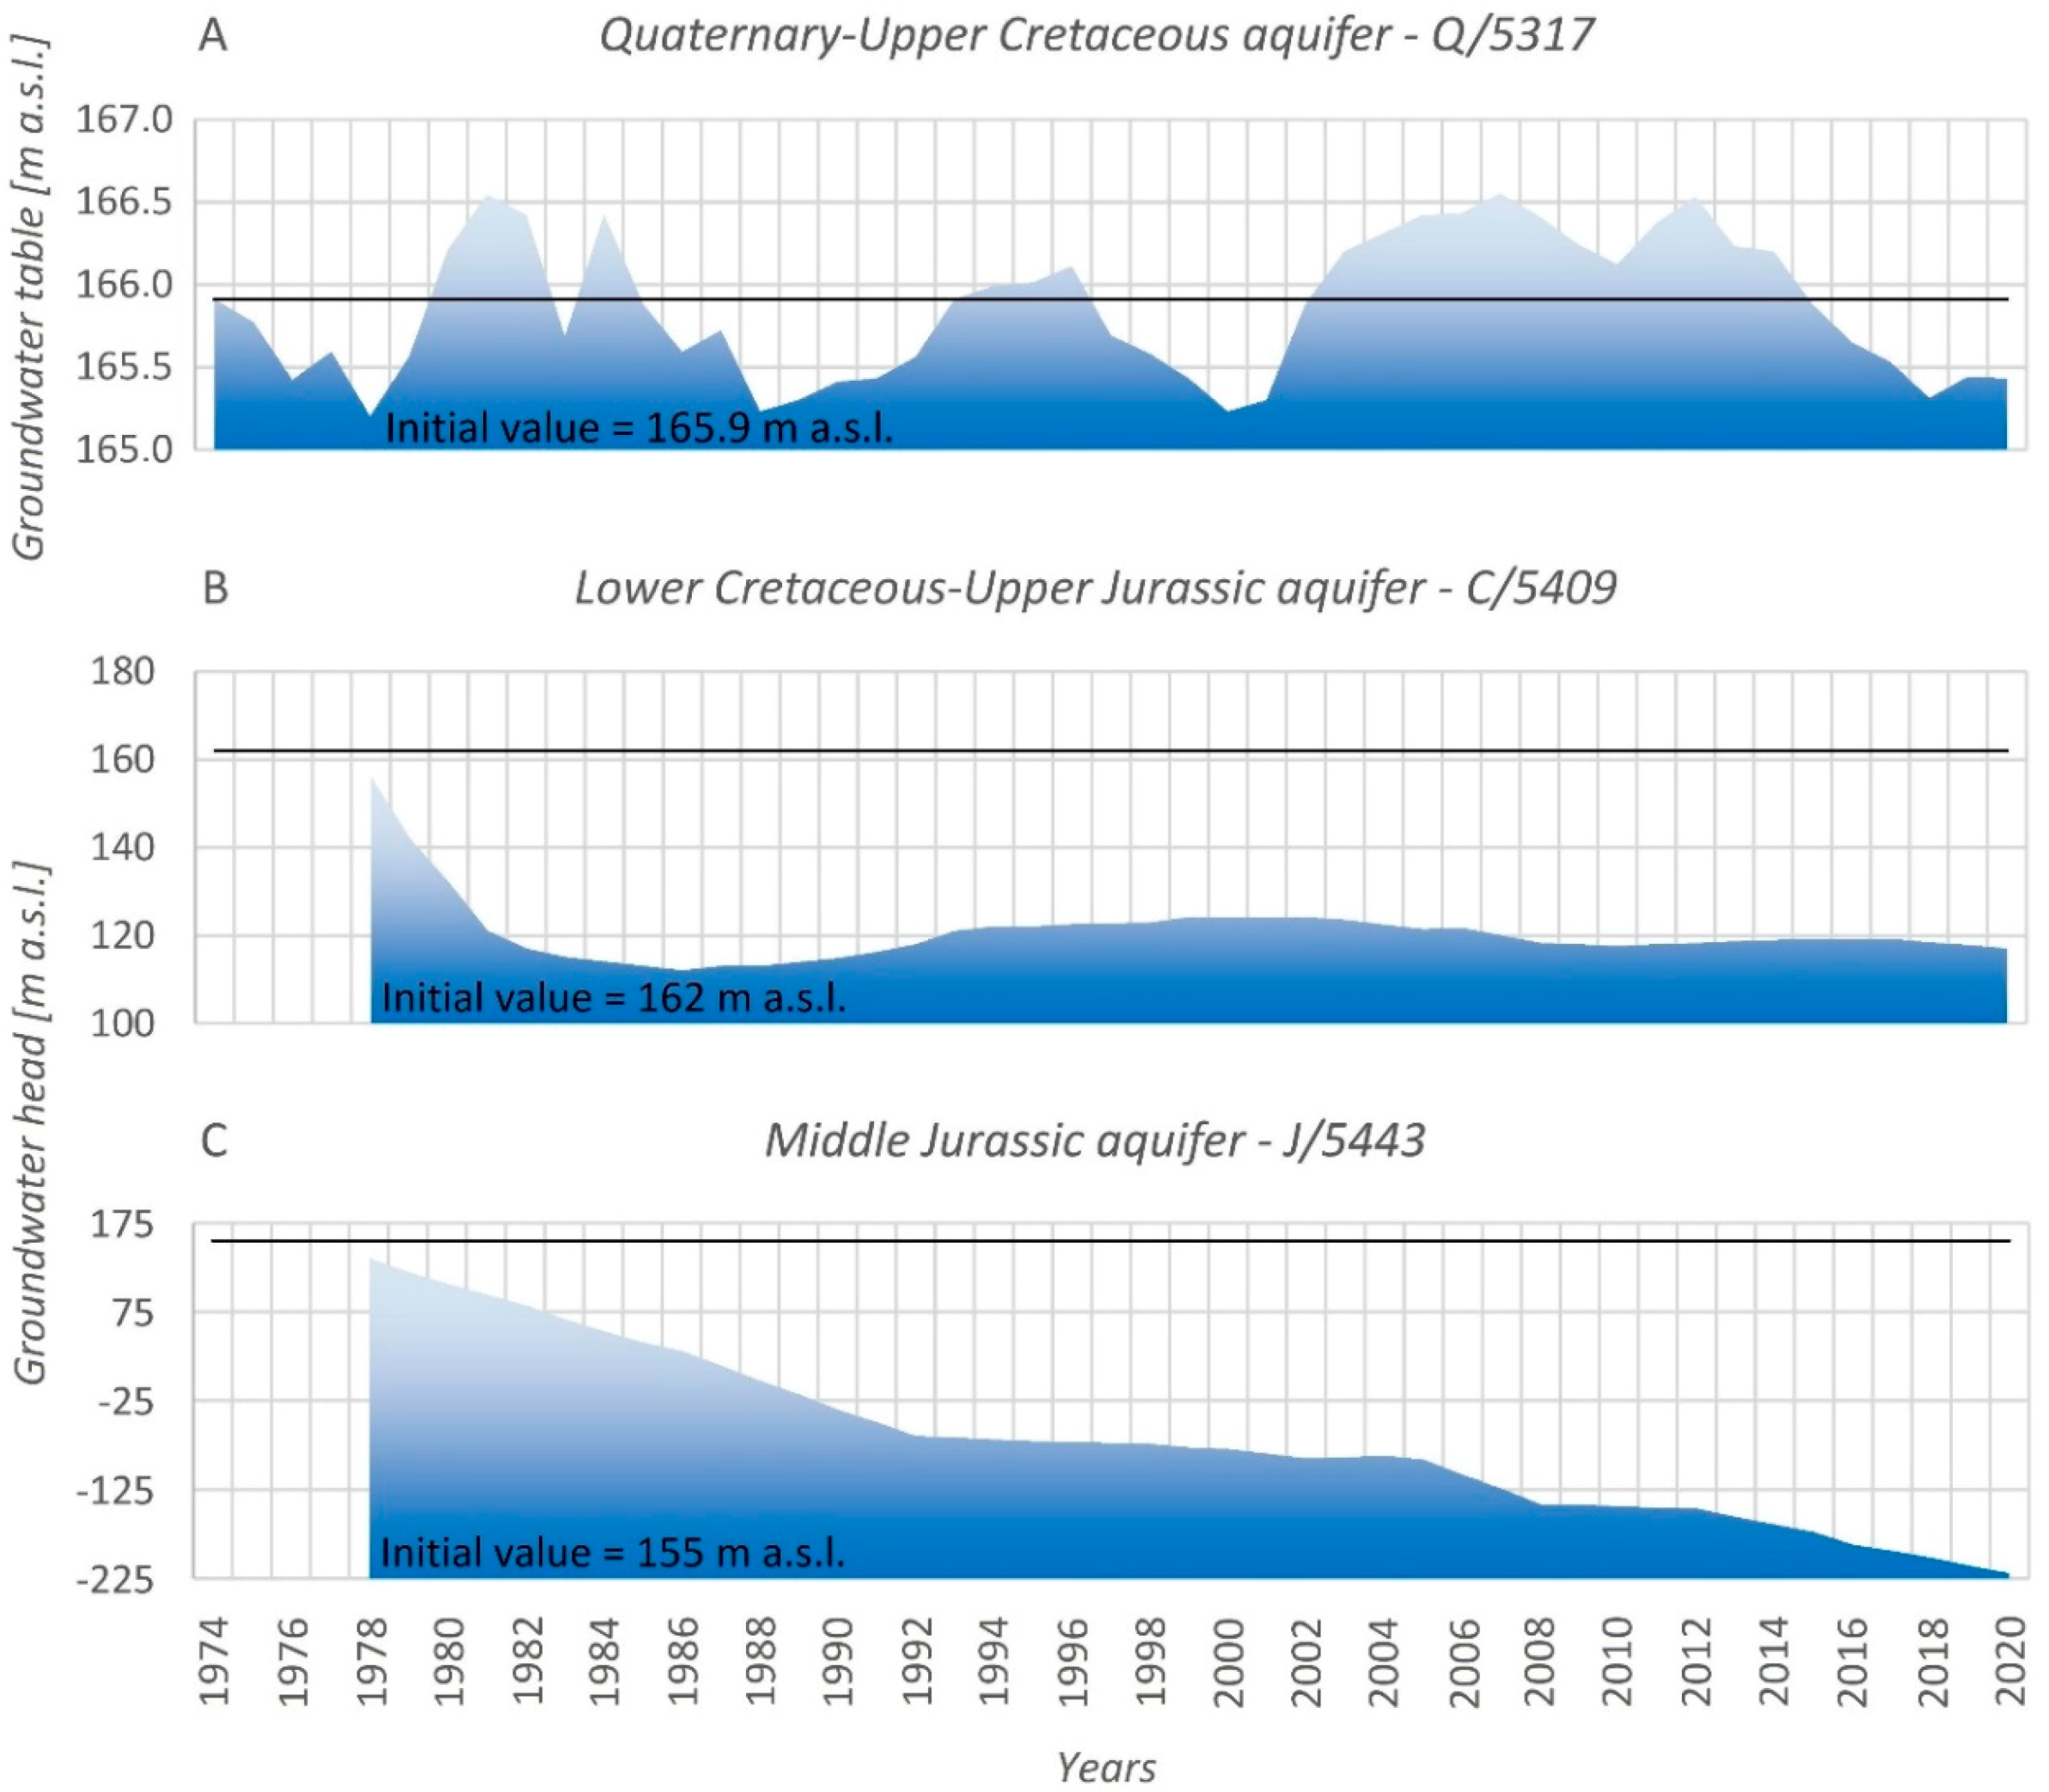
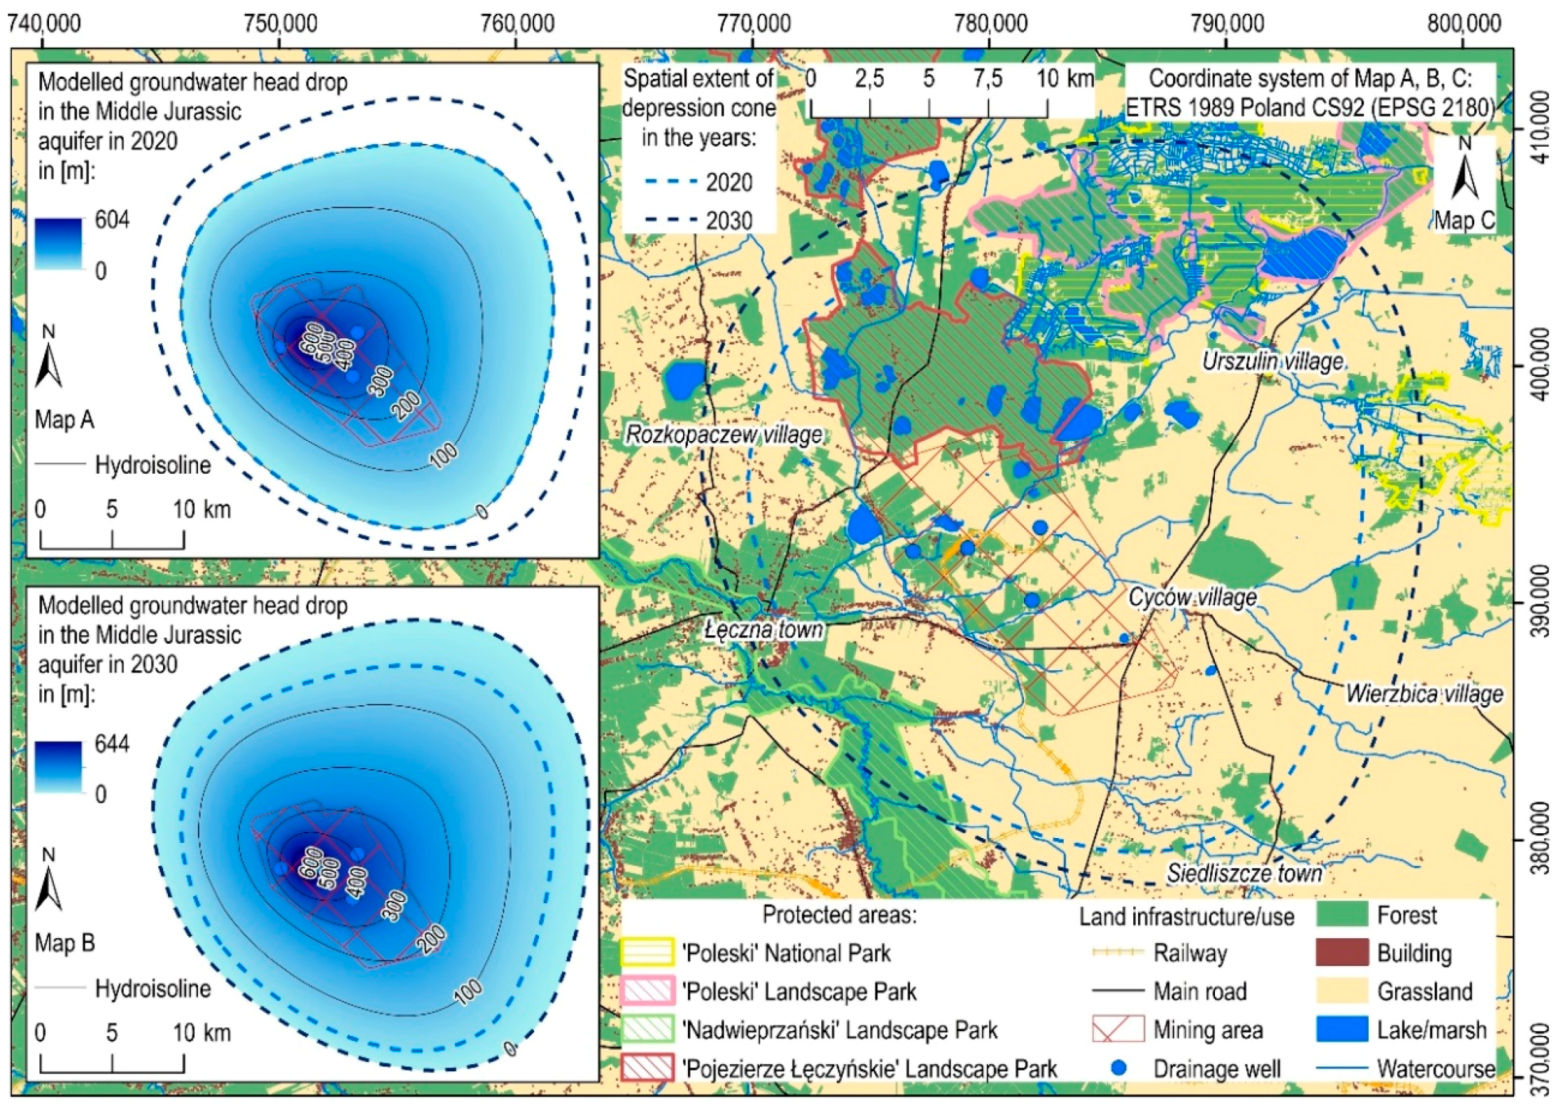
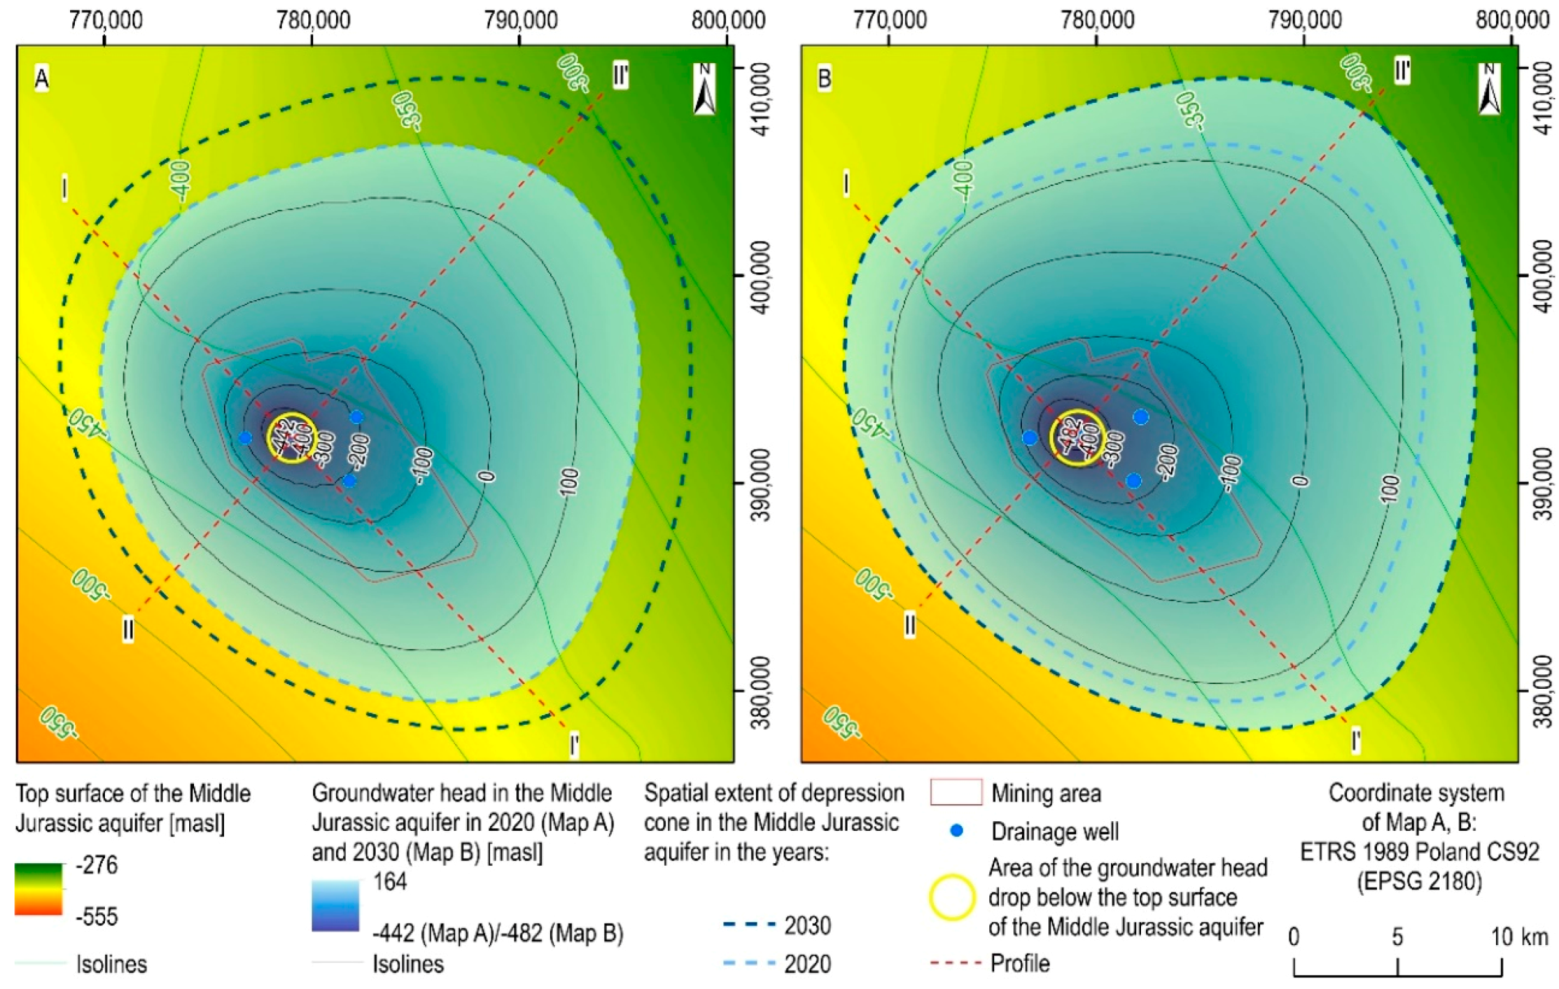
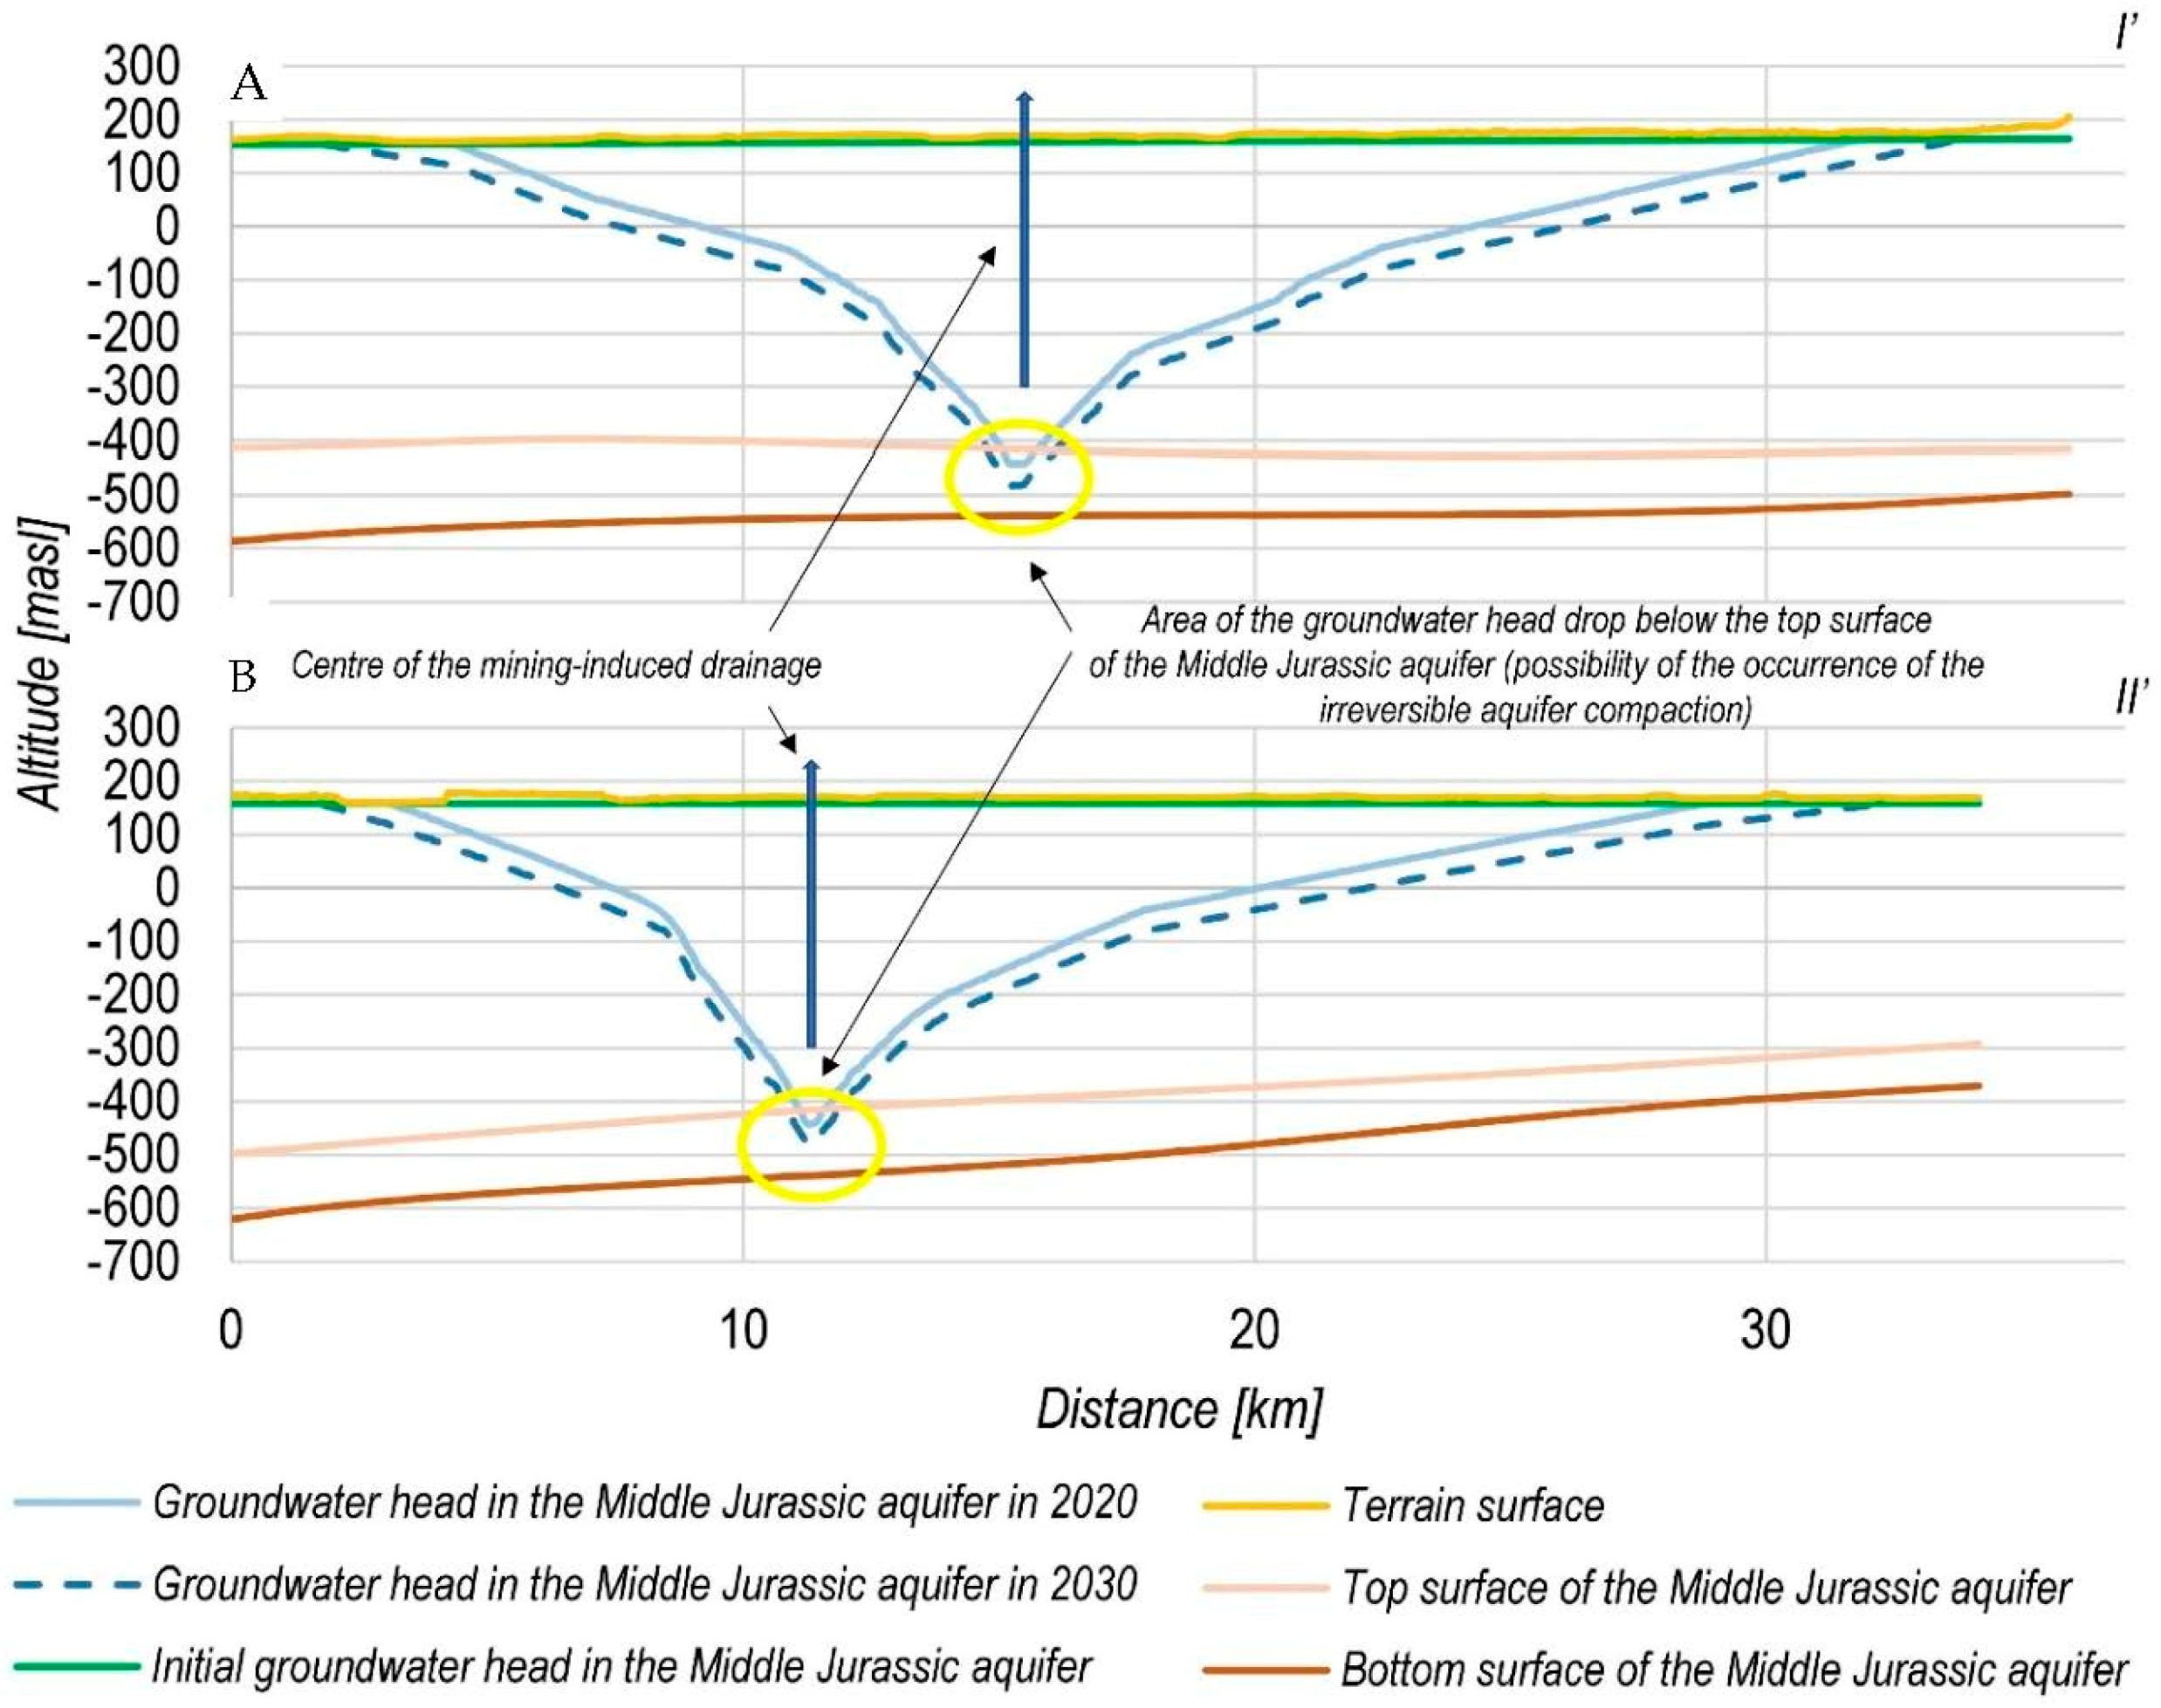
Table 1.
Lithology and thickness (m) of the geological strata in the study area in selected boreholes B1-B4 (see Figure 1 for boreholes location); source of data: the Polish Geological Institute-National Research.
Table 1.
Lithology and thickness (m) of the geological strata in the study area in selected boreholes B1-B4 (see Figure 1 for boreholes location); source of data: the Polish Geological Institute-National Research.
| Type | Unit | Lithology | B1 | B2 | B3 | B4 |
|---|---|---|---|---|---|---|
| Geological strata | Quaternary | Loose sand, gravel, clay | 6 | 31 | 15 | 14 |
| Chalk | Limestone, marlstone, dolomite, sandstone | 512 | 446 | 512 | 412 | |
| Jura | Limestone, dolomite, sandstone | 82 | 113 | 101 | 75 | |
| Westphalian | Black coal, sandstone | 254 | 222 | 301 | 156 | |
| Namurian C | Sandstone, siltsone | 354 | 301 | 341 | 222 | |
| Namurian B | Sandstone, siltsone, claystone | 81 | 88 | 65 | 102 | |
| Namurian A | Claystone, limestone, marlstone | 74 | 92 | 78 | 100 |
Table 2.
Lithology and thickness (m) of the aquifers in the study area in selected boreholes B1–B4 (see Figure 1 for boreholes location); source of data: the Polish Geological Institute-National Research.
Table 2.
Lithology and thickness (m) of the aquifers in the study area in selected boreholes B1–B4 (see Figure 1 for boreholes location); source of data: the Polish Geological Institute-National Research.
| Type | Unit | Lithology | B1 | B2 | B3 | B4 |
|---|---|---|---|---|---|---|
| Aquifer | Quaternary-Upper Cretaceous | Silty sand, clayey sand, poorly graded sand | 2.0 | 10.5 | 6.6 | 4.7 |
| Lower Cretaceous-Upper Jurassic | Silty sand, shale, karstic limestone | 0.3 | 1.9 | - | 2.5 | |
| Middle Jurassic | Silty sand, shale, karstic limestone and siltstone | 65.1 | 71.8 | 56.7 | 48.4 | |
| Carboniferous | Karstic limestone, siltstone and claystone | 3.8 | - | 4.4 | 4.1 |
Table 3.
Summary of the final values of hydraulic parameters of each model layer used in the simulation.
Table 3.
Summary of the final values of hydraulic parameters of each model layer used in the simulation.
| Model Layer | Horizontal Hydraulic Conductivity (m/s) | Vertical Hydraulic Conductivity (m/s) | Storage Coefficient |
|---|---|---|---|
| Aquitard 1 | 6.16 × 10⁻⁹ | 9.22 × 10⁻⁹ | 0.048 |
| Aquifer 1 | 3.25 × 10⁻⁶–3.73 × 10⁻⁶ | 1.03 × 10⁻⁷–1.49 × 10⁻⁷ | 0.022 |
| Aquitard 2 | 4.31 × 10⁻⁸–5.03 × 10⁻⁸ | 3.25 × 10⁻⁹–3.73 × 10⁻⁹ | 0.045 |
© 2020 by the authors. Licensee MDPI, Basel, Switzerland. This article is an open access article distributed under the terms and conditions of the Creative Commons Attribution (CC BY) license (http://creativecommons.org/licenses/by/4.0/).
Share and Cite
MDPI and ACS Style
Guzy, A.; Malinowska, A.A. Assessment of the Impact of the Spatial Extent of Land Subsidence and Aquifer System Drainage Induced by Underground Mining. Sustainability 2020, 12, 7871. https://doi.org/10.3390/su12197871
AMA Style
Guzy A, Malinowska AA. Assessment of the Impact of the Spatial Extent of Land Subsidence and Aquifer System Drainage Induced by Underground Mining. Sustainability. 2020; 12(19):7871. https://doi.org/10.3390/su12197871
Chicago/Turabian StyleGuzy, Artur, and Agnieszka A. Malinowska. 2020. "Assessment of the Impact of the Spatial Extent of Land Subsidence and Aquifer System Drainage Induced by Underground Mining" Sustainability 12, no. 19: 7871. https://doi.org/10.3390/su12197871
Note that from the first issue of 2016, this journal uses article numbers instead of page numbers. See further details here.