Influence of the Composition on the Environmental Impact of a Casting Magnesium Alloy
by
 , , ,
, , ,
Isabel García Gutiérrez
1 ,
,
Daniel Elduque
1,*,
Carmelo Pina
2,
Rafael Tobajas
1 and
Carlos Javierre
1 1
i+AITIIP, Department of Mechanical Engineering, University of Zaragoza EINA, María de Luna 3, 50018 Zaragoza, Spain
2
BSH Electrodomésticos España, S.A., Avda. de la Industria, 49, 50016 Zaragoza, Spain
*
Author to whom correspondence should be addressed.
Sustainability 2020, 12(24), 10494; https://doi.org/10.3390/su122410494
Submission received: 9 October 2020
/
Revised: 9 December 2020
/
Accepted: 12 December 2020
/
Published: 15 December 2020
(This article belongs to the Collection Sustainability in Product Development)
Abstract
:The influence of the composition of magnesium alloys on their environmental impact was analyzed. In order to perform a more accurate environmental impact calculation, life cycle assessment (LCA) with the ReCiPe 2016 Endpoint and IPCC 2013 GWP (100 y) methodology was used, taking the EcoInvent AZ91 magnesium alloy dataset as reference. This dataset has been updated with the material composition range of several alloys included in the European standard EN 1753:2019. The balanced, maximum, and minimum environmental impact values were obtained. In general, the overall impact of the studied magnesium alloys varied from 3.046 Pt/kg to 4.853 Pt/kg and from 43.439 kg CO2 eq./kg to 55.427 kg CO2 eq./kg, depending on the composition. In the analysis of maximum and minimum environmental impacts, the alloy that had the highest uncertainty was 3.5251, with a range of ±7.20%. The element that contributed the most to increase its impact was silver. The AZ91 alloy, provided by the EcoInvent dataset, had a lower environmental impact than all the magnesium alloys studied in this work. The content of critical raw materials (CRMs) was also assessed, showing a high content in CRMs, between 89.72% and 98.22%.
1. Introduction
Environmental challenges are increasingly recognized as a serious, worldwide, public concern [1,2]. The accelerated decline in the environmental quality; the intensive use of resources; the contamination of air, water, and soil; and global warming or waste accumulation are just some of these environmental challenges that can be considered as a global priority [3].
Any product, process, or service has an environmental impact, which can occur throughout its entire life cycle. It is essential to adopt an environmentally conscious perspective at the first phase of the product design and development, in order to minimize these impacts [4,5,6].
In the 1990s, the concept of ecological design was first adopted by many companies [7], with the main objective of assuming the environmental responsibility of their products and organizational systems throughout their life cycle [8]. Ecodesign is defined by International Organization for Standardization (ISO) 14006:2011 as the integration of environmental aspects into product design and development to reduce adverse environmental impacts throughout a product’s life cycle [9].
European policies have opted for the incorporation of an ecological design in their countries [10]. There is an extensive legislative proposal of the European Union, which offers tools and incentives commensurate with this model: establishing the ecodesign requirements for energy products (Energy-Using Products (EuP) Directive 2005/32/EC [11] and Energy-Related Products (ErP) Directive 2009/125/EC [12]) or reducing the use of chemical substances and products (Restriction of Hazardous Substances (RoHS) 2002/95/EC [13] and Registration, Evaluation, Authorisation and Restriction of Chemicals (REACH) 1907/2006 [14]).
Moreover, several standards have been created in order to introduce environment-friendly criteria in the design and development of products (ISO 14006:2011 [9] and International Electrotechnical Commission (IEC) 62430:2019 [15]). Integrating sustainability aspects into product innovation could acquire a strategic perspective [16]. Therefore, ecodesign should not be a separate activity, but it should be conceived as an integral part of the existing management system in an organization [17,18], such as the ones created to support the conformity of quality standards (ISO 14001:2015 [19] and ISO 9001:2015 [20]).
Life cycle assessment (LCA) is an adequate methodology to identify, quantify, and analyze the environmental impacts of a material, process, product, or service and to identify the main environmental adverse aspects throughout the life cycle [21,22]. ISO standards 14040 and 14044 establish the principles, framework, requirements, and guidelines to perform an LCA [23,24].
LCA has been applied to a wide range of sectors, processes, and products, such as mining processes [25], galvanized sheet production [26], Polylactic acid (PLA) bottle shaping [27], portable power banks [28], pavements [29], LED luminaries [30,31], and solar photovoltaic panels [32]. LCA has also been applied to the production of specific materials, for example, ferroniobium [33], zircon sand [34], copper [35], manganese alloys [36], and solvents [37].
Material selection is an essential area in the design and development stage of a product. It is necessary to consider simultaneously, among other important aspects, functional, productive, economic, and logistical criteria in order to select the material that best suits the requirements sought [38]. In terms of ecodesign, the environmental impact is a key criterion for selecting the material [39,40,41,42]. Despite the fact that cost is the main criterion adopted by many companies, a sustainabled design implies finding a balance between the economic, social, and environmental criteria [43].
This study aimed to quantify and analyze the environmental impact of the production of magnesium alloys. Magnesium alloys, due to their relatively high specific strength, high ductility, and low density [44], are used in a wide range of applications in the automotive, electronic, and biomedical sectors [45,46,47,48]. Its use implies considerable weight saving, being able to manufacture components with a weight reduction between 10% and 33% in comparison with aluminum alloys.
In the automotive sector, for example, light metals such as magnesium and aluminum alloys, have been used to produce lightweight vehicles. According to some studies, reducing the weight of the vehicles implies a reduction in fuel consumption between 0.1 L/(100 km × 100 kg) and 0.9 L/(100 km × 100 kg) [49]. This reduction in fuel consumption produces lower CO2 emissions in the atmosphere in the automobile use stage [50,51,52]. However, many lightweight materials (aluminum alloys, magnesium alloys, or carbon fiber) are comparatively more energy-intensive to produce than other conventional materials such as steel. This means that these materials, in their production stage, entail higher CO2 emissions [53,54,55,56]. However, despite the fact that the production of materials has a greater environmental impact, it is possible to compensate these emissions due to reduced fuel consumption and have an overall lower environmental impact in their life cycle [57].
It is known that many physical and mechanical properties of metals are affected by the alloying elements [58]. For example, in the case of magnesium alloys, aluminum improves strength, ductility, and melting capacity [59]; manganese allows high corrosion resistance and improves ductility and resistance [60]; lithium provides the alloy with high ductility and high tolerance for damage, and reduces the specific density of the material [61]; and rare earth metals increase both the corrosion resistance of the alloy and its mechanical strength [62].
Alloy composition plays an important role in the environmental impact of the material. A key aspect is the fact that each alloying element presents different adverse effects on the environment. In conclusion, the alloy composition modifies not only the physical and mechanical properties of the alloy, but also its total environmental impact. Several previously published studies have shown the importance of calculating the environmental impact depending on the material composition [63].
In recent years, the concept of critical raw materials (CRMs) has gained importance, specially in the European Union (EU) economy [64,65]. Critical raw materials are defined as those materials that combine:
- •
- A significant economic importance for key sectors in the European economy;
- •
- A high-supply risk due to the high level of import dependence;
- •
- A significant lack of substitutes for existing or future applications.
The European Commission first published in 2010 a list of critical raw materials for the European economy [66]. This list is reviewed and updated every three years, with the aim of considering the evolution of the market, which significantly influences the factors to ponder a material as critical.
The more recent list, published in 2020 [66], features 30 raw materials: antimony, baryte, bauxite, beryllium, bismuth, borate, cobalt, coking coal, fluorspar, gallium, germanium, hafnium, indium, lithium, magnesium, natural graphite, natural rubber, niobium, platinum group metals, phosphate rock, heavy rare earth elements, light rare earth elements, scandium, silicon metal, strontium, tantalum, titanium, tungsten, and vanadium.
Magnesium is classified as a CRM, which is significant for this study, as it supposes more than 90% of the composition of magnesium alloys. Its criticality is mainly due to absence of production of magnesium metal in the EU: the supply for the manufacturing industry entirely relies on imports from China (93%) and a few other non-EU countries, which represents supply risk [67]. In addition, magnesium metal is important in the European manufacturing sector and the competing demand from other global countries. Of all the critical materials included in the 2020 list [66], only lithium, silicon, and rare earth can be added as alloying elements of magnesium alloys.
The criticality assessment of raw materials is an arduous task, with considerable variations among the different processes that exist to identify and evaluate them [68,69,70,71]. However, the quantification of the presence of critical raw materials can be a first approximation that allows scientists and engineers to carry out a better selection of materials, taking into account minimizing the use of these materials identified as critical [72].
In this work, the calculation of the content of CRMs in magensium alloys was based on the balanced composition, explained in Section 2.4.
At present, there is no legislation that regulates the use of these materials; however, in 2019, the European Standard (EN) 45558:2019 “General method to declare the use of critical raw materials in energy-related products” [73] was published with the aim of improving the ability to reuse components or recycle materials of the products at the end of their lifespan.
Therefore, the main objectives of this work were to evaluate the environmental impact of different magnesium alloys and to analyze the influence of the different alloying elements. In addition, the critical raw materials’ content of magnesium alloys was assessed. This study intended to provide engineers and scientists with more accurate information about the environmental impacts of magnesium alloys, necessary to apply the criterion of minimum impact on the material selection stage.
2. Materials and Methods
2.1. Composition and Properties of Magnesium Casting Alloys
Magnesium is a lightweight and silvery-white metal. Although there are many techniques and manufacturing processes for magnesium, such as extrusion, rolling, stamping, or bending, this study focused on magnesium casting alloys [74,75].
In this work, eighteen magnesium alloys commonly used in cast processes were studied. Their compositions are defined in different standards, such as the European EN 1753:2019 [76] or the American Society for Testing and Materials (AA ASTM) B275-05 [77]. In this study, the European standard was used to obtain the magnesium alloy compositions. Nevertheless, as calcium is also an interesting alloying element, especially for biomedical applications [78,79,80], three additional magnesium alloys (AZ21A, AZ31A, and M1A), which have calcium content, were included in the study from the ASTM B275-05 standard [77].
2.2. Dataset Improvement Methodology for Magnesium Casting Alloys
The methodology approach taken in this study was based on the EcoInvent methodology, using the dataset “magnesium alloy, AZ91 {RER}|production” as a reference. The AZ91 magnesium alloy is the most commonly used for casting applications, typically processed via high-pressure die casting [81,82]. It contains 9.1% of aluminum and small amounts of copper, zinc, and manganese [83,84].
Table 1 shows the life cycle inventory (LCI) of the production of 1 kg of AZ91 magnesium alloy, as characterized by EcoInvent [83]. EcoInvent obtains magnesium alloy production data from previous inventory studies [84]. These studies and data are still considered valid, and are used in current versions of EcoInvent.
As can be appreciated, the total sum of input materials is 1.015 kg per kilogram of alloy produced. Following EcoInvent’s methodology, material loss of 1.5% during production is assumed. Additionally, EcoInvent dataset assumes an energy consumption of 1.510 kWh per kilogram related to the production of the magnesium alloy [83,84].
2.3. LCA Methodology
2.3.1. Goal and Scope Definition
The primary purpose of this LCA was to quantify the environmental impact of different magnesium alloys, depending on their composition. This calculation intended to analyze the influence of alloying elements in the environmental performance of magnesium alloys. The criterion used in this assessment was based on the life cycle analysis methodology and followed the stages stipulated in the international ISO 14040 and 14044 [24,25].
2.3.2. Functional Unit
The definition of the functional unit has important implications for developing an LCA. The production of 1 kg of magnesium alloy from primary materials, considering alloy composition, was taken as a functional unit in this study.
2.3.3. System Boundaries
The inputs and outputs of materials and energy must be identified in order to perform an LCA. This balance of materials and energy must be quantified throughout the different stages of the life cycle considered in the study. The methodology approach taken in this study was based on the EcoInvent methodology for the calculation of the environmental impact of the “magnesium alloy, AZ91 {RER}|production” [85].
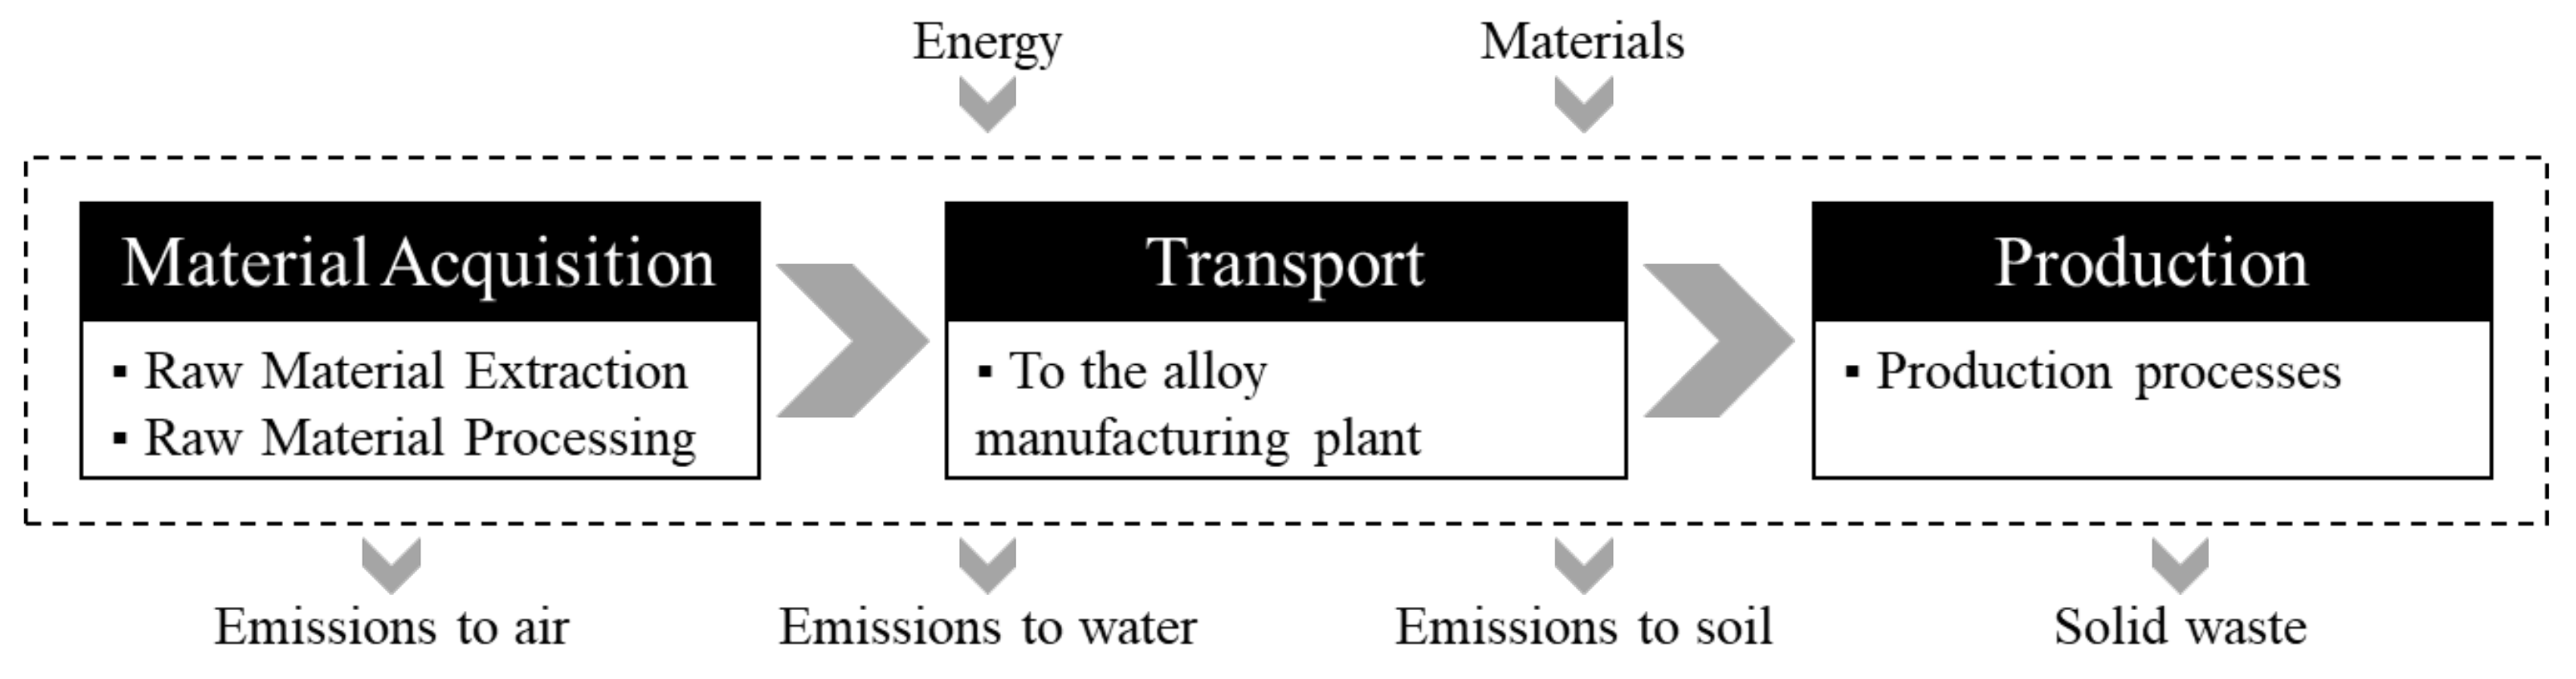
Based on the EcoInvent dataset, the life cycle stages considered in this study (Figure 1) corresponded to raw material acquisition, transport of these raw materials to the alloy manufacturing plant, and production processes for cast magnesium alloys.
- •
- Raw material acquisition included the extraction and processing of the different alloying elements that compound the magnesium alloy.
- •
- Transport of all the raw material to the alloy manufacturing plant was included in this study.
- •
- There were two aspects considered in the production stage: the energy consumption of the process and the loss of raw materials due to the inefficiencies of the manufacturing process.
2.3.4. Inventory Data and Assumptions
Once the LCI of the different alloys included in this study was established, it was necessary to make an assignment of the different alloy elements with the available EcoInvent datasets. All alloying elements were assigned to “{GLO}|market for|APOS, U” datasets in order to consider transportation from the raw material production plant to the alloy production plant as shown in Table 2. The manufacturing process of magnesium alloys was considered following the EcoInvent methodology.
It was observed that some alloying elements were not considered in the EcoInvent AZ91 magnesium alloy dataset: Silver, which represented a remarkable proportion in some of the alloys studied, and nickel, which was used in all the studied alloys except for the EcoInvent AZ91 alloy. Rare earth elements, which are added on magnesium alloys as mischmetal, were also not considered in the EcoInvent’s dataset [86]. The term mischmetal is commonly referred to as a rare earth alloy, composed of approximately 50% cerium, 25% lanthanum, and smaller amounts of neodymium and praseodymium [87]. It is noteworthy that the alloying elements included in the EcoInvent AZ91 magnesium alloy dataset were present in almost all the alloys included in this study.
Once the different alloying elements that may be part of the magnesium alloys studied had been identified, it was necessary to establish the allocation with the EcoInvent datasets. The most relevant allocations are presented in Table 2.
2.3.5. Software, Databases, and Impact Categories
The life cycle inventory was carried out through the EcoInvent v3.5 database, developed by the Swiss Centre for Life Cycle Inventories [85]. This database stands out as one of the most complete and highest quality at the European level.
The software used for carrying out this LCA was SimaPro 9.0.0.49, developed by Pré Consultants. This software allows performing an LCA with multiple methodologies of impact evaluation [88].
Finally, the LCA was calculated according to the ReCiPe 2016 Endpoint H/A (Hierarchist/Average) v1.1 and IPCC 2013 GWP (100 y) methodologies [89]. The ReCiPe 2016 methodology assesses 18 impact categories and, then, aggregates them in a single score, simplifying the interpretation of the LCA results. IPCC 2013 is a well-established methodology developed by the IPCC to calculate carbon emissions [90].
2.3.6. Sensitivity Analysis
The composition of studied magnesium alloys was obtained from the EN 1753:2019 [76] standard. The composition is given by the standard as a range with a maximum and minimum content of each alloying element.
For each magnesium alloy, the average composition was obtained, establishing for each alloying element the balanced value between the minimum and maximum values provided by the standard. This balanced composition allowed to obtain an average impact as a reference result for the study.
Nevertheless, due to the characterization of the composition as a range of values and in order to develop a sensitivity analysis, two additional compositions were obtained, according to the methodology previously established by another study about the quantification of the environmental impact of aluminum alloys [91]:
- •
- Minimum impact composition: This composition provides the lowest impact of the alloy. To that end, the highest content is assigned to those alloying elements with the lowest environmental impact.
- •
- Maximum impact composition: This composition provides the highest impact of the alloy. To that end, the highest content is assigned to those alloying elements with the highest environmental impact.
The minimum and maximum values provided by the EN 1753:2019 [76] standard were conveniently preserved during the establishment of the compositions mentioned above.
Consequently, despite the balanced environmental impact value, this sensitivity analysis allowed to obtain the uncertainty of this value due to the composition range of magnesium alloys.
It should be noted that these compositions were calculated based on the unit impact data of the different alloying elements. Therefore, both compositions used to calculate the maximum and minimum environmental impacts must be obtained for both the ReCiPe 2016 and IPCC 2013 methodologies.
2.4. Life Cycle Inventory
Life cycle inventories of each magnesium alloy included in the study were developed, including the one that corresponded to the EcoInvent dataset of AZ91 magnesium alloy, considering, as mentioned in Section 2.2, raw materials and production processes.
As for raw material composition, it varied depending on the composition range established by the standards. Table 3 presents a detailed inventory of the different magnesium alloys included in this study, showing the average value of composition between maximum and minimum ranges established by the standards. The total sum of raw materials corresponded to the amount of 1.015 kg per kg of alloy produced, according to the LCI established by EcoInvent for AZ91 magnesium alloy production.
Regarding the manufacturing process, an energy consumption of 1.51 kWh is considered in the AZ91 EcoInvent dataset. Nevertheless, to assess the manufacturing process impact, the energy consumption was calculated based on the specific heat and heat of fusion of the alloys, and the empirical Neumann–Kopp rule [92,93]. The 1.51 kWh/kg data was proportionally related to the energy required for AZ91 alloy production and extrapolated for each alloy considered in the study [94].
3. Results
Life cycle inventories shown in Section 2.4 were used to establish the different life cycle assessments and to calculate the environmental impact of the magnesium alloys analyzed. Due to the fact that alloy compositions were given by the standards as a range with a maximum and minimum content of each alloying element, the balanced environmental impact values will be analyzed first, followed by a sensitivity analysis to assess the maximum and minimum environmental impacts of magnesium alloys.
3.1. Analysis of the Balanced Environmental Impact of the Magnesium Alloys
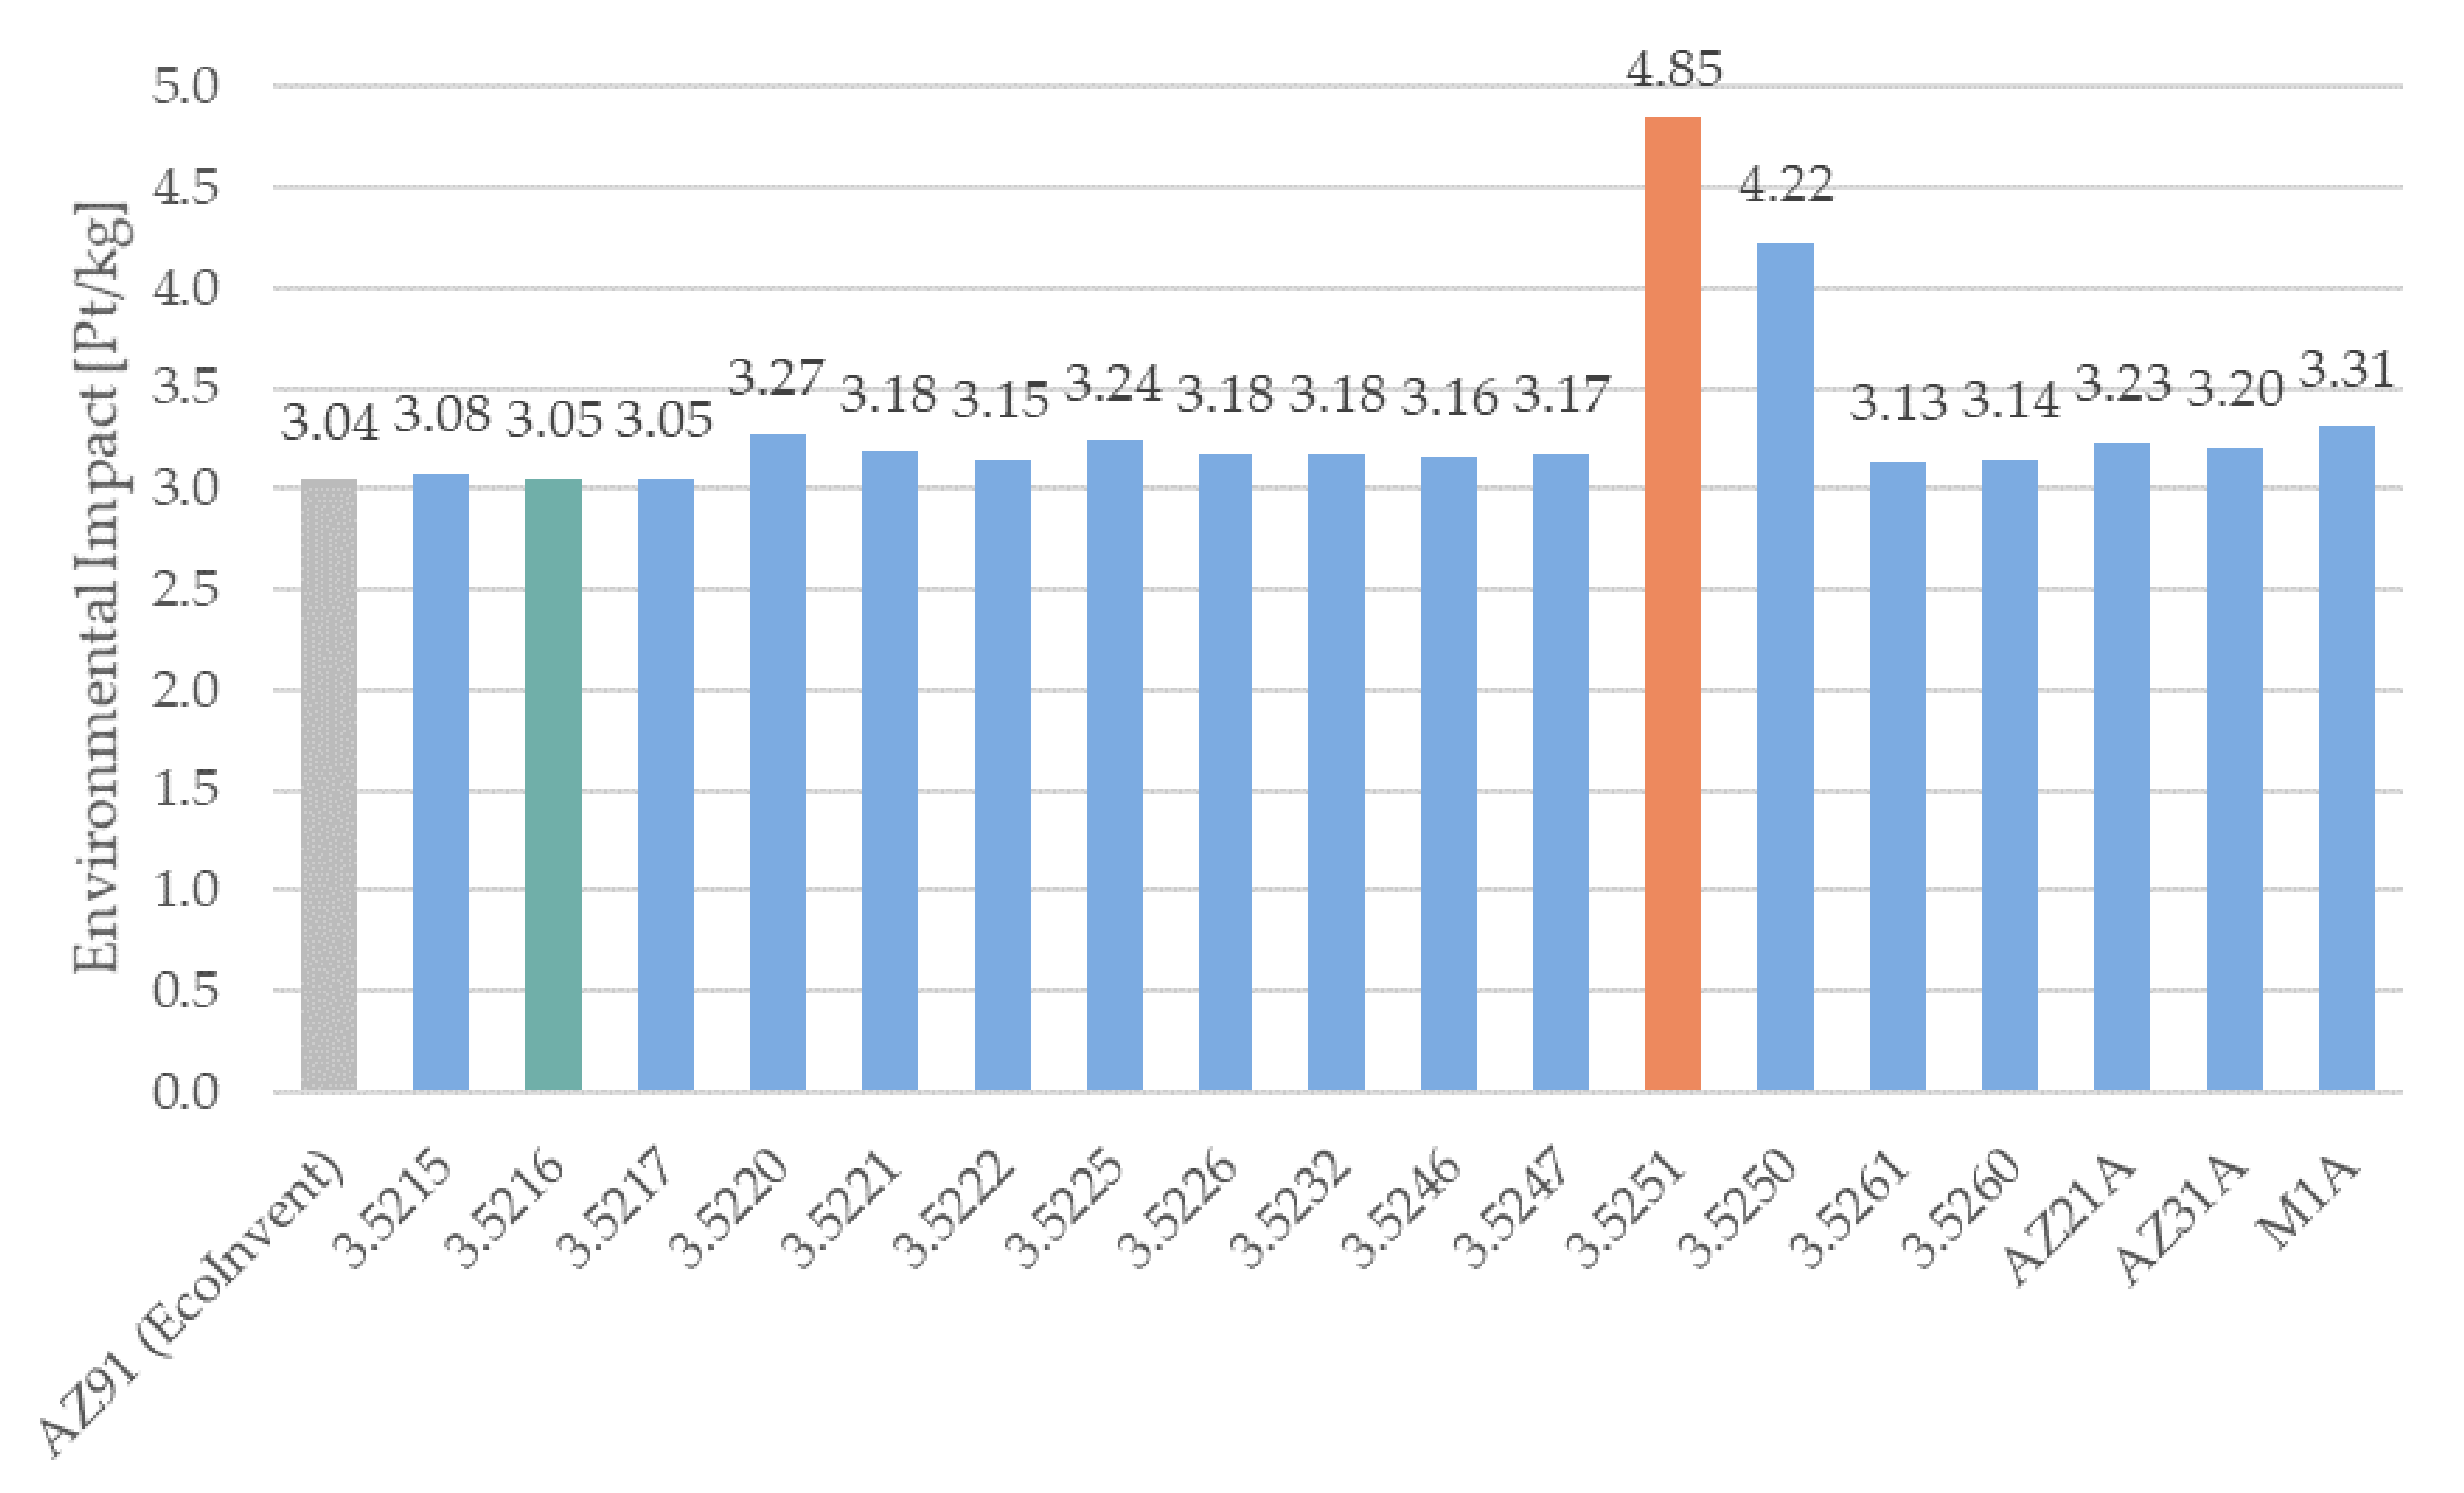
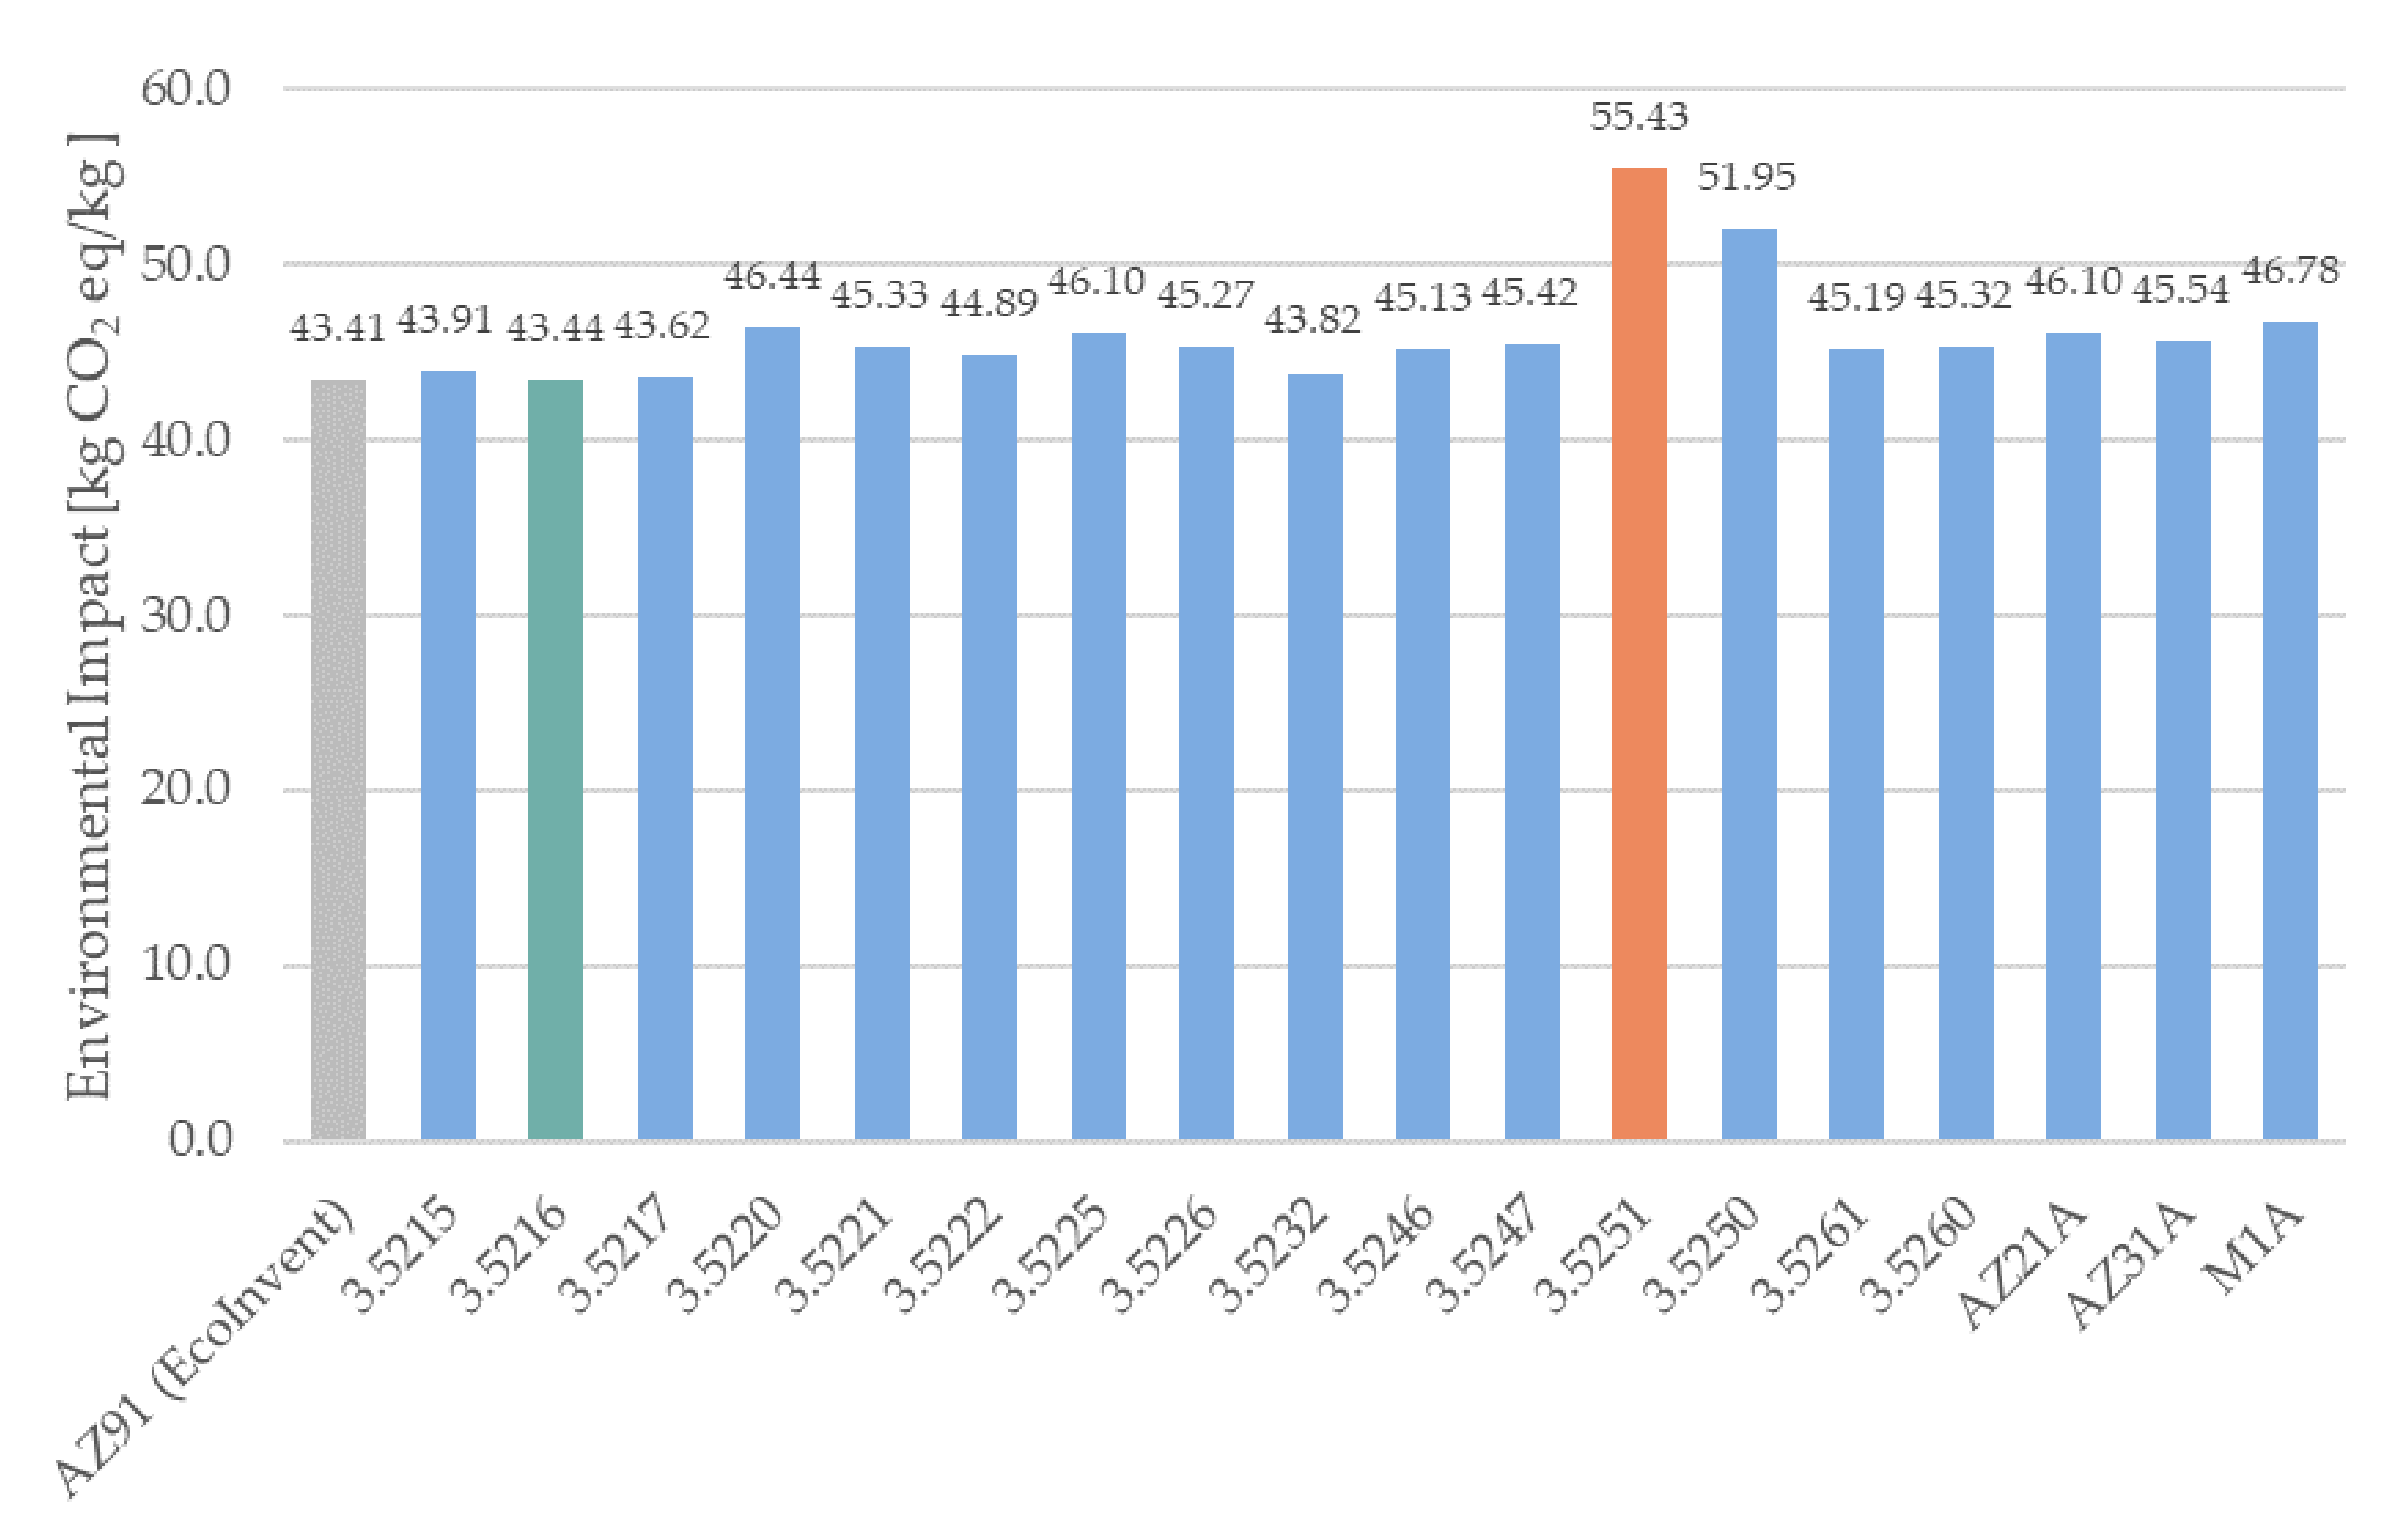
Balanced environmental impact values, according to material inputs shown in Table 3, were calculated. Figure 2 and Figure 3 present the results obtained according to the ReCiPe 2016 methodology and the IPCC 2013 methodology in points per kilograms (Pt/kg) of CO2 equivalent per kilogram (kg CO2 eq./kg), respectively.
From this data, it can be seen that, by far, the most significant environmental impact according to both methodologies was produced by the 3.5251 magnesium alloy, with 4.853 Pt/kg and 55.427 kg CO2 eq./kg, followed by the 3.5250 magnesium alloy with 4.221 Pt/kg and 51.954 kg CO2 eq./kg. The lowest environmental impact was produced by 3.5216 conforming to both methodologies, with 3.046 Pt/kg and 43.439 kg CO2 eq./kg.
Silver was the alloying element with the highest environmental impact, followed by nickel and copper according to the ReCiPe 2016 methodology and lithium for the IPCC 2013 methodology. Aluminum was present in a reasonably high proportion in some of the alloys studied (around 2.1% and 9%). Aluminum presented an environmental impact considerably lower than that of magnesium. For this reason, the use of aluminum in magnesium alloys can reduce their total environmental impact. This was the case of alloys 3.5215, 3.5216, and 3.5217, which presented an aluminum content between 7.2% and 10%. These alloys, which presented the lowest environmental impact, are general-purpose casting alloys with good mechanical properties. The alloys 3.5220, 3.5221, and 3.5222 contained aluminum, but in a smaller proportion, and had other alloying elements such as manganese. This meant a slight increase in the environmental impact, but also good ductility and toughness, and they may be used for high-pressure die casting. In general, Mg-Al series alloys have interesting applications in aerospace and automobile sectors due to their advantages of low density, high specific strength, and excellent dimensional stability [95]. However, bauxite and aluminum are still considered as critical raw materials for the European Union, despite having considerably less impact, due to their high supply risk. Although certain aspects related to the use of resources are included in environmental impact calculation, the criticality and socio-economic implication are not directly a part of the LCA. The interrelation between environmental impact and criticality are currently discussed among the scientific communities [96].
The alloys 3.5225, 3.5226, 3.5232, 3.5246, and 3.5247 have better creep properties up to 150 °C. Among all of them, 3.5246 alloy presented the lowest impact. The addition of silver in 3.5251 and 3.5250 alloys improve the creep properties even more up to 250 °C and 200 °C, respectively. Nevertheless, it represented a significant increase in environmental impact.
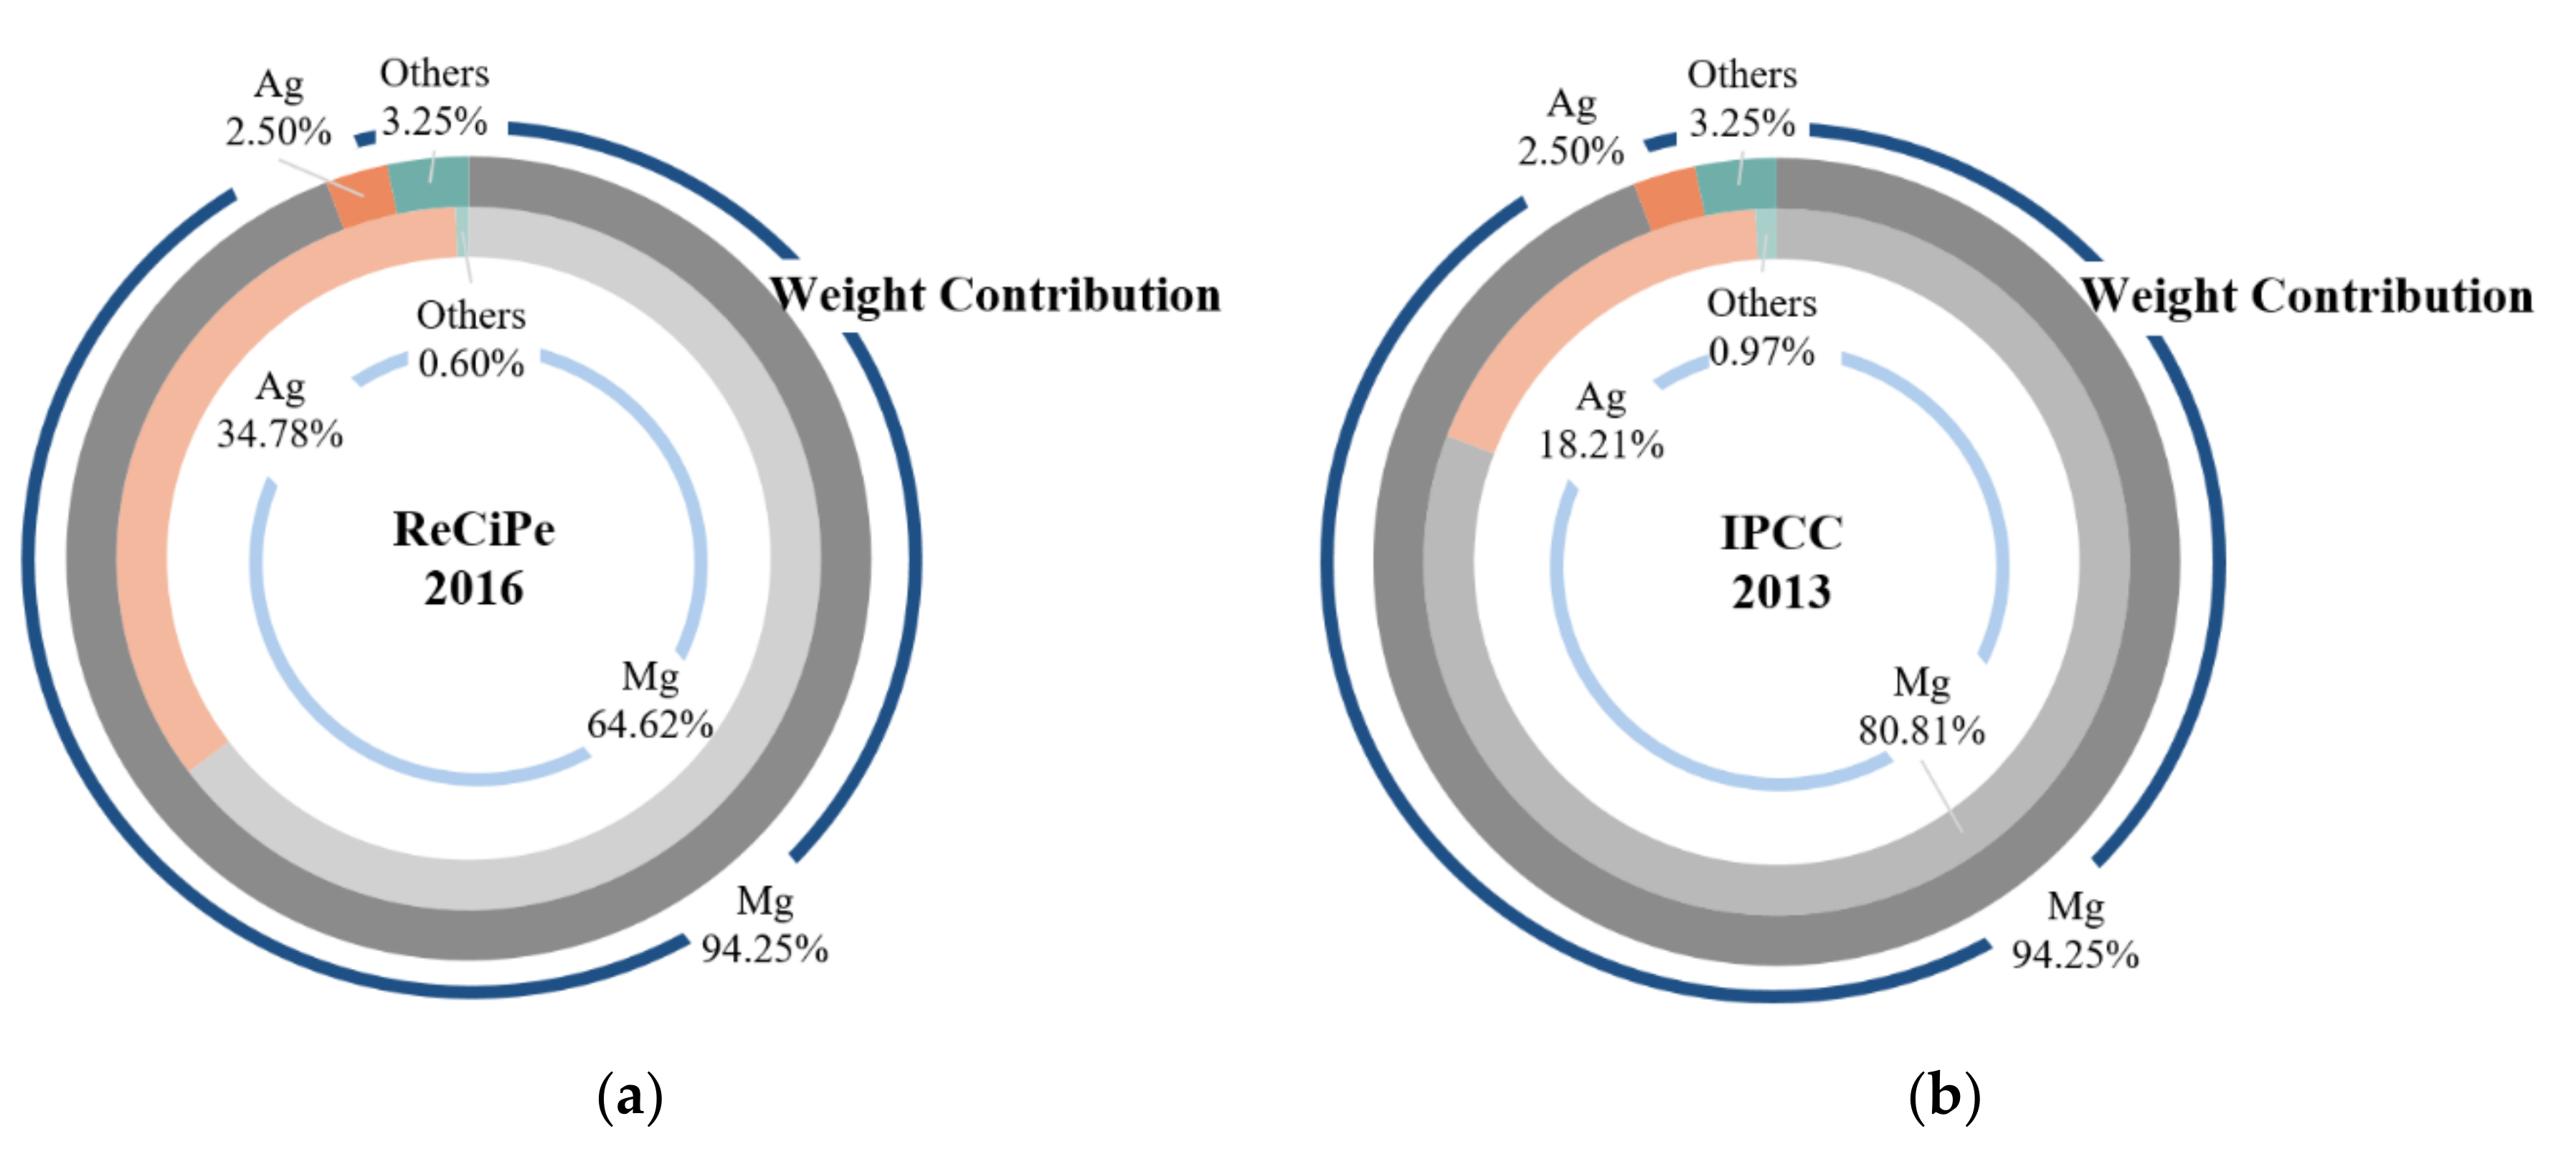
The alloy 3.5251 presented the highest environmental impact. Silver significantly contributed to this impact, not so much for its percentage, but for presenting a high environmental impact. As it can be seen from Figure 4, magnesium content represented 94.25% of the total weight, contributing to the environmental impact with 64.62% for the ReCiPe 2016 methodology and with 80.81% for the IPCC 2013 methodology. Concerning silver, the magnesium alloy contained only 2.50% of the total weight, but its impact represented 34.78% for the ReCiPe 2016 methodology and 18.21% for the IPCC 2013 methodology. Silver addition is used for increasing yield stress and ultimate strength [97], enhancing age-hardening response, and improving plastic formability [98]. In addition, silver can also improve antibacterial properties, turning it into an interesting alloying element for biomedical applications [89].
Some magnesium alloys, such as 3.5261, AZ21A, and M1A alloys, present good corrosion resistance. All of them had a moderate environmental impact, although alloy 3.5261 was the one with the lowest environmental impact. Other alloys, such as 3.5232, 3.5247, 3.5251, 3.5250, 3.5260, and M1A, present properties that allow their weldability. Among all of them, 3.5232, 3.5247, and 3.5260 were a better option from an environmental point of view.
The EcoInvent AZ91 magnesium alloy dataset produced the lowest environmental impact of all the magnesium alloys studied. This demonstrated that the AZ91 dataset provided by EcoInvent would show lower environmental impacts for all the studied alloys and, therefore, should be carefully used as a proxy if the presence of magnesium alloys is relevant. The AZ91 magnesium alloy contained 9.1% of aluminum and small amounts of zinc and manganese and had a relatively low environmental impact in both methodologies, compared with other alloying elements.
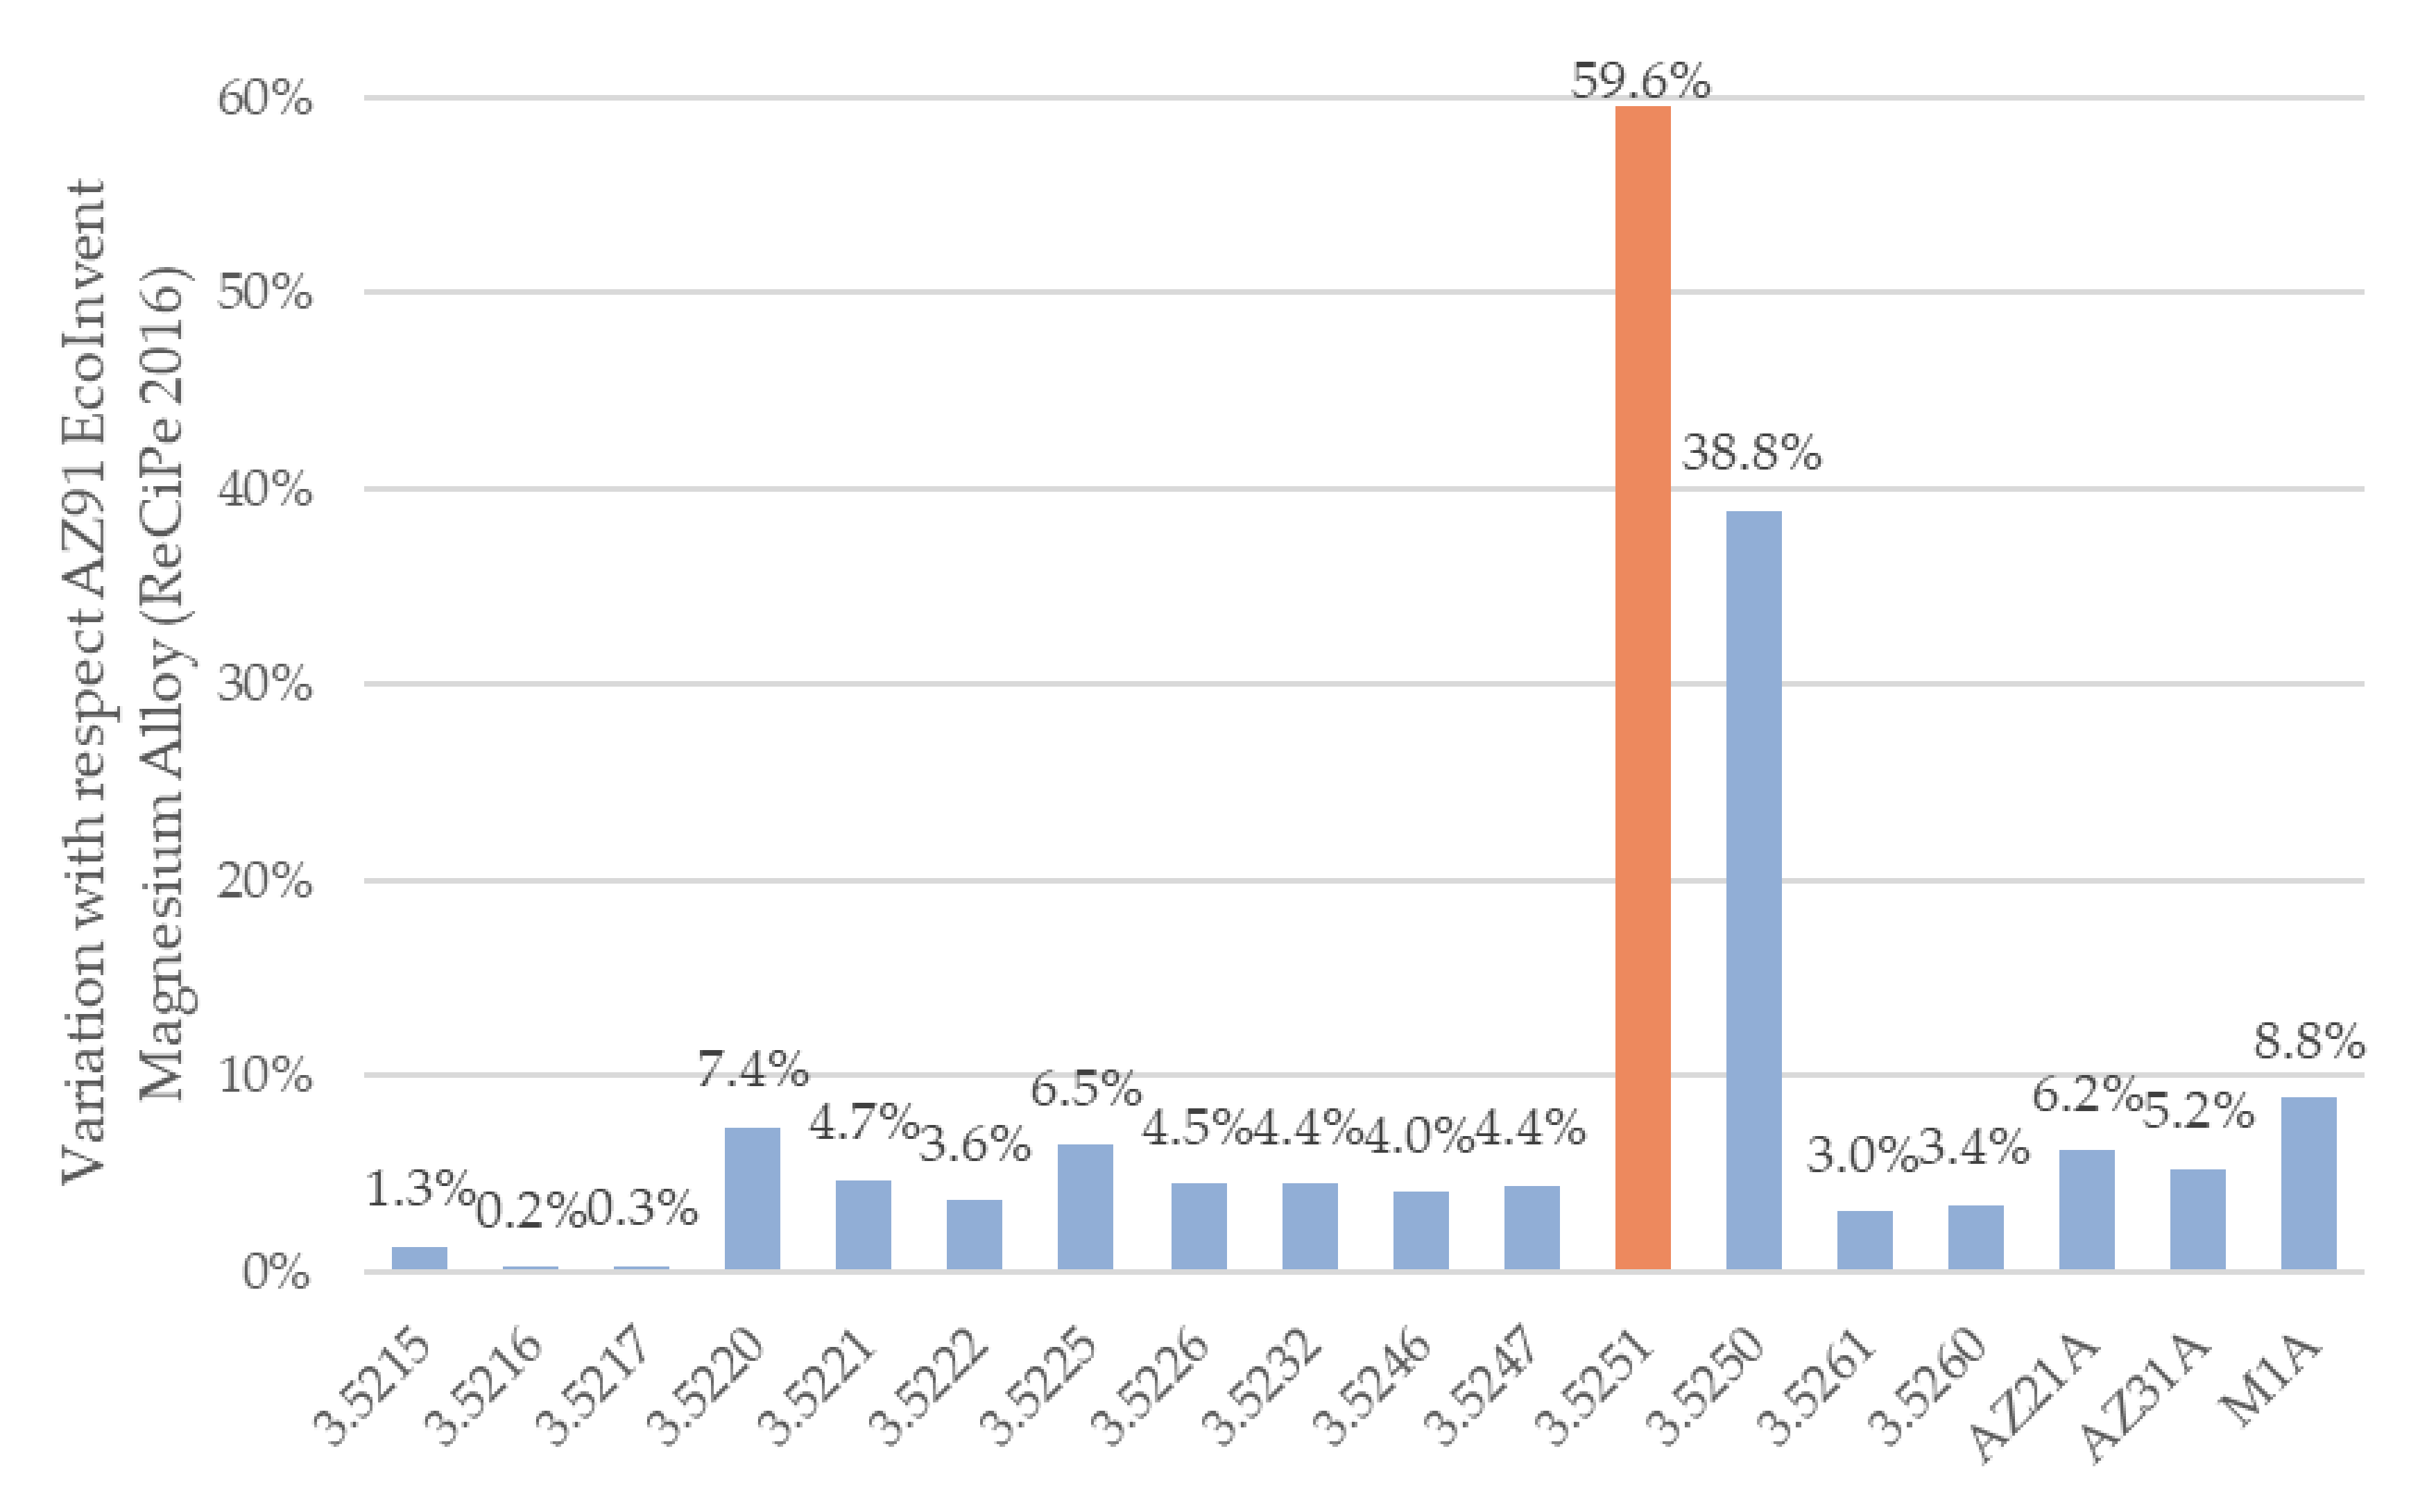
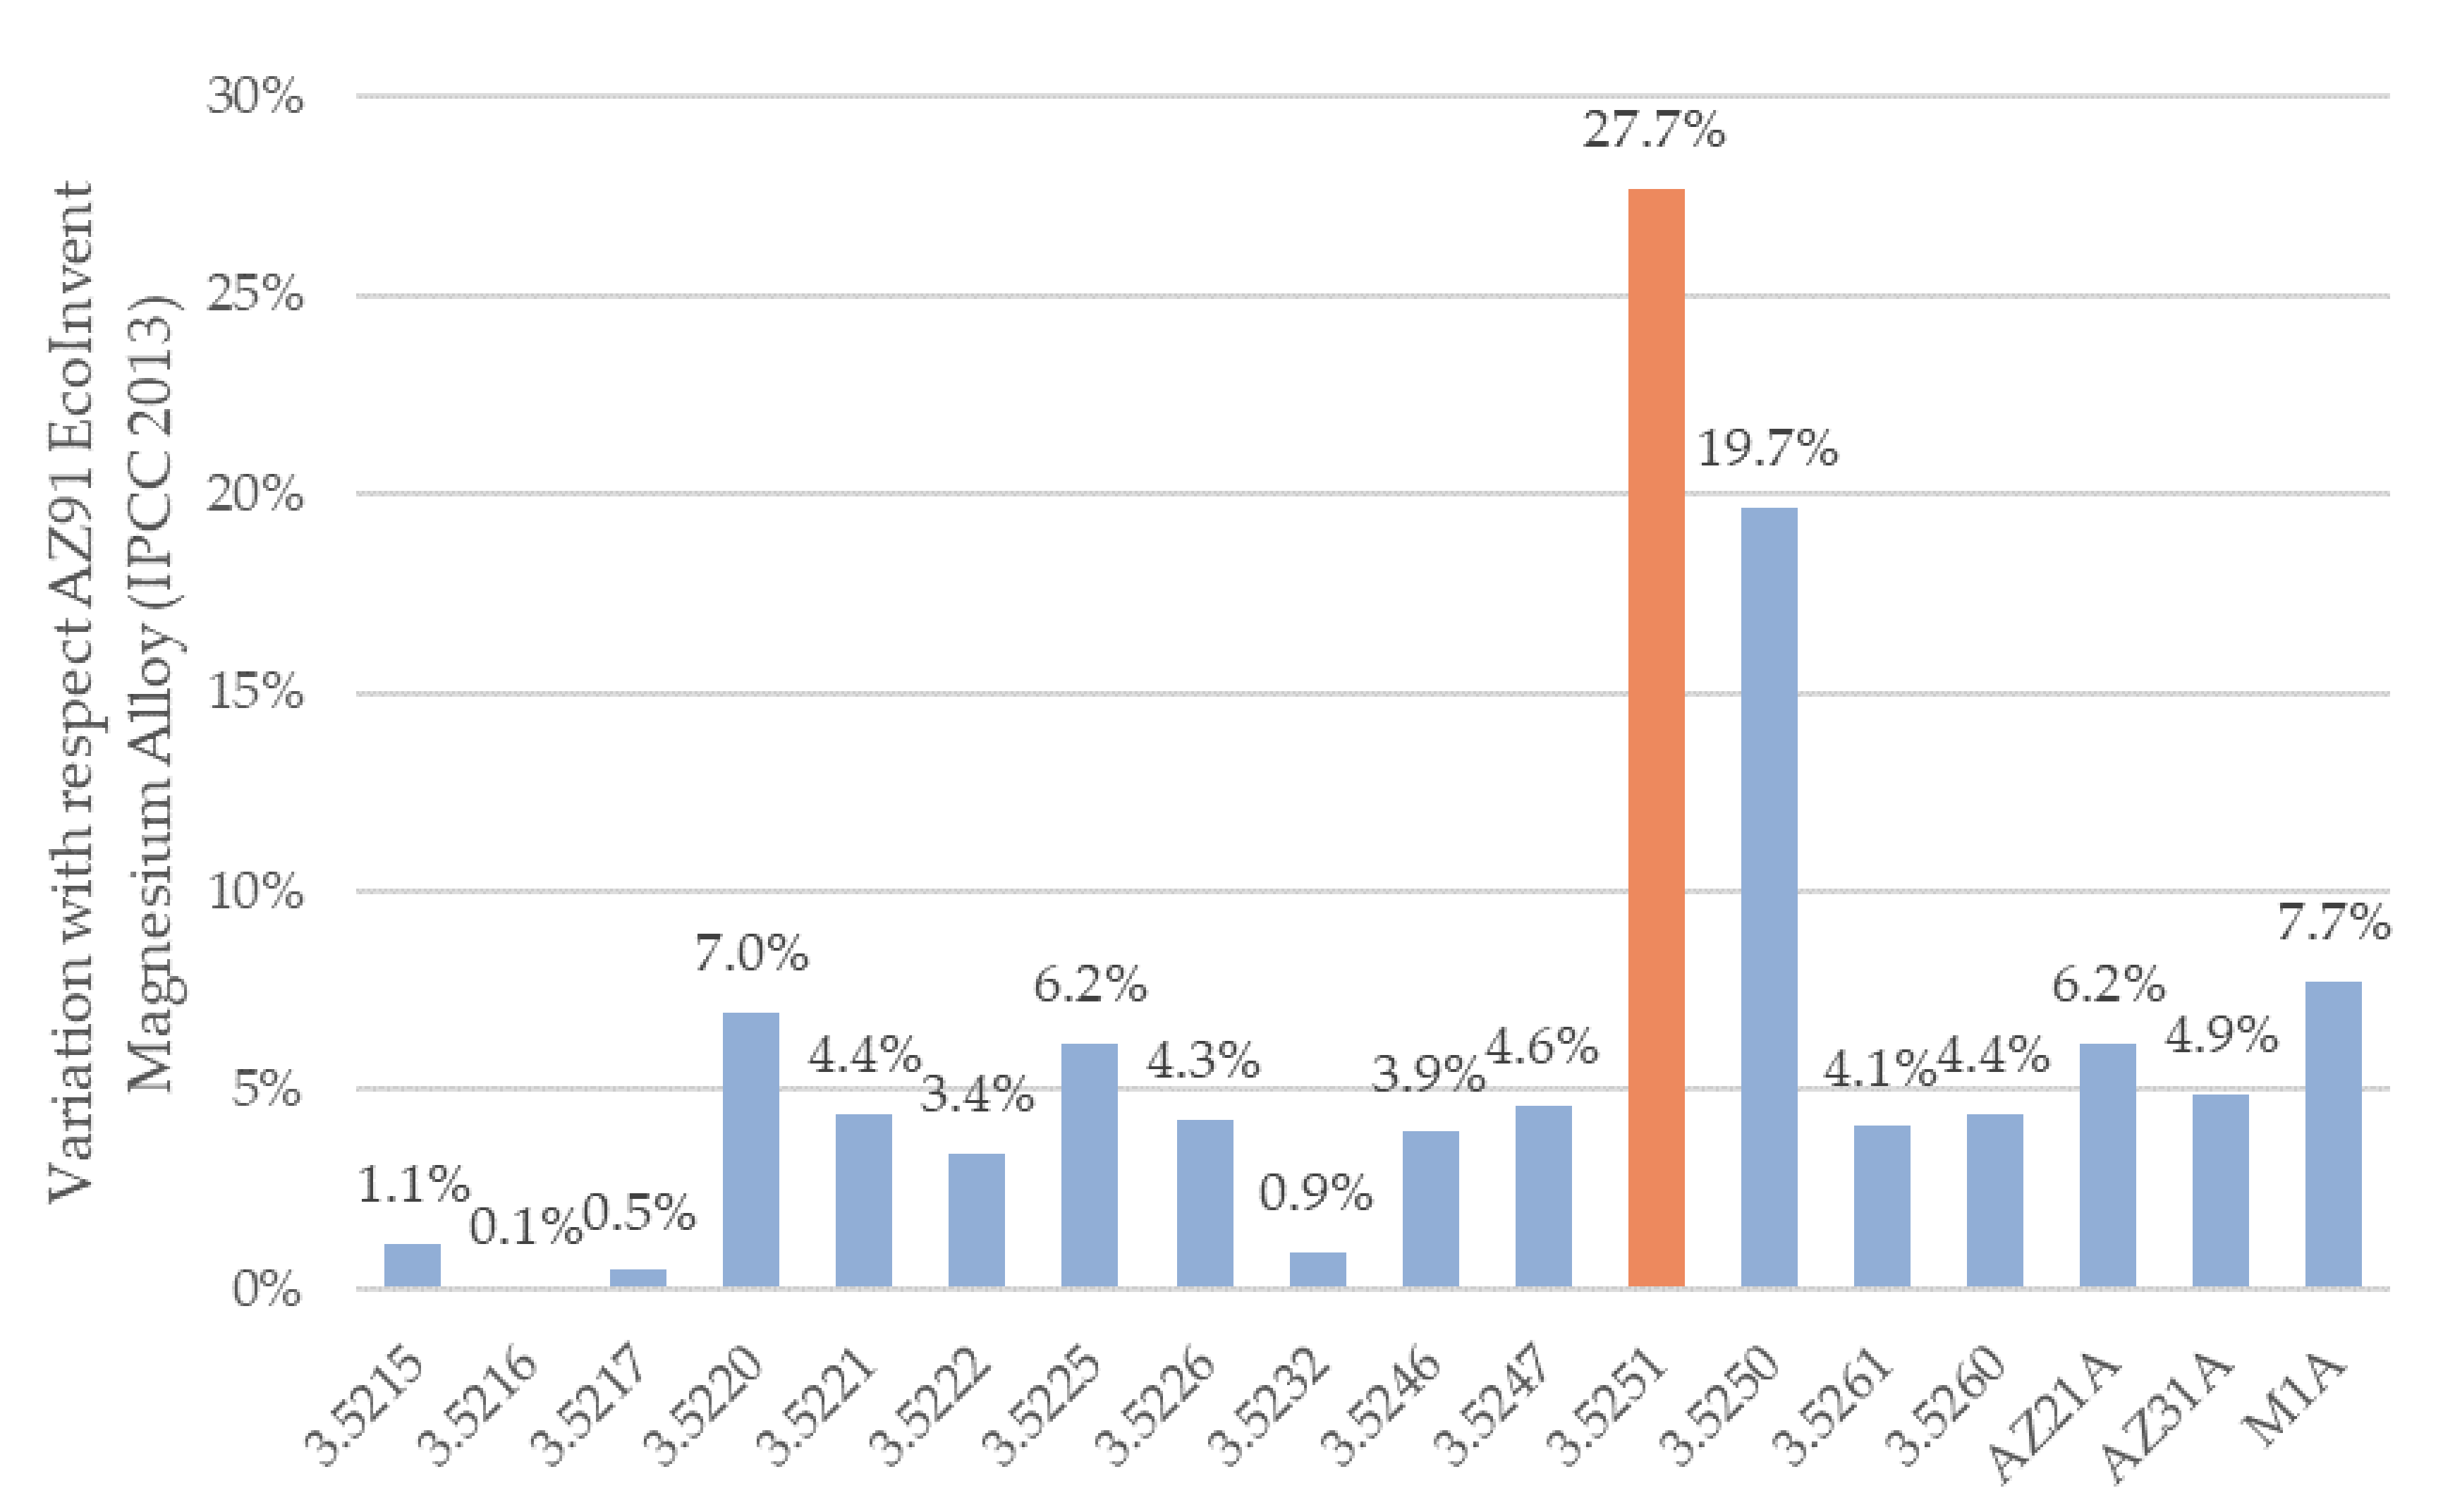
Of all the magnesium alloys included in the study, the environmental impact was within the range of 4.853 Pt/kg of 3.5251 magnesium alloy to 3.046 Pt/kg of 3.5216 magnesium alloy, which meant a variation of 59.3% as specified by the ReCiPe 2016 methodology. These same results, for the IPCC 2013 methodology, showed an environmental impact within the range of 55.426 kg CO2 eq./kg to 43.439 kg/CO2 eq./kg, which meant a variation of 27.6%.
Figure 5 and Figure 6 show the variation of the results obtained for the magnesium alloys studied, concerning the value obtained from the EcoInvent AZ91 magnesium alloy. As observed, 3.5251 and 3.5250 alloys, which included silver as an alloying element, showed a variation of 59.6% and 38.8%, respectively, for the ReCiPe 2016 methodology and 27.7% and 19.7%, respectively, for the IPCC 2013 methodology. The rest of the magnesium alloys showed a variation of no more than 8.8% for the ReCiPe 2016 methodology and 7.7% for the IPCC 2013 methodology.
3.2. Analysis of the Maximum and Minimum Environmental Impacts of the Magnesium Alloys
Once the balanced composition environmental impacts were calculated, the minimum and maximum composition impacts could be obtained. As explained in Section 2.3.6, the composition is given by the standard as a range with a maximum and minimum content of each alloying element. With respect to the sensitivity analysis, it was necessary to develop two additional compositions that will lead the maximum and minimum environmental impacts of the magnesium alloys studied. Table 4 and Table 5 show the compositions that led to maximum (Max.) and minimum (Min.) environmental impacts, according to the ReCiPe 2016 methodology and IPCC 2013 methodology, respectively.
Table 6 shows the maximum and minimum environmental impacts obtained from the magnesium alloys included in this study, according to the ReCiPe 2016 and IPCC 2013 methodologies.
The comparison between the maximum and the minimum environmental impacts showed an uncertainty between ±0.54% and ±7.20% for the ReCiPe 2016 methodology and between ±0.73% and ±3.94% for the IPCC 2013 methodology. The major difference was again noted in the 3.5251 magnesium alloy, obtaining an uncertainty from 4.503 Pt/kg to 5.202 Pt/kg according to the ReCiPe 2016 methodology and from 53.239 kg CO2 eq./kg to 57.613 kg CO2 eq./kg for the IPCC 2013 methodology. On the contrary, the 3.5220 magnesium alloy presented the smallest uncertainty of ±0.54% according to the ReCiPe 2016 methodology and ±0.73% for the IPCC 2013 methodology.
3.3. Critical Raw Material Content of Magnesium Alloys
Table 7 shows the content of CRMs of the different magnesium alloys included in the study. As expected, CRM content was high, because magnesium, the base element of magnesium alloys, is considered as critical. CRM content varied from 89.72% to 98.22%. The results of this quantification indicated that a higher content in alloying elements, other than lithium, silicon, and rare earth elements, contributes to reducing the use of critical raw materials.
4. Conclusions
Material selection is an essential area in the design and development stage of a product. In order to consider environmental concerns, assessing the environmental impacts of materials depending on their specific composition contributes to select the material that has the least adverse effect on the environment. For this purpose, this article assessed the environmental impact of magnesium alloys by considering the material composition.
The influence of the alloy composition was analyzed by means of life cycle assessment using the EcoInvent AZ91 magnesium alloy dataset as reference. In this study, eighteen magnesium alloys were assessed, whose compositions are set out in the EN 1753:2019 standard as composition ranges. For this reason, it was possible to calculate the balanced environmental impact as well as minimum and maximum environmental impacts.
The magnesium alloy 3.5251 presented the highest environmental impact with 4.853 Pt/kg and 55.427 kg CO2 eq./kg, followed by 3.5250 with 4.221 Pt/kg and 51.9541 kg CO2 eq./kg. Both the magnesium alloys included silver as an alloying element. The least environmental impact was produced by 3.5216 with 3.046 Pt/kg and 43.439 kg CO2 eq./kg.
Silver was the alloying element with the most significant environmental impact in both methodologies, followed by nickel and copper according to the ReCiPe 2016 methodology and lithium for the IPCC 2013 methodology. A widely used alloy element in magnesium alloys is aluminum, which presented an environmental impact considerably lower than that of magnesium and, therefore, it helps to achieve alloys with lower environmental impact.
Regarding the manufacturing process, energy consumption represented no more than 1.0% of the total impact according to the ReCiPe 2016 methodology and less than 1.6% according to the IPCC 2013 methodology.
The comparison between the maximum and minimum environmental impacts showed an uncertainty between ±0.54% and ±7.20% for the ReCiPe 2016 methodology and between ±0.73% and e±3.94% for the IPCC 2013 methodology. The alloys 3.5251 and 3.5220 presented the major and minor differences, respectively.
Furthermore, critical raw materials have been of increasing interest in the European Union. Assessing critical raw material content can contribute to an efficient use of these resources. This study assessed CRM content in the magnesium alloys included in the study.
The results on the content of CRMs were high (between 89.72% and 98.22%) because magnesium is a material considered as critical and it accounted for more than 90% of the composition of the alloys included in this study.
Concerning the variation with respect to the environmental impact obtained from the EcoInvent AZ91 magnesium alloy, in general, the ReCiPe 2016 methodology showed the most significant differences. Magnesium alloys that included silver in their composition (3.5251 and 3.5250) presented considerable variations: 59.6% and 38.8%, respectively, based on the ReCiPe 2016 methodology and 27.7% and 19.7%, respectively, according to the IPCC 2013 methodology. The rest of the magnesium alloys presented variations between 0.1% and 7.7%, showing that composition should be considered to calculate the environmental impact whenever magnesium alloys are used.
However, a future research line to further improve the data, due to the iterative nature of LCA, is to contact magnesium alloy manufacturing plants in order to obtain primary consumption data.
Author Contributions
Conceptualization, D.E. and C.J.; data curation, I.G.G. and R.T.; formal analysis, I.G.G.; funding acquisition, C.P. and C.J.; investigation, I.G.G. and D.E.; methodology, I.G.G. and D.E.; project administration, C.P. and C.J.; resources, C.P. and C.J.; software, I.G.G. and R.T.; supervision, D.E. and C.J.; validation, C.P. and R.T.; visualization, I.G.G., D.E. and R.T.; writing—original draft, I.G.G., D.E. and C.J.; writing—review and editing, I.G.G., D.E., C.P. and R.T. All authors have read and agreed to the published version of the manuscript.
Funding
The study presented in this paper was partially supported by the Spanish MINECO under Project RETO RTC-2017-5965-6, and was performed by members of the I+AITIIP (DGA-T08_17R) research group of the FEDER 2014–2020 “Building Europe from Aragón” program, recognized by the Regional Government of Aragon.
Conflicts of Interest
The authors declare no conflict of interest. The funders had no role in the design of the study; in the collection, analyses, or interpretation of data; in the writing of the manuscript, or in the decision to publish the results.
References
- Darvish, M.; Archetti, C.; Coelho, L.C. Trade-offs between environmental and economic performance in production and inventory-routing problems. Int. J. Prod. Econ. 2019, 217, 269–280. [Google Scholar] [CrossRef]
- Fauzi, R.T.; Lavoie, P.; Sorelli, L.; Heidari, M.D.; Amor, B. Exploring the Current Challenges and Opportunities of Life Cycle Sustainability Assessment. Sustainability 2019, 11, 636. [Google Scholar] [CrossRef] [Green Version]
- Chen, Z.; Huang, L. Application review of LCA (Life Cycle Assessment) in circular economy: From the perspective of PSS (Product Service System). Procedia Cirp. 2019, 83, 201–217. [Google Scholar] [CrossRef]
- Mesa, J.A.; Esparragoza, I.; Maury, H. Trends and Perspectives of Sustainable Product Design for Open Architecture Products: Facing the Circular Economy Model. Int. J. Precis. Eng. Manuf. Green Technol. 2019, 6, 377–391. [Google Scholar] [CrossRef]
- Garcia-Muiña, F.E.; González-Sánchez, R.; Ferrari, A.M.; Volpi, L.; Pini, M.; Siligardi, C.; Settembre-Blundo, D. Identifiying the Equilibrium Point between Sustainability Goals and Circular Economy Practives in an Industry 4.0 Manufacturing Context Using Eco-Design. Soc. Sci. 2019, 8, 241. [Google Scholar] [CrossRef] [Green Version]
- Bocken, N.M.P.; Farracho, M.; Bosworth, R.; Kemp, R. The front-end of eco-innovation for eco-innovative small and medium sized companies. J. Eng. Technol. Manag. 2014, 31, 43–57. [Google Scholar] [CrossRef] [Green Version]
- Borchardt, M.; Wendt, M.H.; Pereira, G.M.; Sellitto, M.A. Redesign of a component based on ecodesign practices: Environmental impact and cost reduction achievements. J. Clean. Prod. 2011, 19, 49–57. [Google Scholar] [CrossRef]
- Pazoki, M.; Samarghandi, H. Take-back regulation: Remanufacturing or Eco-design? Int. J. Prod. Econ. 2020, 227, 107674. [Google Scholar] [CrossRef]
- ISO. ISO 14006:2011, Environmental Management Systems-Guidelines for Incorporating Ecodesign; International Organization for Standardization: Geneva, Switzerland, 2011. [Google Scholar]
- Pigosso, D.C.A.; Ferraz, M.; Teixeira, C.E.; Rozenfeld, H. The Deployment of Product-Related Environmental Legislation into Product Requirements. Sustainability 2016, 8, 332. [Google Scholar] [CrossRef] [Green Version]
- European Parliament. Directive 2005/32/EC of the European Parliament and of the Council of 6 July 2005 Establishing a Framework for the Setting of Ecodesign Requirements for Energy-Using Products; Official Journal of the European Union, EU Publication Office: Luxembourg, 2005. [Google Scholar]
- European Parliament. Directive 2009/125/EC of the European Parliament and of the Council of 21 October 2009 Establishing a Framework for the Setting of Ecodesign Requirements for Energy-Related Products; Official Journal of the European Union, EU Publication Office: Luxembourg, 2009. [Google Scholar]
- European Parliament. Directive 2002/95/EC of the European Parliament and of the Council of 27 January 2003 on the Restriction of the Use of Certain Hazardous Substances in Electrical and Electronic Equipment; Official Journal of the European Union, EU Publications Office: Luxembourg, 2003. [Google Scholar]
- European Parliament. Regulation (EC) No 1907/2006 of the European Parliament and of the Council of 18 December 2006 Concerning the Registration, Evaluation, Authorization and Restriction of Chemicals (REACH), Establishing a European Chemicals Agency; Official Journal of the European Union, Eu Publication Office: Luxembourg, 2006. [Google Scholar]
- IEC. IEC 62430:2019, Environmentally Conscious Design-Principles, Requirements and Guidance; International Electrotechnical Commission: Geneva, Switzerland, 2019. [Google Scholar]
- Schulte, J.; Hallstedt, S.I. Self-Assessment Metod for Sustainability Implementation in Product Innovation. Sustainability 2018, 10, 4336. [Google Scholar] [CrossRef] [Green Version]
- Moreira de Camargo, A.; Forin, S.; Macedo, K.; Finkbeiner, M.; Martínez-Blanco, J. The implementation of organizational LCA to internally manage the environmental impacts of a broad product portfolio: An example for a cosmetics, fragances, and toiletry provider. Int. J. Life Cycle Assess. 2019, 24, 104–116. [Google Scholar] [CrossRef]
- Pinheiro, M.A.P.; Jugend, D.; Demattê Filho, L.C.; Armellini, F. Framework proposal for ecodesign integration on product portfolio management. J. Clean. Prod. 2018, 185, 176–186. [Google Scholar] [CrossRef] [Green Version]
- ISO. ISO 14001:2015, Environmental Management System-Requirements with Guidance for Use; International Organization of Standardization: Geneva, Switzerland, 2015. [Google Scholar]
- ISO. ISO 9001:2015, Quality Management Systems-Requirements; International Organization of Standardization: Geneva, Switzerland, 2015. [Google Scholar]
- Navajas, A.; Uriarte, L.; Gandía, L.M. Application of Eco-Design and Life Cycle Assessment Standards for Environmental Impact Reduction of an Industrial Product. Sustainability 2017, 9, 1724. [Google Scholar] [CrossRef] [Green Version]
- Rossi, M.; Germani, M.; Zamagni, A. Review of ecodesign methods and tools. Barriers and strategies for an effective implementation in industrial companies. J. Clean. Prod. 2016, 129, 361–373. [Google Scholar] [CrossRef]
- ISO. ISO 14040:2006, Enviromental Management-Life Cycle Assessment-Principles and Framework; International Organization of Standardization: Geneva, Switzerland, 2006. [Google Scholar]
- ISO. ISO 14044:2006, Enviromental Management-Life Cycle Assessment-Requirements and Guidelines; International Organization of Standardization: Geneva, Switzerland, 2006. [Google Scholar]
- Farjana, S.H.; Huda, N.; Parvez Mahmud, M.A.; Lang, C. A global life cycle assessment of manganese mining processes based on EcoInvent database. Sci. Total Environ. 2019, 688, 1102–1111. [Google Scholar] [CrossRef]
- Ji, C.; Ma, X.; Zhai, Y.; Zhang, R.; Shen, X.; Zhang, T.; Hong, J. Environmental impact assessment of galvanized sheet production: A case study in Shandong Province, China. Int. J. Life Cycle Assess. 2020, 25, 760–770. [Google Scholar] [CrossRef]
- Baldowska-Witos, P.; Kruszelnicka, W.; Kasner, R.; Tomporowski, A.; Flizikowski, J.; Klos, Z.; Piotrowska, K.; Markowska, K. Application of LCA Method Assessment of Environmental Impacts of a Polylactide (PLA) Bottle Shaping. Polymers 2020, 12, 388. [Google Scholar] [CrossRef] [Green Version]
- Yang, J.; Gu, F.; Guo, J.; Chen, B. Comparative Life Cycle Assessment of Mobile Power Banks with Lithium-Ion Battery and Lithium-Ion Polymer Battery. Sustainability 2019, 11, 5148. [Google Scholar] [CrossRef] [Green Version]
- Heidari, M.R.; Heravi, G.; Nezhadpour Esmaeeli, A. Integrating life-cycle assessment and life-cycle cost analysis to select sustainable pavement: A probabilistic model using managerial flexibilities. J. Clean. Prod. 2020, 254, 120046. [Google Scholar] [CrossRef]
- Lozano-Miralles, J.A.; Hermoso-Orzáez, M.J.; Gago-Calderón, A.; Brito, P. LCA Case Study to LED Outdoor Luminaries as a Circular Economy Solution to Local Scale. Sustainability 2020, 12, 190. [Google Scholar] [CrossRef] [Green Version]
- Hoang, T.T.L.; Do, T.G.; Nguyen, V.T.; Nguyen, H.C.; Phan, H.K. Environmental Impacts of Photoluminescence and Light-Emitting Diode (LED) Lighting Technologies in Horticulture: Case Study on Compact Fluorescent Lamp (CFL) and LED Lights for “Night Break” of Chrysanthemum Cultivation. Sustainability 2020, 12, 7969. [Google Scholar] [CrossRef]
- Muteri, V.; Cellura, M.; Curto, D.; Franzitta, V.; Longo, S.; Mistretta, M.; Parisi, M.L. Review on Life Cycle Assessment of Solar Photovoltaic Panels. Energies 2020, 13, 252. [Google Scholar] [CrossRef] [Green Version]
- Dolganova, I.; Bosch, F.; Bach, V.; Baitz, M.; Finkbeiner, M. Life cycle assessment of ferro niobium. Int. J. Life Cycle Assess. 2020, 25, 611–619. [Google Scholar] [CrossRef]
- Gediga, J.; Morfino, A.; Finkbeiner, M.; Schulz, M.; Harlow, K. Life cycle assessment of zircon sand. Int. J. Life Cycle Assess. 2019, 24, 1976–1984. [Google Scholar] [CrossRef] [Green Version]
- Hong, J.; Chen, Y.; Liu, J.; Ma, X.; Qi, C.; Ye, L. Life cycle assessment of copper production: A case study in China. Int. J. Life Cycle Assess. 2018, 23, 1814–1824. [Google Scholar] [CrossRef]
- Westfall, L.A.; Davourie, J.; Ali, M.; McGough, D. Cradle-to-gate life cycle assessment of global manganese alloy production. Int. J. Life Cycle Assess. 2016, 21, 1573–1579. [Google Scholar] [CrossRef] [Green Version]
- Khoo, H.H.; Isoni, V.; Sharratt, P.N. LCI data selection criteria for a multidisciplinary research team: LCA applied to solvents and chemicals. Sustain. Prod. Consum. 2018, 16, 68–87. [Google Scholar] [CrossRef]
- Pham, A.-D.; Nguyen, Q.T.; Luong, D.L.; Truong, Q.C. The Development of a Decision Support Model for Eco-Friendly Material Selection in Vietnam. Sustainability 2020, 12, 2769. [Google Scholar] [CrossRef] [Green Version]
- Branowski, B.; Zablocki, M.; Sydor, M. The Material Indices Method in the Sustainable Engineering Design Process: A Review. Sustainability 2019, 11, 5465. [Google Scholar] [CrossRef] [Green Version]
- Mousavi-Nasab, S.H.; Sotoudeh-Anvari, A. A new multi-criteria decision making approach for sustainable material selection problem: A critical study of rank reversal problem. J. Clean. Prod. 2018, 182, 466–484. [Google Scholar] [CrossRef]
- Calado, E.A.; Leire, M.; Silva, A. Selecting composite materials considering cost and environmental impact in the early phases of aircraft structure design. J. Clean. Prod. 2018, 186, 113–122. [Google Scholar] [CrossRef]
- Ribeiro, I.; Peças, P.; Henriques, E. A life cycle framework to support materials selections for Ecodesign: A case study on biodegradable polymers. Mater. Des. 2013, 51, 300–308. [Google Scholar] [CrossRef]
- Casanovas-Rubio, M.M.; Armengou, J. Decision-making tool for the optimal selection of a domestic water-heating system considering economic, environmental and social criteria: Application to Barcelona (Spain). Renew. Sustain. Energy Rev. 2018, 91, 741–753. [Google Scholar] [CrossRef]
- Liu, Y.; Cai, S. Gradients of Strain to Increase Strength and Ductility of Magnesium Alloys. Metals 2019, 9, 1028. [Google Scholar] [CrossRef] [Green Version]
- Cai, Z.; Che, C.; Chang, R.; Cheng, L.; Chen, Q. Study on the Constitutive Behavior and Hot Deformation Characteristic of Mg-4Sm-2Zn-0.5 Zr Alloy. Int. J. Precis. Eng. Manuf. 2019, 20, 407–415. [Google Scholar] [CrossRef]
- Merson, D.; Brilevsky, A.; Myagkikh, P.; Tarkova, A.; Prokhorikhin, A.; Krevton, E.; Frolova, T.; Vinogradov, A. The Functional Properties of Mg-Zn-X Biodegradable Magnesium Alloys. Materials 2020, 13, 544. [Google Scholar] [CrossRef] [Green Version]
- Zhan, W.; Tian, F.; Ou-Yang, G.; Gui, B. Effects of Nickel Additive on Micro-Arc Oxidation Coating of AZ63B Magnesium Alloy. Int. J. Precis. Eng. Manuf. 2018, 19, 1081–1087. [Google Scholar] [CrossRef]
- Tkacz, J.; Slouková, K.; Minda, J.; Drábiková, J.; Fintová, S.; Doležal, P.; Wasserbauer, J. Influence of the Composition of the Hank’s Balanced Salt Solution on the Corrosion Behavior of AZ31 and AZ61 Magnesium Alloys. Metals 2017, 7, 465. [Google Scholar] [CrossRef] [Green Version]
- Pflieger, J.; Fischer, M.; Stichling, J.; Eyerer, P. Chapter 149—Magnesium in Automotive Lightweight Design under Life Cycle Aspects. In Magnesium: Proceeding of the 6th International Conference Magnesium Alloys and their Applications, 1st ed.; Kainer, K.U., Ed.; Wiley-VCH Verlag GmbH & Co. KGaA: Weinheim, Germany, 2004; pp. 962–967. [Google Scholar]
- Türe, Y.; Türe, C. An assessment of using Aluminum and Magnesium on CO2 emission in European passenger cars. J. Clean. Prod. 2020, 247, 119120. [Google Scholar] [CrossRef]
- Klemenc, J.; Seruga, D.; Nagode, M. A Durability Prediction for the Magnesium Alloy AZ31 based on Plastic and Total Energy. Metals 2019, 9, 973. [Google Scholar] [CrossRef] [Green Version]
- Morimoto, S.; Cheng, Y.; Mizukoshi, N.; Tahara, K. Methodological Study of Evaluating Future Lightweight Vehicle Scenarios and CO2 Reduction Based on Life Cycle Assessment. Sustainability 2020, 12, 5713. [Google Scholar] [CrossRef]
- Kawajari, K.; Kobayashi, M.; Sakamoto, K. Lightweight materials equal lightweight greenhouse gas emissions? A historical analysis of greenhouse gases of vehicle material susbtitution. J. Clean. Prod. 2020, 253, 119805. [Google Scholar] [CrossRef]
- Hottle, T.; Caffrey, C.; McDonald, J.; Dodder, R. Critical factors affecting life cycle assessments of material choice for vehicle mass reduction. Transp. Res. Part. D 2017, 56, 241–257. [Google Scholar] [CrossRef] [PubMed]
- Cecchel, S.; Chindamo, D.; Collota, M.; Cornacchia, G.; Panvini, A.; Tomasoni, G.; Gadola, M. Lightweighting in light commercial vehicles: Cradle-to-grave life cycle assessment of a safety-relevant component. Int. J. Life Cycle Assess. 2018, 23, 2043–2054. [Google Scholar] [CrossRef]
- Raugei, M.; Morrey, D.; Hutchinson, A.; Winfield, P. A coherent life cycle assessment of a range of lightweighting strategies for compact vehicles. J. Clean. Prod. 2015, 108, 1168–1176. [Google Scholar] [CrossRef] [Green Version]
- Koffler, C.; Rohde-Brandenburger, K. On the calculation of fuel savings through lightweight design in automotive life cycle assessments. Int. J. Life Cycle Assess. 2010, 15, 128. [Google Scholar] [CrossRef]
- Chang, G.; Zhou, T.; Zhou, H.; Zhang, P.; Ma, S.; Zhi, B.; Wang, S. Effect of Composition on the Mechanical Properties and Wear Resistance of Low and Medium Carbon Steels with a Biomimetic Non-Smooth Surface Processed by Laser Remelting. Metals 2020, 10, 37. [Google Scholar] [CrossRef] [Green Version]
- Dargusch, M.S.; Pettersen, K.; Nogita, K.; Nave, M.D. The Effect of Aluminium Content on the Mechanical Properties and Microstructure of Die Cast Binary Magnesium-Aluminium Alloys. Mater. Trans. 2006, 47, 977–982. [Google Scholar] [CrossRef] [Green Version]
- She, J.; Pan, F.S.; Guo, W.; Tang, A.T.; Gao, Z.Y.; Luo, S.Q.; Song, K.; Yu, Z.W.; Rashad, M. Effect of high Mn content on development of ultra-fine grain extruded Magnesium alloy. Mater. Des. 2016, 90, 7–12. [Google Scholar] [CrossRef]
- Jaschik, C.; Haferkamp, H.; Niemeyer, M. New Magnesium Wrought Alloys. In Magnesium Alloys and their Applications; Kainer, K.U., Ed.; Wiley-VCH: Weinheim, Germany, 2006; pp. 41–46. [Google Scholar]
- Dobatkin, S.; Martynenko, N.; Anisimova, N.; Kiselevskiy, M.; Prosvirnin, D.; Terentiev, V.; Yurchenko, N.; Salishchev, G.; Estrin, Y. Mechanical Properties, Biodegradation, and Biocompatibility of Ultrafine Grained Magnesium Alloy WE43. Materials 2019, 12, 3627. [Google Scholar] [CrossRef] [Green Version]
- Deng, H.; Kensall, A. Life cycle assessment with primary data on heavy rare earcth oxides from ion-adsorption clays. Int. J. Life Cycle Assess. 2019, 24, 1643–1652. [Google Scholar] [CrossRef] [Green Version]
- Ferro, P.; Bonollo, F. Materials selection in a critical raw materials perspective. Mater. Des. 2019, 177, 107848. [Google Scholar] [CrossRef]
- Amato, A.; Becci, A.; Mariani, P.; Carducci, F.; Ruello, M.L.; Monosi, S.; Giosuè, C.; Beolchini, F. End-of-Life Liquid Crystal Display Recovery: Toward a Zero-Waste Approach. Appl. Sci. 2019, 9, 2985. [Google Scholar] [CrossRef] [Green Version]
- European Commission. Communication from the Commission to the European Parliament, the Council, the European Economic and Social Committee and the Committee of the Regions, Tackling the Challenges in Commodity Markets and on Raw Materials; European Union: Brussels, Belgium, 2011. [Google Scholar]
- European Commission. Study on the EU’s List of Critical Raw Materials—Final Report; Publications Office of the European Union: Luxembourg, 2020. [Google Scholar]
- Schrikvers, D.; Hool, A.; Blengini, G.A.; Chen, W.Q.; Dewulf, J.; Eggert, R.; van Ellen, L.; Gauss, R.; Goddin, J.; Habib, K.; et al. A review of methods and data to determine raw material criticality. Resour. Conserv. Recycl. 2020, 155, 104617. [Google Scholar] [CrossRef]
- Glöser-Chahoud, S.; Tercero Espinoza, L.; Walz, R.; Faulstich, M. Material Criticality: An Indicator Based Analysis for Germany and Japan. Resources 2016, 5, 45. [Google Scholar] [CrossRef] [Green Version]
- Mancini, L.; Benini, L.; Sala, S. Characterization of raw materials based on supply risk indicators for Europe. Int. J. Life Cycle Assess. 2018, 23, 726–738. [Google Scholar] [CrossRef] [Green Version]
- Godoy León, M.F.; Dewulf, J. Data quality assessment framework for critical raw materials. The case of cobalt. Resour. Conserv. Recycl. 2020, 157, 104564. [Google Scholar] [CrossRef]
- Cusack, P.B.; Courtney, R.; Healy, M.G.; O’Donoghue, L.M.T.; Ujaczki, E. An evaluation of the general composition and critial raw material content of bauxite residue in a storage area over a twelve-year period. J. Clean. Prod. 2019, 208, 393–401. [Google Scholar] [CrossRef]
- CEN-CENELEC. EN 45558 General Method to Declare the Use of Critical Raw Materials in Energy-Related Prodcuts; CEN-CENELEC: Brusssels, Belgium, 2019. [Google Scholar]
- Hoy-Petersen, N.; Aune, T.; Vralstad, K.; Oymo, A.D.; Haygerod, T.; Skane, O. Magnesium. In Ullmann’s Encyclopedia of Industrial Chemistry; Elvers, B., Hawkins, S., Schulz, G., Eds.; Wiley-VCH: Weinheim, Germany, 1999; Volume 3, p. 559. [Google Scholar]
- Klaumünzer, D.; Hernandez, J.V.; Yi, S.; Letzig, D.; Kim, S.; Joong Kim, J.; Hong Seo, M.; Ahn, K. Magnesium Process and Alloy Development for Applications in the Automotive Industry. In Magnesium Technology; Springer: Cham, Switzerland, 2019; pp. 15–20. [Google Scholar]
- Estonian Centre for Standardisation. EVS-EN 1753:2019, Magnesium and Magnesium Alloys—Magnesium Alloy Ingots and Castings; Estonian Centre for Standardisation: Tallinn, Estonia, 2019. [Google Scholar]
- ASTM. ASTM B275-05, Standard Practice for Codification of Certain Nonferrous Metals and Alloys, Cast and Wrought; ASTM International: West Conshohocken, PA, USA, 2009. [Google Scholar]
- Bohlen, J.; Mayer, S.; Wiese, B.; Luthringer-Feyerabend, B.J.C.; Willumeit-Römer, R.; Letzig, D. Alloying and Processing Effects on the Microstructure Mechanical Properties, and Degradation Behavior of Extruded Magnesium Alloys Containing Calcium, Cerium or Silver. Materials 2020, 13, 391. [Google Scholar] [CrossRef] [Green Version]
- Pan, F.; Yang, M.; Chen, X. A Review on Casting Magnesium Alloys: Modification of Commercial Alloys and Development of New Alloys. J. Mater. Sci. Technol. 2016, 32, 1211–1221. [Google Scholar] [CrossRef]
- Wang, Y.; Liu, G.; Wei, Y.; Qiao, Y. Effects of Magnesium-Calcium Alloys with Different Calcium Content on Their Mechanical Properties. IOP Conf. Ser. Mater. Sci. Eng. 2020, 735, 012010. [Google Scholar] [CrossRef]
- Papenberg, N.P.; Gneiger, S.; Weißensteiner, I.; Uggowitzer, P.J.; Pogatscher. Mg-Alloys for Forging Applications—A Review. Materials 2020, 13, 985. [Google Scholar] [CrossRef] [PubMed] [Green Version]
- Tekumalla, S.; Ajjarapu, M.; Gupta, M. A novel Turning-Induced-Deformation Based Technique to Process Magnesium Alloys. Metals 2019, 9, 841. [Google Scholar] [CrossRef] [Green Version]
- Classen, M.; Althaus, H.J.; Blaser, S.; Scharnhorst, W. Life Cycle Inventories of Metals; Swiss Centre for Life Cycle Inventories: St. Gallen/Dübendorf, Switzerland, 2009. [Google Scholar]
- Albright, D.L.; Haagensen, J.O. Life Cycle Inventory of Magnesium; Proceedings International Magnesium Association: Toronto, ON, Canada, 1997; pp. 32–37. [Google Scholar]
- Wiedema, B.P.; Bauer, C.; Hischier, R.; Mutel, C.; Nemecek, T.; Reinhard, J.; Vadenbo, C.O.; Wernet, G. Overview and methodology. In Data Quality Guideline for the Ecoinvent Database Version 3; Swiss Centre for Life Cycle Inventories: St. Gallen/Dübendorf, Switzerland, 2013. [Google Scholar]
- Pekguleryuz, M.O. 1- Current developments in wrought Magnesium alloys. In Advances in Wrought Magnesium Alloys; Bettles, C., Barnett, M., Eds.; Woodhead Publishing Series in Metals and Surface Engineering: New Delhi, India, 2012; pp. 3–62. [Google Scholar]
- Behrsing, T.; Deacon, G.B.; Junk, P.C. 1- The chemistry of rare earth metals, compounds, and corrosion inhibitors. In Woodhead Publishing Series in Metals and Surface Engineering: Number 61. Rare Earth-Based Corrosion Inhibitors; Forsyth, M., Hinton, B., Eds.; Elsevier: Cambridge, UK, 2014; pp. 1–37. [Google Scholar]
- Goedkoop, M.; Oele, M.; Leijting, J.; Ponsioen, T.; Meijer, E. Introduction to LCA with SimaPro (v 5.2); PRé Consultants: Amersfoort, The Netherlands, 2016. [Google Scholar]
- Huijbregts, M.A.J.; Steinmann, Z.J.N.; Ekshout, P.M.F.; Stam, G.; Verones, F.; Vieira, M.; Zijp, M.; Hollander, A.; van Zelm, R. ReCiPe 2016: A harmonised life cycle impact assessment method at midpoint and endpoint level. Int. J. Life Cycle Assess. 2017, 22, 138–147. [Google Scholar] [CrossRef]
- PRé, various authors. SimaPro Database Manual. Methods Library (v 4.14.2); PRé Consultants: San Francisco, CA, USA, 2019. [Google Scholar]
- Gómez, P.; Elduque, D.; Sarasa, J.; Pina, C.; Javierre, C. Influence of Composition on the Environmental Impact of a Cast Aluminum Alloy. Materials 2016, 9, 412. [Google Scholar] [CrossRef] [Green Version]
- Il’ina, E.A.; Raskovalov, A.A.; Reznitskikh, O.G. Thermodynamic properties of solid electrolyte Li7La3Zr2O12. J. Chem. Termodyn. 2019, 128, 68–73. [Google Scholar] [CrossRef]
- Yao, W.J.; Wang, N. Latent heats of fusion and crystallization behaviors of Co-Si binary alloys. J. Alloys Compd. 2009, 487, 354–357. [Google Scholar] [CrossRef]
- Powell, B.R.; Luo, A.A.; Krajewsky, P.E. 7—Magnesium alloys for lightweight powertrains and automotive bodies. In Advanced Materials in Automotive Engineering; Rowe, J., Ed.; Woodhead Publishing: Cambridge, UK, 2012; pp. 150–209. [Google Scholar]
- Jin, Z.; Xing, B.; Tang, C.; Feng, J.; Su, N.; Li, Y. Rheo-Diecasting of Wrought Magnesium AZ31 Alloy and the Effect of Injection Velocity on Microstructure and Tensile Strength. Metals 2018, 8, 793. [Google Scholar] [CrossRef] [Green Version]
- Mancini, L.; Sala, S.; Recchioni, M.; Benini, L.; Goralczyk, M.; Pennington, D. Potential of life cycle assessment for supporting the management of critical raw materials. Int. J. Life Cycle Assess. 2015, 20, 100–116. [Google Scholar] [CrossRef]
- Liu, Z.; Feyerabend, F.; Bohlen, J.; Willumeit-Römer, R.; Letzig, D. Mechanical properties and degradation behaviour of binary Magnesium-silver alloy sheets. J. Phys. Chem. Solids 2019, 133, 142–150. [Google Scholar] [CrossRef]
- Zeng, G.; Liu, C.; Gao, Y.; Jiang, S.; Yu, S.; Chen, Z. Effects of T5 Treatment on Microstructure and Mechanical Properties at Elevated Temperature of AZ80-Ag Alloy. Materials 2019, 12, 3214. [Google Scholar] [CrossRef] [PubMed] [Green Version]
Figure 1.
System boundaries.

Figure 2.
Environmental impact of 1 kg of magnesium alloy, ReCiPe 2016 methodology (Pt/kg).

Figure 3.
Environmental impact of 1 kg of magnesium alloy, IPCC 2013 methodology (kg CO2 eq./kg).

Figure 4.
Weight and environmental contribution in alloy 3.5251 according to (a) ReCiPe 2016 methodology and (b) IPCC 2013 methodology.
Figure 4.
Weight and environmental contribution in alloy 3.5251 according to (a) ReCiPe 2016 methodology and (b) IPCC 2013 methodology.

Figure 5.
Variation with respect to the AZ91 EcoInvent magnesium alloy (ReCiPe 2016).

Figure 6.
Variation with respect to the AZ91 EcoInvent magnesium alloy (IPCC 2013).


Table 1.
EcoInvent’s life cycle inventory of magnesium alloy AZ91 production.
| Description | Data Entry (kg) | Chemical Composition (%) |
|---|---|---|
| Magnesium | 9.090 × 10⁻¹ | 89.59% |
| Aluminum | 9.240 × 10⁻² | 9.11% |
| Zinc | 7.110 × 10⁻³ | 0.7% |
| Manganese | 3.050 × 10⁻³ | 0.3% |
| Silicon | 2.030 × 10⁻³ | 0.2% |
| Copper | 1.020 × 10⁻¹ | 0.1% |
| Total | 1.015 | 100% |
Table 2.
EcoInvent dataset selection.
| Alloying Element | EcoInvent v3.5 Dataset |
|---|---|
| Magnesium | Magnesium {GLO}|market for|APOS, U |
| Aluminum | Aluminum, cast alloy {GLO}|market for|APOS, U |
| Zinc | Zinc {GLO}|market for|APOS, U |
| Manganese | Manganese {GLO}|market for|APOS, U |
| Rare Earth | Mischmetal {GLO}|market for|APOS, U |
| Silver | Silver {GLO}|market for|APOS, U |
| Lithium | Lithium {GLO}|market for|APOS, U |
| Silicon | Silicon {GLO}|market for|APOS, U |
| Iron | Cast iron {GLO}|market for|APOS, U |
| Copper | Copper {GLO}|market for|APOS, U |
| Nickel | Nickel {GLO}|market for|APOS, U |
Table 3.
Material and energy inputs for 1 kg of magnesium alloy.
| Alloy | Material Inputs (kg) | Energy Consumption (kWh) | |||||||||||||
|---|---|---|---|---|---|---|---|---|---|---|---|---|---|---|---|
| Mg | Al | Ag | Ca | Cu | Fe | Li | Mn | Ni | RE | Si | Y | Zn | Zr | ||
| AZ91 1 | 9.090 × 10⁻¹ | 9.240 × 10⁻² | - | - | 1.020 × 10⁻³ | - | - | 3.050 × 10⁻³ | - | - | 2.030 × 10⁻³ | - | 7.110 × 10⁻³ | - | 1.51 |
| 3.5215 | 9.217 × 10⁻¹ | 7.965 × 10⁻² | - | - | 1.268 × 10⁻⁴ | 2.029 × 10⁻⁵ | - | 5.935 × 10⁻³ | 5.073 × 10⁻⁶ | - | 2.537 × 10⁻⁴ | - | 6.849 × 10⁻³ | - | 1.51 |
| 3.5216 | 9.101 × 10⁻¹ | 9.131 × 10⁻² | - | - | 1.268 × 10⁻⁴ | 2.029 × 10⁻⁵ | - | 5.935 × 10⁻³ | 5.073 × 10⁻⁶ | - | 2.537 × 10⁻⁴ | - | 6.849 × 10⁻³ | - | 1.51 |
| 3.5217 | 9.139 × 10⁻¹ | 9.134 × 10⁻² | - | - | 1.015 × 10⁻³ | 1.522 × 10⁻⁴ | - | - | 5.074 × 10⁻⁵ | - | 1.522 × 10⁻³ | - | 6.597 × 10⁻³ | - | 1.51 |
| 3.5220 | 9.851 × 10⁻¹ | 2.131 × 10⁻² | - | - | 4.058 × 10⁻⁵ | 2.029 × 10⁻⁵ | - | 6.849 × 10⁻³ | 5.073 × 10⁻⁶ | - | 2.537 × 10⁻⁴ | - | 1.015 × 10⁻³ | - | 1.52 |
| 3.5221 | 9.571 × 10⁻¹ | 4.972 × 10⁻² | - | - | 4.058 × 10⁻⁵ | 2.029 × 10⁻⁵ | - | 6.443 × 10⁻³ | 5.073 × 10⁻⁶ | - | 2.537 × 10⁻⁴ | - | 1.015 × 10⁻³ | - | 1.52 |
| 3.5222 | 9.461 × 10⁻¹ | 6.088 × 10⁻² | - | - | 4.058 × 10⁻⁵ | 2.029 × 10⁻⁵ | - | 6.240 × 10⁻³ | 5.073 × 10⁻⁶ | - | 2.537 × 10⁻⁴ | - | 1.015 × 10⁻³ | - | 1.52 |
| 3.5225 | 9.754 × 10⁻¹ | 2.232 × 10⁻² | - | - | 4.058 × 10⁻⁵ | 2.029 × 10⁻⁵ | - | 6.088 × 10⁻³ | 5.073 × 10⁻⁶ | - | 9.639 × 10⁻³ | - | 1.015 × 10⁻³ | - | 1.51 |
| 3.5226 | 9.546 × 10⁻¹ | 4.312 × 10⁻² | - | - | 4.058 × 10⁻⁵ | 2.029 × 10⁻⁵ | - | 6.088 × 10⁻³ | 5.073 × 10⁻⁶ | - | 9.639 × 10⁻³ | - | 1.015 × 10⁻³ | - | 1.51 |
| 3.5232 | 9.212 × 10⁻¹ | - | - | - | 2.739 × 10⁻² | - | - | 5.073 × 10⁻³ | 5.073 × 10⁻⁵ | - | - | - | 6.088 × 10⁻² | - | 1.43 |
| 3.5246 | 9.497 × 10⁻¹ | - | - | - | 1.522 × 10⁻⁴ | 2.537 × 10⁻⁴ | - | 7.610 × 10⁻⁴ | 2.537 × 10⁻⁵ | 1.395 × 10⁻² | 1.015 × 10⁻³ | - | 4.312 × 10⁻² | 5.580 × 10⁻³ | 1.46 |
| 3.5247 | 9.501 × 10⁻¹ | - | - | - | 1.522 × 10⁻⁴ | 5.073 × 10⁻⁵ | - | 7.610 × 10⁻⁴ | 2.537 × 10⁻⁵ | 3.247 × 10⁻² | 5.073 × 10⁻⁵ | - | 2.537 × 10⁻² | 5.580 × 10⁻³ | 1.45 |
| 3.5251 | 9.562 × 10⁻¹ | - | 2.537 × 10⁻² | - | 1.522 × 10⁻⁴ | 5.073 × 10⁻⁵ | - | 7.610 × 10⁻⁴ | 2.537 × 10⁻⁵ | 2.537 × 10⁻² | 5.073 × 10⁻⁵ | - | 1.015 × 10⁻³ | 5.580 × 10⁻³ | 1.45 |
| 3.5250 | 9.683 × 10⁻¹ | - | 1.522 × 10⁻² | - | 7.610 × 10⁻⁴ | 5.073 × 10⁻⁵ | - | 7.610 × 10⁻⁴ | 2.537 × 10⁻⁵ | 2.283 × 10⁻² | 5.073 × 10⁻⁵ | - | 1.015 × 10⁻³ | 5.580 × 10⁻³ | 1.47 |
| 3.5261 | 9.260 × 10⁻¹ | - | - | - | 1.522 × 10⁻⁴ | 5.073 × 10⁻⁵ | 1.015 × 10⁻³ | 7.610 × 10⁻⁴ | 2.537 × 10⁻⁵ | 2.790 × 10⁻² | 5.073 × 10⁻⁵ | 5.200 × 10⁻² | 1.015 × 10⁻³ | 5.580 × 10⁻³ | 1.42 |
| 3.5260 | 9.308 × 10⁻¹ | - | - | - | 1.522 × 10⁻⁴ | 5.073 × 10⁻⁵ | 1.015 × 10⁻³ | 7.610 × 10⁻⁴ | 2.537 × 10⁻⁵ | 3.450 × 10⁻² | 5.073 × 10⁻⁵ | 4.058 × 10⁻² | 1.015 × 10⁻³ | 5.580 × 10⁻³ | 1.42 |
| AZ21A | 9.760 × 10⁻¹ | 2.075 × 10⁻² | - | 4.422 × 10⁻³ | 2.530 × 10⁻⁴ | 2.530 × 10⁻⁵ | - | 7.590 × 10⁻⁴ | 1.012 × 10⁻⁵ | - | 2.530 × 10⁻⁴ | - | 1.214 × 10⁻² | - | 1.51 |
| AZ31A | 9.624 × 10⁻¹ | 3.037 × 10⁻² | - | 3.792 × 10⁻³ | 2.531 × 10⁻⁴ | 2.531 × 10⁻⁵ | - | 6.074 × 10⁻³ | 2.531 × 10⁻⁵ | - | 1.519 × 10⁻³ | - | 1.012 × 10⁻² | - | 1.51 |
| M1A | 9.938 × 10⁻¹ | - | - | 3.792 × 10⁻³ | 2.531 × 10⁻⁴ | - | - | 1.620 × 10⁻² | 5.062 × 10⁻⁵ | - | 5.062 × 10⁻⁴ | - | - | - | 1.51 |
1 AZ91 EcoInvent dataset.
Table 4.
Material compositions for minimum and maximum impacts (%) for 1 kg of magnesium alloy, ReCiPe 2016 methodology.
Table 4.
Material compositions for minimum and maximum impacts (%) for 1 kg of magnesium alloy, ReCiPe 2016 methodology.
| Alloy | Impact | Alloying Elements 1 | |||||||||||||
|---|---|---|---|---|---|---|---|---|---|---|---|---|---|---|---|
| Ca | Zr | Fe | Al | Zn | Si | RE | Y | Mn | Li | Mg | Cu | Ni | Ag | ||
| 3.5215 | Min. | - | - | 0.004 | 8.50 | 0.90 | 0.05 | - | - | 1.00 | - | 89.546 | - | - | - |
| Max. | - | - | - | 7.20 | 0.45 | - | - | - | 0.17 | - | 92.154 | 0.025 | 0.001 | - | |
| 3.5216 | Min. | - | - | 0.004 | 9.50 | 0.90 | 0.05 | - | - | 1.00 | - | 88.546 | - | - | - |
| Max. | - | - | - | 8.50 | 0.45 | - | - | - | 0.17 | - | 90.854 | 0.025 | 0.001 | - | |
| 3.5217 | Min. | - | - | 0.03 | 10.00 | 1.00 | 0.30 | - | - | - | - | 88.67 | - | - | - |
| Max. | - | - | - | 8.00 | 0.30 | - | - | - | - | - | 91.490 | 0.20 | 0.01 | - | |
| 3.5220 | Min. | - | - | 0.004 | 2.50 | 0.20 | 0.05 | - | - | 1.00 | - | 96.246 | - | - | - |
| Max. | - | - | - | 1.70 | - | - | - | - | 0.35 | - | 97.941 | 0.008 | 0.001 | - | |
| 3.5221 | Min. | - | - | 0.004 | 5.30 | 0.20 | 0.05 | - | - | 1.00 | - | 93.446 | - | - | - |
| Max. | - | - | - | 4.50 | - | - | - | - | 0.27 | - | 95.221 | 0.008 | 0.001 | - | |
| 3.5222 | Min. | - | - | 0.004 | 6.40 | 0.20 | 0.05 | - | - | 1.00 | - | 92.346 | - | - | - |
| Max. | - | - | - | 5.60 | - | - | - | - | 0.23 | - | 94.161 | 0.008 | 0.001 | - | |
| 3.5225 | Min. | - | - | 0.004 | 2.50 | 0.20 | 1.20 | - | - | 1.00 | - | 95.096 | - | - | - |
| Max. | - | - | - | 1.90 | - | 0.70 | - | - | 0.20 | - | 97.191 | 0.008 | 0.001 | - | |
| 3.5226 | Min. | - | - | 0.004 | 4.80 | 0.20 | 1.20 | - | - | 1.00 | - | 92.796 | - | - | - |
| Max. | - | - | - | 3.70 | - | 0.70 | - | - | 0.20 | - | 95.391 | 0.008 | 0.001 | - | |
| 3.5232 | Min. | - | - | - | - | 6.50 | - | - | - | 0.75 | - | 90.350 | 2.40 | - | - |
| Max. | - | - | - | - | 5.50 | - | - | - | 0.25 | - | 91.240 | 3.00 | 0.01 | - | |
| 3.5246 | Min. | - | 1.00 | 0.05 | - | 5.00 | 0.20 | 1.75 | - | 0.15 | - | 91.850 | - | - | - |
| Max. | - | 0.10 | - | - | 3.50 | - | 1.00 | - | - | - | 95.365 | 0.03 | 0.005 | - | |
| 3.5247 | Min. | - | 1.00 | 0.01 | - | 3.00 | 0.01 | 4.00 | - | 0.15 | - | 91.830 | - | - | - |
| Max. | - | 0.10 | - | - | 2.00 | - | 2.40 | - | - | - | 95.465 | 0.03 | 0.005 | - | |
| 3.5251 | Min. | - | 1.00 | 0.01 | - | 0.20 | 0.01 | 3.00 | - | 0.15 | - | 93.630 | - | - | 2.00 |
| Max. | - | 0.10 | - | - | - | - | 2.00 | - | - | - | 94.865 | 0.03 | 0.005 | 3.00 | |
| 3.5250 | Min. | - | 1.00 | 0.01 | - | 0.20 | 0.01 | 3.00 | - | 0.15 | - | 94.280 | 0.05 | - | 1.30 |
| Max. | - | 0.10 | - | - | - | - | 1.50 | - | - | - | 96.595 | 0.10 | 0.005 | 1.70 | |
| 3.5261 | Min. | - | 1.00 | 0.01 | - | 0.20 | 0.01 | 4.00 | 5.500 | 0.15 | 0.20 | 88.930 | - | - | - |
| Max. | - | 0.10 | - | - | - | - | 1.50 | 4.750 | - | - | 93.615 | 0.03 | 0.005 | - | |
| 3.5260 | Min. | - | 1.00 | 0.01 | - | 0.20 | 0.01 | 4.40 | 4.300 | 0.15 | 0.20 | 89.730 | - | - | - |
| Max. | - | 0.10 | - | - | - | - | 2.40 | 3.700 | - | - | 93.765 | 0.03 | 0.005 | - | |
| AZ21A | Min. | 0.250 | - | 0.005 | 0.150 | 1.600 | 2.500 | - | - | 0.050 | - | 95.445 | - | - | - |
| Max. | 0.100 | - | - | - | 0.800 | 1.600 | 0.050 | 0.002 | - | - | 97.448 | - | - | - | |
| AZ31A | Min. | 0.300 | - | 0.005 | 1.000 | 1.400 | 3.500 | - | - | 0.300 | - | 93.495 | - | - | - |
| Max. | - | - | - | 0.200 | 0.600 | 2.500 | 0.050 | 0.005 | - | - | 96.645 | - | - | - | |
| M1A | Min. | 0.300 | - | - | 2.000 | - | - | - | - | 0.100 | - | 97.600 | - | - | - |
| Max. | - | - | - | 1.200 | - | - | 0.050 | 0.010 | - | - | 98.740 | - | - | - | |
1 Alloying elements ordered from the least to greatest environmental impact, according to ReCiPe 2016 methodology.
Table 5.
Material compositions for minimum and maximum impacts (%) for 1 kg of magnesium alloy, IPCC 2013 methodology.
Table 5.
Material compositions for minimum and maximum impacts (%) for 1 kg of magnesium alloy, IPCC 2013 methodology.
| Alloy | Impact | Alloying Elements 1 | |||||||||||||
|---|---|---|---|---|---|---|---|---|---|---|---|---|---|---|---|
| Zr | Ca | Fe | Mn | Zn | Al | Cu | Ni | Si | Y | RE | Mg | Li | Ag | ||
| 3.5215 | Min. | - | - | 0.004 | 1.00 | 0.90 | 8.50 | 0.025 | 0.001 | 0.05 | - | - | 89.520 | - | - |
| Max. | - | - | - | 0.17 | 0.45 | 7.20 | - | - | - | - | - | 92.180 | - | - | |
| 3.5216 | Min. | - | - | 0.004 | 1.00 | 0.90 | 9.50 | 0.025 | 0.001 | 0.05 | - | - | 88.520 | - | - |
| Max. | - | - | - | 0.17 | 0.45 | 8.50 | - | - | - | - | - | 90.880 | - | - | |
| 3.5217 | Min. | - | - | 0.030 | - | 1.00 | 10.00 | 0.20 | 0.01 | 0.30 | - | - | 88.460 | - | - |
| Max. | - | - | - | - | 0.30 | 8.00 | - | - | - | - | - | 91.700 | - | - | |
| 3.5220 | Min. | - | - | 0.004 | 1.00 | 0.20 | 2.50 | 0.008 | 0.001 | 0.05 | - | - | 96.237 | - | - |
| Max. | - | - | - | 0.35 | - | 1.70 | - | - | - | - | - | 97.950 | - | - | |
| 3.5221 | Min. | - | - | 0.004 | 1.00 | 0.20 | 5.30 | 0.008 | 0.001 | 0.05 | - | - | 93.437 | - | - |
| Max. | - | - | - | 0.270 | - | 4.50 | - | - | - | - | - | 95.230 | - | - | |
| 3.5222 | Min. | - | - | 0.004 | 1.00 | 0.20 | 6.40 | 0.008 | 0.001 | 0.05 | - | - | 92.337 | - | - |
| Max. | - | - | - | 0.23 | - | 5.60 | - | - | - | - | - | 94.170 | - | - | |
| 3.5225 | Min. | - | - | 0.004 | 1.00 | 0.20 | 2.50 | 0.008 | 0.001 | 1.20 | - | - | 95.087 | - | - |
| Max. | - | - | - | 0.20 | - | 1.90 | - | - | 0.70 | - | - | 97.200 | - | - | |
| 3.5226 | Min. | - | - | 0.004 | 1.00 | 0.20 | 4.80 | 0.008 | 0.001 | 1.20 | - | - | 92.787 | - | - |
| Max. | - | - | - | 0.20 | - | 3.70 | - | - | 0.70 | - | - | 95.400 | - | - | |
| 3.5232 | Min. | - | - | - | 0.75 | 6.50 | - | 3.00 | 0.01 | - | - | - | 89.740 | - | - |
| Max. | - | - | - | 0.25 | 5.50 | - | 2.40 | - | - | - | - | 91.850 | - | - | |
| 3.5246 | Min. | 1.00 | - | 0.05 | 0.15 | 5.00 | - | 0.03 | 0.005 | 0.20 | - | 1.75 | 91.815 | - | - |
| Max. | 0.10 | - | - | - | 3.50 | - | - | - | - | - | 1.00 | 95.400 | - | - | |
| 3.5247 | Min. | 1.00 | - | 0.01 | 0.15 | 3.00 | - | 0.03 | 0.005 | 0.01 | - | 4.00 | 91.795 | - | - |
| Max. | 0.10 | - | - | - | 2.00 | - | - | - | - | - | 2.40 | 95.500 | - | - | |
| 3.5251 | Min. | 1.00 | - | 0.01 | 0.15 | 0.20 | - | 0.03 | 0.005 | 0.01 | - | 3.00 | 93.595 | - | 2.00 |
| Max. | 0.10 | - | - | - | - | - | - | - | - | - | 2.00 | 94.900 | - | 3.00 | |
| 3.5250 | Min. | 1.00 | - | 0.01 | 0.15 | 0.20 | - | 0.10 | 0.005 | 0.01 | - | 3.00 | 94.225 | - | 1.30 |
| Max. | 0.10 | - | - | - | - | - | 0.05 | - | - | - | 1.55 | 96.650 | - | 1.70 | |
| 3.5261 | Min. | 1.00 | - | 0.01 | 0.15 | 0.20 | - | 0.03 | 0.005 | 0.01 | 5.50 | 4.00 | 89.095 | - | - |
| Max. | 0.10 | - | - | - | - | - | - | - | - | 4.75 | 1.50 | 93.450 | 0.20 | - | |
| 3.5260 | Min. | 1.00 | - | 0.01 | 0.15 | 0.20 | - | 0.03 | 0.005 | 0.01 | 4.30 | 4.40 | 89.895 | - | - |
| Max. | 0.10 | - | - | - | - | - | - | - | - | 3.70 | 2.40 | 93.600 | 0.20 | - | |
| AZ21A | Min. | - | 0.250 | 0.005 | 0.150 | 1.600 | 2.500 | 0.050 | 0.002 | 0.050 | - | - | 95.393 | - | - |
| Max. | - | 0.100 | - | - | 0.800 | 1.600 | - | - | - | - | - | 97.500 | - | - | |
| AZ31A | Min. | - | 0.300 | 0.005 | 1.000 | 1.400 | 3.500 | 0.050 | 0.005 | 0.300 | - | - | 93.440 | - | - |
| Max. | - | - | - | 0.200 | 0.600 | 2.500 | - | - | - | - | - | 96.700 | - | - | |
| M1A | Min. | - | 0.300 | - | 2.000 | - | - | 0.050 | 0.010 | 0.100 | - | - | 97.540 | - | - |
| Max. | - | - | - | 1.200 | - | - | - | - | - | - | - | 98.800 | - | - | |
1 Alloying elements ordered from the least to greatest environmental impact, according to IPCC 2013 methodology.
Table 6.
Maximum and minimum environmental impacts for 1 kg of magnesium alloy, according to the ReCiPe 2016 and IPCC 2013 methodologies.
Table 6.
Maximum and minimum environmental impacts for 1 kg of magnesium alloy, according to the ReCiPe 2016 and IPCC 2013 methodologies.
| ReCiPe 2016 (Pt/kg) | IPCC 2013 (kg CO2 eq./kg) | |||||
|---|---|---|---|---|---|---|
| Designation | Min. | Max. | Variation | Min. | Max. | Variation |
| 3.5215 | 3.050 | 3.110 | ±0.99% | 43.349 | 44.463 | ±1.27% |
| 3.5216 | 3.020 | 3.072 | ±0.85% | 42.943 | 43.936 | ±1.14% |
| 3.5217 | 3.004 | 3.094 | ±1.48% | 42.964 | 44.277 | ±1.51% |
| 3.5220 | 3.247 | 3.284 | ±0.57% | 46.086 | 46.805 | ±0.77% |
| 3.5221 | 3.164 | 3.202 | ±0.60% | 44.950 | 45.705 | ±0.83% |
| 3.5222 | 3.132 | 3.170 | ±0.61% | 44.505 | 45.277 | ±0.86% |
| 3.5225 | 3.214 | 3.260 | ±0.70% | 45.668 | 46.536 | ±0.94% |
| 3.5226 | 3.146 | 3.206 | ±0.95% | 44.736 | 45.806 | ±1.18% |
| 3.5232 | 3.157 | 3.194 | ±0.58% | 43.373 | 44.258 | ±1.01% |
| 3.5246 | 3.114 | 3.212 | ±1.56% | 44.412 | 45.842 | ±1.59% |
| 3.5247 | 3.125 | 3.222 | ±1.53% | 44.744 | 46.104 | ±1.50% |
| 3.5251 | 4.503 | 5.202 | ±7.20% | 53.239 | 57.613 | ±3.94% |
| 3.5250 | 4.057 | 4.385 | ±3.88% | 50.751 | 53.157 | ±2.32% |
| 3.5261 | 3.075 | 3.190 | ±1.83% | 44.458 | 45.926 | ±1.62% |
| 3.5260 | 3.094 | 3.193 | ±1.58% | 44.673 | 45.966 | ±1.43% |
| AZ21A | 3.195 | 3.260 | ±1.00% | 45.623 | 46.568 | ±1.03% |
| AZ31A | 3.152 | 3.245 | ±1.45% | 44.794 | 46.291 | ±1.65% |
| M1A | 3.291 | 3.327 | ±0.54% | 46.437 | 47.119 | ±0.73% |
Table 7.
Critical raw material (CRM) content (%).
| Designation | CRM Content | Designation | CRM Content |
|---|---|---|---|
| AZ91 (EcoInvent) | 89.79% | 3.5246 | 95.08% |
| 3.5215 | 90.87% | 3.5247 | 96.85% |
| 3.5216 | 89.72% | 3.5251 | 96.75% |
| 3.5217 | 90.21% | 3.5250 | 97.69% |
| 3.5220 | 97.11% | 3.5261 | 94.12% |
| 3.5221 | 94.35% | 3.5260 | 95.25% |
| 3.5222 | 93.27% | AZ91A | 96.47% |
| 3.5225 | 97.09% | AZ31A | 95.22% |
| 3.5226 | 95.04% | M1A | 98.22% |
| 3.5232 | 90.79% |
Publisher’s Note: MDPI stays neutral with regard to jurisdictional claims in published maps and institutional affiliations. |
© 2020 by the authors. Licensee MDPI, Basel, Switzerland. This article is an open access article distributed under the terms and conditions of the Creative Commons Attribution (CC BY) license (http://creativecommons.org/licenses/by/4.0/).
Share and Cite
MDPI and ACS Style
García Gutiérrez, I.; Elduque, D.; Pina, C.; Tobajas, R.; Javierre, C. Influence of the Composition on the Environmental Impact of a Casting Magnesium Alloy. Sustainability 2020, 12, 10494. https://doi.org/10.3390/su122410494
AMA Style
García Gutiérrez I, Elduque D, Pina C, Tobajas R, Javierre C. Influence of the Composition on the Environmental Impact of a Casting Magnesium Alloy. Sustainability. 2020; 12(24):10494. https://doi.org/10.3390/su122410494
Chicago/Turabian StyleGarcía Gutiérrez, Isabel, Daniel Elduque, Carmelo Pina, Rafael Tobajas, and Carlos Javierre. 2020. "Influence of the Composition on the Environmental Impact of a Casting Magnesium Alloy" Sustainability 12, no. 24: 10494. https://doi.org/10.3390/su122410494
Note that from the first issue of 2016, this journal uses article numbers instead of page numbers. See further details here.