Clustering of European Smart Cities to Understand the Cities’ Sustainability Strategies


1
ESPI2R, Campus Paris, ESPI, 92300 Paris, France
2
ESPI2R, Campus Nantes, ESPI, 44323 Nantes, France
3
ESPI2R, Campus Lyon, ESPI, 69009 Lyon, France
*
Author to whom correspondence should be addressed.
Sustainability 2021, 13(2), 513; https://doi.org/10.3390/su13020513
Submission received: 14 November 2020
/
Revised: 26 December 2020
/
Accepted: 28 December 2020
/
Published: 7 January 2021
(This article belongs to the Special Issue The Role of the Web in Smart City Evolution: AI, Applications and Services)
Abstract
:This paper analyzes the smart strategies of European cities through the dynamic capabilities approach. We develop a clustering of smart cities based on the activities implemented by the cities. Our methodology considers three steps. First, we establish an empirical assessment of the smart dimensions for 40 European cities. Then, we categorize and interpret core capabilities via a principal component analysis. Finally, we highlight a hierarchical ascending classification identifying three relevant groups of cities. As a result, the first cluster represents cities with emerging smart strategies. The second cluster regroups international metropolises, which have technology-oriented strategies to deal with specific challenges. The third cluster stands for middle-sized European cities with a good quality of life. Our outcomes show that there is not just one smart city but several smart cities emerging according to the cities’ environment. These findings enrich the analysis of smart cities’ dynamic capabilities and point out how these strategies make cities sustainable.
1. Introduction
The widespread urbanization of the world has created a major challenge for the development of our societies, mainly the management of cities that harbor a large part of the globe’s population [1,2]. To face up to this overall challenge, we must rethink the way we envision cities, and the concept of a smart city offers a multitude of new possibilities. The notion of a smart city is almost 20 years old. The number of publications has increased manifold since 2015 [3]. However, there is no consensus on the definition of a smart city. The European Commission, as with most academic papers, outlines them as “cities using technological solutions to improve the management and efficiency of the urban environment.” This definition focuses on their technological aspects, but recent literature reviews highlighted the need to have a more global approach by mobilizing conceptual frameworks [4,5,6].
The definition given by Angelidou [7] appears pertinent in its analysis of the smart city. Indeed, for this author, a smart city is “all urban establishment that consciously strives to take advantage of the new information technology landscape and communication strategically, seeking to achieve prosperity, efficiency, and competitiveness on several socio-economic levels.” This definition clearly shows that the technological aspect is only a means put into place by a city that wants to implement a smart strategy to respond to environmental and socio-economic issues. It is, therefore, important today to offer a global analysis of smart cities by evaluating more precisely the overall strategy of cities and not only technological applications [8,9]. In this perspective, it is relevant to mobilize the dynamic capabilities approach [3,8,10,11]. This framework examines the strategies of organizations in relation to the capabilities that they built. It is a theoretical structure that is even more pertinent to emphasize since recent works [8,10] define a smart city as an urban organization with dynamic capabilities.
According to the dynamic capabilities approach, organizations are viewed as repositories of capabilities that enable them to successfully fulfill their initial mission of creating products or services. To understand the articulation of the different capabilities in the strategy of the organizations, this approach develops a hierarchy of capabilities by distinguishing between the operational capabilities, the core capabilities, and the dynamic capabilities. Operational capabilities [12] are the processes describing the activity of the organization. Core capabilities are meta-capabilities; they are an abstraction grouping together operational capacities in a coherent manner. Finally, dynamic capabilities refer to the ability of an organization and its management to sense, seize, and transform core capabilities to rapidly address changing environments. These capabilities characterize the sustainability of organizations; thanks to them, an organization can adapt to new conditions.
Even if Dameri and Ricciardi [10], and Chong et al. [8] have shown smart cities develop dynamic capabilities. It appears necessary to intensely analyze the core capabilities to understand the strategies of smart cities. For this reason, we consider the seven dimensions of the smart city described by the academic literature [5,13,14,15]: Smart architecture and technologies, smart citizens, smart economy, smart environment, smart government, smart living, and smart mobility. According to the dynamic capabilities approach, these seven key dimensions are examined as core capabilities. Through the study of the key dimensions of the smart city, our purpose is to understand different strategies of European smart cities.
This work has a double objective: To implement a method for the assessment of smart cities strategies and to understand the sustainability of smart cities via clustering. The present approach enriches the existing literature on smart cities. Most of the smart cities’ academic papers investigate case studies that focus on the deployment of one or two dimensions in a specific city [16], while our goal is to evaluate the seven key dimensions of a sample of 40 cities. In addition, comparative analyses of smart cities are often run through rankings [13,17,18,19]. The clustering was used by other authors [20] to understand smart cities in China. Akande et al. [21] also developed this methodology for European cities. Giovannella et al. [22] underlined that smart city rankings are almost exclusively aimed at benchmarking the infrastructure or at evaluating the outcomes of specific processes. The main objective of these works is to define a ranking of smart cities.
While rankings help to identify many elements about smart cities and to discern the smartest ones, they do not apprehend the different strategies between cities. Our study shows a classification to overcome this limit. The goal is not to determine the best smart city, but to comprehend the strategies implemented, and to understand if all cities are smart in the same way.
The remainder of this paper is organized as follows: The next sections present the variables selected to measure core capabilities and the statistical method used to obtain the clustering of sustainable smart city strategies. Then, we reveal the results. And finally, the findings will be discussed, and we will conclude.
2. Materials and Methods
Several classifications and indexes of smart cities exist and can be easily found on the internet. These rankings made by different organizations are republished in the media, and thus, participate in the international competition between global cities [23]. To select the cities included in our study, we use three indexes and analyze the rankings and the recurrence of the European cities.
Different criteria were used to assess the smart cities according to the indexes selected.
- −
- The IESE Cities in Motion Index 2019 [17] developed by the business school of the University of Navarra is based on the aggregation of various indicators grouped into nine dimensions: Economy, human capital, social cohesion, environment, governance, urban planning, international outreach, technology, and mobility and transportation. One hundred and seventy-four cities around the world integrate this classification.
- −
- The IMD Smart City Index is generated by the IMD World Competitiveness Center’s Smart City observatory in partnership with Singapore University of Technology and Design 2019 [18]. One hundred and two cities worldwide are evaluated according to five dimensions: Health and safety, mobility, activities, opportunities (work and education), and governance.
- −
- The Easypark Smart Cities Index 2019 [19] refers to seven categories of factors defining a smart city: Transport and mobility, sustainability, governance, innovation economy, digitalization, living standards, and expert perception. This information is collected from 100 cities around the world. Easypark is a company developing tools for parking lots in cities.
We extract the classification from each index and appoint the cities mentioned two or three times. We also include cities cited once only if they are the capital of their country. Three capital cities are added to our compilation, even if they are not cited in the selected indexes, to study a representative sample of the region. A total of 54 cities are initially listed as potential targets. Finally, due to the lack of data, we exclude 14 cities and gather all the information needed for our analysis for the 40 remaining cities.
The data collection includes: Seventy-nine variables to define the operational capabilities distributed over seven dimensions, six variables describing the socio-demographic aspects of cities, and one variable taking into account the impact of COVID-19 in the countries (see Appendix A). Fifty-two variables are available at the city level and 34 variables per country. We use major sources: Eurostat Digital Economy and Society Survey, OpenStreetMap (OSM), World Bank Open Data, OECD, and the UN (see Appendix A). All data is mobilized per inhabitant. The OSM extracted information is divided by the city population.
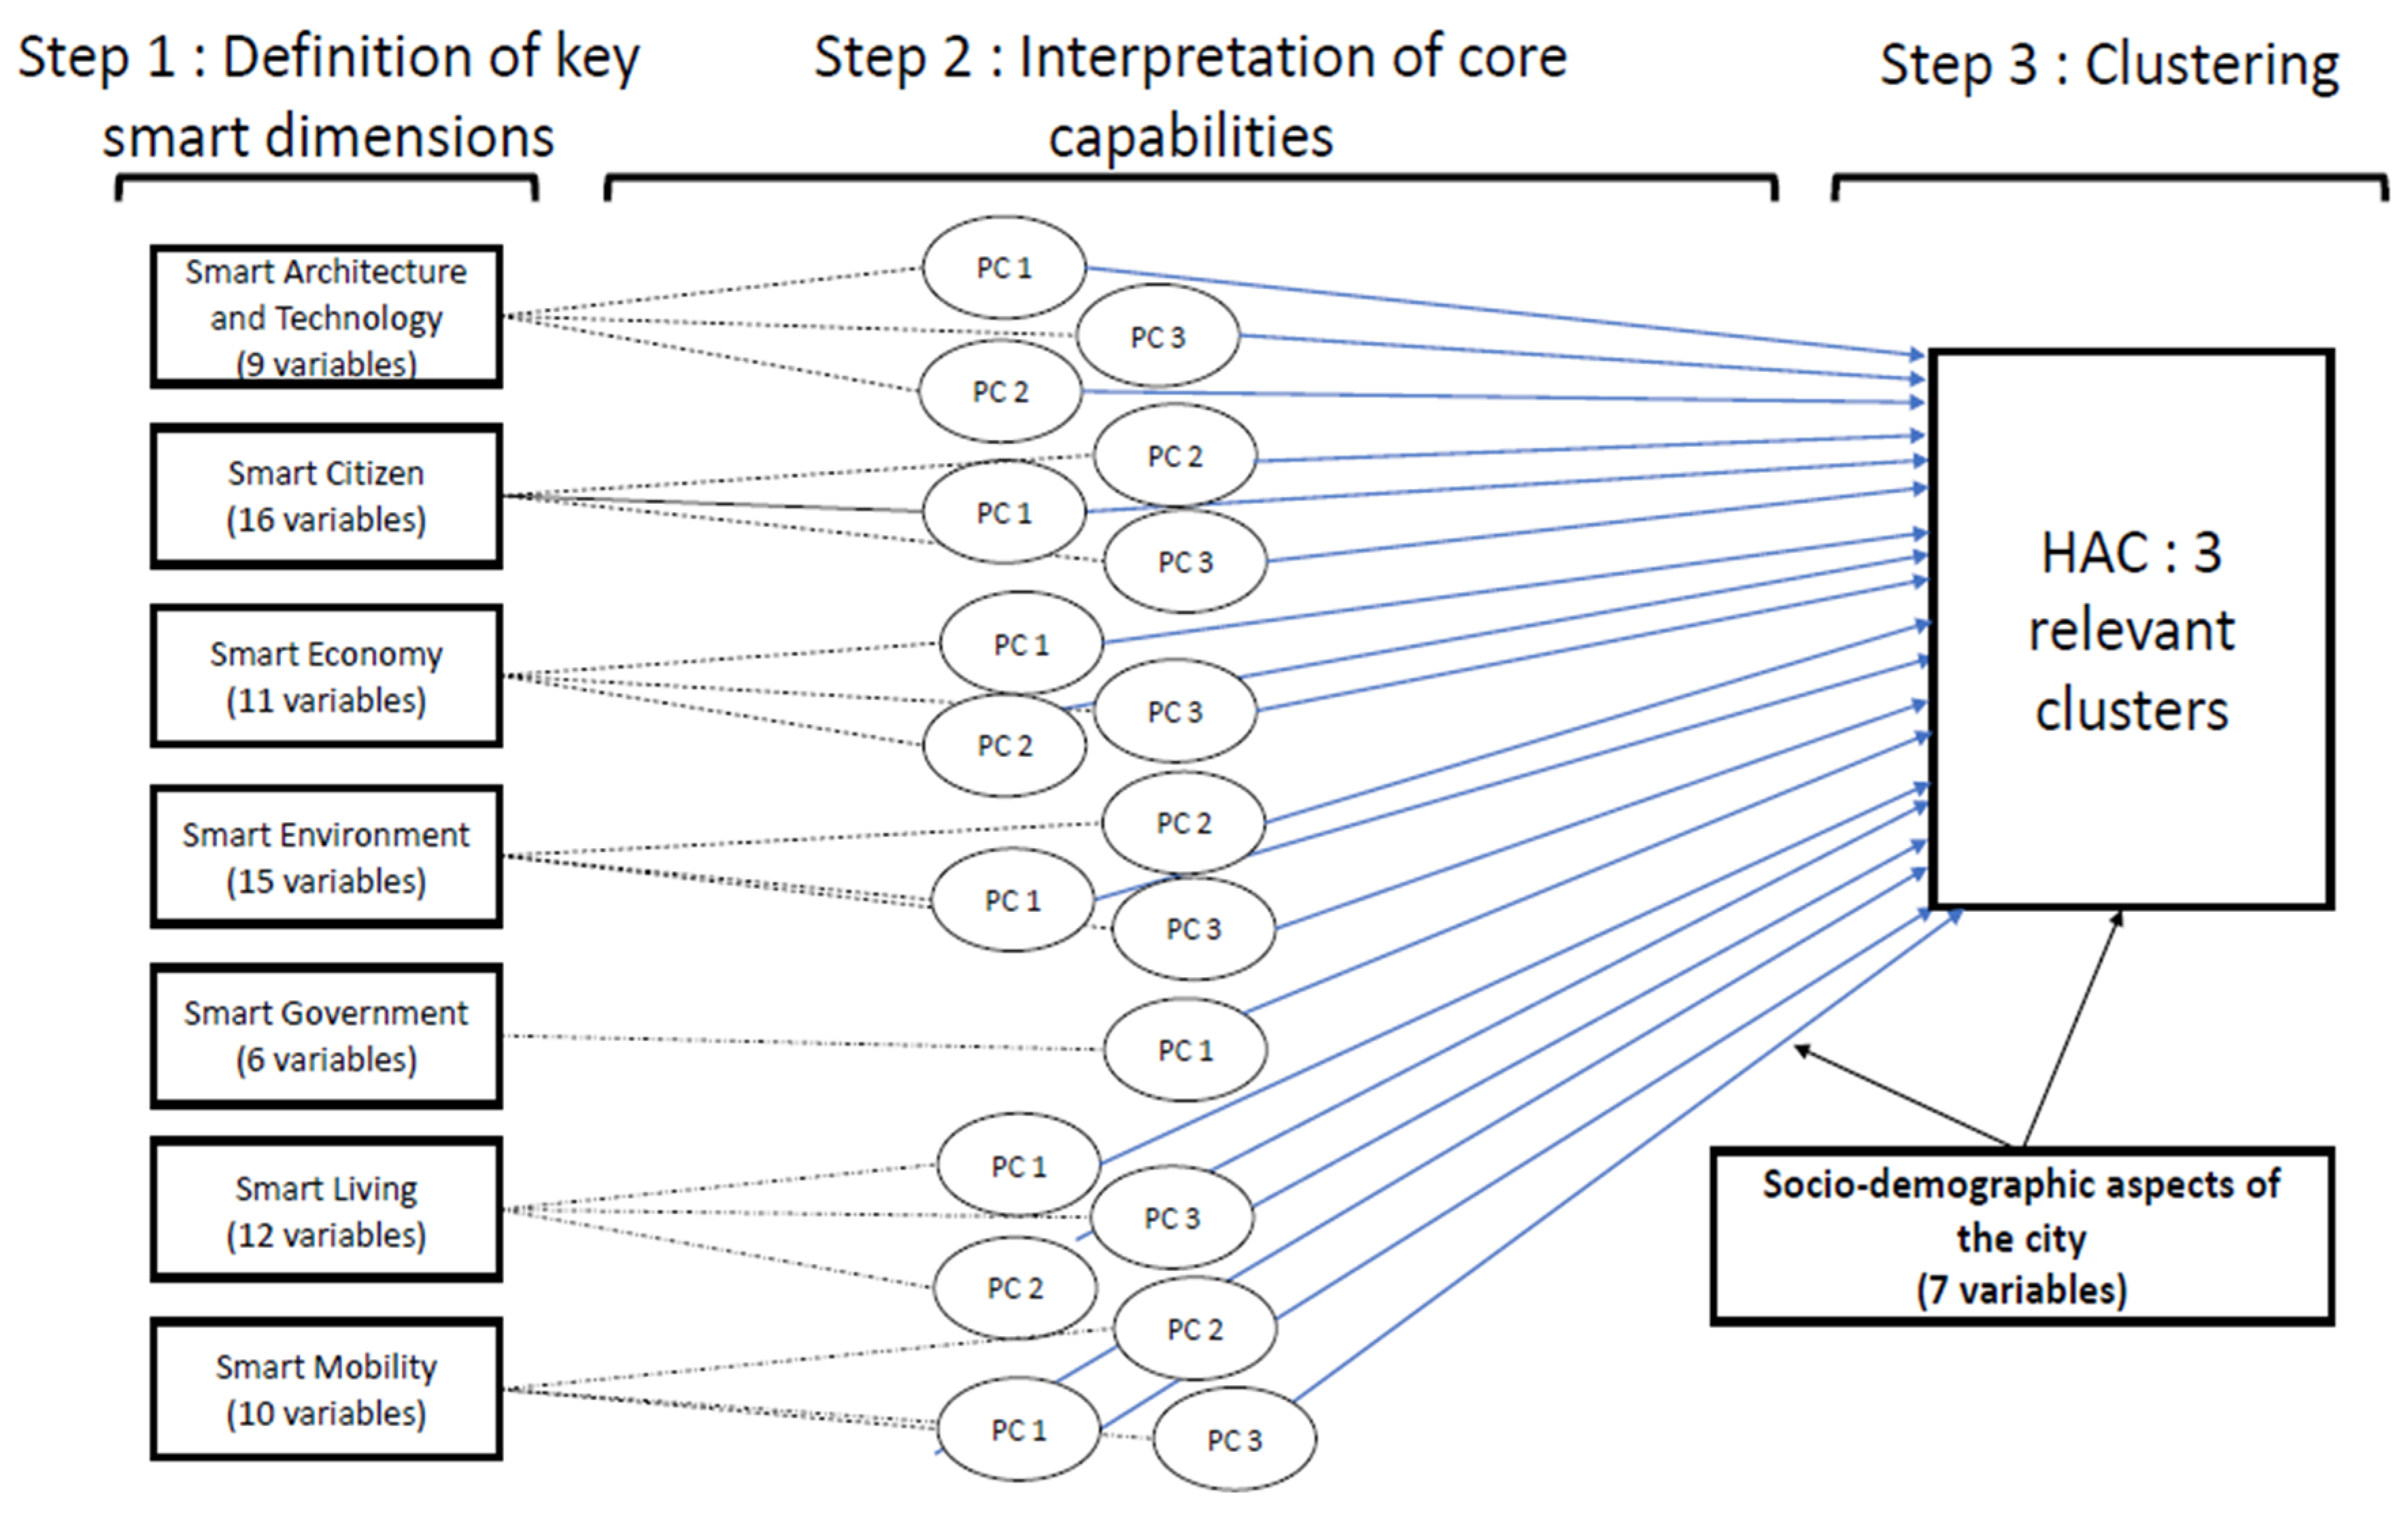
We examine European cities per key smart dimensions to label the core capabilities (see step 1 in Figure 1). Using variables following the seven smart dimensions identified by Ismagilova et al. [5], we estimate each principal component (PC) integrating socio-demographic aspects of the cities. As Giovannella et al. [22], by means of a PCA, we can extract underlying meanings behind the data, and thus, better understand the correlation between the dimensions. For each PC, we select the axes that explain at least 60% of the variance or the first three principal components (step 2 in Figure 1). After interpretation of core capabilities, we perform a HAC of the cities. The clustering of smart cities is based on the combination of all the principal components (core capabilities) from the seven PCA measures to identify homogeneous clusters of smart cities (step 3 in Figure 1).
Definition of Key Smart Dimensions
This section presents the first step of our analysis. In order to determine the core capabilities, we rely on definitions of each dimension recognized in the literature [5]. In line with the non-technology-centered vision supported by the global notion of the smart city of Angelidou [7], the goal of the dimension’s description is not to understand how it is attained but rather to acknowledge the weight of each dimension in the cities. It is not the technological solutions that are being questioned, but the deployment of the different dimensions in the smart strategy of a city. Each smart dimension is measured by operational capabilities (see Appendix A).
Smart architecture and technology dimension refers to several sensory devices working together through larger infrastructure, focusing on data processing, exchange, storage, and security [24]. This dimension concerns all the tools implemented by cities to provide smart services. Ismagilova et al. [5] cite numerous studies that highlight the importance of considering the security and privacy of data, but also the data processing and storage. The deployment of sensor and actuator networks on the streets to gather city data that could be used in real-time or exploited in non-real-time to ameliorate certain city operations are very characteristic of this smart dimension. However, the OSM mapping sensors and actuators are not well defined. Including this kind of information could represent an improvement of the present work. Although these are actual issues to be addressed for cities, we decide to focus on internet access to all individuals and businesses per country to illustrate this dimension. We integrate as indicators of this dimension: The average internet speed per city, the number of Wi-Fi free connection points (hotspots), the basic technical infrastructure, the points of energy production, the communication infrastructure, and the electronics sales points. To cover the relevance of the building architecture, we include construction infrastructure and logistics like storage and offices at the city scale. It is important to consider that data extracted from OSM and NomadList are collected from web user reports.
Smart citizens refer to social and human capital, and the degree of qualification of women and men with diverse backgrounds, who are motivated to learn and participate in the co-creation of public life [25]. This dimension analyses inhabitants’ capacities to understand and to employ the technology for developing the smart city [26,27]. To consider this dimension, we integrate several national indicators of utilizing digital services by inhabitants from the Eurostat. The measures are the basic digital skills of inhabitants and the regularity of internet use. Other variables, also at the national scale, make it possible to empathize the ability of individuals to seek and take the training online, to use online banking services, to order and sell products, to find multimedia content, and to apply for a job. The literature additionally highlights the importance of social interactions and communication from inhabitants [28,29]. Thus, we cover the utilization of social networks at the city scale by the participation of individuals in the identification of infrastructure on OSM. Furthermore, some authors consider individual engagement [30], and we capture this theme by the number of buildings occupied by civic associations, political parties, foundations, charities, and NGOs in the city. Additionally, to enclose the sharing economy, we also include the average cost of a coworking office and the number of coworking places in the city. Finally, the number of mobile shops, phone boxes, newspapers, and publishers in the city shows the individual access to information.
Smart economy explains the use of Information and Communication Technology (ICT) in the promotion and production processes by companies [25,31]. In this dimension, on the one hand, academic studies consider the modalities of business practices deployed by the companies [32], and on the other hand, the importance of e-commerce and m-commerce in cities [33]. These business practices are identified through utilizing CRM modules, automatic link with suppliers and customers, as well as online orders by the enterprise at the national scale in the Eurostat Digital Economy and Society Survey. The measure of the importance of e-commerce is explored via the share of enterprises’ turnover on e-commerce. The city’s business environment is questioned by commercial and industrial infrastructure. We include the number of industrial, commercial, and tertiary buildings registered in OSM. Moreover, the administrative requirements to start a business per country are also integrated by the number of days and the number of procedures necessary to open a business, from the ease of doing business classification of the World Bank. Finally, we add the number of embassies and diplomatic offices to involve the international and openness engagement of the city.
Smart environment refers to using ICT efficiently to care for natural resources and the planetary culture at the city scale [25,31]. The environmental dimension regards the different variables characterizing the quality of the environment and the impact of urban activities. They represent the major environmental challenges facing cities. To understand the air quality of a city, the following criteria are collected: Methane and PM 2.5 emissions. Castelli et al. [34] highlight efficient solutions for smart infrastructure to fight air quality pollution. To measure climate change impacts, CO2 emissions are considered at a national scale. The degree of green spaces is evaluated through the identification of parks, nature reserves, wetlands, and canopies in the municipality area. Urban biodiversity is included by the number of dovecotes, beehives, wildlife crossing points, nest boxes, insect hotels, and birdhouses. We decide to incorporate the urban sprawl by collecting information on the extension of suburban areas, blocks without urban continuity, and disused or vacant buildings at the city scale. Urban structure and construction have significant effects on pollution concentration [35]. The quality of drinking water is also analyzed [36,37] via the national percentage of access to drinking water and water-related infrastructure. The impact of the city on its environment is generally seen from the point of view of waste management [38,39,40]. To take this challenge into account, we choose the amount of municipal waste collected, and its treatment by identifying the waste storage and recycling infrastructure. Finally, we integrate the energy consumption [41], their green transition through the percentage of renewable energy consumption in the total energy consumption per country, as well as all the infrastructure characterizing renewable energy in cities.
Smart government makes reference to political strategies and policies, including expanded urban planning, which enables the co-production of public services, and tries to achieve democracy and transparency [25,31]. The aim of this dimension is to question the commitment of residents in the construction of the city’s strategy. It is a major element of the smart city strategy because technological means now allow for easier consultation of inhabitants by the city government. To assess this dimension, we underline online interactions between the population and the government, the downloading of official forms, using the website to obtain information from public authorities, the number of completed forms submitted via the internet, and a measure of the global use of e-government services. These smart government variables are issued from Eurostat per country. On the municipal scale, we collect the number of public buildings and estate offices.
Smart living examines the use of ICT for achieving quality of life in a liveable and safe environment [25,31]. This smart city dimension is mainly divided into four characteristics: Security, education, healthcare, and tourism. Regarding the security aspect, the literature provides principally technological solutions that improve the feeling of safety [42,43]. To take this dimension into account, we retained surveillance points in the city from OSM. The quality of education in a city is an element that has a direct impact on the quality of life of the inhabitants [44]. We include all the educational infrastructure indicated per city. The healthcare system of cities is also an important component of the quality of life [45,46,47]. While many studies are focused on technological solutions to improve access to care, our study aims to understand the state of the health system. Thus, we integrated healthcare infrastructure registered in the cities from OSM. The last aspect identified by the literature to evaluate the notion of quality of life relates to city tourism, underlying the idea that there can be a co-creation of value between tourists and residents of a city [48]. In this context, we choose to consider the infrastructure of receiving tourists from OSM. However, if these four themes are used in academic literature to describe the quality of life in a city, it appears critical to enriching them with two additional subjects. The first one corresponds to the amenities and private interests offered by the city for its inhabitants from OSM. We retain all the buildings relating to culture (art, cinema, theatre), sport, entertainment for children, religious and spiritual edifices, and restaurants. The second one considers the cost of living for the inhabitants.
In academic literature, smart mobility refers to using sustainable and innovative ICT in modern transport technologies to improve urban traffic, transport, logistics, and communication systems with local and national accessibility [25,31]. Regarding the urban traffic challenge, from a technological point of view [49,50], smart mobility focuses on the management of the flow of vehicles in the city by calculating the optimum route for each vehicle, while Zhu et al. [51] are interested in the possibilities offered by self-driving cars. However, these technological measures are only part of the solution and are still on experimentation. We include this theme by the number of hours lost per year in traffic jams in the city, the mortality, due to road traffic per 100,000 inhabitants, and the number of parking spaces offered at the city scale. While previous studies perform models to regulate traffic flow, other studies attempt to analyze modes of public transport [52]. Considering the improvement of alternative means of transport, we illustrate this aspect of smart mobility through the number of public transport stations, bicycle transport points, bicycle rental stations, and all the points allowing for their maintenance. It is also relevant to consider urban development intended for pedestrians. Furthermore, the new alternatives for vehicles are taken into account by the number of recharging points for electric vehicles, as well as some car-sharing services. These variables, therefore, make it possible to integrate the traffic flow and to measure the challenges facing cities in terms of congestion and mortality, and to highlight the solutions that are being deployed to reduce the number of vehicles.
3. Results
This section shows the main results of our analysis, corresponding to the second and third steps of the methodology. First, the interpretation of core capabilities through PCA is presented, and then a clustering is obtained with the HAC.
3.1. Interpretation of Core Capabilities
The second step focuses on the analysis of the core capabilities. Table 1 shows the results and the interpretation of each axis estimated. For each key smart city dimension, we retained the axes that explain at least 60% of the variance or the first three axes. We also included socio-economic variables describing the cities in the seven PCA. The following sub-sections present the analysis of each key smart dimension.
3.1.1. Smart Architecture and Technology
We analyze three axes that attain 65% of the cumulative variance. The first axis (A1_energy) mainly represents the energy in the city through the contribution of the variable power. The second (A2_equip_infra) is heavily correlated with technological equipment and infrastructure. It also includes the number of internet points in the city. The third axis (A3_on-line_access) combines internet speed, communication, and individual use of the internet. We can interpret this axis as the online accessibility at the city level. The urban population growth per country follows the technological infrastructure, internet, and mobile access.
3.1.2. Smart Citizens
The first component (C1_e-citizens) presents the use of internet services: Basic overall digital skills, an average of banking service on the internet, job research, and regular use of the internet. The second axis (C2_info) could be interpreted as the capacity of the citizens to build information about the city through the total number of declarations in OSM and the number of mobile and phone access. Another interesting correlation is coworking variables and social networks in the city, which could explain sharing trends of the digital economy (C3_sharing). The three main axes represent 68% of the cumulative variance.
3.1.3. Smart Economy
Three principal components explain 61% of the total inertia. The first axis (Ec1_e-commerce) represents the importance of e-commerce in enterprises’ activities. The second one (Ec2_business) enables us to understand the business environment of the city. It includes the number of businesses and industries, as well as the administrative procedures for opening a business in the country. Finally, the third axis (Ec3_openness) shows the tertiarization of the economy, in addition to the openness described by the diplomatic variable.
3.1.4. Smart Environment
We obtain three principal components for the smart environment dimension. The first axis (En1_air_pollution) explains 21% of the variance and allows us to understand the impact of air pollution (CO2, methane emissions, and the tons of waste per inhabitant). The second component (En2_revegetation) represents 18% of the variance and highlights the revegetation of cities through the presence of trees, canopies, and green spaces. We also observe that this data is negatively correlated to PM2.5 emissions. The third axis (En3_green_transition) shows how the cities are engaged in green transition with several variables: The part of renewable energies in the total energy consumption, the urban form through the number of hamlets, suburbs, and isolated dwellings, and the biodiversity protection in the city per inhabitant. The analysis of the supplementary variables illustrates that the second and the third components are opposed to density and population.
3.1.5. Smart Government
For the smart government, only the first axe (G1_e-government) explains 62% of the total inertia. It highlights the digital interaction between authorities and inhabitants. Therefore, it reveals the importance of e-government practices. Two relevant supplementary variables have been identified: GDP of the city, which is positively correlated to the axis, while density is negatively correlated to this first axis.
3.1.6. Smart Living
Three components have a cumulative variance of 67%. The first axis (L1_quality_life) explains the predominant characteristics of quality of life: Education, security, health, tourism, and religion. This component is correlated with population density. The second axis (L2_life_cost) represents the cost of living, and it is positively correlated with the city’s GDP. Finally, the third component (L3_heritage) highlights European heritage among cities with modern cultural heritage (high score on this axis) and cities with historical-cultural heritage.
3.1.7. Smart Mobility
The analysis of the smart mobility dimension refers to three principal components that explained 70% of the total inertia. The first axis (M1_car_use) describes the differences between the impact of car use (hours of traffic congestion and mortality) associated with the density and car alternatives (bicycle and pedestrian variables), but also, the presence of charging stations in the city. The second component (M2_metro) emphasizes the development of major infrastructures for transportation, such as subway stations, associated with population density, urban population growth, and life expectancy. The last component (M3_modalities) opposes the characteristics of the traditional kind of transport (cars and public transportation) to new ones, such as car-sharing, and to a lesser extent, cycling. Thus, this axis defines transport modalities.
3.2. Clustering of Smart Cities
The third step of our methodology is the main result of the present work: A European smart city clustering. Each cluster discerns a smart city sustainable approach. We extract the paragon cities to help the interpretation of the clustering and focus on some representative cities’ strategies. All data, statistic tables, and R codes are presented in the Supplementary Material.
Based on the seven PCA, the ascending hierarchical classification reveals three clusters for European cities (see Figure 2). The main core capabilities that characterize the partition of cities are e-citizens, e-government, e-commerce, information, and energy. All statistics, hierarchical tree, and description of each cluster by core capabilities are also included in the Supplementary Material.
The first cluster has high values on using the traditional mode of transport and significant air pollution. This group also presents the lowest values on variables illustrating the ability of inhabitants to be e-citizens, the practices of e-government, the energy production at the city scale, and developing e-commerce. Moreover, this cluster shows a lower level of the city’s GDP per capita compared to the other cities of the sample (see Table 2). Some of the most representative cities of the cluster are Athens, Milan, Nicosia, Rome, and Turin. We nominate this group as cities with emerging smart strategies.
Several core capabilities describe the second cluster. The highest values are for e-commerce development, e-citizens abilities, equipment and infrastructure at the city scale, e-government practices, city life cost, and online access. Predominantly, these cities are technology-oriented smart cities. In addition, these cities have the largest population and income of the sample (see Table 2). Amsterdam, Birmingham, Dublin, Madrid, and Stockholm are the paragons of this cluster.
Finally, our results show that the cities included in the third cluster are less populated and dense than the cities of the two other clusters, but with a relatively high GDP per capita. This cluster exhibits a good quality of life, capacity to generate information, conditions for economic growth and globalization, and high-energy production (see Table 2). These cities are also in the process of revegetation. However, they are characterized by car use even if subway infrastructure is present in the city. The core capabilities e-government, e-citizens, and European heritage have positive values but are not very significant. Because various core capabilities are built, the specificities of these cities are favorable for the development of smart cities and especially for the sustainability aspects. Cologne, Dusseldorf, Hannover, Ljubljana, and Vienna stand out in our analysis as representative cities from the third cluster.
4. Discussion
In this article, we classify forty European cities into three smart city clusters: Cities with emerging smart strategies, technology-oriented cities, and quality-life oriented smart cities. These strategies are steps to include in the smart city approach and its implementation towards sustainable smart city strategies [53,54,55].
The first cluster represents cities that are in the process of establishing smart strategies. They show high levels of pollution and the use of conventional means of transport. The variables characterizing smart policy observe relatively low scores, on the dimensions of e-citizens, government, economy, and living. Thus, compared to other cities in the sample, this group presents emerging smart strategies. Based on the description of this smart city cluster, Turin [56] illustrates the features of this first category. It experiences a high level of air pollution, intense use of cars, and conventional modes of transport. Turin developed the SMILE program, which is the master plan for implementing a smart city, started in 2012 with short-, medium- and long-term objectives. The first line of work was on the mobility dimension with a desire to operationalize alternative transport. Turin launched car-sharing in 2013, free-floating bikes in 2017, and carpooling in 2019. These actions correspond to the short-term objectives expected by the city, which had the time limit of 2020.
The second cluster, called technology-oriented cities, regroups European metropolises well equipped in infrastructure, with good economic development and architecture favorable to online accessibility. These cities display the importance of core capabilities to smart cities, such as e-commerce, e-citizens, and e-government. However, they also exhibit the significant cost of living and lower sharing trends compared with the other groups. These cities are victims of critical reviews from metropolization [57] caused by their size and complex urban relations that could harm the emergence of sustainable smart strategies. Amsterdam represents this second cluster. This city was considered a smart city long before the term was used. The city institutionalized this approach in 2009 by the partnership organization Amsterdam Smart City (ASC) [58]. It looks forward to engaging all its urban stakeholders, including inhabitants, to build a collaborative ecosystem developing small-scale projects in the greater Amsterdam metropolitan area. Some authors [59] highlight Amsterdam with an important focus on implementing an energy transition to cope with climate-related issues. One of the ambitious projects is an open-data map containing the baseline and potential for using renewable energy in the city called Energy Atlas [60]. The analysis of ASC reports [61] emphasizes some lessons learned from the deployment of the Energy Atlas project: (i) A smart city is not only about developing an advanced technological solution, but also the empowerment of actors in the city to innovate in response to recent city challenges; (ii) technology is only one tool for tackling city challenges; (iii) to innovate, stakeholders need to collaborate based on an agreement and trust each other; and (iv) a partnership organization, such as ASC is required for a smart city to connect the relevant actors, facilitate co-creation processes, and accelerate innovations. Similar challenges are underlined for Spanish smart cities [11]; they must see innovative technology as a medium to enable people to create and adapt business ideas to contribute to tackling energy and environmental challenges.
The third cluster integrates cities engaged in the improvement of the quality of life. Previous works have shown that the strategies for developing smart cities should include sustainable goals [53]. The smart city strategies in Europe are mainly oriented towards environmental goals to reduce CO2 emissions and to promote sustainable cities and urban resilience, driven by the European Commission’s policies [62]. The city of Vienna is a major smart city, engaged in this strategy since 2011. Vienna is regularly cited in cities’ classifications and well ranked for the quality of life and sustainability [63]. The smart city strategy of Vienna accentuates three themes: Environmental resources, quality of life, and innovation [64]. The strategy has two core aspects: The first one includes projects and policies that focus on the technological side, especially on energy efficiency, carbon emissions, etc. The second aspect canalizes the importance of the ICT infrastructure, e-government, mobile applications (public transport), e-health, and e-drive mobility. Fernandez-Anez et al. [65] show that the strategy deployed should integrate social and human capital by increasing efforts in the economy and governance. These two dimensions are presented in our results and suggest evolution and a positive dynamic for the sustainable smart city strategy.
The work of Perboli and Rosano [62] compares the European and North American perspectives on smart cities, and it is possible to analyze our clustering through their findings. Two key concepts are common to smart cities from European and North American perspectives: Adoption of digital tools, ICT, and emphasis on people and social aspects. Moreover, the authors [62] recognize the importance of life quality in a smart strategy for both viewpoints. The main difference between these two perspectives is the following: The European concept of a smart city refers to the environment and the natural resources and their sustainability. North American concept of a smart city refers to the interconnection and governance.
According to our results, it is possible to show that the third category corresponds to the main characteristics of European cities with the importance of environment and sustainability [10]. Whereas, the cities of the second cluster refer to the standards of world metropolitan cities, the interconnection and integration of them stand out. This underlines that not all European cities evolve in the same environment. Second-cluster cities compete with other world metropolises, some of which are in North America. Thus, they adopt smart strategies as a response to actions implemented by other cities. However, the cities of the third cluster do not face the same challenges of international competition. They can, therefore, react more precisely to European challenges by highlighting the importance of taking the environment into account in their strategy.
These outcomes allow us to achieve our first objective by presenting three smart city clusters rather than identifying the smartest city in Europe. The analysis of these clusters makes it possible to accomplish our second objective, which is to understand the sustainability of smart cities’ strategies. We show that smart cities can be qualified as sustainable, but in different ways.
As a reminder, the notion of dynamic capabilities reveals the ability of an organization to transform their core capabilities to respond to environmental change. These dynamic capabilities allow organizations to sense opportunities and threats in their external environment, to seize these opportunities, and finally, to transform their capabilities in order to become sustainable. Our results are in line with the work of Chong et al. [8] and Dameri and Ricciardi [10], showing that smart cities build dynamic capabilities because they implement a smart strategy to respond to the economic, environmental, and social challenges they face. For the first cluster, these are cities that have identified the opportunity to become smart and are in the process of transformation. For the second cluster, they are world global cities that have sensed the importance of the smart strategy to exist against global metropolises. Thus, they have seized and transformed their core capabilities by focusing on the dimensions of architecture and technology, and their governments maintain their status in international development. Finally, the third cluster presents advanced smart strategies, which respond to different challenges. These cities have also sensed, seized, and transformed their core capabilities according to their own challenges that are more attached to local influence by highlighting the dimensions of quality of life and the environment. Then, it is possible to say that smart strategy makes cities sustainable because they adapt to their environment.
Furthermore, the work of Dameri and Riccardi [10] allows us to pinpoint the nature of sustainability. They described smart cities through three types of dynamic capacities: Sustainability, or the ability to avoid over-exploitation of resources; robustness, or the ability to return to equilibrium after a crisis; and agility, or the ability to evolve and adapt. Our analysis shows that smart cities with dynamic capacities develop their capacity to be sustainable and agile. Moreover, this analysis can be enriched with the work of Ortega-Fernández et al. [11], who recommend differentiating the ways of being sustainable, following sustainable economic growth, sustainable in terms of technology and business, sustainable consumption and production patterns, sustainable developing resilient infrastructure, and sustainable by industrialization and fostering innovation. According to the sustainability approach of the three clusters of this article, the first category corresponds to environmental sustainability, because the main concerns of cities are attached to reducing pollution. The second cluster is associated with technological and government sustainability, corresponding to the classical definition of a smart city. While the third cluster is concerned with citizen sustainability, they are showing an alternative way to become smart, the strategy adopted by medium-sized European cities.
Nevertheless, our work presents some thresholds. The main limit is on the choice of variables to measure the seven dimensions—most of them are declarative data from OSM, thus, their reliability may be questioned. However, there exists no similar database at the city scale, which is why the mobilization of this data also constitutes a contribution to our study. The choice of our 40 cities can also be improved. However, access to homogeneous data per city is a critical issue in this type of analysis, and it may not exist for all cities. Therefore, access to data was defined as a selection criterion. We also decided to focus on well-identified smart cities in international classifications, which may have led us to omit cities at the begging of developing their smart city strategy, or cities that were less assessed by these rankings. Moreover, the methodology has some limits. First, we use 60% of total variance or the first three axes as a cut-off point for each PCA. We consider that it provided a better characterization of our data. Therefore, it is a subjective statement. Second, the interpretation of the axes is also subject to an important part of our study.
Future research lines of the present work could allow for the robustness dimension identified by Dameri and Ricciardi [10] to be elaborated. It would be relevant to explore the reactions of these cities to pandemic crises to consider the robustness capacity. For example, Marsal-Llacuna et al. [66] analyze robustness from the Barcelona Local Agenda by a PCA of 24 indicators to determine a synthetic index that assessed the city’s smartness. They also underline the need for developing tools and precise data to accurately evaluate the transformations observed in cities.
How to build resilient cities to global change, but also for health issues. This article carries out significant focus research on the cumulative number of COVID-19 patients per country in every smart dimension. We find that the COVID-19 variable is not representative. Even though, it is too early to conclude the impact of the present pandemic that has created new challenges in all facets of the cities’ lives.
5. Conclusions
Through the mobilization of an empirical analysis of smart cities, the article shows that there is not a smart city but three kinds of smart city in Europe. Moreover, we reveal how European cities become sustainable via their smart strategy.
From the point of view of sustainable smart cities [8,10,11], it appears relevant to highlight that the three clusters are developing dynamic capabilities to different degrees. They implement a smart strategy to respond to the economic, environmental, and social challenges they confront. For the first cluster, these cities have identified the opportunity to become smart and are in the process of transformation. For the second cluster, they are global world cities that have sensed the importance of the smart strategy to compete against global metropolises. Thus, they have seized and transformed their core capabilities by focusing on the dimensions of smart architecture and technology, and smart government to continue to be players in international development. The third cluster presents advanced smart strategies, which face up to different challenges. These cities have created their core capabilities according to their own challenges, which are more linked to local influence, by highlighting the dimensions of quality of life and environment.
Finally, our work underlines some axes of improvement: To examine the combinations of smart city dimensions and to better understand the complementarity of each of the smart dimensions within the development of a global strategy. In addition, this work focuses on the analysis of European cities. The smart phenomenon being global, it would be appropriate to extend the study to another geographical area and to observe if the three clusters are still relevant or if new types of smart cities should be identified.
Supplementary Materials
The following are available online at https://www.mdpi.com/2071-1050/13/2/513/s1, the data of this study are openly available, including R code, statistics, and main figures of the principal component analyses and clustering.
Author Contributions
For this article C.C.-V. and R.W. did the ground exploration and the initial research to acquire the theoretical framework. R.W. focused on the knowledge management framework and C.C.-V. analysed the smart city approach. All authors collected data. C.C.-V. realized all the statistical analyses. J.B. made the maps. All authors have read and agreed to the published version of the manuscript.
Funding
This research received no external funding.
Data Availability Statement
The data presented in this study are openly available as Supplementary Materials.
Acknowledgments
Authors thank French Finance Innovation Cluster (https://finance-innovation.org/) for the engaging debates and Sharon Neuman for proofreading comments. We thank the four reviewers for their relevant and improvement requests.
Conflicts of Interest
The authors declare no conflict of interest in this article.
Appendix A

Table A1.
List of Variables Describing the Operational Capabilities per Smart City Dimension.
| Variables | Description | Source * |
|---|---|---|
| Smart Architecture and Technology | ||
| access | Individuals using mobile devices to access the internet on the move in the country. | Eurostat Digital Economy and Society Survey. |
| ent_broadband | Enterprises with broadband access in the country. | Eurostat Digital Economy and Society Survey. |
| power | Numbers of buildings, such as energy suppliers, power centers, transformer towers, poles, substations, transformers, portals, generators, catenaries, insulators, switches, terminals, substations, cable distribution, connections, and compensators in the city per inhabitant. | OpenStreetMap. |
| communication | Numbers of buildings, such as communication towers, data centers and technology in the city per inhabitant. | OpenStreetMap. |
| electronics | Numbers of shops and offices of electrical supplies, computer repairs, electronics, computers, hi-fi, videos, electrical equipment, cameras, printing, photo studios, software, I.T., and electronics in the city per inhabitant. | OpenStreetMap. |
| construction | Numbers of offices of engineers, architects, construction companies, engineering offices; and a number of buildings, such as container units, air shafts, construction buildings, bridges, towers, containers, storage tanks, demolition offices, tunnels and building passages in the city per inhabitant. | OpenStreetMap. |
| logistics | Number of offices for logistics, storage and building of depots in the city per inhabitant. | OpenStreetMap. |
| internet | Numbers of internet points in the city, such as coffee shops or Wi-Fi zones per inhabitant. | OpenStreetMap. |
| internet_speed | Mbps (average) in the city. | NomadList. |
| Smart Citizens | ||
| online_banking | Internet banking includes electronic transactions with a bank for payment, etc. or for looking up account information in the country. | Eurostat Digital Economy and Society Survey. |
| online_info | Individuals using the internet to find information about goods and services in the country. | Eurostat Digital Economy and Society Survey. |
| online_job | Individuals using the internet to look for a job or to send out a job application in the country. | Eurostat Digital Economy and Society Survey. |
| online_course | Individuals using the internet to do an online course in the country. | Eurostat Digital Economy and Society Survey. |
| online_content | Individuals using the internet to buy or order online content in the country. | Eurostat Digital Economy and Society Survey. |
| online_purchase | Individuals using the internet to order goods or services in the country. | Eurostat Digital Economy and Society Survey. |
| basic_skills | Individuals who have basic or above basic overall digital skills in the country. | Eurostat Digital Economy and Society Survey. |
| regular_use | Individuals regularly using the internet in the country. | Eurostat Digital Economy and Society Survey. |
| social_networks | Individuals using the internet to participate in social networks in the country. | Eurostat Digital Economy and Society Survey. |
| coworking | Number of coworking spaces and shared office spaces in the city per inhabitant. | OpenStreetMap. |
| civic | Number of buildings for civic use and number of offices of political parties, associations, foundations, NGOs, charities, trade unions or associations of workers in the city per inhabitant. | OpenStreetMap. |
| phone | Number of phone boxes or telephones on a stand or wall in the city per inhabitant. | OpenStreetMap. |
| mobile | Number of shops for mobile phones and cell phones in the city per inhabitant. | OpenStreetMap. |
| media | Number of offices for newspapers and publishers in the city per inhabitant. | OpenStreetMap. |
| osm_all_data | Number of reported sites in the city per inhabitant. | OpenStreetMap. |
| cost_coworking | Cost of coworking spaces per USD$/month per city. | |
| Smart Economy | ||
| turnover_eeco | Share of enterprises’ turnover on e-commerce in the country. | Eurostat Digital Economy and Society Survey. |
| industrial | Number of industrial buildings and industrial areas in the city per inhabitant. | OpenStreetMap. |
| commercial | Number of buildings, such as florists, retail outlets, commercial outlets, shops, kiosks, supermarkets, malls, shopping centers, hat shops, handbag shops, bag shops, suit shops, clothing shops, convenience stores, beauty salons, shoe shops, jewellery stores, cosmetic boutiques, hardware stores, bakeries, seafood stores, beverage shops, chocolate shops, perfumery stores, boutiques, garden centers, fashion shops, department stores, variety stores, accessory shops, fabric stores, and watch shops in the city per inhabitant. | OpenStreetMap. |
| tertiary | Number of offices, such as visa, banks, advertising agencies, financial offices, property management agencies, consulting engineers, investment bankers, financial services, surveyors, web designers, mortgage agencies, insurance agencies, lawyer offices, accountant offices, tax advisor offices, financial institutions, notaries, marketing agencies, consulting firms, and building management offices in the city per inhabitant. | OpenStreetMap. |
| diplomatic | Number of embassies, consulates, and diplomatic offices in the city per inhabitant. | OpenStreetMap. |
| startbusiness | Start-up procedures to register a business (number) 2019 in the country. | World Bank. |
| timebusiness | Time required to start a business (days) 2019 in the country. | World Bank. |
| ent_CRM | Enterprises using software solutions, like CRM to analyse information about clients for marketing purposes in the country. | Eurostat Digital Economy and Society Survey. |
| ent_automatic | Enterprises whose business processes are automatically linked to those of their suppliers and/or customers in the country. | Eurostat Digital Economy and Society Survey. |
| ent_onlineorder | Enterprises having received orders online (at least 1%) in the country. | Eurostat Digital Economy and Society Survey. |
| turnover_eeco_SME | Share of SME enterprises’ turnover on e-commerce in the country. | Eurostat Digital Economy and Society Survey. |
| Smart Environment | ||
| pm_2.5 | Mean population exposure to PM2.5 air pollution µg/m3 in the city (2019). | OECD. |
| waste_tons | Total amount of municipal waste collected (per 1000 tons) in the country per inhabitant (2016). | UN Data. |
| conso_renewable | Renewable energy consumption (% of total energy consumption) per country (2015). | World Bank. |
| CO2_emissions | Carbon emissions in kt/ total population per country per inhabitant (2016). | World Bank. |
| methane | Methane emissions (kt of CO2 equivalent)/ total population per country per inhabitant (2012). | World Bank. |
| drinking_water | People using at least basic drinking water services (% of the population) per country (2017). | World Bank. |
| tree | Number of trees in the city per inhabitant. | OpenStreetMap. |
| green | Number of green spaces in the city: gardens, scrubs, grasslands, forests, farmland, meadows, village greens, orchards, vineyards, green fields, plant nurseries, urban greens, conservation places, parks, natural reserves, woods, wetlands in the city per inhabitant. | OpenStreetMap. |
| water | Number of drinking water points, fountains, water sources, reservoirs, basins, water towers, water works, water tanks, and water parks in the city per inhabitant. | OpenStreetMap. |
| recycling | Number of recycling sites in the city per inhabitant. | OpenStreetMap. |
| suburb | Number of hamlets, suburbs, and isolated dwellings in the city per inhabitant. | OpenStreetMap. |
| disused | Number of vacant and disused buildings in the city per inhabitant. | OpenStreetMap. |
| renewable | Number of renewable energy sites, such as hydro, solar, photovoltaic, biomass installations in the city per inhabitant. | OpenStreetMap. |
| waste | Number of waste treatment sites and landfills in the city per inhabitant. | OpenStreetMap. |
| biodiversity | Number of nest boxes, insect hotels, birdhouses, dovecotes, beehives, wildlife crossings and bird hides in the city per inhabitant. | OpenStreetMap. |
| Smart Government | ||
| download_forms | Internet use: downloading official forms (last 12 months) per country (2019). | Eurostat Digital Economy and Society Survey. |
| info_public | Internet use: obtaining information from public authorities’ web sites (last 12 months) per country (2019). | Eurostat Digital Economy and Society Survey. |
| submit_forms | Internet use: submitting completed forms (last 12 months) per country (2019). | Eurostat Digital Economy and Society Survey. |
| interaction | Individuals who used at least one of the following services: to obtain information from public authorities’ websites, to download official forms, to submit completed forms per country (2019). Within the last 12 months before the survey for private purposes. Derived variable on use of e-government services. | Eurostat Digital Economy and Society Survey. |
| consult_voting | Internet use: taking part in online consultations or voting to define civic or political issues (e.g., urban planning, signing a petition) per country (2019). | Eurostat Digital Economy and Society Survey. |
| public | Number of public spaces, buildings, and offices in the city per inhabitant. | OpenStreetMap. |
| Smart Living | ||
| education | Individuals using the internet to look for information about education, training or course offers in the country (2015). | Eurostat Digital Economy and Society Survey. |
| surveillance | Number of surveillance cameras or other types of surveillance equipment in the city per inhabitant. | OpenStreetMap. |
| schools | Number of schools, universities, colleges, research institutes, language schools, libraries, conference centers, music schools in the city per inhabitant. | OpenStreetMap. |
| art | Number of cultural centers, art centers, exhibition halls, art galleries and art shops in the city per inhabitant. | OpenStreetMap. |
| sport | Number of sport buildings in the city per inhabitant. | OpenStreetMap. |
| food | Number of marketplaces, food courts, fast food outlets, coffee roasting boutiques, spice shops, vegetable stands, cheese shops, health food stores, frozen food stores, tea shops, herbalist shops, and food growing spaces in the city per inhabitant. | OpenStreetMap. |
| medical | Number of clinics, pharmacies, doctors’ offices, dentists, healthcare centers, hospitals, laboratories in the city per inhabitant. | OpenStreetMap. |
| kids | Number of kid-friendly spaces: childcare centers, kindergartens, recreation grounds, playgrounds, miniature golf courses, indoor play areas, and baby goods shops in the city per inhabitant. | OpenStreetMap. |
| amenity | Number of theatres, cinema, casinos, nightclubs, clubs, social centers, museums in the city per inhabitant. | OpenStreetMap. |
| religion | Number of religious edifices and buildings in the city per inhabitant. | OpenStreetMap. |
| tourism | Number of touristic sites and buildings in the city per inhabitant. | OpenStreetMap. |
| cost_living_local | Cost of living for local people per USD/month (2020). | NomadList. |
| Smart Mobility | ||
| hours_congestion | Inrix hours lost in traffic congestion in the city (2019). | Scorecard Inrix. |
| metro_stations | Number of metro stations per inhabitant in the city (2006). | Metrobits. |
| metro_length | Length of metro lines in km per inhabitant in the city (2006). | Metrobits. |
| parking | Number of parking spots in the city per inhabitant. | OpenStreetMap. |
| public_transport | Number of public transport infrastructures: platforms, stop positions, stations, entrances, trams, railway stations in the city per inhabitant. | OpenStreetMap. |
| car_sharing | Number of car-sharing places in the city per inhabitant. | OpenStreetMap. |
| bicycle | Number of bicycle parking spots, bicycle rental places, bicycle repair stations, and bicycle shops in the city per inhabitant. | OpenStreetMap. |
| pedestrian | Number of pedestrian pavements and footway sites in the city per inhabitant. | OpenStreetMap. |
| trafficmort | Mortality caused by road traffic injuries (per 100,000 people) per country (2016). | World Bank. |
| charging_station | Number of electric charging stations in the city per inhabitant. | OpenStreetMap. |
| Socio-demographic aspects of the cities | ||
| pop_city | Population in the metropole area (2018). | OECD. |
| pop_total | Total population per country. Total population is based on the de facto definition of population, which counts all residents regardless of legal status or citizenship. The values shown are midyear estimates (2019). | World Bank. |
| gdp_city | GDP per capita (USD constant prices) per city (2018). | OECD. |
| density | Population density inhabitants per km2 per city (2018). | OECD. |
| urban_growth | Urban population growth (annual %) per country (2019). | World Bank. |
| life_expectancy | Average life expectancy in years, males and females per country (2016). | WHO. |
| covid_cases | Cumulative number for 14 days of COVID-19 cases per 100,000 until the 10 October 2020 per country. | EU Open Data Portal. |
* Data from OpenStreetMap was extracted on 29 October 2020.
References
- Chourabi, H.; Nam, T.; Walker, S.; Gil-Garcia, J.R.; Mellouli, S.; Nahon, K.; Pardo, T.A.; Scholl, H.J. Understanding Smart Cities: An Integrative Framework. In Proceedings of the Annual Hawaii International Conference on System Sciences, Maui, HI, USA, 4–7 January 2012; pp. 2289–2297. [Google Scholar]
- United Nations. World Urbanization Prospects The 2018 Revision; United Nations: New York, NY, USA, 2019. [Google Scholar]
- Israilidis, J.; Odusanya, K.; Mazhar, M.U. Exploring Knowledge Management Perspectives in Smart City Research: A Review and Future Research Agenda. Int. J. Inf. Manag. 2019, 1–10. [Google Scholar] [CrossRef]
- Anthopoulos, L. Understanding the Smart City Domain: A Literature Review. In Public Administration and Information Technology; Rodriguez-Bolivar, M.P., Ed.; Springer: Berlin/Heidelberg, Germany, 2015; pp. 9–21. [Google Scholar]
- Ismagilova, E.; Hughes, L.; Dwivedi, Y.K.; Raman, K.R. Smart Cities: Advances in Research—An Information Systems Perspective. Int. J. Inf. Manag. 2019, 47, 88–100. [Google Scholar] [CrossRef]
- Mosannenzadeh, F.; Bisello, A.; Vaccaro, R.; D’Alonzo, V.; Hunter, G.W.; Vettorato, D. Smart Energy City Development: A Story Told by Urban Planners. Cities 2017, 64, 54–65. [Google Scholar] [CrossRef]
- Angelidou, M. Smart City Policies: A Spatial Approach. Cities 2014, 41, S3–S11. [Google Scholar] [CrossRef]
- Chong, M.; Habib, A.; Evangelopoulos, N.; Park, H.W.; Nasrawi, S.A.A.; Adams, C.; El-Zaart, A.; Emergence, S.C.; Balaban, O.; Côme, T.; et al. Dynamic Capabilities of a Smart City: An Innovative Approach to Discovering Urban Problems and Solutions. Gov. Inf. Q. 2018, 35, 682–692. [Google Scholar] [CrossRef]
- Albino, V.; Berardi, U.; Dangelico, R.M. Smart Cities: Definitions, Dimensions, Performance, and Initiatives. J. Urban Technol. 2015, 22, 3–21. [Google Scholar] [CrossRef]
- Dameri, R.P.; Ricciardi, F. Smart City Intellectual Capital: An Emerging View of Territorial Systems Innovation Management. J. Intellect. Cap. 2015, 16, 860–887. [Google Scholar] [CrossRef]
- Ortega-Fernández, A.; Martín-Rojas, R.; García-Morales, V.J. Artificial Intelligence in the Urban Environment: Smart Cities as Models for Developing Innovation and Sustainability. Sustainability 2020, 12, 7860. [Google Scholar] [CrossRef]
- Teece, D.J.; Pisano, G.; Shuen, A. Dynamic Capabilities and Strategic Management. Strategy Manag. J. 1997, 18, 509–533. [Google Scholar] [CrossRef]
- Giffinger, R.; Haindlmaier, G.; Kramar, H. The Role of Rankings in Growing City Competition. Urban Res. Pract. 2010, 3, 299–312. [Google Scholar] [CrossRef]
- Appio, F.P.; Lima, M.; Paroutis, S. Understanding Smart Cities: Innovation Ecosystems, Technological Advancements, and Societal Challenges. Technol. Forecast. Soc. Chang. 2018, 142, 1–14. [Google Scholar] [CrossRef]
- Stübinger, J.; Schneider, L. Understanding Smart City—A Data-Driven Literature Review. Sustainability 2020, 12, 8460. [Google Scholar] [CrossRef]
- Anthopoulos, L. Smart City Emergence. Cases from around the World; Joe Hayton: Chennai, India, 2019; ISBN 978-0-12-816169-2. [Google Scholar]
- IESE. IESE Cities in Motion Index; Business School University of Navarra: Madrid, Spain, 2019; p. 100. [Google Scholar]
- IMD World Conpetitiveness Center. IMD Smart City Index 2019; IMD World Competitiveness Center’s Smart City Observatory: Lausanne, Switzerland, 2019; p. 220. [Google Scholar]
- Easypark Smart Cities Index 2019. Available online: https://www.easyparkgroup.com/smart-cities-index/ (accessed on 14 November 2020).
- Li, X.; Fong, P.S.W.; Dai, S.; Li, Y. Towards sustainable smart cities: An empirical comparative assessment and development pattern optimization in China. J. Clean. Prod. 2019, 215, 730–743. [Google Scholar] [CrossRef]
- Akande, A.; Cabral, P.; Gomes, P.; Casteleyn, S. The Lisbon ranking for smart sustainable cities in Europe. Sustain. Cities Soc. 2019, 44, 475–487. [Google Scholar] [CrossRef]
- Giovannella, C.; Dascalu, M.; Scaccia, F. Smart City Analytics: State of the Art and Future Perspectives. Interact. Des. Archit. J. 2014, 20, 72–87. [Google Scholar]
- Anthopoulos, L.; Fitsilis, P. Smart Cities and Their Roles in City Competition: A Classification. Int. J. Electron. Gov. Res. 2014, 10, 63–77. [Google Scholar] [CrossRef] [Green Version]
- Voas, J. Demystifying the Internet of Things. Computer 2016, 49, 80–83. [Google Scholar] [CrossRef]
- Staffans, A.; Horelli, L. Expanded Urban Planning as a Vehicle for Understanding and Shaping Smart, Liveable Cities. J. Community Inf. 2014, 10, 10. [Google Scholar] [CrossRef]
- Belanche-Gracia, D.; Casaló-Ariño, L.V.; Pérez-Rueda, A. Determinants of Multi-Service Smartcard Success for Smart Cities Development: A Study Based on Citizens’ Privacy and Security Perceptions. Gov. Inf. Q. 2015, 32, 154–163. [Google Scholar] [CrossRef]
- Yeh, H. The Effects of Successful ICT-Based Smart City Services: From Citizens’ Perspectives. Gov. Inf. Q. 2017, 34, 556–565. [Google Scholar] [CrossRef]
- Sproull, L.; Patterson, J.F. Making Information Cities Livable. Commun. ACM 2004, 47, 33. [Google Scholar] [CrossRef]
- Sun, J.; Poole, M.S. Beyond Connection: Situated Wireless Communities. Commun. ACM 2010, 53, 121–125. [Google Scholar] [CrossRef]
- El-Haddadeh, R.; Weerakkody, V.; Osmani, M.; Thakker, D.; Kapoor, K.K. Examining Citizens’ Perceived Value of Internet of Things Technologies in Facilitating Public Sector Services Engagement. Gov. Inf. Q. 2019, 36, 310–320. [Google Scholar] [CrossRef] [Green Version]
- Al-Nasrawi, S.; Adams, C.; El-Zaart, A. A Conceptual Multidimensional Model for Assessing Smart Sustainable Cities. JISTEM 2015, 12, 541–558. [Google Scholar]
- Johnson, P.; Iacob, M.E.; Välja, M.; van Sinderen, M.; Magnusson, C.; Ladhe, T. A Method for Predicting the Probability of Business Network Profitability. Inf. Syst. E-Bus. Manag. 2014, 12, 567–593. [Google Scholar] [CrossRef]
- Keegan, S.; O’Hare, G.M.P.; O’Grady, M.J. Retail in the Digital City. Int. J. E-Bus. Res. 2012, 8, 18–32. [Google Scholar] [CrossRef] [Green Version]
- Castelli, M.; Gonçalves, I.; Trujillo, L.; Popovič, A. An Evolutionary System for Ozone Concentration Forecasting. Inf. Syst. Front. 2017, 19, 1123–1132. [Google Scholar] [CrossRef]
- Cárdenas Rodríguez, M.; Dupont-Courtade, L.; Oueslati, W. Air Pollution and Urban Structure Linkages: Evidence from European Cities. Renew. Sustain. Energy Rev. 2016, 53, 1–9. [Google Scholar] [CrossRef]
- Hrudey, S.E.; Conant, B.; Douglas, I.P.; Fawell, J.; Gillespie, T.; Hill, D.; Leiss, W.; Rose, J.B.; Sinclair, M. Managing Uncertainty in the Provision of Safe Drinking Water. Water Supply 2011, 11, 675–681. [Google Scholar] [CrossRef] [Green Version]
- Polenghi-Gross, I.; Sabol, S.A.; Ritchie, S.R.; Norton, M.R. Water Storage and Gravity for Urban Sustainability and Climate Readiness. J. AWWA 2014, 106, E539–E549. [Google Scholar] [CrossRef]
- Anagnostopoulos, T.; Zaslavsky, A.; Sosunova, I.; Fedchenkov, P.; Medvedev, A.; Ntalianis, K.; Skourlas, C.; Rybin, A.; Khoruznikov, S. A Stochastic Multi-Agent System for Internet of Things-Enabled Waste Management in Smart Cities. Waste Manag. Res. 2018, 36, 1113–1121. [Google Scholar] [CrossRef] [PubMed]
- Oralhan, Z.; Oralhan, B.; Yiğit, Y. Smart City Application: Internet of Things (IoT) Technologies Based Smart Waste Collection Using Data Mining Approach and Ant Colony Optimization. Int. Arab J. Inf. Technol. 2017, 14, 423–427. [Google Scholar]
- Rybnytska, O.; Burstein, F.; Rybin, A.V.; Zaslavsky, A. Decision Support for Optimizing Waste Management. J. Decis. Syst. 2018, 27, 68–78. [Google Scholar] [CrossRef]
- Peña, M.; Biscarri, F.; Guerrero, J.I.; Monedero, I.; León, C. Rule-Based System to Detect Energy Efficiency Anomalies in Smart Buildings, a Data Mining Approach. Expert Syst. Appl. 2016, 56, 242–255. [Google Scholar] [CrossRef]
- Breetzke, T.; Flowerday, S.V. The Usability of IVRs for Smart City Crowdsourcing in Developing Cities. Electron. J. Inf. Syst. Dev. Ctries. 2016, 73, 1–14. [Google Scholar] [CrossRef]
- Cilliers, L.; Flowerday, S. Factors That Influence the Usability of a Participatory IVR Crowdsourcing System in a Smart City. S. Afr. Comput. J. 2017, 29. [Google Scholar] [CrossRef] [Green Version]
- Vincent, J.M. Public Schools as Public Infrastructure: Roles for Planning Researchers. J. Plan. Educ. Res. 2006, 25, 433–437. [Google Scholar] [CrossRef]
- Hussain, A.; Wenbi, R.; da Silva, A.L.; Nadher, M.; Mudhish, M. Health and Emergency-Care Platform for the Elderly and Disabled People in the Smart City. J. Syst. Softw. 2015, 110, 253–263. [Google Scholar] [CrossRef]
- Pramanik, M.I.; Lau, R.Y.K.; Demirkan, H.; Azad, M.A.K. Smart Health: Big Data Enabled Health Paradigm within Smart Cities. Expert Syst. Appl. 2017, 87, 370–383. [Google Scholar] [CrossRef]
- Thibaud, M.; Chi, H.; Zhou, W.; Piramuthu, S. Internet of Things (IoT) in High-Risk Environment, Health and Safety (EHS) Industries: A Comprehensive Review. Decis. Support Syst. 2018, 108, 79–95. [Google Scholar] [CrossRef]
- Gretzel, U.; Sigala, M.; Xiang, Z.; Koo, C. Smart Tourism: Foundations and Developments. Electron. Mark. 2015, 25, 179–188. [Google Scholar] [CrossRef] [Green Version]
- Adart, A.; Mouncif, H.; Naimi, M. Vehicular Ad-Hoc Network Application for Urban Traffic Management Based on Markov Chains. Int. Arab J. Inf. Technol. 2017, 14, 624–631. [Google Scholar]
- Calderoni, L.; Maio, D.; Rovis, S. Deploying a Network of Smart Cameras for Traffic Monitoring on a “City Kernel”. Expert Syst. Appl. 2014, 41, 502–507. [Google Scholar] [CrossRef]
- Zhu, W.; Gao, D.; Zhao, W.; Zhang, H.; Chiang, H.-P. SDN-Enabled Hybrid Emergency Message Transmission Architecture in Internet-of-Vehicles. Enterp. Inf. Syst. 2018, 12, 471–491. [Google Scholar] [CrossRef]
- Kumar, H.; Singh, M.K.; Gupta, M.P. Evaluating the Competitiveness of Indian Metro Cities: In Smart City Context. Int. J. Inf. Technol. Manag. 2017, 16, 333–347. [Google Scholar] [CrossRef]
- Ahvenniemi, H.; Huovila, A.; Pinto-Seppä, I.; Airaksinen, M. What are the Differences between Sustainable and Smart Cities? Cities 2017, 60, 234–245. [Google Scholar] [CrossRef]
- Ahad, M.A.; Paiva, S.; Tripathi, G.; Feroz, N. Enabling Technologies and Sustainable Smart Cities. Sustain. Cities Soc. 2020, 61, 102301. [Google Scholar] [CrossRef]
- Suartika, G.A.M.; Cuthbert, A. The Sustainable Imperative—Smart Cities, Technology and Development. Sustainability 2020, 12, 8892. [Google Scholar] [CrossRef]
- Delmastro, C.; De Miglio, R.; Chiodi, A.; Gargiulo, M.; Pisano, P. 3—The smart city of Torino. In Smart City Emergence; Anthopoulos, L., Ed.; Elsevier: Amsterdam, The Netherlands, 2019; pp. 51–81. ISBN 978-0-12-816169-2. [Google Scholar]
- Faburel, G. Les Métropoles Barbares; Le Passager Clandestin: Paris, France, 2018; ISBN 978-2-36935-231-0. [Google Scholar]
- ASC Amsterdam Smart City. Available online: https://amsterdamsmartcity.com/ (accessed on 30 October 2020).
- Van Winden, W.; Oskam, I.; Schrama, W.; van Dijck, E.-J.; van den Buuse, D. Organising Smart City Projects: Lessons Learned from Amsterdam; Hogeschool van Amsterdam: Amsterdam, The Netherlands, 2016; p. 112. [Google Scholar]
- The City of Amsterdam Maps Amsterdam. Available online: https://maps.amsterdam.nl/open_geodata/ (accessed on 30 October 2020).
- Wahidayat Putra, Z.D.; van der Knaap, W. A smart city needs more than just technology: Amsterdam’s Energy Atlas project. In Smart City Emergence. Cases from around the World; Elsevier: Amsterdam, The Netherlands, 2019. [Google Scholar]
- Perboli, G.; Rosano, M. A Taxonomic Analysis of Smart City Projects in North America and Europe. Sustainability 2020, 12, 7813. [Google Scholar] [CrossRef]
- Smart City Vienna. Available online: https://www.wien.info/en/vienna-for/smart-city-vienna (accessed on 30 October 2020).
- Roblek, V. 5—The smart city of Vienna. In Smart City Emergence; Anthopoulos, L., Ed.; Elsevier: Amsterdam, The Netherlands, 2019; pp. 105–127. ISBN 978-0-12-816169-2. [Google Scholar]
- Fernandez-Anez, V.; Fernández-Güell, J.M.; Giffinger, R. Smart City Implementation and Discourses: An Integrated Conceptual Model. The Case of Vienna. Cities 2018, 78, 4–16. [Google Scholar] [CrossRef]
- Marsal-Llacuna, M.-L.; Colomer-Llinàs, J.; Meléndez-Frigola, J. Lessons in Urban Monitoring Taken from Sustainable and Livable Cities to Better Address the Smart Cities Initiative. Technol. Forecast. Soc. Chang. 2015, 90, 611–622. [Google Scholar] [CrossRef]
Figure 1.
Methodology for clustering sustainable smart cities.

Figure 2.
Smart city classification.

Table 1.
Principal component analysis by smart city dimension.
| Smart City Dimension | PCA Results (% of Variance) 1 | Core Capability Variables—Main Axes | Interpretation of Core Capabilities |
|---|---|---|---|
| smart architecture and technology | axis 1 (27.88%) | A1_energy | energy |
| axis 2 (22.97%) | A2_equip_infra | equipment and infrastructure | |
| axis 3 (14.55%) | A3_on-line_access | on-line accessibility | |
| smart citizens | axis 1 (42.42%) | C1_e-citizen | e-citizens |
| axis 2 (14.87%) | C2_info | information | |
| axis 3 (10.23%) | C3_sharing | sharing trends | |
| smart economy | axis 1 (26.38%) | Ec1_e-commerce | e-commerce |
| axis 2 (20.27%) | Ec2_business | business environment | |
| axis 3 (14.02%) | Ec3_openness | economic openness | |
| smart environment | axis 1 (20.83%) | En1_air_pollution | air pollution |
| axis 2 (17.74%) | En2_revegetation | revegetation | |
| axis 3 (13.99%) | En3_green_transition | green transition | |
| smart government | axis 1 (61.73%) | G1_e-government | e-government |
| axis 1 (61.73%) | axis 1 (41.77%) | L1_life_quality | life quality |
| axis 2 (13.77%) | L2_life_cost | life cost | |
| axis 3 (11.44%) | L3_heritage | heritage | |
| smart mobility | axis 1 (37.07%) | M1_car_use | car use and alternatives |
| axis 2 (22.09%) | M2_metro | metro infrastructure | |
| axis 3 (11.17%) | M3_modalities | transport modalities |
1 Total inertia of the data by smart city themes.
Table 2.
Main core capabilities by cluster.
| Clusters of Cities | Core Capabilities 1 | Mean City Population (Inhabitants) | Mean City Density (Inhabitants per km2) | Mean City’s GDP per Capita (USD Constant Prices) |
|---|---|---|---|---|
| Cluster 1: Cities with emerging smart strategies | transport modalities and air pollution | 2,916,917 | 1078.89 | 45,849.33 |
| Cluster 2: Technology-oriented smart cities | e-commerce, e-citizens, equipment and infrastructure, e-government, life cost and online accessibility | 4,215,136 | 793.86 | 62,048.57 |
| Cluster 3: Sustainable smart cities | information, life quality, car use and alternatives, business environment, energy, revegetation, sharing trends, metro infrastructure and economic openness | 2,123,715 | 673.65 | 60,380.88 |
1 These core capabilities are sorted from the strongest with values positive and higher than 2 (see Tables S30–S32 of the Supplementary Material).
Publisher’s Note: MDPI stays neutral with regard to jurisdictional claims in published maps and institutional affiliations. |
© 2021 by the authors. Licensee MDPI, Basel, Switzerland. This article is an open access article distributed under the terms and conditions of the Creative Commons Attribution (CC BY) license (http://creativecommons.org/licenses/by/4.0/).
Share and Cite
MDPI and ACS Style
Cantuarias-Villessuzanne, C.; Weigel, R.; Blain, J. Clustering of European Smart Cities to Understand the Cities’ Sustainability Strategies. Sustainability 2021, 13, 513. https://doi.org/10.3390/su13020513
AMA Style
Cantuarias-Villessuzanne C, Weigel R, Blain J. Clustering of European Smart Cities to Understand the Cities’ Sustainability Strategies. Sustainability. 2021; 13(2):513. https://doi.org/10.3390/su13020513
Chicago/Turabian StyleCantuarias-Villessuzanne, Carmen, Romain Weigel, and Jeffrey Blain. 2021. "Clustering of European Smart Cities to Understand the Cities’ Sustainability Strategies" Sustainability 13, no. 2: 513. https://doi.org/10.3390/su13020513
Note that from the first issue of 2016, this journal uses article numbers instead of page numbers. See further details here.