Sustainability Calculus in Adopting Smart Speakers—Personalized Services and Privacy Risks

1
Department of Information and Decision Sciences, Perdue School of Business, Salisbury University, Salisbury, MD 21804, USA
2
College of Business and Economics, Chung-Ang University, Dongjak-gu, Seoul 06974, Korea
*
Author to whom correspondence should be addressed.
Sustainability 2021, 13(2), 602; https://doi.org/10.3390/su13020602
Submission received: 7 December 2020
/
Revised: 5 January 2021
/
Accepted: 7 January 2021
/
Published: 10 January 2021
(This article belongs to the Special Issue Sustainable Information Technology Capabilities Applied in Management and Education)
Abstract
:Despite the benefits of using smart speakers, serious privacy concerns have been raised, particularly due to their constantly listening microphones. Given the mixture of the advantages and risks deciding whether to use them is not an easy matter, casting a doubt about sustainable growth and development of smart speakers. Using a sample of 559 users in South Korea and the U.S., we empirically investigated the dilemma of users seeking to adopt smart speakers. The results revealed users’ perceived usefulness and enjoyment positively influenced the intention to adopt smart speakers. No direct effect of perceived ease of use was found but this effect was completely mediated by perceived usefulness and enjoyment. Perceived enjoyment was found to be twice as strong as perceived usefulness in determining the usage intention, confirming the hedonic aspect of smart speakers. Conversely, perceived privacy risks were shown to be a significant negative factor. This negative impact was significantly stronger in the U.S. than in South Korea. We could infer that the more mature the stage of acceptance of smart speakers, the greater the sensitivity of users to privacy risks. Lastly, in the South Korean sample, we found that the perceived usefulness could reduce the negative impact of perceived risks on the intention. to adopt smart speakers.
1. Introduction
Personal assistant services using artificial intelligence are growing rapidly as they are used in various ways by both individuals and businesses. According to the Global Market Insight report, the intelligent personal assistance (IPA) market is expected to grow at an average annual rate of 34.9% and the market size will reach $11 billion by 2024. Among the various IPA-enabled devices, smart speakers such as Amazon Echo, Google Home and Apple HomePod are the most prevalent examples. In 2018, about 100 million smart speakers were in use and it was reported that 24% of U.S. households have adopted them. This adoption rate is expected to increase by 75% in 2020 [1].
Smart speakers provide the benefits and convenience of providing personalized information (e.g., weather services, traffic status, individual schedules, etc.) to users through an integrated voice assistant. Additionally, they provide services such as music playback, games, online shopping and the control of home functions like thermostats, light fixtures and surveillance cameras. Despite various advantages, they also raise serious privacy concerns due to their constantly listening microphones, which are considered to be one of the most privacy-intrusive sensors [2]. In fact, Apple recently apologized for illegally listening to the voice files of Siri users. Amazon also admitted that it has been recording users’ personal voice commands through Alexa [3].
The user’s dilemma of using personalized services that come with the risk of sacrificing privacy has been studied in various online environments, including personalized recommendation services in online shopping and social network services [4,5,6]. In the context of smart speakers, the sustainable usage of their services may be greatly dependent on users’ personal information. Therefore, the benefits of using smart speakers are often directly proportional to the privacy risks. This makes the decision-making process of adopting a smart speaker difficult.
If privacy risks are a major barrier to user acceptance of smart speakers, what would be the best way to address this issue? First, service providers will have to ensure the confidentiality, availability and integrity of user information. At the same time, users must be fully informed about what kind of personal information is collected and how it will be used. As part of this effort, the state of California recently passed the California Consumer Privacy Act, one of the strictest privacy protection laws in the U.S. [7]. Similarly, in South Korea, the Personal Information Protection Act requires most online services to mandatorily include the consent process on the collection and processing of personal information [8]. While it is true that such legal provisions can help protect smart speaker users’ privacy, many consider these safeguards to be merely superficial and their personal information could still be exploited beyond their control. Thus, users will ultimately decide to adopt smart speakers only when their perception of the usefulness and benefits of using such speakers outweighs privacy concerns [9,10,11,12].
Using a sample of 559 users collected in South Korea and in the U.S., this study empirically investigates the dilemma of users seeking to adopt smart speakers. To simultaneously consider both the advantages and privacy risks of adopting smart speakers, we developed a united adoption model by integrating the two most widely accepted models: technology acceptance model (TAM) [13,14] and privacy calculous model (PCM) [9,12]. We tested several hypotheses using this unified model and obtained some significant results and insights. In terms of the benefits of adoption, we found that users’ perceived usefulness and enjoyment positively influence the intention to adopt smart speakers, supporting the hypotheses anchored on TAM. In particular, we found that the perceived enjoyment predicted the usage intention more strongly than the perceived usefulness. This result implies that smart speakers are considered more pleasure-oriented (or hedonic) than productivity-based (or utilitarian) information technology [15]. Meanwhile, drawing on PCM, we found that perceived privacy risks negatively influenced the intention to adopt smart speakers. We also examined the moderating effect of privacy risks on the relationship assumed by TAM. Interestingly, we found the moderating effect between perceived usefulness and perceived privacy risks only in the South Korean sample. From this result, we argue that in the early stages of the adoption of smart speakers (in South Korea compared to the U.S.), perceived usefulness can offset the negative impacts of perceived privacy risks. We also discuss some important managerial implications based on these key findings.
2. Theoretical Background and Research Hypotheses
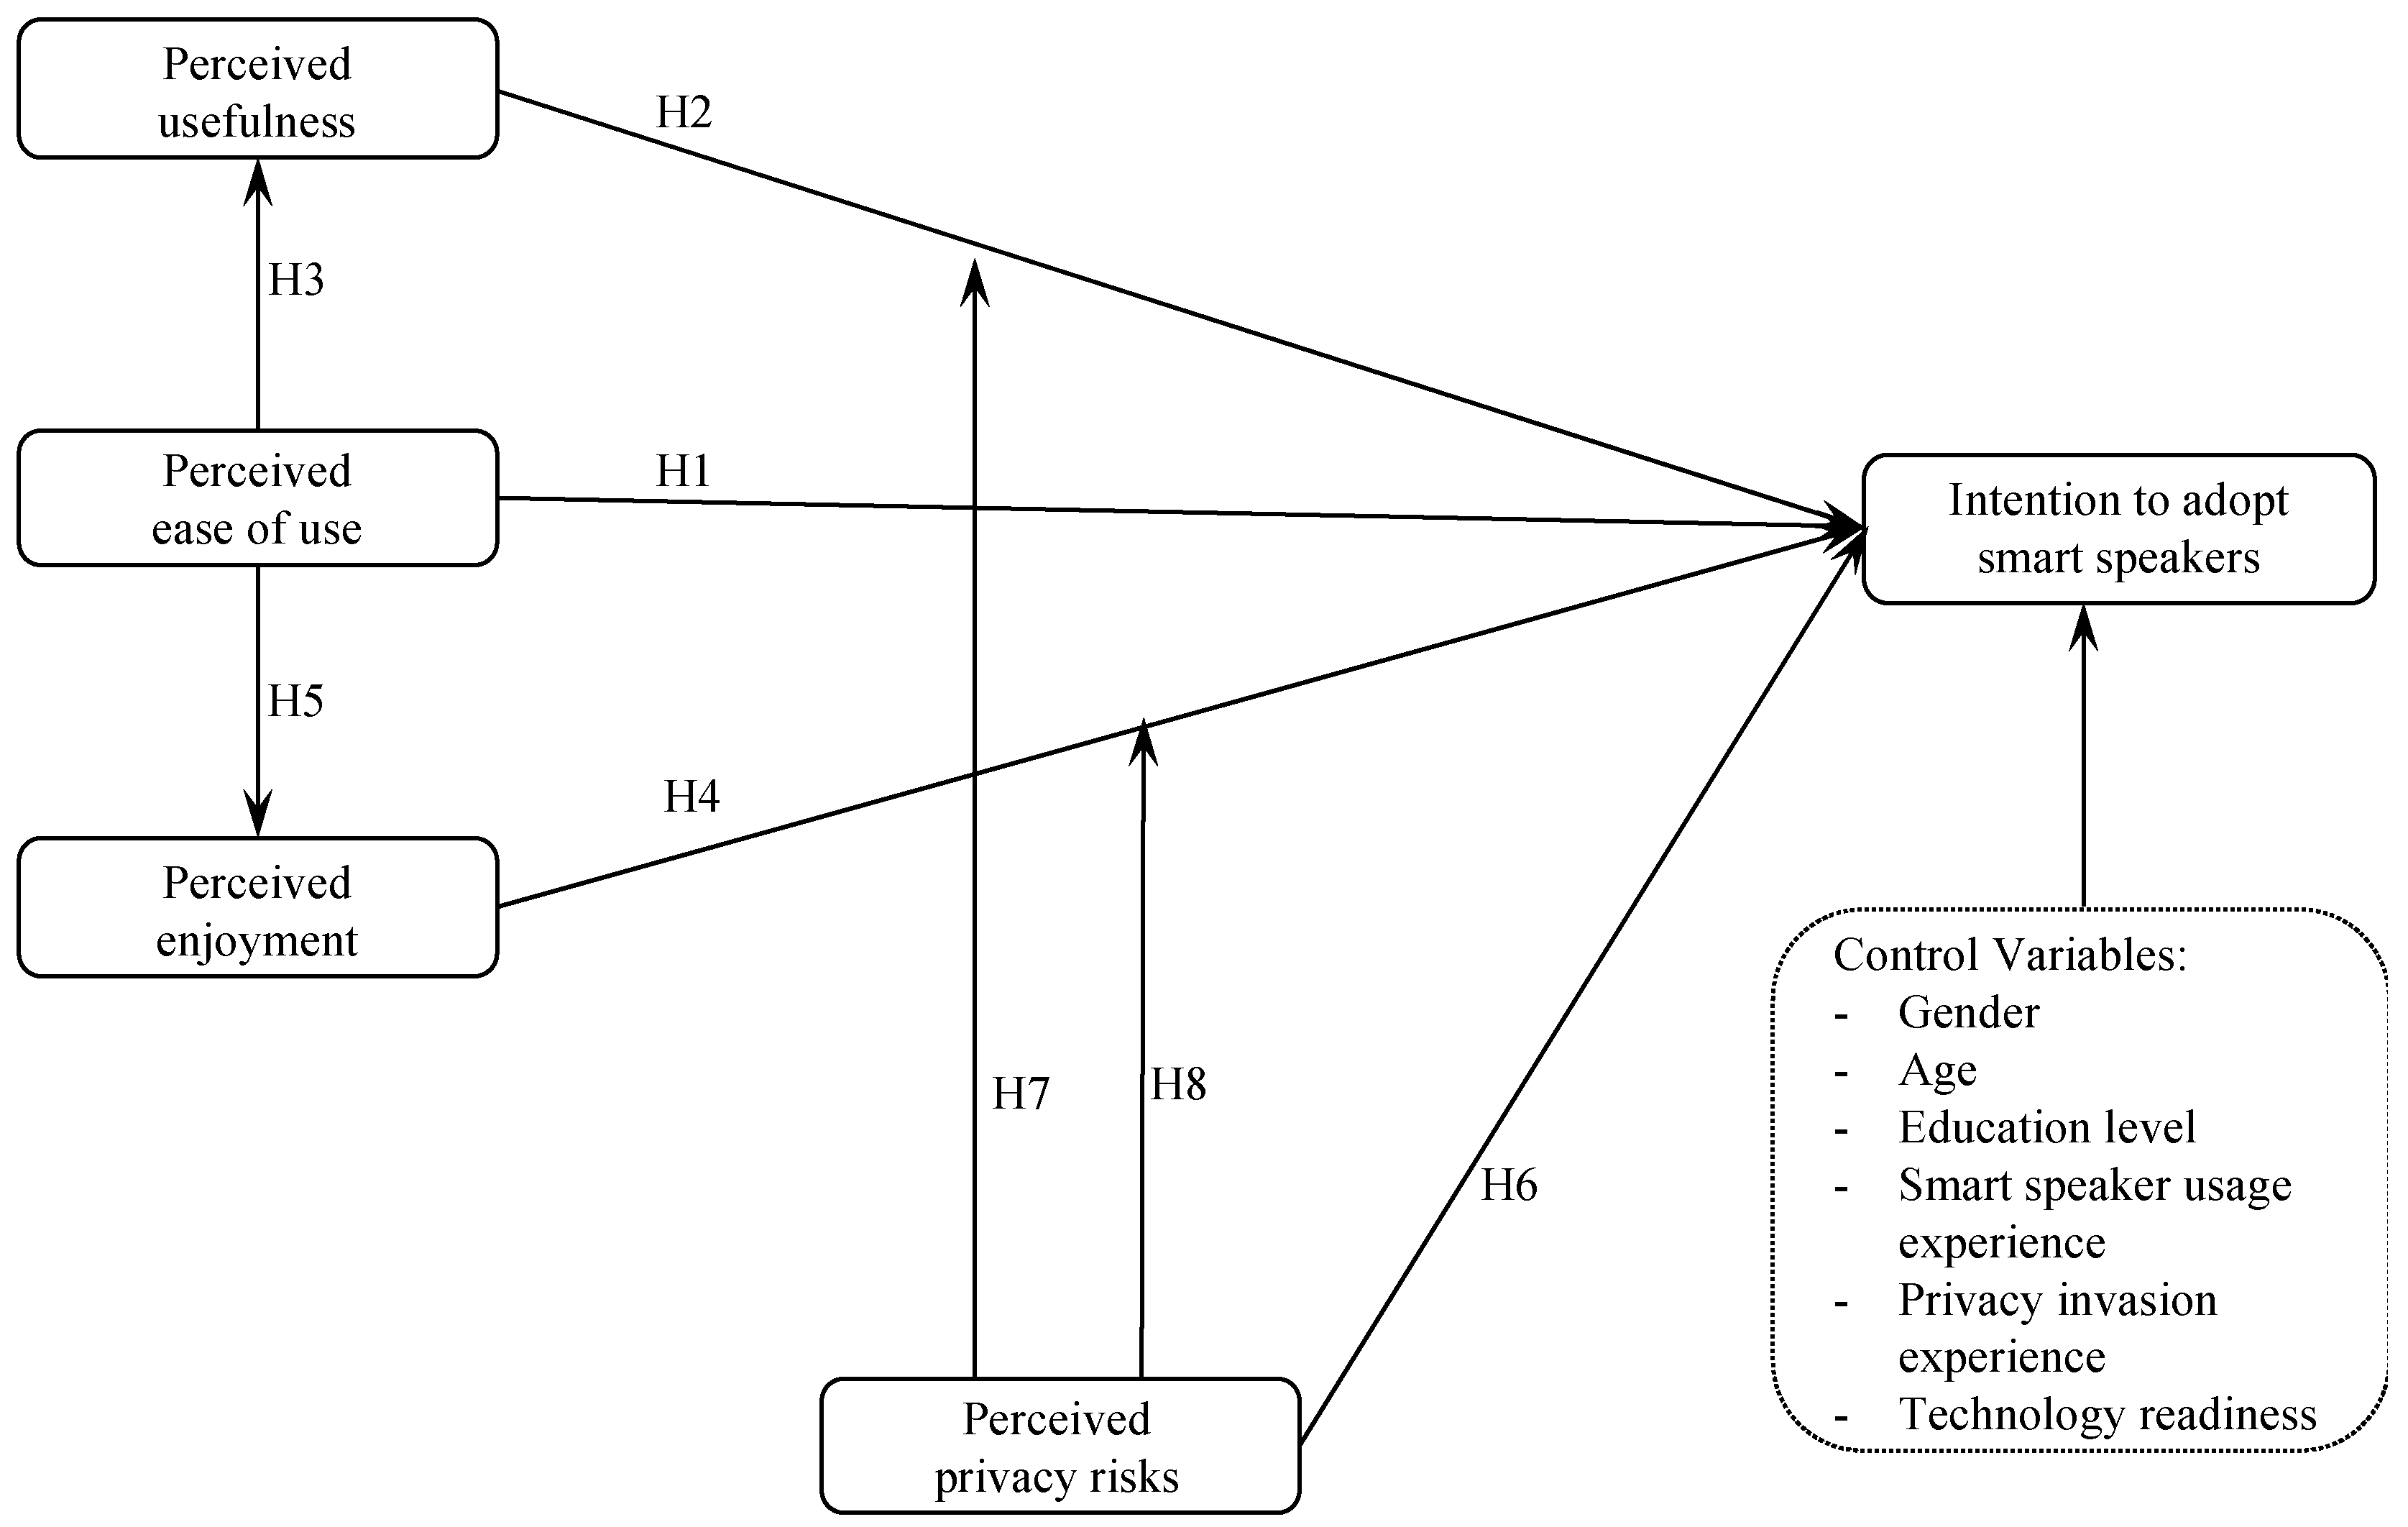
This section describes the research hypotheses based on the relevant theoretical background. The unified research model of the study is shown in Figure 1.
2.1. Technology Acceptance Theories
Researchers have been attempting to uncover the factors that influence the intention to adopt a new information technology (IT) from a behavioral science perspective. The main paradigm in this area is rooted in Davis’ TAM [16]. TAM extends the theory of reasoned action (TRA) [17] and its later revision, the theory of planned behavior (TPB) [18] as its theoretical motifs. These theories assume that the actual behavior should be determined by the user′s behavioral intention and that such intention is influenced by the user′s attitude, subjective norm and perceived behavioral control.
Specifically, TAM theorizes that the user’s acceptance of IT can be explained by perceived usefulness and perceived ease of use. Perceived usefulness is defined as the degree to which users believe that their job performance will be improved by using a particular system. On the other hand, perceived ease of use is defined as the degree to which users believe that not much effort is required for using a particular system. Perceived usefulness positively affects a user’s intention to use a particular IT. However, the user would not use that IT if it is difficult to use and takes a lot of effort and time even though it is perceived as useful. Therefore, perceived usefulness and perceived ease of use directly affect the attitude toward the IT and the intention to use it [16].
Since its original publication, TAM has been validated, revised and extended across a diverse range of research settings, generally confirming that perceived usefulness and ease of use are strong predictors of user acceptance of different information systems. They include messaging system [19,20], personal computing [21], PC-based software [22,23,24,25], E-mail [26], Windows OS [27], World Wide Web [28,29], online shopping [30,31,32,33,34,35], personal blog [36], health system [37], mobile service [38], internet banking [39,40] and so on. However, the application of TAM for studying the adoption of smart speakers is still limited. Therefore, considering a smart speaker as a new IT device, we suggest the following hypotheses:
Hypothesis 1(H1).
Perceived ease of use will have a positive effect on the intention to adopt a smart speaker.
Hypothesis 2(H2).
Perceived usefulness will have a positive effect on the intention to adopt a smart speaker.
Moreover, TAM explains the relationship between perceived ease of use and perceived usefulness. It posits that perceived ease of use positively affects perceived usefulness but the opposite relationship does not exist. This result has been empirically tested in numerous previous studies [26,28,32,41]. In the same vein, we assume that users will perceive a smart speaker as more useful when they believe it is easier to use and operate; hence, we suggest the following hypothesis:
Hypothesis 3(H3).
Perceived ease of use will have a positive effect on perceived usefulness.
In other words, we hypothesize that the influence of perceived ease of use on the intention to use is mediated by perceived usefulness.
2.2. Hedonic IT and Perceived Enjoyment
In addition to two major beliefs addressed in the original TAM, that is, perceived ease of use and perceived usefulness, Davis et al. [14] added perceived enjoyment as the third belief that can determine users’ acceptance of information systems. Perceived enjoyment is defined as “the extent to which the activity of using the computer is perceived to be enjoyable in its own right” [14]. When perceived enjoyment was first suggested, the effect of this new belief seemed to be weaker than that of the original two beliefs [42,43]. However, the later studies demonstrated that some information systems seem to be accepted more because of their perceived enjoyment than perceived usefulness [15,44,45]. These information systems were characterized by their hedonic aspect that aimed at the inner pleasure of using the systems, such as fun and happiness. This new aspect is distinguished from the previous pragmatic aspect of using the systems that generally focuses on the external goals such as job performance and work efficiency. Examples of such hedonic information systems are those used in leisure environments such as a web browser, instant messaging systems and online games. Van der Heijden [15] stated “the home environment is the natural habitat of hedonic systems” and perceived enjoyment would play a more dominant role in this environment. This may also apply to smart speakers as they are mostly set up and used in home environments. Prior research also conceptualize the hedonic benefits of using voice assistants [46]; hence, we propose the following hypothesis:
Hypothesis 4(H4).
Perceived enjoyment will have a positive effect on the intention to adopt a smart speaker, which would be greater than the effect of perceived usefulness (H2).
Along with perceived usefulness, several previous studies have found that perceived ease of use is related to perceived enjoyment [15,44,45,47]. For example, Lee et al. [47] found that perceived ease of use has a significant effect on students’ intention to use internet-based leaning through perceived usefulness and perceived enjoyment. Similarly, we assume that users will perceive smart speakers as more enjoyable when they feel they are easier to use and operate and suggest the following hypothesis:
Hypothesis 5(H5).
Perceived ease of use will have a positive effect on perceived enjoyment.
2.3. Privacy Calculus
While TAM provides a theoretical framework for investigating the impact of the perceived benefits on the intention to adopt smart speakers, it does not tell us how privacy risks affect that intention. The theory of privacy calculus, which is another basis of this study, systematically explains users’ acceptance of personalized IT services when they have to evaluate both the potential risks and the benefits of using these services in terms of future outcomes [9,12].
The notion that the expected risks and benefits determine people’s behavior is originally found in economic literature, so the process of evaluating trade-offs is often described based on mathematical calculations. Culnan and Armstrong [9] adopted this calculus perspective to explain online consumers’ behavior and introduced the term “privacy calculus” (p. 106). They posited that online consumers would disclose their personal information when the perceived benefits exceed the potential risks of online shopping. Since people cannot be certain of what these risks and benefits may be, they rely on past experiences, intuitions or perceptions to assess them and make a behavioral decision [48]. The PCM has been used to describe self-disclosure behavior in a variety of online contexts such as e-commerce [5,9,49], social network services [11,48,50], mobile apps [51] and the Internet of Things [52].
In the context of the current study, PCM explains that users are more likely to adopt smart speakers when they value the perceived benefits of using such speakers, which is assessed by perceived usefulness and perceived enjoyment, more than the risks of exposing their personal information. In the similar context, Park et al. [53] investigated how the perceived benefits and privacy risks affect the perceived value and intentions to adopt a smart speaker. In addition, Liao et al. [54] examined the role of privacy and trust in decision to adopt intelligent assistants. As an extension of those previous studies, integrating both PCM and TAM, we examine the direct negative impact of perceived risk on the intention to adopt, as well as the interaction between privacy risks and each of perceived usefulness and perceived enjoyment. Therefore, we propose the following three hypotheses:
Hypothesis 6(H6).
Perceived privacy risks will have a negative effect on the intention to adopt a smart speaker.
Hypothesis 7(H7).
The negative effect of perceived risks on the intention to adopt a smart speaker will be reduced (moderated) by perceived usefulness.
Hypothesis 8(H8).
The negative effect of perceived risks on the intention to adopt a smart speaker will be reduced (moderated) by perceived enjoyment.
3. Research Method
3.1. Measures
We employed a survey instrument to empirically test the hypotheses in the research model. The items were measured on a five-point Likert scale. To ensure content validity, the scales were mostly adapted from the previous studies discussed in the hypotheses development; if necessary, we slightly modified them to fit the current research context. The items used to measure perceived usefulness and ease of use were adapted from References [16,19,55], those used to measure perceived enjoyment were adapted from References [15,44] and a few new items were developed to measure perceived privacy risks, drawing upon [11,50,52]. Lastly, the items for measuring the intention to adopt smart speakers were adapted from Reference [56]. As a control variable, technology readiness was measured based on [34,38]. Specific questionnaire items with these sources are presented in Table 1.
3.2. Data Collection and Respondent Profile
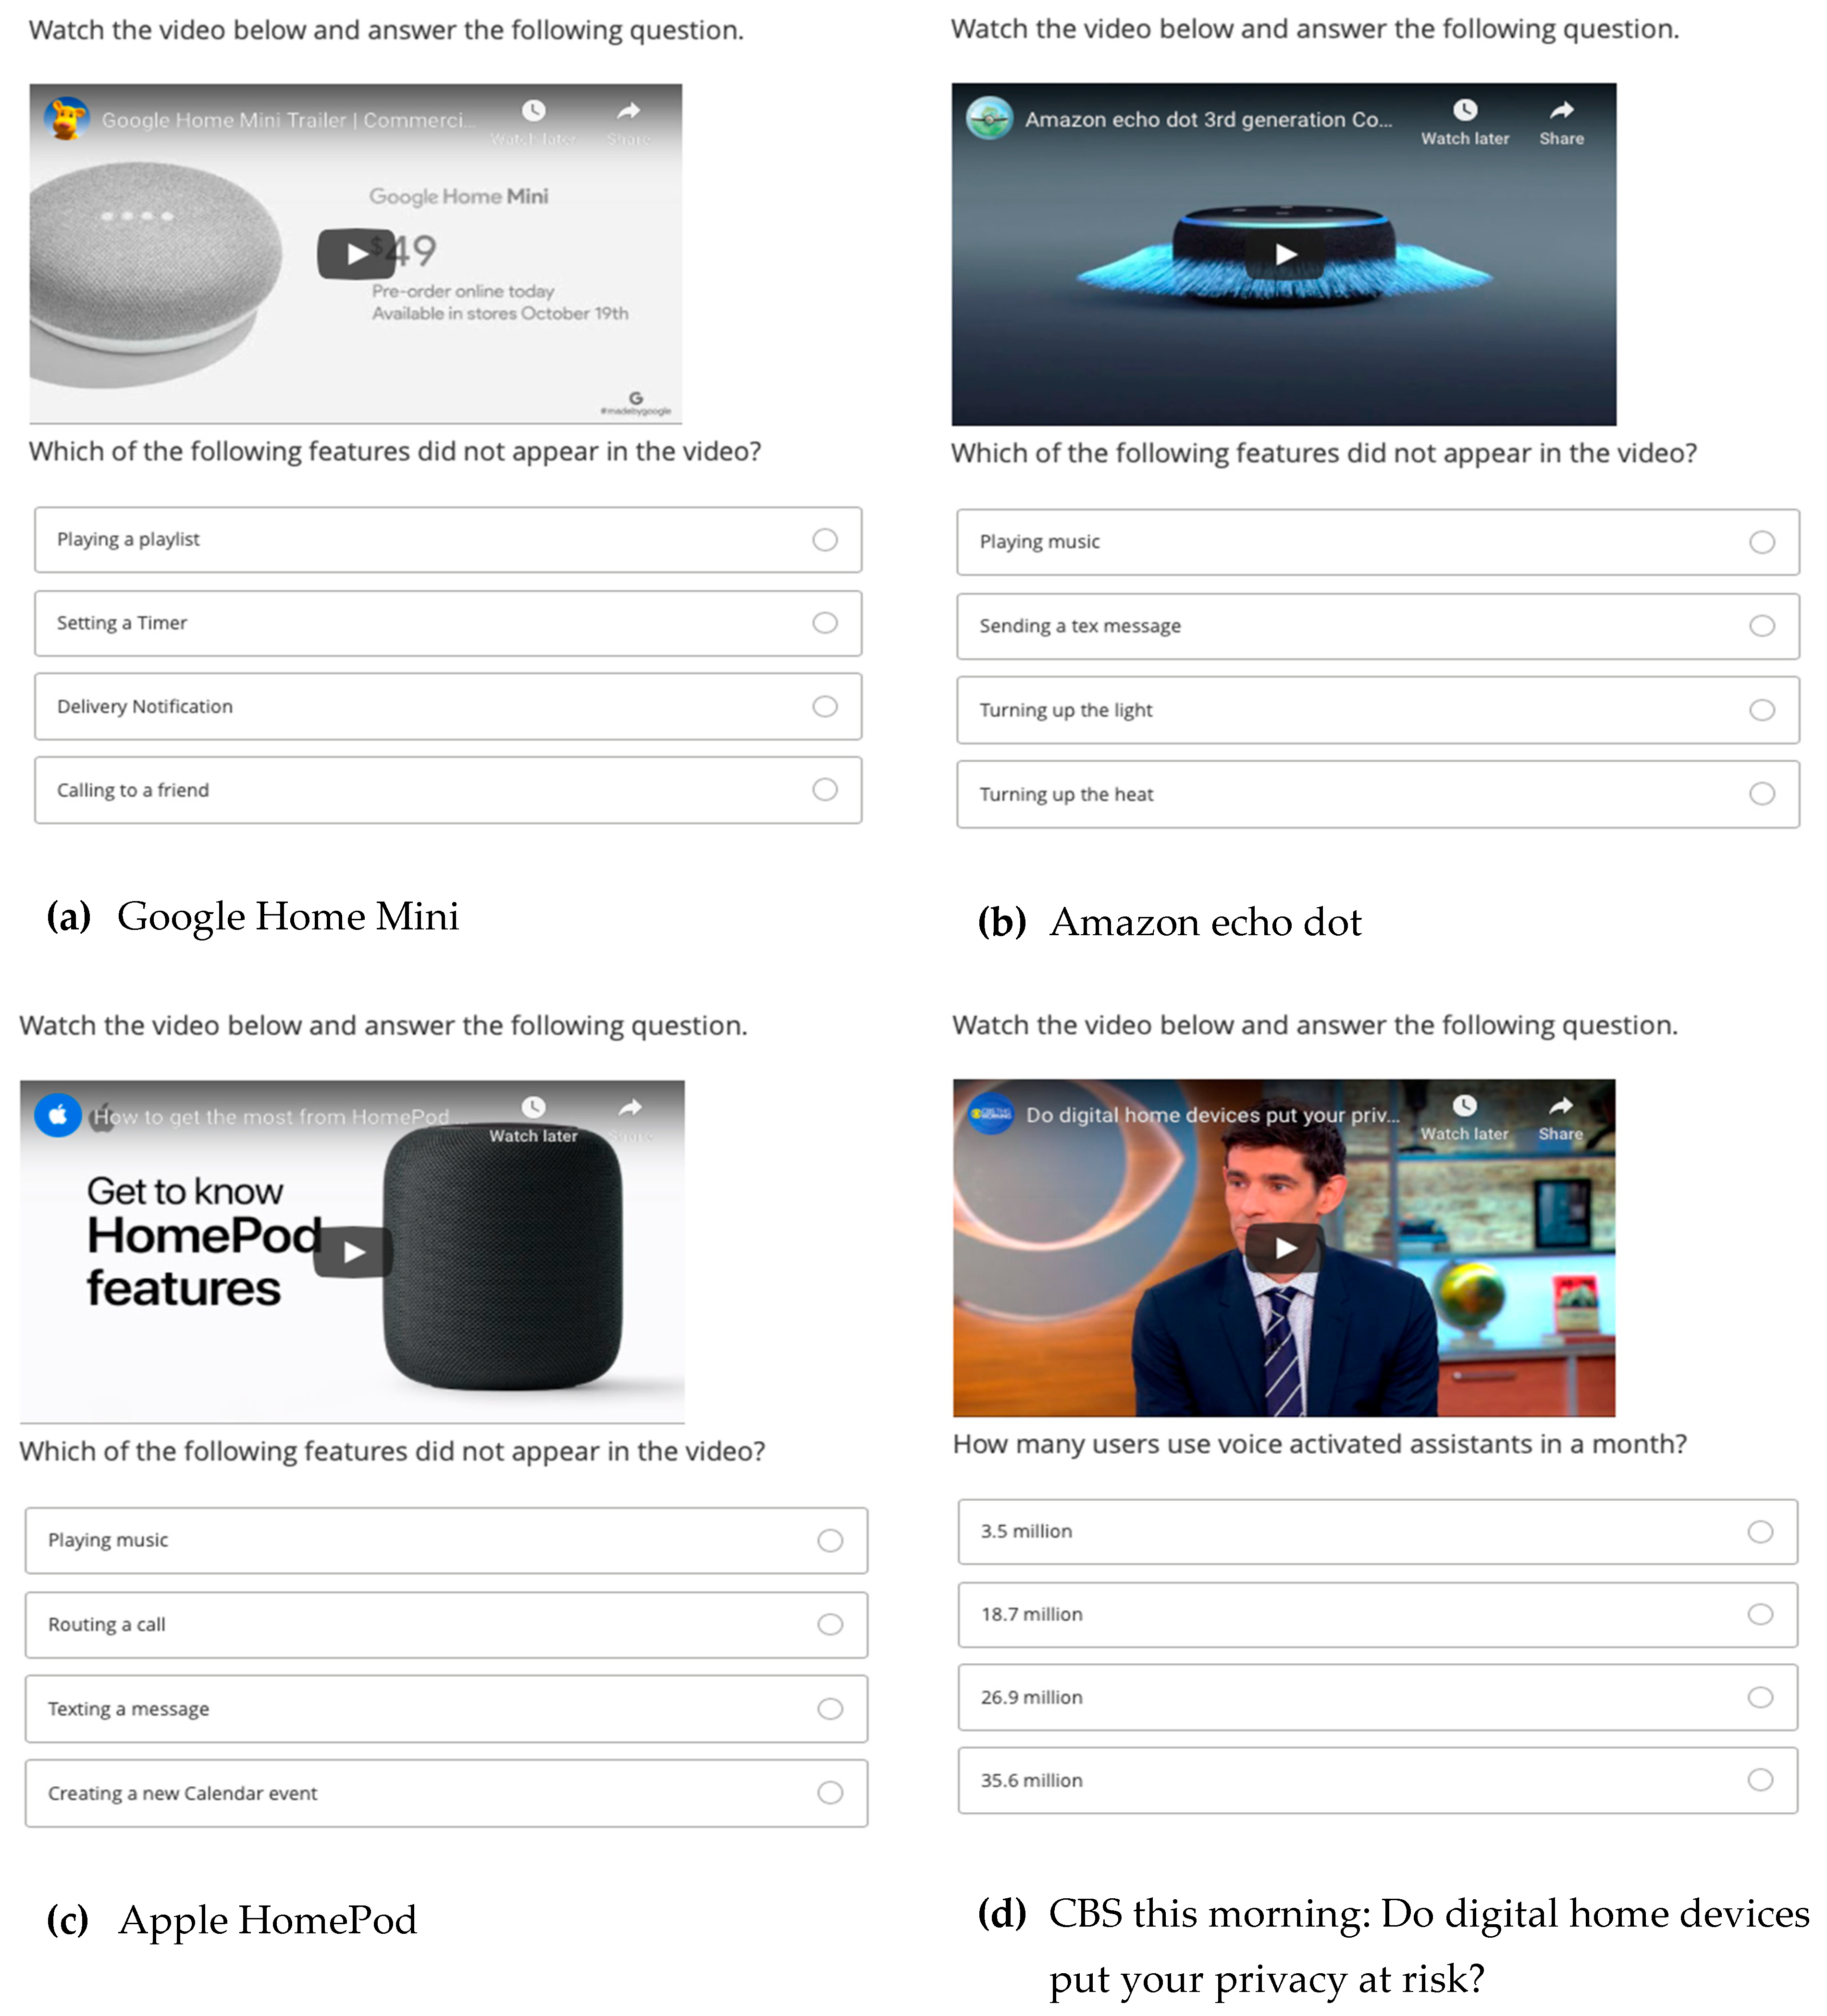
To test the model, we used an online survey method, combined with a virtual experiment of using smart speakers. The survey participants experienced a smart speaker’s various personalized services through a web-based experiment before responding to the main survey. By using a controlled web-based experiment as stimuli, we could avoid inconsistent responses merely based on participants’ previous experiences and memories, which are difficult to control and generalize for each individual subject. Screenshots of this web-based experiment are provided in the Figure A1.
We recruited two groups of participants: one in South Korea and the other in the U.S. In South Korea, data were collected through a market research firm’s nationwide panel. A pilot test of 30 responses was conducted to confirm the reliability and validity of the questionnaire. The market research firm provided a total of 300 samples after they had cleaned the data and removed the responses with missing data. The sample panel was controlled based on the usage experience and age groups. Before answering the main questionnaire, participants were asked to watch several short video clips and simulate the usage of the two most popular smart speakers in South Korea: Google Home Mini and KT GiGA Genie.
In the U.S., participants were recruited through Amazon’s Mechanical Turk. After the pilot test, we set up a project with a total of 300 participants and offered a $2 financial incentive for participating in the survey. The Turks were controlled by their IP address and only U.S. residents were allowed to participate in the survey. After removing the responses with inadequate and/or missing data, the U.S. sample consisted of 259 responses. The same questionnaire used for the South Korean sample was re-used after English translation but the experiment was modified using different video clips that simulate Google Home Mini, Amazon’s Echo Dot and Apple’s HomePod. The profile of the respondents is summarized in Table 2.
4. Results
To test the research model, we have used the partial least squares method for structural equation modeling (PLS-SEM) package in R software [57]. PLS-SEM is a two-step analysis that combined factor analysis of a measurement model and path analysis of a structural model [58,59]. Using PLS-SEM offers some advantages such as more flexible assumptions with partial allowance of multicollinearity and less measurement errors by using multiple measurement variables for each construct. Further, PLS-SEM requires lower sample size that needs to be greater than 10 times the largest number of measurement variables. For example, we have a maximum of six measurement variables for measurement and therefore the sample size of 559 is much larger than the required sample size of 60 [60].
4.1. Measurement Model Assessment
We assessed the reliability and the convergent validity of the measurement model and summarized the results in Table 3. The recommended reliability threshold is 0.7 and all Cronbach’s alpha and Dillon Goldstein’s Rho values were greater than the threshold [61]. Further, we examined the average variance extracted (AVE) to test the convergent validity. The results showed that all AVE values are great than the threshold value of 0.5 [62].
Moreover, we tested the discriminant validity by examining whether the square root of AVE for each construct is greater than its cross-correlation with other constructs. The results in Table 4 showed that the diagonal elements in the matrix were greater than the off-diagonal elements in the same rows and columns, which confirms the discriminant validity. In addition, we examined the cross loading of the items for each construct and provided the results in the Table A1.
4.2. Structural Model Assessment
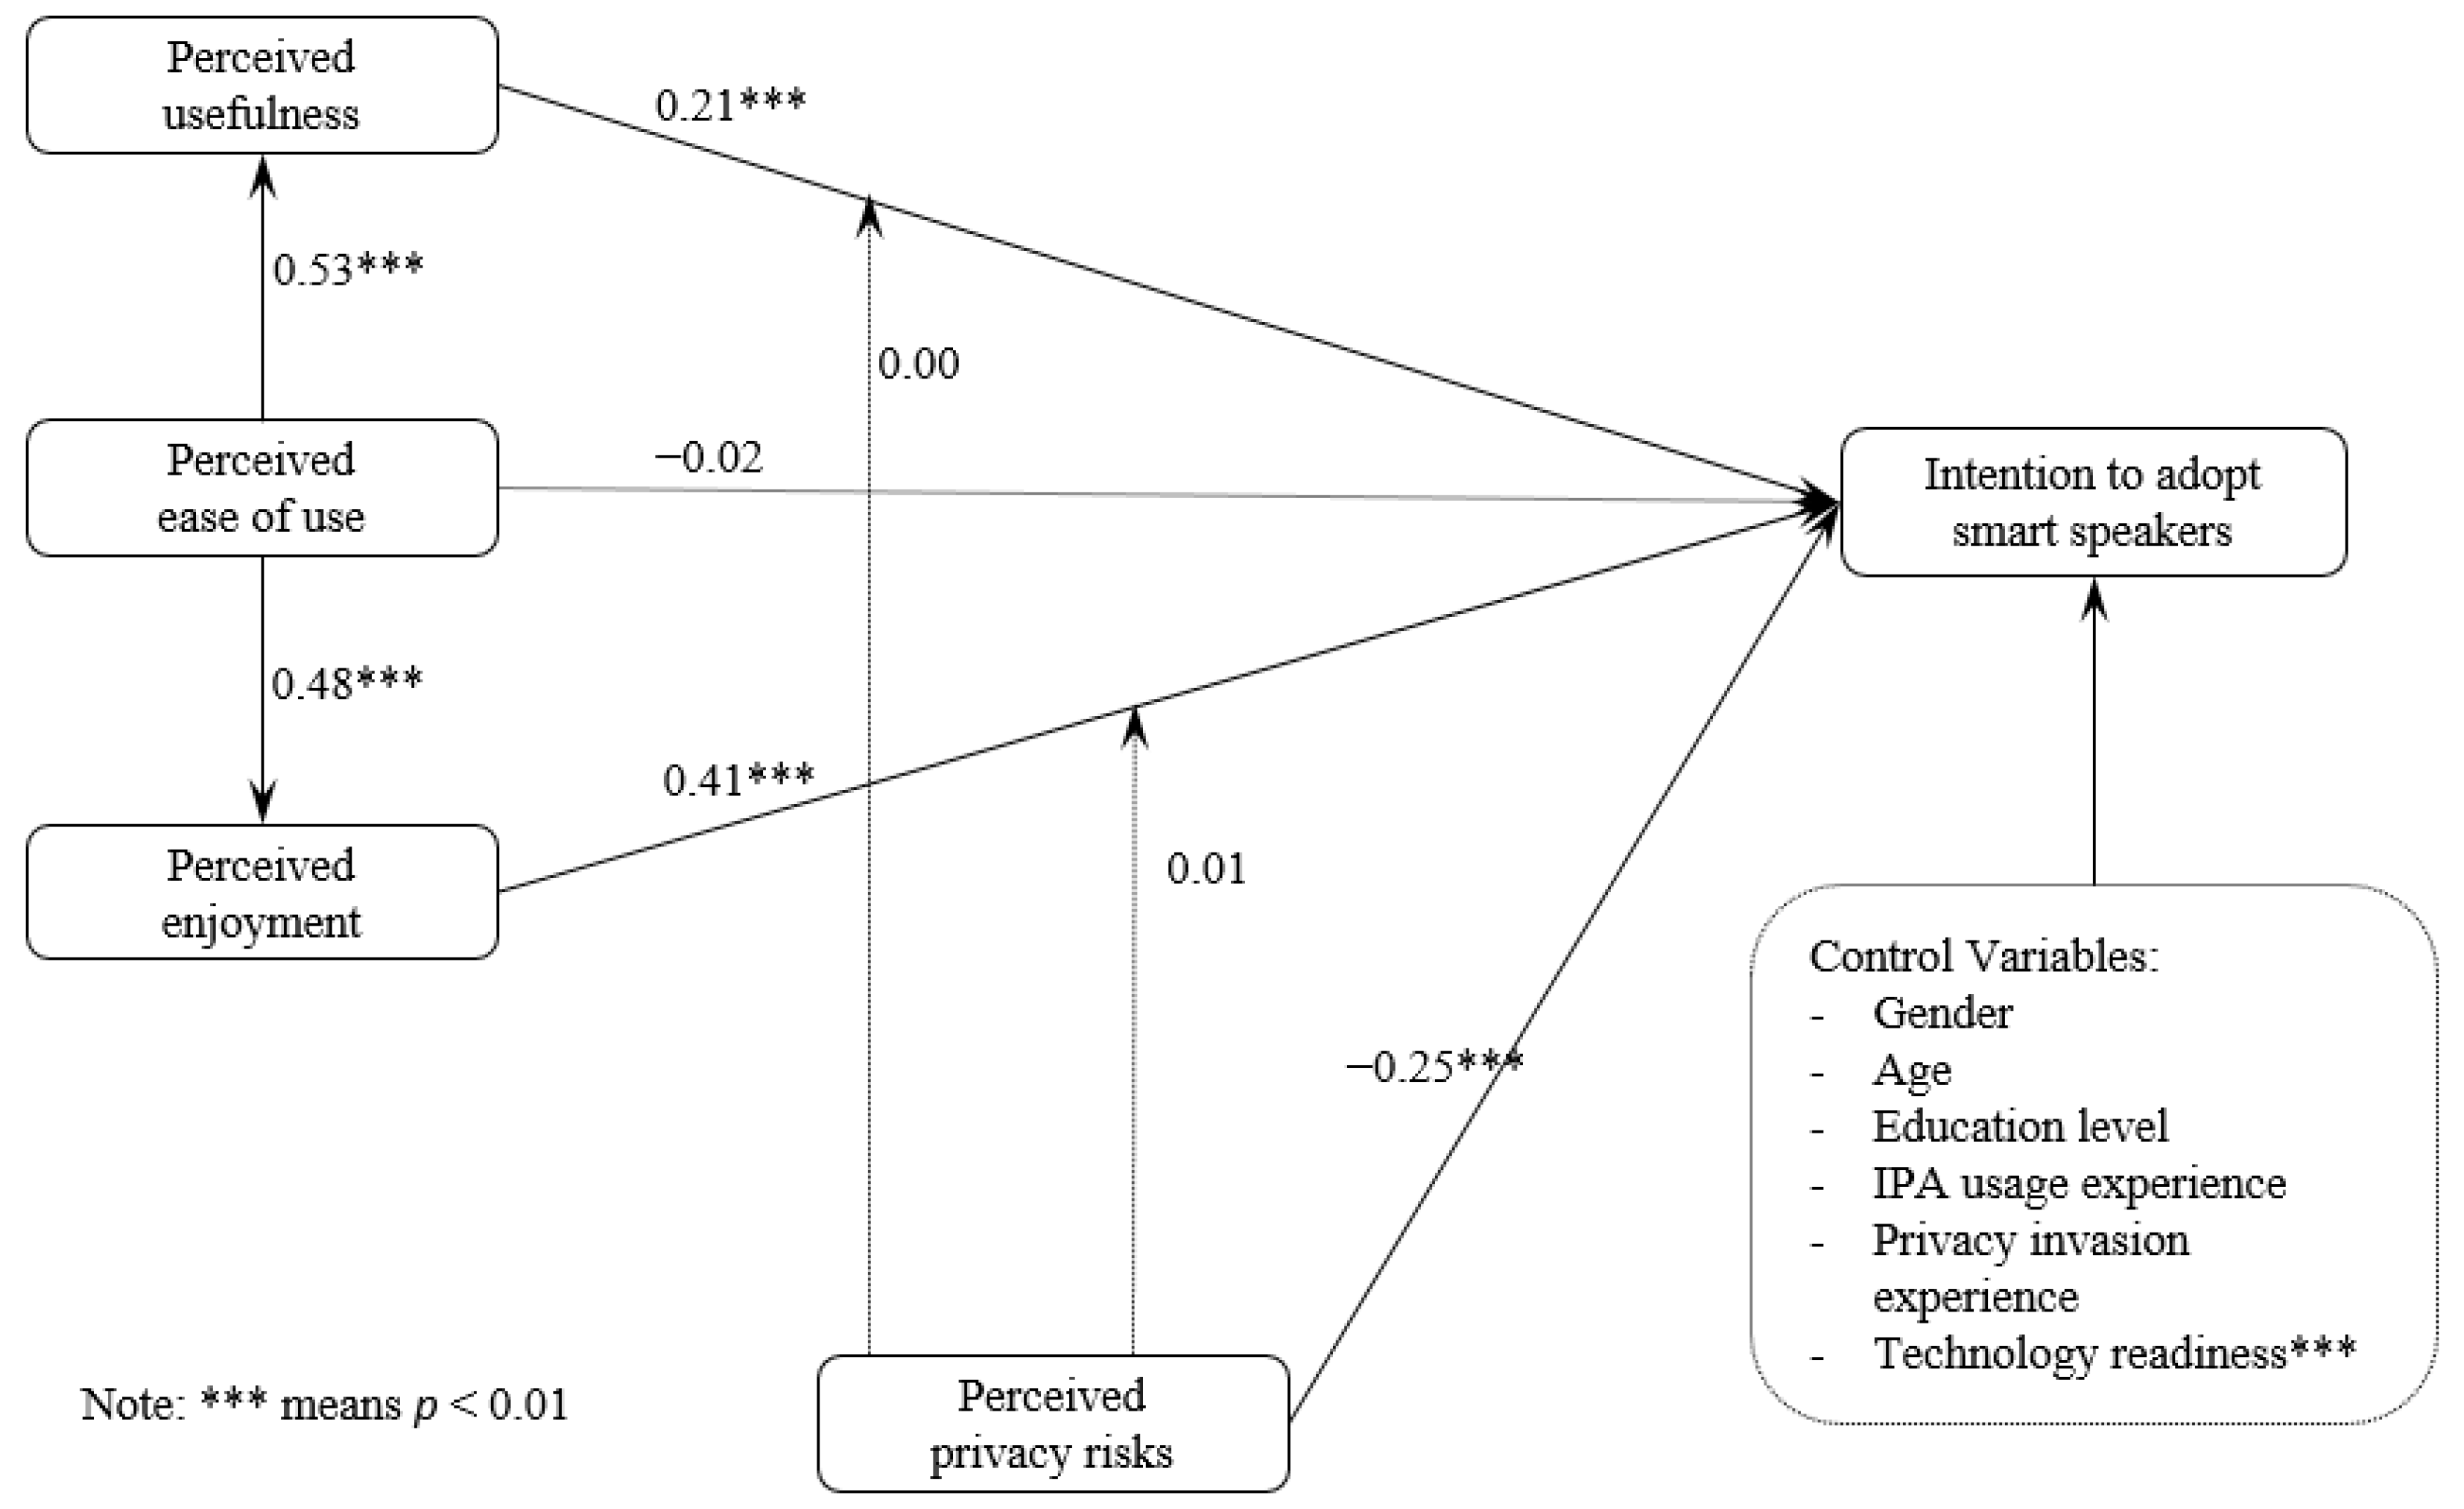
The assessment of the structural model includes estimation of the path coefficients and R2 values. The R2 value of intention to adopt smart speakers is 56.5%, which shows very high explanatory power. The path coefficients are shown in Figure 2 and the complete results are summarized in Table 5.
The first hypothesis on the direct positive impact of perceived ease of use on the intention to adopt smart speakers was rejected (H1: β = −0.02, t = −0.43, p = 0.67). However, the second hypothesis on the influence of perceived usefulness was accepted at the 1% significance level (H2: β = 0.21, t = 4.99, p < 0.01). Further, perceived ease of use showed a significant positive relationship with the intention to use smart speakers (H3: β = 0.53, t = 14.70, p < 0.01). This means that although the direct effect of perceived ease of use was found to be insignificant (H1), it still indirectly influences the intention to use through perceived usefulness.
In terms of the hedonic value of smart speakers, we found that perceived enjoyment significantly increased the intention to use smart speakers, supporting the hypothesis 4 (H4: β = 0.41, t = 10.00, p < 0.01). In H4, we also assumed that the effect of perceived enjoyment on intention is greater than that of perceived usefulness. The comparison of the two path coefficients (β = 0.21 < β = 0.41) indicated that this difference was nearly doubled.
In addition, similar to perceived usefulness, we also found the positive effect of perceived ease of use on perceived enjoyment (H5: β = 0.48, t = 13.00, p < 0.01). This means that perceived enjoyment (along with perceived usefulness, as shown in H3) also mediates the indirect impact of perceived ease of use on the intention to adopt smart speakers. These mediation effects are discussed further in the following section.
The hypothesis that perceived privacy risk will decrease the intention to use smart speakers was also supported at the 1% significance level (H6: β = −0.25, t = −8.26, p < 0.01). In contrast, the moderating effect of perceived privacy risk on perceived usefulness and enjoyment was rejected (H7: β = 0.04, t = 0.09, p = 0.93; H8: β = 0.04, t = 0.23, p = 0.82). There are several approaches to examining the moderating effect in PLS-SEM such as the two-stage path modeling, the two-stage regression, the categorical variable and group comparison approaches [56]. Among them, we used the two-stage path modeling approach to test the moderating effect of perceived privacy risks and the group comparison approach for comparing the differences between the South Korean and US samples. The moderating effect showed significant differences between the Korean and U.S. samples.
In addition, the research model includes some control variables such as differences in previous experience of using smart speakers, previous experience of privacy invasion, technology readiness, gender, age, education and income level. Among them, there was a difference in intention to use smart speakers according to technology readiness. At the 1% level of significance, people who are more amenable to using new IT products were more likely to use smart speakers than those who are not (β = 0.17, t = 4.91, p < 0.01).
4.3. Group Comparison
We conducted an additional group comparison assessment to examine the differences in the two countries. The results are summarized in Table 6.
We found five significant differences between the South Korean and U.S. samples. First, while perceived ease of use shows substantial impacts on perceived usefulness in both groups, the impact scales were significantly different between them (βKorea = 0.61 > βUS = 0.47). Further, the impacts of perceived enjoyment on the intention to adopt was also found to be stronger in the South Korean sample than in the U.S. sample (βKorea = 0.47 > βUS = 0.34). However, the negative impacts of perceived risks on the intention to adopt was revealed to be stronger in the U.S. sample than in the South Korean sample (|βKorea| = 0.15 < |βUS| = 0.30). Moreover, we found the moderating effect of perceived privacy risks on perceived usefulness only in the South Korean sample (βKorea = 0.14). Lastly, among control variables, we found that the previous experiences of using smart speakers positively impact the intention to (continuously) use smart speakers only in the U.S. sample.
5. Discussions
We investigated various factors that influence users’ decisions to adopt smart speakers. The findings supported many of our proposed hypotheses. The first set of hypotheses (H1–H5) showed the positive impacts of perceived usefulness and enjoyment on the intention to use smart speakers. The results are consistent with many previous TAM studies [16,19,55], showing the significant influence of those two beliefs on the intention to adopt such speakers. However, we could also draw the following interesting results.
First, we found that perceived enjoyment determines the usage intention almost twice as strongly as perceived usefulness (0.21USF < 0.41ENJ). This result is consistent with the Van der Heijden [15]’s study on the hedonic information systems using a movie website (0.15USF < 0.25ENJ). This implies that overall, users view the smart speaker as a more hedonic IT device than a utilitarian device. More interestingly, this difference is significantly stronger in the Korean sample (0.15USF < 0.47ENJ) than in the U.S. sample (0.20USF < 0.34ENJ). We speculate that this result is due to the relatively slow distribution of smart speakers in South Korea compared to the U.S. For example, the Amazon Echo (1st generation) was initially released in the U.S. in March 2014 but an almost equivalent product, KT GiGA Genie (1st generation) was only released in South Korea in January 2017. In other words, at the early stage of acceptance of smart speakers, users focus more on enjoyment than usefulness. However, as the use of smart speakers becomes more familiar, users are more interested in the advanced functions and the usefulness of these devices. For the same reason, only the U.S. sample showed that users’ previous experience positively influenced their intention to use smart speakers.
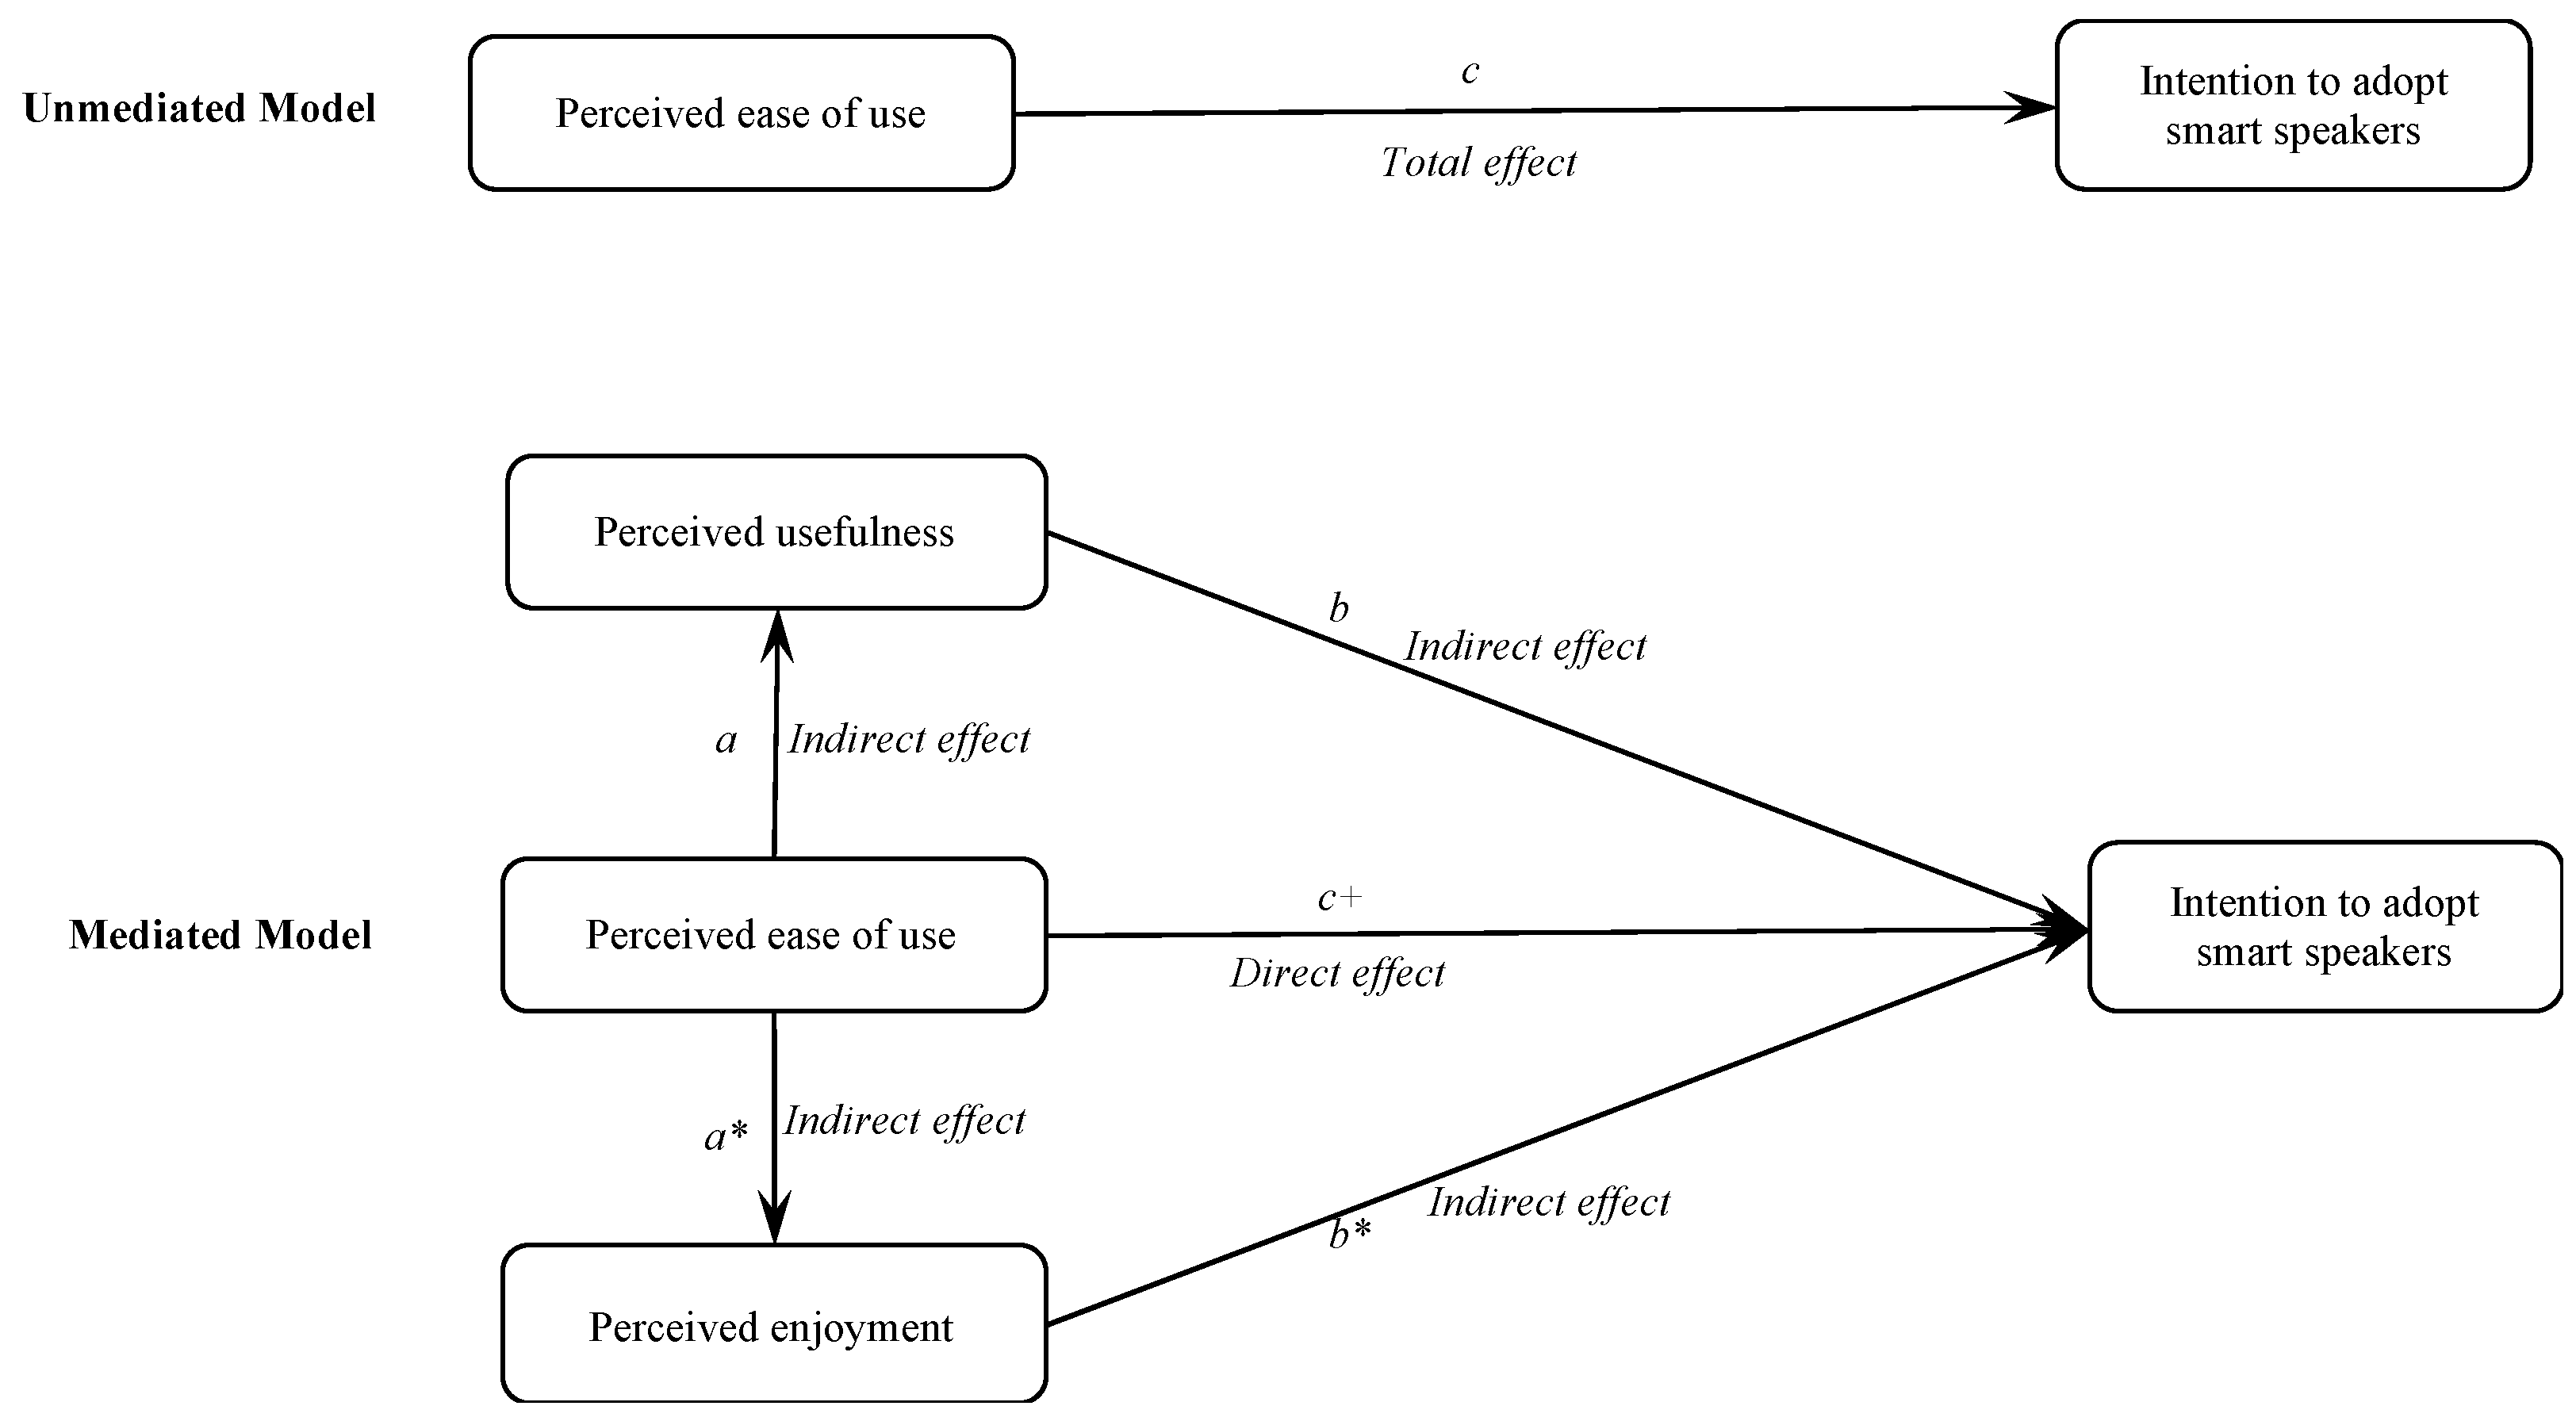
Second, we found that the effect of perceived ease of use on the usage intention was completely mediated by perceived usefulness and enjoyment. This result is different from most of previous TAM studies where only partial mediations were found [16,19,55]. Figure 3 describes the unmediated and mediated models following Baron and Kenny’s notation [63,64,65]. In the unmediated model, path c is called the total effect. In contrast, in the mediated model, path c+ is called the direct effect, while paths a (a*) and b (b*) are called the indirect effects. If perceived ease of use no longer directly affects the usage intention (i.e., path c+ = 0) after perceived usefulness and enjoyment have been controlled, a complete mediation exists. When path c+ is reduced in absolute size but is greater than zero, a partial mediation exists.
To test the mediation effect, we first examined the unmediated model and found the significant total effect (c) with the path coefficient of 0.24 (t-test = 6.49, p-value = 0.00). We then tested the significance of the indirect effects (product of paths a (a*) and b (b*)) using the Sobel test [66]. The test statistic for both perceived usefulness (z = 4.88, p < 0.01) and perceived enjoyment (z = 7.79, p < 0.01) showed the complete mediation. The outcomes of the analysis are presented in Table 7.
The next set of hypotheses (H6–H8) revealed the impact of perceived privacy risks on the intention to use smart speakers. Consistent with previous PCM studies [11,50,52], we found a negative influence of perceived privacy risks on the intention but the size of this influence was not as high as that of perceived enjoyment (|βRSK| = 0.25 < |βENJ| = 0.41). To explain this, we examined those results in each country separately. In Table 6, we found that this negative impact scale was significantly stronger in the U.S. sample than in the South Korean sample (|βKorea| = 0.15 < |βU.S.| = 0.30), which results in the overall low size of the impact. From this, we can infer that in the early stage of adoption as in South Korea, the impact of perceived privacy risks is much less than that in the more mature stage of adoption as in the U.S.
Regarding the moderating effect of perceived privacy risks, the result was controversial between two sample groups. While the moderating effect was not found in the total data set, we found the moderating effect of perceived privacy risk on perceived usefulness is significant in the South Korean sample (βKorea = 0.14). Therefore, we can examine the impact of perceived risks on the intention using the following partial differential equation:
This result indicates that the increased perceived usefulness can offset the negative impacts of perceived risks on the intention to adopt in the South Korean sample. However, this diminishing effect of perceived risks by perceived usefulness cannot be found in the U.S. sample, in which the negative impact of perceived risks on the intention was almost two times higher than that in the South Korean sample (|βKorea| = 0.15 < |βU.S.| = 0.30).
6. Implications and Limitations
As concluding remarks, we summarize three important practical and managerial implications based on the key findings of this study. First, our findings suggest that managers understand that the sustainability of smart speakers must be accompanied by the utilitarian perspective as well as the hedonic perspective in the design of smart speakers. In particular, as a way to keep sustainable growth of smart speaker users, managers will be able to establish a dynamic strategy according to the maturity of the product market in different countries. In the early stage of adoption, users will be more responsive to the hedonic perspective of smart speakers, so product design and marketing strategies may need to focus more on this aspect to be successful. In contrast, in a relatively mature market with a significant number of early adopters, managers may need to consider strategies that focus more on the practical perspective of smart speakers.
We suggest that managers should focus on increasing the usefulness and enjoyment of using smart speakers. The follow-up question will naturally be how to increase these factors. For this, it is possible to directly design and develop some new “fun” and useful features of smart speakers. However, this study demonstrates that managers can achieve this goal indirectly by increasing users’ perceived ease of use. For example, the most common complaint of smart speaker users is that the speaker is not good at processing natural language and it is therefore often very difficult to order some commands. Due to these difficulties in use, users may give up trying using the advanced features, often consider merely it a simple music player and finally decide not to use it. This study emphasizes that perceived ease of use plays an important role in enhancing both the practical value and the hedonic value of smart speakers, thus affecting the intention to adopt.
Finally, managers should not overlook the negative impact of privacy risks for the sustainable usage of smart speakers. Strategies to alleviate concerns about such risks can also be dynamic depending on the maturity of the product market. For example, in the early stage of adoption as in South Korea, managers may be able to offset the negative impact of privacy risks by strongly highlighting the usefulness of smart speakers. However, in the more matured market like in the U.S., this dampening strategy may not be effective and managers will have to determine more specific ways to reduce privacy risks. For example, managers and developers may have to pay more attention to the modern cryptography techniques that would allow the encryption of voices transmitted between users and smart speakers and vast amounts of personal data stored in the cloud storage [67,68]. On other hand, since smart speakers must respond immediately to user commands and inquiries, it is also important to keep the speaker’s efficiency by minimizing the time required to decrypt the encrypted data. For this, managers may be able to utilize a decentralized privacy-preserving protocol in distributed system [69,70] and/or try a recently developed protocol such as a mixture of Symmetric Searchable Encryption (SSE) and Attribute-Based Encryption (ABE) [71] for better efficiency. Regarding the risks of human review of voice recordings, management should consider the establishment of more practical privacy laws.
The current study has the following three limitations that can serve as a guideline for the direction of future research. First, the study was conducted at the early adoption and rapid-growth stages of smart speakers. In the future, we need to conduct a longitudinal comparative study to determine how the currently significant factors can change over time. Second, a follow-up study should consider more factors than investigated herein. For example, we can include the social benefits of using smart speakers that help users feel friendship and social intimacy. Third, future research should generalize current results by re-examining the research model, utilizing samples from more diverse countries.
Author Contributions
Conceptualization, H.S.C., J.H.W., C.P. and T.K.; data collection, H.S.C. and J.H.W.; formal analysis and investigation, H.S.C.; discussion and implications, T.K, J.H.W., C.P.; writing—original draft preparation, H.S.C.; writing—review and editing, H.S.C. and T.K.; funding acquisition, J.H.W. All authors have read and agreed to the published version of the manuscript.
Funding
This work was supported by the Ministry of Education of the Republic of Korea and the National Research Foundation of Korea (NRF-2017S1A6A3A01078538).
Informed Consent Statement
Informed consent was obtained from all subjects involved in the study.
Data Availability Statement
Data available on request due to restrictions eg privacy or ethical.
Conflicts of Interest
The authors declare no conflict of interest.
Appendix A
Figure A1.
Web-based experiment of using smart speakers.


Table A1.
Cross loading table.
| 1 | 2 | 3 | 4 | 5 | 6 | 7 | 8 | 9 | 10 | 11 | 12 | ||
|---|---|---|---|---|---|---|---|---|---|---|---|---|---|
| 212251. EOU | Item1 | 0.79 | 0.41 | 0.36 | 0.02 | −0.03 | −0.04 | 0.12 | 0.02 | 0.15 | −0.05 | 0.11 | 0.23 |
| Item2 | 0.80 | 0.47 | 0.39 | −0.06 | −0.01 | −0.06 | 0.15 | 0.02 | 0.07 | −0.08 | 0.10 | 0.26 | |
| Item3 | 0.83 | 0.42 | 0.39 | −0.03 | 0.00 | −0.01 | 0.19 | 0.04 | 0.08 | −0.05 | 0.07 | 0.28 | |
| Item4 | 0.84 | 0.44 | 0.42 | −0.04 | 0.09 | −0.06 | 0.19 | 0.02 | 0.06 | −0.10 | 0.11 | 0.31 | |
| Item5 | 0.70 | 0.35 | 0.36 | 0.01 | 0.04 | −0.07 | 0.19 | 0.00 | 0.04 | −0.06 | 0.05 | 0.24 | |
| Item6 | 0.86 | 0.45 | 0.42 | −0.04 | 0.03 | −0.10 | 0.18 | 0.04 | 0.11 | −0.08 | 0.08 | 0.27 | |
| 2. USF | Item1 | 0.50 | 0.88 | 0.62 | −0.14 | 0.14 | −0.04 | 0.33 | 0.06 | 0.03 | −0.01 | 0.09 | 0.50 |
| Item2 | 0.49 | 0.88 | 0.62 | −0.15 | 0.15 | 0.03 | 0.34 | 0.05 | 0.04 | 0.00 | 0.13 | 0.56 | |
| Item3 | 0.47 | 0.91 | 0.57 | −0.13 | 0.16 | 0.00 | 0.33 | 0.07 | 0.02 | 0.03 | 0.09 | 0.50 | |
| Item4 | 0.35 | 0.77 | 0.51 | −0.14 | 0.12 | 0.02 | 0.32 | −0.03 | 0.05 | 0.03 | 0.09 | 0.48 | |
| 3. ENJ | Item1 | 0.46 | 0.59 | 0.92 | −0.14 | 0.14 | −0.06 | 0.32 | 0.05 | 0.11 | −0.03 | 0.13 | 0.59 |
| Item2 | 0.37 | 0.60 | 0.89 | −0.07 | 0.16 | 0.00 | 0.39 | 0.02 | 0.01 | 0.00 | 0.11 | 0.57 | |
| Item3 | 0.46 | 0.62 | 0.89 | −0.14 | 0.17 | −0.04 | 0.36 | 0.05 | 0.06 | −0.05 | 0.10 | 0.59 | |
| 4. RSK | Item1 | −0.05 | −0.16 | −0.15 | 0.88 | −0.12 | −0.02 | −0.11 | 0.03 | 0.08 | 0.05 | 0.06 | −0.36 |
| Item2 | 0.01 | −0.10 | −0.10 | 0.90 | −0.13 | 0.04 | −0.08 | 0.06 | 0.05 | 0.03 | 0.02 | −0.28 | |
| Item3 | −0.04 | −0.16 | −0.11 | 0.91 | −0.15 | −0.02 | −0.10 | 0.08 | 0.07 | 0.04 | 0.00 | −0.32 | |
| Item4 | 0.01 | −0.17 | −0.09 | 0.91 | −0.14 | −0.03 | −0.11 | 0.06 | 0.07 | -0.03 | −0.02 | −0.30 | |
| Item5 | −0.06 | −0.14 | −0.12 | 0.90 | −0.20 | −0.02 | −0.15 | 0.06 | 0.04 | -0.01 | −0.04 | −0.35 | |
| 5. IPA_EXP | Item1 | 0.03 | 0.17 | 0.17 | −0.17 | 1.00 | 0.16 | 0.31 | −0.08 | −0.18 | 0.06 | 0.14 | 0.26 |
| 6. PVC_EXP | Item1 | −0.07 | 0.00 | −0.04 | −0.01 | 0.16 | 1.00 | 0.14 | 0.01 | −0.16 | 0.15 | 0.11 | 0.06 |
| 7. TECH | Item1 | 0.18 | 0.35 | 0.36 | −0.13 | 0.25 | 0.12 | 0.88 | −0.09 | −0.22 | -0.06 | 0.06 | 0.41 |
| Item2 | 0.13 | 0.33 | 0.30 | −0.10 | 0.32 | 0.17 | 0.86 | −0.16 | −0.11 | 0.07 | 0.21 | 0.38 | |
| Item3 | 0.24 | 0.31 | 0.37 | −0.09 | 0.25 | 0.08 | 0.87 | −0.14 | −0.09 | 0.00 | 0.10 | 0.40 | |
| 8. GEN | Item1 | 0.03 | 0.05 | 0.05 | 0.07 | −0.08 | 0.01 | −0.15 | 1.00 | 0.06 | 0.00 | −0.10 | −0.04 |
| 9. AGE | Item1 | 0.10 | 0.04 | 0.07 | 0.07 | −0.18 | −0.16 | −0.16 | 0.06 | 1.00 | 0.26 | 0.24 | −0.02 |
| 10. EDU | Item1 | −0.08 | 0.01 | −0.03 | 0.02 | 0.06 | 0.15 | 0.00 | 0.00 | 0.26 | 1.00 | 0.35 | 0.00 |
| 11. WAGE | Item1 | 0.11 | 0.12 | 0.13 | 0.00 | 0.14 | 0.11 | 0.14 | −0.10 | 0.24 | 0.35 | 1.00 | 0.12 |
| 12. INT | Item1 | 0.33 | 0.56 | 0.61 | −0.32 | 0.23 | 0.05 | 0.44 | −0.01 | −0.04 | 0.00 | 0.12 | 0.92 |
| Item2 | 0.31 | 0.56 | 0.60 | −0.28 | 0.13 | 0.04 | 0.37 | 0.02 | −0.01 | 0.00 | 0.08 | 0.88 | |
| Item3 | 0.30 | 0.54 | 0.58 | −0.36 | 0.33 | 0.05 | 0.43 | −0.08 | −0.03 | −0.01 | 0.13 | 0.94 | |
| Item4 | 0.28 | 0.49 | 0.57 | −0.36 | 0.24 | 0.07 | 0.43 | −0.05 | 0.01 | 0.02 | 0.12 | 0.91 |
References
- Olson, C.; Kemery, K. 2019 Voice Report: Consumer Adoption of Voice Technology and Digital Assistants; Microsoft: Seattle, DC, USA, 2019. [Google Scholar]
- Chung, H.; Lee, S. Intelligent Virtual Assistant knows Your Life. arXiv 2018, arXiv:1803.00466. [Google Scholar]
- Day, M.; Turner, G.; Drozdiak, N. Amazon Workers Are Listening to What You Tell Alexa; Bloomberg: New York, NY, USA, 2019. [Google Scholar]
- Lahlou, S.; Langheinrich, M.; Röcker, C. Privacy and trust issues with invisible computers. Commun. ACM 2005, 48, 59–60. [Google Scholar] [CrossRef] [Green Version]
- Dinev, T.; Hart, P. An Extended Privacy Calculus Model for E-Commerce Transactions. Inf. Syst. Res. 2006, 17, 61–80. [Google Scholar] [CrossRef]
- Wu, Z.; Li, G.; Liu, Q.; Xu, G.; Chen, E. Covering the Sensitive Subjects to Protect Personal Privacy in Personalized Recommendation. IEEE Trans. Serv. Comput. 2018, 11, 493–506. [Google Scholar] [CrossRef]
- Stallings, W. Handling of Personal Information and Deidentified, Aggregated, and Pseudonymized Information Under the California Consumer Privacy Act. IEEE Secur. Priv. 2020, 18, 61–64. [Google Scholar] [CrossRef]
- Ko, H.; Leitner, J.; Kim, E.; Jeong, J. Structure and enforcement of data privacy law in South Korea. Int. Data Priv. Law 2017, 7, 100–114. [Google Scholar] [CrossRef] [Green Version]
- Culnan, M.J.; Armstrong, P.K. Information Privacy Concerns, Procedural Fairness, and Impersonal Trust: An Empirical Investigation. Organ. Sci. 1999, 10, 104–115. [Google Scholar] [CrossRef]
- Bugeja, J.; Jacobsson, A.; Davidsson, P. On Privacy and Security Challenges in Smart Connected Homes. In Proceedings of the European Intelligence and Security Informatics Conference (EISIC), Uppsala, Sweden, 17–19 August 2016; pp. 172–175. [Google Scholar]
- Trepte, S.; Scharkow, M.; Dienlin, T. The privacy calculus contextualized: The influence of affordances. Comput. Hum. Behav. 2020, 104, 106115. [Google Scholar] [CrossRef]
- Culnan, M.J.; Bies, R.J. Consumer Privacy: Balancing Economic and Justice Considerations. J. Soc. Issues 2003, 59, 323–342. [Google Scholar] [CrossRef]
- Davis, F.D. A Technology Acceptance Model for Empirically Testing New End-User Information System: Theory and Results. Ph.D. Thesis, Massachusetts Institute of Technology, Cambridge, MA, USA, 1986. [Google Scholar]
- Davis, F.D.; Bagozzi, R.P.; Warshaw, P.R. Extrinsic and intrinsic motivation to use computers in the workplace. J. Appl. Soc. Psychol. 1992, 22, 1111–1132. [Google Scholar] [CrossRef]
- van der Heijden, H. User acceptance of hedonic information systems. MIS Q. 2004, 28, 695–704. [Google Scholar] [CrossRef]
- Davis, F.D. Perceived usefulness, perceived ease of use, and user acceptance of information technology. MIS Q. 1989, 13, 319–340. [Google Scholar] [CrossRef] [Green Version]
- Fishbein, M.; Ajzen, I. Belief, Attitude, Intention and Behavior: An Introduction to Theory and Research; Addison-Wesley: Reading, MA, USA, 1975. [Google Scholar]
- Ajzen, I. From Intentions to Actions: A Theory of Planned Behavior. In Action-Control: From Cognition to Behavior; Kuhl, J., Beckman, J., Eds.; Springer: Berlin/Heidelberg, Germany, 1985; pp. 11–39. [Google Scholar]
- Adams, D.A.; Nelson, R.R.; Todd, P.A. Perceived usefulness, ease of use, and usage of information technology: A replication. MIS Q. 1992, 16, 227–247. [Google Scholar] [CrossRef]
- Lu, Y.; Zhou, T.; Wang, B. Exploring Chinese users’ acceptance of instant messaging using the theory of planned behavior, the technology acceptance model, and the flow theory. Comput. Hum. Behav. 2009, 25, 29–39. [Google Scholar] [CrossRef]
- Igbaria, M.; Zinatelli, N.; Cragg, P.; Cavaye, A.L. Personal computing acceptance factors in small firms: A structural equation model. MIS Q. 1997, 21, 279–305. [Google Scholar] [CrossRef]
- Venkatesh, V.; Davis, F.D. A model of the antecedents of perceived ease of use: Development and test. Decis. Sci. 1996, 27, 451–481. [Google Scholar] [CrossRef]
- Davis, F.D.; Bagozzi, R.P.; Warshaw, P.R. User acceptance of computer technology: A comparison of two theoretical models. Manag. Sci. 1989, 35, 982–1003. [Google Scholar] [CrossRef] [Green Version]
- Wixom, B.H.; Todd, P.A. A Theoretical Integration of User Satisfaction and Technology Acceptance. Inf. Syst. Res. 2005, 16, 85–102. [Google Scholar] [CrossRef]
- Venkatesh, V.; Bala, H. Technology acceptance model 3 and a research agenda on interventions. Decis. Sci. 2008, 39, 273–315. [Google Scholar] [CrossRef] [Green Version]
- Karahanna, E.; Straub, D.W. The psychological origins of perceived usefulness and ease-of-use. Inf. Manag. 1999, 35, 237–250. [Google Scholar] [CrossRef]
- Karahanna, E.; Straub, D.W.; Chervany, N.L. Information technology adoption across time: A cross-sectional comparison of pre-adoption and post-adoption beliefs. MIS Q. 1999, 23, 183–213. [Google Scholar] [CrossRef]
- Lederer, A.L.; Maupin, D.J.; Sena, M.P.; Zhuang, Y. The technology acceptance model and the World Wide Web. Decis. Support. Syst. 2000, 29, 269–282. [Google Scholar] [CrossRef]
- Chang, M.K.; Cheung, W. Determinants of the intention to use Internet/WWW at work: A confirmatory study. Inf. Manag. 2001, 39, 1–14. [Google Scholar] [CrossRef]
- Koufaris, M. Applying the technology acceptance model and flow theory to online consumer behavior. Inf. Syst. Res. 2002, 13, 205–223. [Google Scholar] [CrossRef] [Green Version]
- George, J.F. The theory of planned behavior and Internet purchasing. Internet Res. 2004, 14, 198–212. [Google Scholar] [CrossRef] [Green Version]
- Hsu, M.-H.; Yen, C.-H.; Chiu, C.-M.; Chang, C.-M. A longitudinal investigation of continued online shopping behavior: An extension of the theory of planned behavior. Int. J. Hum. Comput. Stud. 2006, 64, 889–904. [Google Scholar] [CrossRef]
- Pavlou, P.A.; Fygenson, M. Understanding and Predicting Electronic Commerce Adoption: An Extension of the Theory of Planned Behavior. MIS Q. 2006, 30, 115–143. [Google Scholar] [CrossRef]
- Crespo, A.H.; Bosque, I.R. The effect of innovativeness on the adoption of B2C e-commerce: A model based on the Theory of Planned Behaviour. Comput. Hum. Behav. 2008, 24, 2830–2847. [Google Scholar] [CrossRef]
- Gefen, D.; Karahanna, E.; Straub, D.W. Trust and TAM in online shopping: An integrated model. MIS Q. 2003, 27, 51–90. [Google Scholar] [CrossRef]
- Hsu, C.-L.; Lin, J.C.-C. Acceptance of blog usage: The roles of technology acceptance, social influence and knowledge sharing motivation. Inf. Manag. 2008, 45, 65–74. [Google Scholar] [CrossRef]
- Angst, C.M.; Agarwal, R. Adoption of electronic health records in the presence of privacy concerns: The elaboration likelihood model and individual persuasion. MIS Q. 2009, 33, 339–370. [Google Scholar] [CrossRef] [Green Version]
- Kuo, Y.F.; Yen, S.N. Towards an understanding of the behavioral intention to use 3G mobile value-added services. Comput. Hum. Behav. 2009, 25, 103–110. [Google Scholar] [CrossRef]
- Martins, C.; Oliveira, T.; Popovič, A. Understanding the Internet banking adoption: A unified theory of acceptance and use of technology and perceived risk application. Int. J. Inf. Manag. 2014, 34, 1–13. [Google Scholar] [CrossRef]
- Baptista, G.; Oliveira, T. Understanding mobile banking: The unified theory of acceptance and use of technology combined with cultural moderators. Comput. Hum. Behav. 2015, 50, 418–430. [Google Scholar] [CrossRef]
- Venkatesh, V.; Davis, F.D. A Theoretical Extension of the Technology Acceptance Model: Four Longitudinal Field Studies. Manag. Sci. 2000, 46, 186–204. [Google Scholar] [CrossRef] [Green Version]
- Igbaria, M.; Parasuraman, S.; Baroudi, J.J. A Motivational Model of Microcomputer Usage. J. Manag. Inf. Syst. 1996, 13, 127–143. [Google Scholar] [CrossRef]
- Igbaria, M.; Schiffman, S.J.; Wieckowski, T.J. The respective roles of perceived usefulness and perceived fun in the acceptance of microcomputer technology. Behav. Inf. Technol. 1994, 13, 349–361. [Google Scholar] [CrossRef]
- Venkatesh, V. Creation of Favorable User Perceptions: Exploring the Role of Intrinsic Motivation. MIS Q. 1999, 23, 239–260. [Google Scholar] [CrossRef]
- Moon, J.; Kim, Y. Extending the TAM for a World-Wide-Web context. Inf. Manag. 2001, 38, 217–230. [Google Scholar] [CrossRef]
- McLean, G.; Frimpong, K.O. Hey Alexa…examine the variables influencing the use of artificial intelligent in-home voice assistants. Comput. Hum. Behav. 2019, 99, 28–37. [Google Scholar] [CrossRef]
- Lee, M.K.O.; Cheung, C.M.K.; Chen, Z. Acceptance of Internet-based learning medium: The role of extrinsic and intrinsic motivation. Inf. Manag. 2005, 42, 1095–1104. [Google Scholar] [CrossRef]
- Dienlin, T.; Metzger, M.J. An Extended Privacy Calculus Model for SNSs: Analyzing Self-Disclosure and Self-Withdrawal in a Representative U.S. Sample. J. Comput. Mediat. Commun. 2016, 21, 368–383. [Google Scholar] [CrossRef] [Green Version]
- Li, H.; Sarathy, R.; Xu, H. Understanding Situational Online Information Disclosure as a Privacy Calculus. J. Comput. Inf. Syst. 2010, 51, 62–71. [Google Scholar]
- Krasnova, H.; Veltri, N.F.; Günther, O. Self-disclosure and Privacy Calculus on Social Networking Sites: The Role of Culture. Bus. Inf. Syst. Eng. 2012, 4, 127–135. [Google Scholar] [CrossRef]
- Keith, M.J.; Thompson, S.C.; Hale, J.; Lowry, P.B.; Greer, C. Information disclosure on mobile devices: Re-examining privacy calculus with actual user behavior. Int. J. Hum. Comput. Stud. 2013, 71, 1163–1173. [Google Scholar] [CrossRef]
- Kim, D.; Park, K.; Park, Y.; Ahn, J.-H. Willingness to provide personal information: Perspective of privacy calculus in IoT services. Comput. Hum. Behav. 2019, 92, 273–281. [Google Scholar] [CrossRef]
- Park, K.; Kwak, C.; Lee, J.; Ahn, J.-H. The effect of platform characteristics on the adoption of smart speakers: Empirical evidence in South Korea. Telemat. Inform. 2018, 35, 2118–2132. [Google Scholar] [CrossRef]
- Liao, Y.; Vitak, J.; Kumar, P.; Zimmer, M.; Kritikos, K. Understanding the Role of Privacy and Trust in Intelligent Personal Assistant Adoption. In Proceedings of the 14th International Conference, iConference 2019, Washington, DC, USA, 31 March–3 April 2019; pp. 102–113. [Google Scholar]
- Chin, W.W.; Todd, P.A. On the use, usefulness, and ease of use of structural equation modeling in MIS research: A note of caution. MIS Q. 1995, 19, 237–246. [Google Scholar] [CrossRef]
- Venkatesh, V.; Thong, J.Y.L.; Xu, X. Consumer Acceptance and Use of Information Technology: Extending the Unified Theory of Acceptance and Use of Technology. MIS Q. 2012, 36, 157–178. [Google Scholar] [CrossRef] [Green Version]
- Sanchez, G. PLS Path Modeling with R; Editions, T., Ed.; Berkeley: Berkeley, CA, USA, 2013. [Google Scholar]
- Qureshi, I.; Compeau, D. Assessing Between-Group Differences in Information Systems Research: A Comparison of Covariance-and Componet-based SEM. MIS Q. 2009, 33, 197–214. [Google Scholar] [CrossRef]
- Wetzels, M.; Schroder, G.O.; Oppean, C.V. Using PLS Path Modeling for Assessing Hierarchical Construct Models: Guidelines and Empirical Illustration. MIS Q. 2009, 33, 177–195. [Google Scholar] [CrossRef]
- Gefen, D.; Straub, D.; Boudreau, M.-C. Structural Equation Modeling and Regression: Guidelines for Research Practice. Commun. Assoc. Inf. Syst. 2000, 4, 00407. [Google Scholar] [CrossRef] [Green Version]
- Fornell, C.R.; Larcker, D.F. Evaluating structural equation models with unobservable variables and measurement error. J. Mark. Res. 1981, 18, 39–50. [Google Scholar] [CrossRef]
- Yoo, Y.; Alavi, M. Media and group cohesion: Relative influences on social present, task participation, and group consensus. MIS Q. 2001, 25, 371–390. [Google Scholar] [CrossRef]
- Baron, R.M.; Kenny, D.A. The moderator-mediator variable distinction in social psychological research: Conceptual, strategic and statistical considerations. J. Personal. Soc. Psychol. 1986, 51, 1173–1182. [Google Scholar] [CrossRef]
- Frazier, P.A.; Tix, A.P.; Barron, K.E. Testing Moderator and Mediator Effects in Counseling Psychology. J. Couns. Psychol. 2004, 51, 115–134. [Google Scholar] [CrossRef]
- Shrout, P.E.; Bolger, N. Mediation in experimental and non-experimental studies: New procedures and recommendations. Psychol. Methods 2002, 7, 422–445. [Google Scholar] [CrossRef]
- Sobel, M.E. Asymptotic confidence intervals for indirect effects in structural equation models. Sociol. Methodol. 1982, 13, 290–312. [Google Scholar] [CrossRef]
- Kamara, S.; Lauter, K. Cryptographic Cloud Storage; Springer: Berlin/Heidelberg, Germany, 2010; pp. 136–149. [Google Scholar]
- Kamara, S.; Papamanthou, C.; Roeder, T. Dynamic Searchable Symmetric Encryption. In Proceedings of the 2012 ACM Conference on Computer and Communications Aecurity, Association for Computing Machinery, Raleigh, NC, USA, 16–18 October 2012; pp. 965–976. [Google Scholar]
- Dimitriou, T.; Michalas, A. Multi-party trust computation in decentralized environments in the presence of malicious adversaries. Ad Hoc Netw. 2014, 15, 53–66. [Google Scholar] [CrossRef]
- Bakas, A.; Michalas, A. (F)unctional Sifting: A Privacy-Preserving Reputation System Through Multi-Input Functional Encryption (extended version). IACR Cryptol. ePrint Arch. 2020, 2020, 1271. [Google Scholar]
- Michalas, A. The Lord of the Shares: Combining Attribute-Based Encryption and Searchable Encryption for Flexible Data Sharing. In Proceedings of the 34th ACM/SIGAPP Symposium on Applied Computing, Association for Computing Machinery, Limassol, Cyprus, 8–12 April 2019; pp. 146–155. [Google Scholar]
Figure 1.
Research Model.

Figure 2.
Path Coefficients (N = 559 for All).

Figure 3.
Unmediated and Mediated Models.

Table 1.
Measures for the Research Model.
| Constructs | Measurement Items | Source |
|---|---|---|
| Perceived usefulness | I think smart speakers will allow me to get things done faster. | [16,19,55] |
| I think smart speakers will make it easier for me to do what I need. | ||
| I think smart speakers will increase my productivity. | ||
| I think smart speakers will help me in situations where I have to make decisions. | ||
| Perceived ease of use | I believe the interaction with a smart speaker is clear and not difficult to understand. | [16,19,55] |
| I believe smart speakers can easily follow your command. | ||
| I believe that giving commands to smart speakers and making them perform certain functions is concise and not difficult. | ||
| I believe smart speakers are easy to use. | ||
| I believe it will not be difficult to learn how to use an smart speaker. | ||
| I believe it would be easy to command an smart speaker through voice commands and receive the desired response. | ||
| Perceived enjoyment | I think using a smart speaker is fun. | [15,44] |
| I think using a smart speaker is exciting. | ||
| I think using a smart speaker is a pleasant experience. | ||
| I think using a smart speaker is intriguing. | ||
| Perceived privacy risks | I feel concerned about a smart speaker’s collection of personal location information. | [11,50,52] |
| I feel concerned that my personal information may be leaked through a smart speaker. | ||
| I feel concerned that my personal information may always be exposed through wireless networks connected to a smart speaker. (newly developed) | ||
| Since an smart speaker is always on, I am worried that someone will always collect information about me or my family. (Newly developed) | ||
| I am worried that my personal life will be exposed while using a smart speaker. | ||
| Technology Readiness (control variable) | When I see a new smartphone or app, I want to test it. | [34,38] |
| I tend to test new information technologies or products (e.g., smartphones, apps) earlier than other people. | ||
| I find it fun and intriguing to try new information technology devices such as smartphones and apps. | ||
| Intention to adopt smart speakers | I want to (continue to) use various functions of a smart speaker in the future. | [56] |
| I may (continue to) receive a lot of help in the future while using smart speakers. | ||
| I will (continue to) use smart speakers. | ||
| I believe it is a good idea to (keep using)/use smart speakers. |
Table 2.
Profile of the Respondents (n = 559).
| Attribute | Value | South Korea | U.S. | Total | |||
|---|---|---|---|---|---|---|---|
| Frequency | Percentage | Frequency | Percentage | Frequency | Percentage | ||
| Gender | Male | 150 | 50.0% | 132 | 51.0% | 282 | 50.4% |
| Female | 150 | 50.0% | 127 | 49.0% | 277 | 49.6% | |
| Age | 15–19 | 60 | 20.0% | 1 | 0.4% | 61 | 10.9% |
| 20–29 | 60 | 20.0% | 29 | 11.2% | 89 | 15.9% | |
| 30–39 | 60 | 20.0% | 82 | 31.7% | 142 | 25.4% | |
| 40–49 | 40 | 13.3% | 71 | 27.4% | 111 | 19.9% | |
| 50–59 | 40 | 13.3% | 44 | 17.0% | 84 | 15.0% | |
| 60–69 | 40 | 13.3% | 24 | 9.3% | 64 | 11.4% | |
| 70–79 | 0 | 0.0% | 7 | 2.7% | 7 | 1.3% | |
| Education | Less than high school degree | 36 | 12.0% | 2 | 0.8% | 38 | 6.8% |
| High school graduate | 32 | 10.7% | 56 | 21.6% | 88 | 15.7% | |
| Attending or Associate degree in college (2-year) | 39 | 13.0% | 61 | 23.6% | 100 | 17.9% | |
| Attending or Bachelor′s degree in college (4-year) | 163 | 54.3% | 107 | 41.3% | 270 | 48.3% | |
| Attending or Master′s, Doctoral or Professional degree in graduate college | 30 | 10.0% | 33 | 12.7% | 63 | 11.3% | |
| Wage | Less than $1000 | 90 | 30.0% | 36 | 13.9% | 126 | 22.5% |
| $1000–$3000 | 96 | 32.0% | 92 | 35.5% | 188 | 33.6% | |
| $3000–$5000 | 66 | 22.0% | 74 | 28.6% | 140 | 25.0% | |
| $5000–$7000 | 25 | 8.3% | 36 | 13.9% | 61 | 10.9% | |
| More than $7000 | 23 | 7.7% | 21 | 8.1% | 44 | 7.9% | |
| Country | U.S. | 0 | 0.0% | 259 | 100.0% | 259 | 46.3% |
| South Korea | 300 | 100.0% | 0 | 0.0% | 300 | 53.7% | |
| Smart speaker usage experience | Yes | 150 | 50.0% | 169 | 65.3% | 319 | 57.1% |
| No | 150 | 50.0% | 90 | 34.7% | 240 | 42.9% | |
| Privacy invasion experience | Yes | 145 | 48.3% | 92 | 35.5% | 237 | 42.4% |
| No | 155 | 51.7% | 167 | 64.5% | 322 | 57.6% | |
Table 3.
Reliability and Convergent Validity Assessment of the Measurement Model.
| # of Items | Cronbach’s Alpha | Reliability (DG. Rho) | AVE | |
|---|---|---|---|---|
| 1. Perceived ease of use (EOU) | 6 | 0.89 | 0.92 | 0.65 |
| 2. Perceived usefulness (USF) | 4 | 0.88 | 0.92 | 0.74 |
| 3. Perceived enjoyment (ENJ) | 3 | 0.88 | 0.93 | 0.81 |
| 4. Perceived privacy risks (RSK) | 5 | 0.94 | 0.96 | 0.81 |
| 5. Previous experience of using smart speakers (USE_EXP) | 1 | 1.00 | 1.00 | 1.00 |
| 6. Previous experience of privacy invasion (PVC_EXP) | 1 | 1.00 | 1.00 | 1.00 |
| 7. Technology orientation (TECH) | 3 | 0.84 | 0.90 | 0.76 |
| 8. Gender (GEN) | 1 | 1.00 | 1.00 | 1.00 |
| 9. Age (AGE) | 1 | 1.00 | 1.00 | 1.00 |
| 10. Education level (EDU) | 1 | 1.00 | 1.00 | 1.00 |
| 11. Wage level (WAGE) | 1 | 1.00 | 1.00 | 1.00 |
| 12. Intention to adopt smart speakers (INT) | 4 | 0.93 | 0.95 | 0.83 |
Table 4.
Discriminant Validity Assessment of the Measurement Model.
| 1 | 2 | 3 | 4 | 5 | 6 | 7 | 8 | 9 | 10 | 11 | 12 | |
|---|---|---|---|---|---|---|---|---|---|---|---|---|
| 1. EOU | 0.81 | |||||||||||
| 2. USF | 0.53 | 0.86 | ||||||||||
| 3. ENJ | 0.48 | 0.67 | 0.90 | |||||||||
| 4. RSK | −0.03 | −0.16 | −0.13 | 0.90 | ||||||||
| 5. USE_EXP | 0.03 | 0.17 | 0.17 | −0.17 | 1.00 | |||||||
| 6. PVC_EXP | −0.07 | 0.00 | −0.04 | −0.01 | 0.16 | 1.00 | ||||||
| 7. TECH | 0.21 | 0.38 | 0.40 | −0.12 | 0.31 | 0.14 | 0.87 | |||||
| 8. GEN | 0.03 | 0.05 | 0.05 | 0.07 | −0.08 | 0.01 | −0.15 | 1.00 | ||||
| 9. AGE | 0.10 | 0.04 | 0.07 | 0.07 | −0.18 | −0.16 | −0.16 | 0.06 | 1.00 | |||
| 10. EDU | −0.08 | 0.01 | −0.03 | 0.02 | 0.06 | 0.15 | 0.00 | 0.00 | 0.26 | 1.00 | ||
| 11. WAGE | 0.11 | 0.12 | 0.13 | 0.00 | 0.14 | 0.11 | 0.14 | −0.10 | 0.24 | 0.35 | 1.00 | |
| 12. INT | 0.33 | 0.59 | 0.65 | −0.36 | 0.26 | 0.06 | 0.46 | −0.04 | −0.02 | 0.00 | 0.12 | 0.91 |
Note: The principal diagonal (in boldface) of the inter-correlation matrix represents the square root of the average variance extracted (AVE) per construct.
Table 5.
Results of the Structural Model (N = 559 for All).
| Hypotheses | Effect | Coefficient | S.E. | t-Statistics | p-Value | Conclusion | |
|---|---|---|---|---|---|---|---|
| H1 | EOU → INT | −0.02 | 0.03 | −0.43 | 0.665 | Reject | |
| H2 | USF → INT | 0.21 | *** | 0.04 | 4.99 | 0.000 | Accept |
| H3 | EOU → USF | 0.53 | *** | 0.04 | 14.70 | 0.000 | Accept |
| H4 | ENJ → INT | 0.41 | *** | 0.04 | 10.00 | 0.000 | Accept |
| H5 | EOU → ENJ | 0.48 | *** | 0.04 | 13.00 | 0.000 | Accept |
| H6 | RSK → INT | −0.25 | *** | 0.03 | −8.26 | 0.000 | Accept |
| H7 | USF X RSK → INT | 0.00 | 0.04 | 0.09 | 0.928 | Reject | |
| H8 | ENJ X RSK → INT | 0.01 | 0.04 | 0.23 | 0.822 | Reject | |
| Control variables | USE_EXP → INT | 0.05 | 0.03 | 1.61 | 0.107 | ||
| PVC_EXP → INT | 0.04 | 0.03 | 1.32 | 0.187 | |||
| TECH → INT | 0.17 | *** | 0.03 | 4.91 | 0.000 | ||
| GEN → INT | −0.02 | 0.03 | −0.57 | 0.567 | |||
| AGE → INT | 0.00 | 0.03 | 0.06 | 0.952 | |||
| EDU → INT | 0.00 | 0.03 | 0.06 | 0.954 | |||
| WAGE → INT | 0.01 | 0.03 | 0.39 | 0.699 | |||
Note: *** = p < 0.01.
Table 6.
Comparison between South Korean and U.S. samples.
| Hypotheses | Effect | Coefficient (Global) | Coefficient (South Korea) | Coefficient (U.S.) | Diff. ABS. | No (0.28) | ||||
|---|---|---|---|---|---|---|---|---|---|---|
| H1 | EOU → INT | −0.02 | 0.02 | −0.02 | 0.04 | No (0.28) | ||||
| H2 | USF → INT | 0.21 | *** | 0.15 | ** | 0.20 | *** | 0.05 | No (0.33) | |
| H3 | EOU → USF | 0.53 | *** | 0.61 | *** | 0.47 | *** | 0.13 | Yes (0.05) | ** |
| H4 | ENJ → INT | 0.41 | *** | 0.47 | *** | 0.34 | *** | 0.12 | Yes (0.08) | * |
| H5 | EOU → ENJ | 0.48 | *** | 0.46 | *** | 0.49 | *** | 0.04 | No (0.44) | |
| H6 | RSK →INT | −0.25 | *** | −0.15 | *** | −0.30 | *** | 0.15 | Yes (0.01) | *** |
| H7 | USF X RSK → INT | 0.00 | 0.14 | ** | −0.04 | 0.18 | Yes (0.02) | ** | ||
| H8 | ENJ X RSK → INT | 0.01 | −0.04 | 0.04 | 0.08 | No (0.21) | ||||
| Control variables | USE_EXP → INT | 0.05 | −0.05 | 0.14 | *** | 0.19 | Yes (0.00) | *** | ||
| PVC_EXP → INT | 0.04 | 0.07 | 0.03 | 0.04 | No (0.31) | |||||
| TECH → INT | 0.17 | *** | 0.15 | *** | 0.18 | *** | 0.03 | No (0.29) | ||
| GEN → INT | −0.02 | −0.03 | −0.02 | 0.01 | No (0.43) | |||||
| AGE → INT | 0.00 | −0.03 | 0.04 | 0.06 | No (0.14) | |||||
| EDU → INT | 0.00 | −0.03 | 0.05 | 0.08 | No (0.17) | |||||
| WAGE → INT | 0.01 | 0.02 | −0.03 | 0.05 | No (0.23) | |||||
Note: *, **, *** = p < 0.1, p < 0.05 and p < 0.01, respectively.
Table 7.
Results for Mediation Effect.
| Mediator | Path | Path Coefficient | S.E. | t-Test | Sobel Test | Mediation Type | |
|---|---|---|---|---|---|---|---|
| Perceived usefulness | c | 0.24 | 0.04 | 6.49 | *** | z = 4.88 (p < 0.01) | Complete Mediation |
| a | 0.53 | 0.04 | 14.70 | *** | |||
| b | 0.21 | 0.04 | 4.99 | ** | |||
| c+ | −0.02 | 0.03 | −0.43 | ||||
| Perceived enjoyment | c | 0.24 | 0.04 | 6.49 | *** | z = 7.79 (p < 0.01) | Complete Mediation |
| a* | 0.48 | 0.04 | 13.00 | *** | |||
| b* | 0.41 | 0.04 | 10.00 | *** | |||
| c+ | −0.02 | 0.03 | −0.43 | ||||
Note: *, **, *** = p < 0.1, p < 0.05 and p < 0.01, respectively. z .
Publisher’s Note: MDPI stays neutral with regard to jurisdictional claims in published maps and institutional affiliations. |
© 2021 by the authors. Licensee MDPI, Basel, Switzerland. This article is an open access article distributed under the terms and conditions of the Creative Commons Attribution (CC BY) license (http://creativecommons.org/licenses/by/4.0/).
Share and Cite
MDPI and ACS Style
Cha, H.S.; Wi, J.H.; Park, C.; Kim, T. Sustainability Calculus in Adopting Smart Speakers—Personalized Services and Privacy Risks. Sustainability 2021, 13, 602. https://doi.org/10.3390/su13020602
AMA Style
Cha HS, Wi JH, Park C, Kim T. Sustainability Calculus in Adopting Smart Speakers—Personalized Services and Privacy Risks. Sustainability. 2021; 13(2):602. https://doi.org/10.3390/su13020602
Chicago/Turabian StyleCha, Hoon S., Jong Hyun Wi, Chanhi Park, and Taeha Kim. 2021. "Sustainability Calculus in Adopting Smart Speakers—Personalized Services and Privacy Risks" Sustainability 13, no. 2: 602. https://doi.org/10.3390/su13020602
Note that from the first issue of 2016, this journal uses article numbers instead of page numbers. See further details here.