
ESG Ratings and Stock Performance during the COVID-19 Crisis


1
Faculty of Business and Economics, TU Dortmund University, Otto-Hahn-Str. 6, 44227 Dortmund, Germany
2
Faculty of Law, Justus Liebig University of Giessen, Licher Str. 76, 35394 Giessen, Germany
*
Author to whom correspondence should be addressed.
Sustainability 2021, 13(13), 7133; https://doi.org/10.3390/su13137133
Submission received: 5 May 2021
/
Revised: 16 June 2021
/
Accepted: 22 June 2021
/
Published: 25 June 2021
(This article belongs to the Special Issue Corporate Social Responsibility and Corporate Performance)
Abstract
:We investigate the association between Environmental, Social, and Governance (ESG) ratings and stock performance during the COVID-19 crisis. Although there is mixed evidence in the literature whether ESG is valuable in times of crisis, we find high ESG-rated European firms to be associated with higher abnormal returns and lower stock volatility. After decomposing ESG into its separate components, we find the social score to be the predominant driver of our results. Further, we argue that ESG is value-enhancing in low-trust countries, and in countries with poorer security regulations and where lower disclosure standards prevail.
1. Introduction
In the literature there is a debate of whether engaging in corporate social responsibility (CSR) activities is beneficial [1,2,3]. Some studies have shown that CSR activities are solely a manifestation of agency conflicts between a firm’s shareholders and managers, who particularly benefit from engaging in CSR at the expense of a firm’s shareholders [4,5], while other research has shown that engaging in environmental, social, and governance (ESG) is value-enhancing due to the hypothesis that well-governed corporations can achieve both, higher profits and better social conditions [2,6,7,8].
In line with these arguments, there is mixed evidence in the literature regarding the relationship between a firm’s CSR activities and its stock performance, especially during times of crisis. Albuquerque et al. [9], Lins et al. [10] and Ding et al. [11] find that high CSR-rated firms are associated with better stock performance in terms of higher stock returns and lower stock volatility during times of crisis. In contrast, Bae et al. [12] and Demers et al. [13] stress that a firm’s CSR performance is unrelated to its stock performance after the COVID-19 crisis unfolded, thus CSR does not make firms more resilient in times when market uncertainty is high.
In this paper, we therefore investigate whether there is a link between CSR activities and a firm’s stock performance in terms of higher stock returns and lower stock volatility in the beginning of 2020, because the unexpected and exogenous COVID-19 shock serves as a brilliant opportunity to test this relationship. Particularly, we aim to answer two main research questions.
First, does engaging in CSR activities create shareholder value and does good-quality CSR make European firms more resilient during times of crisis? Although there is a growing strand of literature investigating the effect of good-quality CSR when market uncertainty is high [9,10,11,12,13], our understanding of whether CSR is of particular importance for European firms, especially during times of crisis, is still limited.
Second, we pose the research question of whether CSR is even more important for firms headquartered in certain countries depending on the countries’ characteristics. In this respect, we examine whether the effect of good-quality CSR is even more pronounced in low-trust or high-trust European countries. While Lins et al. [10] investigate the impact of CSR in high-trust US regions, this is the first study investigating the impact of good-quality CSR depending on a countries’ level of societal trust. Further, we explore additional country characteristics as proposed in Karolyi et al. [14] and Neukirchen et al. [15] who investigate characteristics such as the quality of security market regulations, the level of legal protection standards, as well as the level of disclosure standards.
We employ a sample of 1452 firms from 16 different European countries to examine whether high CSR-rated firms outperformed those with very low CSR ratings. To do so, we obtain Refinitiv’s ESG ratings from Thomson Reuters Eikon as they are primarily used in the CSR literature [9,12,13], and also financial data from Compustat/Capital IQ.
Our research design is closely related to Albuquerque et al. [9], Bae et al. [12], and Lins et al. [10]. Specifically, we employ several multivariate regression models where the dependent variable is either a firm’s cumulative raw stock return or a firm’s cumulative abnormal stock return during the so-called “collapse period” from 3 February 2020 until 23 March 2020 proposed by Fahlenbrach et al. [16] where the COVID-19 pandemic hit financial markets. Additionally, we use a firm’s volatility and idiosyncratic volatility over the collapse period as dependent variables to test whether effective CSR is associated with a reduction in stock volatility. As our main independent variables of interest, we use the raw ESG scores and a dummy variable set to one if a firm’s ESG score is larger than the median score within the respective country, and zero otherwise.
Our results are mixed, consistent with the related literature. Comparable to the results found in Bae et al. [12] and Demers et al. [13], we do not find statistically significant coefficients on our ESG measures when we employ a firm’s cumulative raw stock return as the dependent variable. However, our results are in line with Albuquerque et al. [9], when using market adjusted abnormal stock returns in our regressions. We find positive and highly statistically significant coefficients on our ESG measures indicating that a one standard deviation increase in ESG scores is associated with on average a 2.59% higher abnormal return during the collapse period. Further, we document that firms with higher ESG scores are also associated with lower idiosyncratic volatility. We find our results to be robust to different observation periods and when controlling for several firm characteristics as used in related studies [9,10,12,16]. We also employ industry and country fixed effects to ensure the validity of our results.
In additional tests, we examine whether ESG is even more value-enhancing in specific countries. Particularly, we find that ESG is of significant importance in low-trust countries, and in countries which exhibit poorer security regulations and where lower disclosure standards prevail. Our results differ in some extent from those found in Lins et al. [10] who show that CSR is more important in high-trust US regions during the global financial crisis (GFC). However, Bae et al. [12] find only weak support for this hypothesis during the COVID-19 crisis. In this respect, Engelhardt et al. [17] investigate a cross-country setting and find that financial volatility is significantly higher in low-trust countries in response to COVID-19 cases. Thus, our results indicate that engaging in ESG activities in low-trust countries may reduce uncertainty among market participants during the COVID-19 pandemic.
2. Theoretical Background
There is an evolving body of research investigating the relationship between a firm’s CSR performance and firm value and so far, the existing literature shows ambiguous results [1,2,3,18,19,20,21,22,23,24,25,26,27,28,29]. Beginning with Friedman [30], there is an ongoing discussion of whether companies should maximize shareholder value or stakeholder wealth. Classical shareholder theory suggests that CSR is solely a donation from a firm’s shareholders to stakeholders [31]. In this respect, firms which are socially unresponsive have lower costs and could therefore earn higher profits than socially responsive firms [32]. Thus, socially responsive firms generally face competitive disadvantages compared to socially unresponsive firms and should have lower valuations [33].
Similarly, some authors have argued that CSR activities might be solely a manifestation of agency conflicts between a firm’s shareholders and managers. In that sense, managers might invest in CSR activities in order to boost their personal image among relevant stakeholder groups at the expense of a firm’s shareholders [4,5]. Following this argument, a firm’s CSR performance is either unrelated to its value or can even damage a firm’s valuation because of high agency costs [12,23,24,29].
The opposite view on the relationship between CSR and firm value is that engaging in CSR activities is value-enhancing due to the hypothesis that well-governed corporations can achieve both, higher profits and better social conditions [2,6,7,8]. This view on CSR is also summarized as “doing well by doing good” [9]. In this respect, several studies have highlighted a positive relationship between a firm’s CSR performance and its financial performance [1,2,22,26,34,35]. Dai et al. [36] document that CSR efforts increase a firm’s operational efficiency and its firm value. El Ghoul et al. [37] show that firms with good-quality CSR have substantially lower cost of capital. Their findings also support the view that high-CSR rated firms exhibit lower financial risks and are thus valued higher by investors. Deng et al. [21] investigate whether CSR is value enhancing for acquiring firms’ shareholders and find that high CSR acquirers exhibit significantly higher merger announcement returns. Albuquerque, Koskinen, and Zhang [38] argue that CSR significantly reduces systematic risk and strengthens firm value. Further, Flammer [1] states that the effect of shareholder CSR proposals lead to significantly higher abnormal stock returns.
The effect of CSR has also been studied during times of financial crises. Cornett et al. [39] find that the relationship between banks’ CSR quality and their financial performance is positive; thus banks particularly benefit from engaging in CSR activities after the Great Recession in 2009. Further, Lins et al. [10] stress that non-financial firms which are socially responsible had better capital market outcomes in terms of higher stock returns during the GFC. Additionally, they find that high-CSR rated firms had higher profitability and growth compared to low-CSR rated firms.
Several recent papers have also examined the current COVID-19 crisis. Albuquerque et al. [9] and Ding et al. [11], who primarily focus on the US market, document that high CSR-rated firms exhibit better financial performance in terms of higher stock returns and lower stock volatility during the ongoing COVID-19 crisis. In contrast to these studies, Bae et al. [12] as well as Demers et al. [13] find that a firm’s CSR performance is either unrelated to its financial performance after the COVID-19 crisis hit financial markets. Thus, firms which are socially responsible were generally not more resilient.
3. Data
Our sample consists of 1452 publicly-listed European firms from 16 different European countries. To measure a firm’s ESG performance, we obtain Refinitiv’s ESG ratings from Thomson Reuters Eikon which have also been used in the CSR literature [9,13]. Particularly, we collect Refinitiv’s ESG ratings for the year 2019. Refinitiv measures corporate environmental, social, and governance performance into several sub-dimensions. A firm’s environmental performance is covered by the categories resource use, emissions, and innovation. Social performance is measured by the sub-dimensions workforce, human rights, community, and product responsibility, and governance performance is evaluated in the sub-dimensions management, stakeholders, and CSR strategy [40]. We then extend our dataset by adding stock and accounting data from Compustat/Capital IQ.
Our main independent variable of interest is ESG Score which measures a firm’s ESG performance. Additionally, we construct the dummy variable High ESG, which is set to one if a firm’s ESG score is larger than the median score within the respective country, and zero otherwise. Our main dependent variables of interest are a firm’s cumulative raw stock return as well as a firm’s cumulative abnormal stock return for the period from 3 February 2020 until 23 March 2020. This period is the so-called “collapse period” as proposed by Fahlenbrach et al. [16] where the COVID-19 pandemic hit financial markets. We calculate abnormal returns based on a market model estimation similar to Albuquerque et al. [9]. Specifically, a firm’s abnormal stock return is the difference between the logarithmic stock return and the expected stock return. The expected stock return is the CAPM beta times the market return of the respective country where we estimate beta factors based on the firm’s stock returns and the respective market return for the year 2019.
We also employ several control variables which have also been used in the existing literature [9,10,12,16] and provide definitions of these variables in Table A1 in the Appendix A.
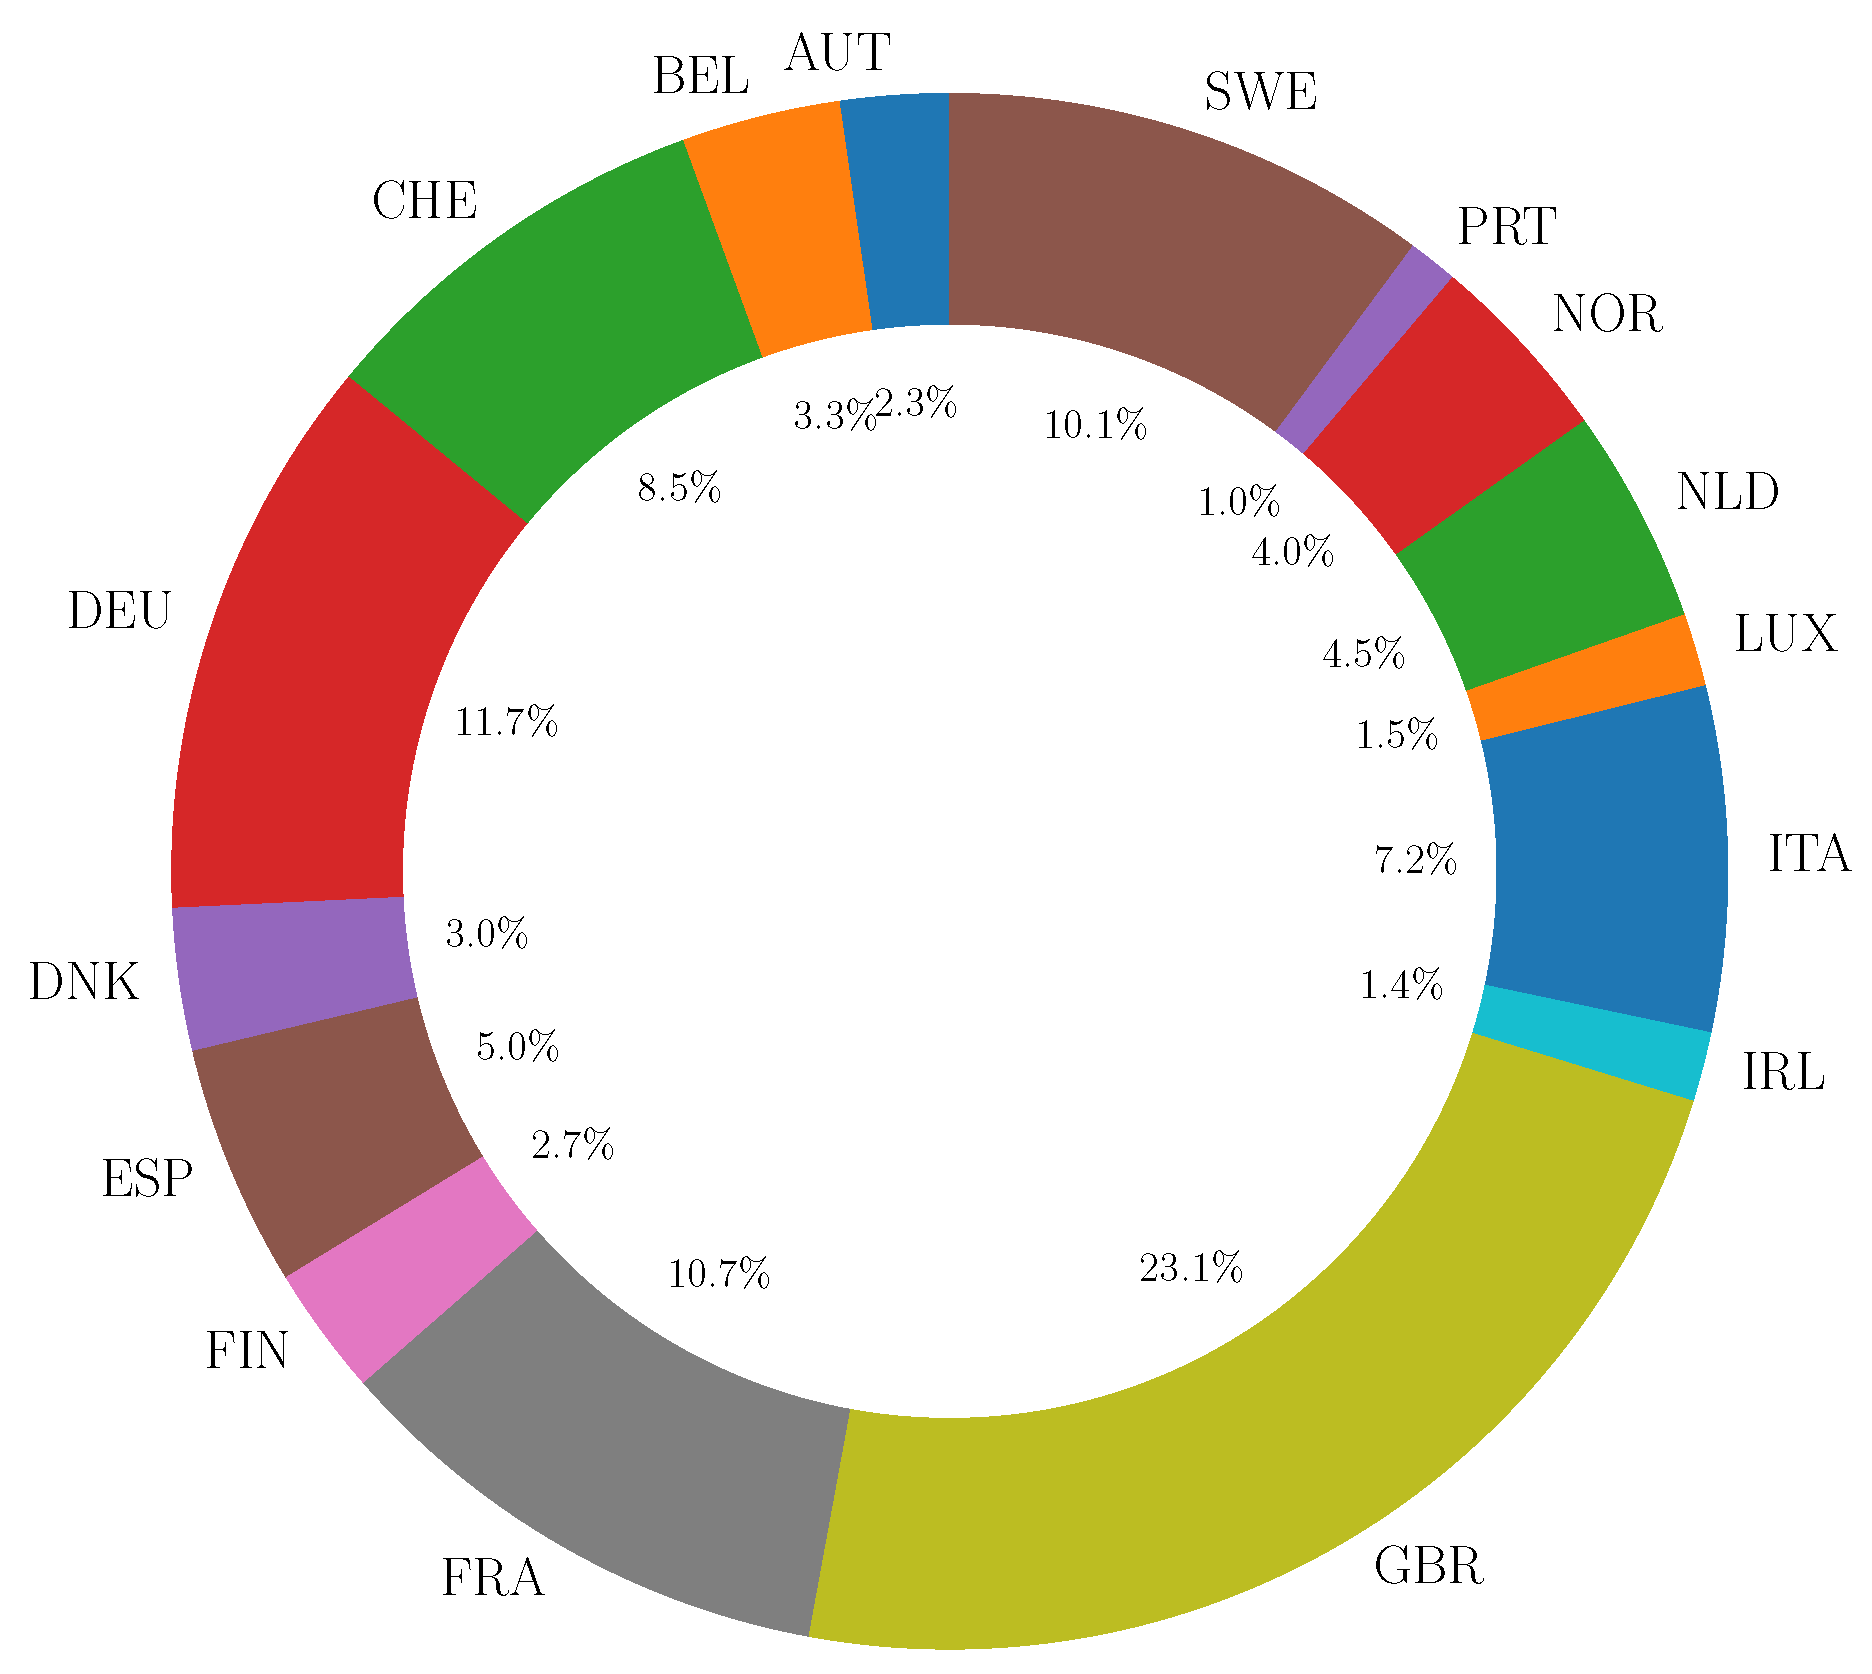
After merging our datasets, our final sample consists of 1452 European firms, for which we gather data on ESG ratings and data on stock performance. Regarding control variables, there are several observations missing which is the reason why we take several regression specifications into account. Figure 1 shows the weights of the 16 different European countries in which the firms are headquartered in. For instance, 23.1% of the firms are located in the UK and 11.7% are German firms.
Table 1 presents summary statistics for our final dataset. Mean cumulative stock returns are highly negative (%) and the respective standard deviation is % which indicates that firms’ stock prices experience large fluctuations during the collapse period from 3 February 2020 until 23 March 2020. Although Fahlenbrach et al. [16] consider a dataset consisting of US firms, we find very similar summary statistics regarding firms’ cumulative stock returns. Further, the mean ESG score amounts to % with a standard deviation of %. In terms of control variables, the average firm in our dataset has a size of $ billion, a cash over assets ratio of %, and a financial leverage of %.
Before we examine the association between corporate ESG performance and stock returns in a multivariate setting, we first perform a correlation analysis in Table 2. Regarding pairwise correlations, we find that the correlations are generally weak, except for the positive correlations between Size and our ESG measures and ROE and Profitability. Further, we find a negative correlation of between ESG Score and Historical Volatility and a correlation of between Momentum and Historical Volatility. The main independent variable of interest ESG Score and the cumulative (abnormal) stock return which are used as the dependent variables in the upcoming multivariate regressions, show a positively weak and statistically significant correlation of 1% (4%).
We additionally present univariate tests in Table 3 to compare firm characteristics of High ESG and Low ESG firms. Concerning firm size, High ESG firms are on average significantly larger than Low ESG firms. High ESG firms exhibit significantly higher financial leverage and higher long-term debt over assets ratios, while we find that High ESG firms tend to have a significantly lower Tobin’s Q, a lower cash over assets ratio, a lower market-to-book ratio, and a lower historical stock volatility.
4. Empirical Results
4.1. ESG Ratings and Stock Returns
To study the association between a firm’s ESG performance and stock returns, we estimate the following ordinary least squares (OLS) regression:
where i is the firm and is the error term. The dependent variable is a firm’s stock performance which is either the cumulative stock return or the cumulative abnormal stock return from 3 February 2020 to 23 March 2020. Our main independent variable of interest is ESG Score which measures a firm’s ESG performance. In additional regressions, we also employ the dummy variable High ESG, which is set to one if the firm’s ESG score is above the median score within the respective country, and zero otherwise. As shown in specification (1), we include a variety of firm controls as well as industry fixed effects and country fixed effects in our regression models. In terms of control variables, we include firm size as it explains a substantial fraction of the variation in stock returns [41]. Further, we control for ROE, profitability, cash holdings and different proxies for corporate debt because firms with stronger financial conditions may also have higher stock returns over the COVID-19 crisis period [10]. In addition, a firm’s historical volatility, market-to-book ratio and momentum factor are included in the regression model as these variables may affect a firm’s stock performance [9,42]. In terms of industry fixed effects, we use the Global Industry Classification Standard’s (GICS) 11 sectors as proposed in Neukirchen et al. [15]. We additionally cluster the standard errors by country as done in Lins et al. [43] and Petersen [44] since firm controls might be correlated between firms within the respective country.
Table 4 presents our baseline results. In Panel A we employ both, a firm’s cumulative stock return (columns (1) and (3)) and a firm’s cumulative abnormal stock return (columns (2) and (4)) as the dependent variables. The variable ESG Score is our main independent variable of interest. While we find statistically insignificant coefficients on ESG Score when considering a firm’s cumulative raw stock return as the dependent variable (columns (1) and (3)), the coefficients on ESG Score are positive and highly statistically significant when we employ the cumulative abnormal stock return as the dependent variable (columns (2) and (4)). In columns (2) and (4), the coefficients on ESG Score are comparable in size even when we control for a variety of firm characteristics (column (4)) and country fixed and industry fixed effects. It is noteworthy, that we only consider 1122 firms in columns (3) and (4) as some firm controls are missing for certain observations. Regarding control variables, our results are similar to the existing literature [9,15,16]. Particularly, we find negative and highly statistically significant coefficients on Short-term Debt / Assets, Long-term Debt / Assets, and positive and statistically significant coefficients on Size, ROE, Cash / Assets, Market-to-Book, Historical Volatility, and Momentum.
Although we find no consistent evidence supporting the notion that firms with a higher ESG performance exhibit higher cumulative raw returns, we can conclude that a one standard deviation increase in ESG scores is associated with on average a 2.59% higher abnormal return during the collapse period. The results are in line with the ongoing debate of whether ESG significantly pays off during times of crisis. While Bae et al. [12] and Demers et al. [13] find no evidence that ESG affects stock returns and market adjusted stock returns, Albuquerque et al. [9] find that firms with higher environmental and social ratings are associated with higher abnormal stock returns over the crisis period.
In Panel B, we employ our dummy variable High ESG and run the same specifications as in Panel A to ensure that our results hold when employing an alternative measure for a firm’s ESG performance. The results remain qualitatively similar. We find positive and highly statistically significant coefficients on High ESG in columns (2) and (4) where we use cumulative abnormal stock returns as the dependent variable. Again, High ESG remains insignificant when the dependent variable is a firm’s cumulative raw stock return. In terms of control variables, the results are in line with the one found in Panel A. We can conclude, that firms with high ESG scores are associated with at least 3.83 percentage points higher abnormal stock returns compared to those with low ESG scores; thus firms with very low ESG efforts were particularly affected by the COVID-19 crisis. The adjusted R-Squared values are relatively small because of the applied within-transformation estimator. When we use a standard estimator with the same model specifications, we obtain both, nearly the same loads on our regression coefficients as well as comparable R-Squared values as in related studies [9].
We additionally decompose the ESG rating into its separate components to investigate which aspect of ESG is of significant importance. We rerun our analysis in Table 4 while we include the E, S, and G score separately into our regression model. Although not reported for reasons of brevity, we find that the social component of ESG is highly statistically significant and shows the largest effect, thus the social score is the predominant driver of our results. The environmental score is weakly statistically significant showing a relatively small effect and is therefore of minor importance, while the governance score does not offer any explanatory power in our analyses. This finding is in line with Albuquerque et al. [9] who also find that the environmental and social scores are value enhancing for both, firms and shareholders.
4.2. ESG Ratings and Stock Volatility
Since our previous results suggest that firms with higher ESG ratings had significantly higher abnormal returns during the crisis period, we also investigate whether firms with higher corporate ESG ratings exhibit lower stock volatility. To test this relationship, we perform the regressions as in Table 4 using a firm’s stock volatility and a firm’s idiosyncratic volatility during the collapse period from 3 February 2020 to 23 March 2020 as dependent variables. Our main independent variable of interest is a firm’s ESG score. As in Table 4 we include a variety of firm characteristics and industry fixed and country fixed effects. Table 5 presents the results.
We find negative but statistically insignificant coefficients on ESG Score in columns (1) and (3) where the dependent variable is a firm’s stock volatility during the collapse period. Further, we find negative and statistically significant coefficients on ESG Score when considering a firm’s idiosyncratic volatility as the dependent variable in column (2). The effect slightly vanishes after firm controls have been included into the regression model (column (4)). We only consider 1122 firms in columns (3) and (4) as some firm controls are missing for certain observations. We find that a one standard deviation increase in ESG scores is associated with a decrease of 0.17% in terms of total idiosyncratic volatility. This effect is economically sizeable as it is represents approximately 3.83% of the mean idiosyncratic stock volatility. The results are in line with Albuquerque et al. [9] who show that high environmental and social (ES)-rated firms exhibit significantly lower stock volatility. Regarding our control variables, we find that firms with higher debt over assets ratios and higher historical volatility are associated with higher idiosyncratic volatility. We additionally find larger firms and highly profitable firms to experience significantly lower stock volatility during the crisis period.
4.3. ESG Ratings and Country Characteristics
We now examine whether a firm’s ESG performance is even more important depending on the respective country the firm is domiciled in. Specifically, we examine the following country characteristics. We investigate the effect of ESG in high-trust and low-trust countries as proposed by Lins et al. [10] who find that the association between financial crisis’ stock returns and CSR is particularly valuable in high-trust US regions. Similar to the methodology used in Karolyi et al. [14] and Neukirchen et al. [15] we also examine whether high ESG-rated firms profit even more when they are domiciled in countries with poorer security regulations, in countries with lower-quality accounting rules, i.e., disclosure practices, and in countries with lower legal protection of minority shareholders.
We gather data on a country’s level of societal trust from the World Values Survey’s (WVS) latest wave from 2017 to 2020. Our proxy for the quality of securities regulations is a country’s Rule of Law index from the World Bank’s World Governance Indicators for 2019. Data on a country’s disclosure standards come from the Disclosure index provided by La Porta et al. [45], and data on the level of legal protection standards come from the Anti-Self-Dealing index (ASDI) provided by Djankov et al. [46].
To study this relationship, we split our dataset based on the country characteristics’ median scores and run our baseline regression models on the sub-samples as done in Karolyi et al. [14] and Neukirchen et al. [15]. We present the results from these regressions in Table 6 where the main independent variable of interest is High ESG. As in our baseline model in Table 4, we control for a variety of firm characteristics and include industry fixed and country fixed effects.
We find a positive and highly statistically significant coefficient on High ESG where firms are either domiciled in low-trust countries (column (1)), or in countries with poorer security regulations (column (3)), or in countries where lower disclosure standards prevail (column (5)); thus a firm’s ESG performance has a positive effect over the crisis period in certain countries. Further, we split the dataset by the ASDI and find that a firm’s ESG performance significantly pays off in countries where the legal protection standards of minority shareholders are strong.
4.4. Discussion and Contribution
Our findings add to the ongoing discussion of whether engaging in CSR activities is valuable, especially during times of crisis [9,12,13]. Specifically, our results suggest that high CSR-rated European firms had better capital market outcomes in terms of higher abnormal stock returns and lower stock volatility during the COVID-19 crisis; thus these firms were more immune to the pandemic’s economic impact. Considering the two opposing views presented earlier, our results suggest that investors favor socially responsible firms and that CSR activities are not detrimental to shareholder wealth. It seems that high CSR-rated firms can achieve both, better capital market performance and better social conditions. Socially responsible firms do not appear to face competitive disadvantages or to incur higher agency costs.
Our paper contributes to the mixed evidence in the evolving empirical literature. Flammer [1] and Ferrel et al. [2] show that CSR activities create shareholder wealth. Further, Dai et al. [36] state that CSR efforts increase a firm’s operational efficiency and firm value. El Ghoul et al. [37] document that firms with better CSR performance have lower cost of capital. More closely related to our paper, Albuquerque et al. [9] and Lins et al. [10], who primarily investigate the US market, find that high CSR-rated firms had higher crisis period stock returns. We also find that European firms with better ESG ratings are more immune to the COVID-19 shock regarding abnormal stock returns and lower idiosyncratic stock volatility. We confirm that our results are comparable to those found in Albuquerque et al. [9]. However, as in Bae et al. [12] and Demers et al. [13], we find no association using raw returns. Overall, we find that European firms which are socially responsible had at least equal or even better financial performance during the COVID-19 crisis compared to those socially unresponsible firms. Thus, we further highlight the importance of good-quality CSR. We find that the results are driven by a firm’s environmental and social score more than by its governance performance as outlined in related studies [9].
Furthermore, we contribute to the literature by showing that a firm’s CSR quality plays a more important role in certain countries depending on the countries’ characteristics as done for the impact of investor relations in Karolyi et al. [14] and Neukirchen et al. [15]. In this respect, we first state that the effect of good-quality CSR is particularly valuable in countries where the level of societal trust is low. In that sense, our results differ in some extent from those in Lins et al. [10] who document that the effect of good-quality CSR is of significant importance in high-trust regions in the US during the GFC. However, Bae et al. [12] find only weak support for the hypothesis that trust influences the effect of CSR during the COVID-19 crisis, while Engelhardt et al. [17] find that financial volatility is significantly higher in response to COVID-19 cases in low-trust countries. We relate our findings to the fact that good-quality CSR may reduce uncertainty among market participants during the COVID-19 crisis and is thus more valuable in low-trust countries. We further argue that CSR might help to strengthen relationships with important stakeholders in these low-trust countries and thus these firms might be considered to be more trustworthy.
Second, we investigate the impact of a country’s disclosure standards and its rule of law. Karolyi et al. [14] find that investor relations activities are more important in low rule of law countries and in low disclosure countries. We document that CSR is value-enhancing in countries with poorer security regulations and in countries where lower disclosure standards prevail. We relate this result to the fact that market participants might think that well-governed firms, as shown by their CSR rating, might be less likely to engage in financial misconduct and to destroy shareholder wealth.
Finally, our study also relates to the growing body of literature investigating financial markets during the COVID-19 crisis [15,17,47,48,49]. In this respect, firms with higher financial flexibility had better stock performance [16,50], while firms with lower credit ratings exhibited higher drops in stock prices during the COVID-19 stock market crash [51]. In contemporaneous work, Cheema-Fox et al. [52], Cepoi [53] and Engelhardt et al. [54] find that stock returns were particularly related to media coverage and news sentiment during the crisis. Further, firms which face a lower exposure to the pandemic [55,56] as well as firms which are more immune to social distancing policies [57], exhibit better financial performance. Ozik et al. [58] argue that retail investors could incrementally stabilize financial markets, and Pástor and Vorsatz [59] find that passive benchmarks outperformed actively managed funds during the market crash.
5. Robustness
We perform a variety of robustness checks to ensure the validity of our findings. First, we test whether our main results persist when we change the observation period. Specifically, we rerun our baseline regressions (I) over the whole first quarter of 2020 as in Albuquerque et al. [9], and (II) over the so-called “fever period” from Ramelli and Wagner [50] from 24 February 2020 to 20 March 2020. However, our results remain qualitatively similar.
Second, we follow Albuquerque et al. [9] and use ES ratings in our analyses. We thus omit the governance score in unreported regressions and find very similar results compared to our previous findings. Additionally, we break down the ESG score into E, S, and G and use the scores separately as done in Albuquerque et al. [9]. Although not reported for reasons of brevity, we find similar baseline results. Our results are also in line with Albuquerque et al. [9], who show that a firm’s ES performance is of significant importance while a firm’s governance score is not useful to explain stock returns over the crisis period. Although Albuquerque et al. [9] primarily examining the US market, we find a similar pattern for European stock markets.
Third, we test whether our findings are driven by the performance of firms which are domiciled in the UK, as these firms amount to approximately 25% of our observations. Although we find that the coefficient on ESG Score is positive and statistically significant, the coefficient is slightly smaller in magnitude compared to the results found in Table 4. We also see a similar picture when we rerun the baseline regression in Table 5 when the dependent variable is a firm’s idiosyncratic volatility. Further, we exclude firms from the financial sector and firms with low stock liquidity, i.e., firms with a market capitalization below $250 million as proposed by Lins et al. [10] and Neukirchen et al. [15]. Overall, our results remain qualitatively similar when performing several robustness exercises.
6. Conclusions
The COVID-19 crisis led to enormous uncertainty on financial markets along with a dramatic decline in stock prices and higher financial volatility. In this paper, we studied whether firms with higher ESG ratings perform significantly better during the COVID-19 crisis. We investigate a sample consisting of 1452 firms from 16 different European countries and argue that firms with better ESG performance had significantly higher cumulative abnormal returns and exhibit significantly lower idiosyncratic volatility in the beginning of 2020. Our results hold in several multivariate specifications as well as when applying a variety of robustness checks.
Our findings have implications for the financial sector and its market participants. From the firm’s perspective, engaging in CSR significantly pays off in terms of better stock performance. Thus, good quality CSR is making firms more resilient when market uncertainty is high, and therefore managers should increase their commitment to develop an appropriate CSR strategy.
From an investor’s perspective, good quality CSR is an important factor regarding a firm’s stock performance, especially during times of crisis. When facing investment decisions, CSR is even more important in low-trust countries, and in countries which exhibit poorer security regulations and where lower disclosure standards prevail.
Finally, as with most research in this field, our research has certain limitations. First, we only consider a rather small observation period, and thus our paper only addresses the short term effects of good quality CSR on stock performance during the COVID-19 crisis. However, the crisis is still present and studying the long term effects of CSR is an interesting field for future research. Second, we only use data from a single data source to construct our CSR measure and there might be other proxies to capture the quality of a firm’s CSR performance. Third, there are existing additional country characteristics. Studying whether CSR significantly pays off in certain countries depending on the countries’ characteristics, for instance in freer countries, leaves space for further research and could provide deeper insights.
Author Contributions
Conceptualization, N.E., J.E. and P.P.; methodology, N.E.; software, N.E.; validation, N.E. and P.P.; formal analysis, N.E.; investigation, N.E.; resources, P.P.; data curation, N.E.; writing—original draft preparation, N.E.; writing—review and editing, N.E., J.E., P.P.; visualization, N.E.; supervision, P.P.; project administration, N.E. All authors have read and agreed to the published version of the manuscript.
Funding
This research received no external funding.
Acknowledgments
The authors wish to thank the team of the center for Finance, Risk and Resource management of the Technical University of Dortmund for their technical and administrative support. Further, we acknowledge financial support by Deutsche Forschungsgemeinschaft and Technische Universität Dortmund/TU Dortmund Technical University within the funding programme Open Access Publishing.
Conflicts of Interest
The authors declare no conflict of interest.
Appendix A

Table A1.
Description of Variables. This table provides definitions of our variables. Financial data come from Compustat/Capital IQ and ESG ratings come from Thomson Reuters Eikon.
Table A1.
Description of Variables. This table provides definitions of our variables. Financial data come from Compustat/Capital IQ and ESG ratings come from Thomson Reuters Eikon.
| Variable | Definition |
|---|---|
| Dependent variables: | |
| Raw returns | Cumulative daily logarithmic stock return calculated from daily closing prices. |
| Abnormal returns | Cumulative daily abnormal stock return which is the raw stock return minus the expected return based on a market model estimated over a one year period from 2019 until 2020. |
| Volatility | Stock volatility calculated from daily raw returns. |
| Idiosyncratic Volatility | Stock volatility calculated from daily abnormal returns. |
| Independent variables: | |
| ESG Score | ESG score of a firm. |
| High ESG | Dummy variable that equals one if the firm’s ESG score is larger than the median score within the respective country, and zero otherwise. |
| Control variables: | All continuous variables are winsorized at the 1st and 99th percentiles. |
| Tobin’s Q | Total assets minus the book value of equity plus market capitalization, divided by a firm’s total assets. |
| Size | The natural logarithm of total sales. |
| ROE | Net income over market capitalization. |
| Profitability | Operating income before depreciation over total assets of a firm. |
| Market-to-Book | Market capitalization divided by the book value of equity. |
| Negative Market-to-Book | A Dummy variable which is set to one if the Market-to-Book is negative, and zero otherwise. |
| Cash/Assets | Cash divided by total assets. |
| Short-term Debt/Assets | Short-term debt divided by total assets. |
| Long-term Debt/Assets | Long-term debt divided total assets. |
| Leverage | Book value of debt divided by total assets. |
| Historical Volatility | Stock volatility calculated from daily stock returns during 2019. |
| Momentum | Momentum factor calculated from the four-factor model provided by Carhart [60]. The momentum factor is estimated over a one year period from 2019 to 2020. |
| Low Rule of Law | A Dummy variable which is set one if a country’s rule of law index is equal or smaller than the median score within the respective country. The rule of law index is provided by the World Bank’s World Governance Indicators for 2019. |
| High Rule of Law | A Dummy variable which is set one if the country’s rule of law index is larger than median score within the respective country. The rule of law index is provided by the World Bank’s World Governance Indicators for 2019. |
| Low Disclosure | A Dummy variable which is set one if the country’s disclosure index is equal or below the median score within the respective country. We obtain the disclosure index from La Porta et al. [45]. |
| High Disclosure | A Dummy variable which is set one if the country’s disclosure index is equal or larger than the median score within the respective country. We obtain the disclosure index from La Porta et al. [45]. |
| Low ASDI | A Dummy variable which is set one if the country’s ASDI is equal or below the median score within the respective country. We obtain the anti-self-dealing index (ASDI) from Djankov et al. [46]. |
| High ASDI | A Dummy variable which is set one if the country’s ASDI is equal or larger than the median score within the respective country. We obtain the anti-self-dealing index (ASDI) from Djankov et al. [46]. |
| Low Trust | A Dummy variable which is set one if the country’s trust score is equal or smaller than the median score within the respective country. We obtain data on the level of societal trust from the World Values Survey’s (WVS) latest wave (i.e., wave 7, 2017-2020). |
| High Trust | A Dummy variable which is set one if the country’s trust score is larger than the median score within the respective country. We obtain data on the level of societal trust from the World Values Survey’s (WVS) latest wave (i.e., wave 7, 2017-2020). |
References
- Flammer, C. Does corporate social responsibility lead to superior financial performance? A regression discontinuity approach. Manag. Sci. 2015, 61, 2549–2568. [Google Scholar] [CrossRef] [Green Version]
- Ferrell, A.; Liang, H.; Renneboog, L. Socially responsible firms. J. Financ. Econ. 2016, 122, 585–606. [Google Scholar] [CrossRef] [Green Version]
- Gillan, S.L.; Koch, A.; Starks, L.T. Firms and social responsibility: A review of ESG and CSR research in corporate finance. J. Corp. Financ. 2021, 101889. [Google Scholar] [CrossRef]
- Bénabou, R.; Tirole, J. Individual and corporate social responsibility. Economica 2010, 77, 1–19. [Google Scholar] [CrossRef] [Green Version]
- Krüger, P. Corporate goodness and shareholder wealth. J. Financ. Econ. 2015, 115, 304–329. [Google Scholar] [CrossRef]
- McWilliams, A.; Siegel, D. Corporate social responsibility: A theory of the firm perspective. Acad. Manag. Rev. 2001, 26, 117–127. [Google Scholar] [CrossRef]
- Falck, O.; Heblich, S. Corporate social responsibility: Doing well by doing good. Bus. Horizons 2007, 50, 247–254. [Google Scholar] [CrossRef]
- Servaes, H.; Tamayo, A. The impact of corporate social responsibility on firm value: The role of customer awareness. Manag. Sci. 2013, 59, 1045–1061. [Google Scholar] [CrossRef] [Green Version]
- Albuquerque, R.; Koskinen, Y.; Yang, S.; Zhang, C. Resiliency of environmental and social stocks: An analysis of the exogenous COVID-19 market crash. Rev. Corp. Financ. Stud. 2020, 9, 593–621. [Google Scholar] [CrossRef]
- Lins, K.V.; Servaes, H.; Tamayo, A. Social capital, trust, and firm performance: The value of corporate social responsibility during the financial crisis. J. Financ. 2017, 72, 1785–1824. [Google Scholar] [CrossRef] [Green Version]
- Ding, W.; Levine, R.; Lin, C.; Xie, W. Corporate immunity to the COVID-19 pandemic. NBER Work. Pap. Ser. 2020. [Google Scholar] [CrossRef]
- Bae, K.H.; El Ghoul, S.; Gong, Z.J.; Guedhami, O. Does CSR matter in times of crisis? Evidence from the COVID-19 pandemic. J. Corp. Financ. 2021, 67, 101876. [Google Scholar] [CrossRef]
- Demers, E.; Hendrikse, J.; Joos, P.; Lev, B. ESG Didn’t Immunize Stocks Against the Covid-19 Market Crash. SSRN Electron. J. 2020. [Google Scholar] [CrossRef]
- Karolyi, G.A.; Kim, D.; Liao, R. The Theory and Practice of Investor Relations: A Global Perspective. Manag. Sci. 2020, 66, 1–26. [Google Scholar] [CrossRef]
- Neukirchen, D.; Engelhardt, N.; Krause, M.; Posch, P.N. The Value of Investor Relations during the COVID-19 Crisis. Work. Pap. 2021. [Google Scholar]
- Fahlenbrach, R.; Rageth, K.; Stulz, R.M. How valuable is financial flexibility when revenue stops? Evidence from the Covid-19 crisis. NBER Work. Pap. Ser. 2020. [Google Scholar] [CrossRef]
- Engelhardt, N.; Krause, M.; Neukirchen, D.; Posch, P.N. Trust and stock market volatility during the COVID-19 crisis. Financ. Res. Lett. 2020, 101873. [Google Scholar] [CrossRef]
- Bird, R.; Hall, A.D.; Momentè, F.; Reggiani, F. What corporate social responsibility activities are valued by the market? J. Bus. Ethics 2007, 76, 189–206. [Google Scholar] [CrossRef]
- Brammer, S.; Brooks, C.; Pavelin, S. Corporate social performance and stock returns: UK evidence from disaggregate measures. Financ. Manag. 2006, 35, 97–116. [Google Scholar] [CrossRef] [Green Version]
- Buchanan, B.; Cao, C.X.; Chen, C. Corporate social responsibility, firm value, and influential institutional ownership. J. Corp. Financ. 2018, 52, 73–95. [Google Scholar] [CrossRef]
- Deng, X.; Kang, J.k.; Low, B.S. Corporate social responsibility and stakeholder value maximization: Evidence from mergers. J. Financ. Econ. 2013, 110, 87–109. [Google Scholar] [CrossRef]
- Cao, J.; Liang, H.; Zhan, X. Peer effects of corporate social responsibility. Manag. Sci. 2019, 65, 5487–5503. [Google Scholar] [CrossRef]
- Cheng, B.; Ioannou, I.; Serafeim, G. Corporate social responsibility and access to finance. Strateg. Manag. J. 2014, 35, 1–23. [Google Scholar] [CrossRef]
- Di Giuli, A.; Kostovetsky, L. Are red or blue companies more likely to go green? Politics and corporate social responsibility. J. Financ. Econ. 2014, 111, 158–180. [Google Scholar] [CrossRef]
- Jo, H.; Harjoto, M.A. The causal effect of corporate governance on corporate social responsibility. J. Bus. Ethics 2012, 106, 53–72. [Google Scholar] [CrossRef]
- Gao, H.; Li, K.; Ma, Y. Stakeholder Orientation and the Cost of Debt: Evidence from State-Level Adoption of Constituency Statutes. J. Financ. Quant. Anal. 2020, 1–37. [Google Scholar] [CrossRef]
- Hillman, A.J.; Keim, G.D. Shareholder value, stakeholder management, and social issues: What’s the bottom line? Strateg. Manag. J. 2001, 22, 125–139. [Google Scholar] [CrossRef]
- Makni, R.; Francoeur, C.; Bellavance, F. Causality between corporate social performance and financial performance: Evidence from Canadian firms. J. Bus. Ethics 2009, 89, 409–422. [Google Scholar] [CrossRef]
- Masulis, R.W.; Reza, S.W. Agency problems of corporate philanthropy. Rev. Financ. Stud. 2015, 28, 592–636. [Google Scholar] [CrossRef] [Green Version]
- Friedman, M. The social responsibility of business is to increase its profits. In Corporate Ethics and Corporate Governance; Springer: Berlin/Heidelberg, Germany, 1970; pp. 173–178. [Google Scholar]
- Hu, Y.; Chen, S.; Shao, Y.; Gao, S. CSR and firm value: Evidence from China. Sustainability 2018, 10, 4597. [Google Scholar] [CrossRef] [Green Version]
- Brammer, S.; Millington, A. Does it pay to be different? An analysis of the relationship between corporate social and financial performance. Strateg. Manag. J. 2008, 29, 1325–1343. [Google Scholar] [CrossRef]
- Aupperle, K.E.; Carroll, A.B.; Hatfield, J.D. An empirical examination of the relationship between corporate social responsibility and profitability. Acad. Manag. J. 1985, 28, 446–463. [Google Scholar] [CrossRef]
- Busch, T.; Friede, G. The robustness of the corporate social and financial performance relation: A second-order meta-analysis. Corp. Soc. Responsib. Environ. Manag. 2018, 25, 583–608. [Google Scholar] [CrossRef] [Green Version]
- Orlitzky, M.; Schmidt, F.L.; Rynes, S.L. Corporate social and financial performance: A meta-analysis. Organ. Stud. 2003, 24, 403–441. [Google Scholar] [CrossRef]
- Dai, R.; Liang, H.; Ng, L. Socially responsible corporate customers. J. Financ. Econ. 2020. [Google Scholar] [CrossRef]
- El Ghoul, S.; Guedhami, O.; Kwok, C.C.; Mishra, D.R. Does corporate social responsibility affect the cost of capital? J. Bank. Financ. 2011, 35, 2388–2406. [Google Scholar] [CrossRef]
- Albuquerque, R.; Koskinen, Y.; Zhang, C. Corporate social responsibility and firm risk: Theory and empirical evidence. Manag. Sci. 2019, 65, 4451–4469. [Google Scholar] [CrossRef] [Green Version]
- Cornett, M.M.; Erhemjamts, O.; Tehranian, H. Greed or good deeds: An examination of the relation between corporate social responsibility and the financial performance of US commercial banks around the financial crisis. J. Bank. Financ. 2016, 70, 137–159. [Google Scholar] [CrossRef]
- Refinitiv. Definition of ESG, 2020. Available online: https://www.refinitiv.com/en/sustainable-finance/esg-scores (accessed on 9 March 2021).
- Fama, E.F.; Kenneth, R. French, 1992, The cross-section of expected stock returns. J. Financ. 1992, 47, 427–465. [Google Scholar] [CrossRef]
- Griffin, J.M.; Lemmon, M.L. Book-to-market equity, distress risk, and stock returns. J. Financ. 2002, 57, 2317–2336. [Google Scholar] [CrossRef]
- Lins, K.V.; Volpin, P.; Wagner, H.F. Does family control matter? International evidence from the 2008–2009 financial crisis. Rev. Financ. Stud. 2013, 26, 2583–2619. [Google Scholar] [CrossRef] [Green Version]
- Petersen, M.A. Estimating standard errors in finance panel data sets: Comparing approaches. Rev. Financ. Stud. 2009, 22, 435–480. [Google Scholar] [CrossRef] [Green Version]
- La Porta, R.; Lopez-de Silanes, F.; Shleifer, A. What Works in Securities Laws? J. Financ. 2006, 61, 1–32. [Google Scholar] [CrossRef] [Green Version]
- Djankov, S.; La Porta, R.; Lopez-de Silanes, F.; Shleifer, A. The law and economics of self-dealing. J. Financ. Econ. 2008, 88, 430–465. [Google Scholar] [CrossRef] [Green Version]
- Glossner, S.; Matos, P.; Ramelli, S.; Wagner, A.F. Where do institutional investors seek shelter when disaster strikes? Evidence from COVID-19. SSRN Electron. J. 2020. [Google Scholar] [CrossRef]
- Landier, A.; Thesmar, D. Earnings Expectations during the COVID-19 Crisis. Rev. Asset Pricing Stud. 2020, 10, 598–617. [Google Scholar] [CrossRef]
- Zhang, D.; Hu, M.; Ji, Q. Financial markets under the global pandemic of COVID-19. Financ. Res. Lett. 2020, 101528. [Google Scholar] [CrossRef]
- Ramelli, S.; Wagner, A.F. Feverish Stock Price Reactions to COVID-19. Rev. Corp. Financ. Stud. 2020, 9, 622–655. [Google Scholar] [CrossRef]
- Acharya, V.V.; Steffen, S. The Risk of Being a Fallen Angel and the Corporate Dash for Cash in the Midst of COVID. Rev. Corp. Financ. Stud. 2020, 9, 430–471. [Google Scholar] [CrossRef]
- Cheema-Fox, A.; LaPerla, B.R.; Serafeim, G.; Wang, H.S. Corporate Resilience and Response During COVID-19. SSRN Electron. J. 2020. [Google Scholar] [CrossRef]
- Cepoi, C.O. Asymmetric dependence between stock market returns and news during COVID19 financial turmoil. Financ. Res. Lett. 2020, 101658. [Google Scholar] [CrossRef]
- Engelhardt, N.; Krause, M.; Neukirchen, D.; Posch, P. What Drives Stocks during the Corona-Crash? News Attention vs. Rational Expectation. Sustainability 2020, 12, 5014. [Google Scholar] [CrossRef]
- Alfaro, L.; Chari, A.; Greenland, A.N.; Schott, P.K. Aggregate and firm-level stock returns during pandemics, in real time. NBER Work. Pap. Ser. 2020. [Google Scholar] [CrossRef]
- Hassan, T.A.; Hollander, S.; Van Lent, L.; Schwedeler, M.; Tahoun, A. Firm-level exposure to epidemic diseases: Covid-19, SARS, and H1N1. NBER Work. Pap. 2020. [Google Scholar] [CrossRef]
- Pagano, M.; Wagner, C.; Zechner, J. Disaster resilience and asset prices. SSRN Electron. J. 2020. [Google Scholar] [CrossRef]
- Ozik, G.; Sadka, R.; Shen, S. Flattening the illiquidity curve: Retail trading during the COVID-19 lockdown. SSRN Electron. J. 2020. [Google Scholar] [CrossRef]
- Pástor, L.; Vorsatz, M.B. Mutual fund performance and flows during the COVID-19 crisis. Rev. Asset Pricing Stud. 2020, 10, 791–833. [Google Scholar] [CrossRef]
- Carhart, M.M. On persistence in mutual fund performance. J. Financ. 1997, 52, 57–82. [Google Scholar] [CrossRef]
Figure 1.
Firms per Country. This figure shows the weights of the 16 different countries in which the firms are headquartered in.
Figure 1.
Firms per Country. This figure shows the weights of the 16 different countries in which the firms are headquartered in.

Table 1.
Descriptive Statistics. This table presents summary statistics for the variables used in this paper. Our sample consists of 1452 firms from 16 different European countries. The construction of our variables is provided in Table A1.
Table 1.
Descriptive Statistics. This table presents summary statistics for the variables used in this paper. Our sample consists of 1452 firms from 16 different European countries. The construction of our variables is provided in Table A1.
| Obs. | Minimum | Maximum | Mean | Median | Std. | |
|---|---|---|---|---|---|---|
| Cumulative Raw Returns | 1452 | −1.8442 | 0.3906 | −0.4572 | −0.4322 | 0.2808 |
| Cumulative Abnormal Returns | 1452 | −1.6992 | 0.9349 | −0.1681 | −0.1448 | 0.2960 |
| Volatility | 1452 | 0.0010 | 0.2092 | 0.0454 | 0.0415 | 0.0185 |
| Idiosyncratic Volatility | 1452 | 0.0020 | 0.2123 | 0.0361 | 0.0322 | 0.0183 |
| ESG Score | 1452 | 0.0152 | 0.9449 | 0.5329 | 0.5449 | 0.2048 |
| Size | 1143 | 1.4734 | 11.9168 | 7.7315 | 7.7096 | 1.8530 |
| ROE | 1427 | −0.5024 | 0.4126 | 0.0393 | 0.0453 | 0.1005 |
| Profitability | 1450 | −0.3257 | 0.3784 | 0.0995 | 0.0985 | 0.0904 |
| Cash / Assets | 1143 | 0.0046 | 0.8140 | 0.1261 | 0.0917 | 0.1314 |
| Short-term Debt / Assets | 1406 | 0 | 0.2811 | 0.0531 | 0.0367 | 0.0563 |
| Long-term Debt / Assets | 1438 | 0 | 0.6723 | 0.2129 | 0.1932 | 0.1549 |
| Leverage | 1404 | 0 | 0.7231 | 0.2672 | 0.2598 | 0.1712 |
| Market-to-Book | 1427 | −2.9155 | 32.1355 | 3.4840 | 1.9650 | 4.8151 |
| Historical Volatility | 1452 | 0.1162 | 1.0665 | 0.3037 | 0.2717 | 0.1438 |
| Momentum | 1452 | −1.0887 | 1.0300 | 0.1572 | 0.1844 | 0.3168 |
Table 2.
Correlation Analysis. This table presents the correlation coefficients for the variables used in this paper. * denotes statistical significance at the level. The construction of our variables is provided in Table A1.
Table 2.
Correlation Analysis. This table presents the correlation coefficients for the variables used in this paper. * denotes statistical significance at the level. The construction of our variables is provided in Table A1.
| (1) | (2) | (3) | (4) | (5) | (6) | (7) | (8) | (9) | (10) | (11) | (12) | (13) | (14) | (15) | (16) | |
|---|---|---|---|---|---|---|---|---|---|---|---|---|---|---|---|---|
| (1) Cumulative Raw Returns | 1.00 * | |||||||||||||||
| (2) Cumulative Abnormal Returns | 0.05 * | 1.00 * | ||||||||||||||
| (3) Volatility | −0.65 * | −0.05 * | 1.00 * | |||||||||||||
| (4) Idiosyncratic Volatility | −0.58 * | −0.07 * | 0.95 * | 1.00 * | ||||||||||||
| (5) High ESG | −0.03 * | 0.04 * | −0.06 * | −0.15 * | 1.00 * | |||||||||||
| (6) ESG Score | 0.01 * | 0.04 * | −0.12 * | −0.23 * | 0.83 * | 1.00 * | ||||||||||
| (7) Size | −0.02 * | 0.05 * | −0.17 * | −0.27 * | 0.53 * | 0.63 * | 1.00 * | |||||||||
| (8) ROE | 0.16 * | 0.01 * | −0.14 * | −0.17 * | 0.09 * | 0.13 * | 0.19 * | 1.00 * | ||||||||
| (9) Profitability | 0.02 * | −0.04 * | −0.12 * | −0.12 * | 0.06 * | 0.09 * | 0.19 * | 0.35 * | 1.00 * | |||||||
| (10) Cash / Assets | 0.07 * | 0.01 * | 0.06 * | 0.07 * | −0.12 * | −0.17 * | −0.34 * | −0.11 * | −0.24 * | 1.00 * | ||||||
| (11) Short-term Debt / Assets | −0.09 * | 0.05 * | 0.03 * | 0.00 | 0.10 * | 0.10 * | 0.21 * | −0.01 * | −0.03 * | −0.17 * | 1.00 * | |||||
| (12) Long-term Debt / Assets | −0.10 * | 0.02 * | 0.12 * | 0.08 * | 0.10 * | 0.15 * | 0.15 * | −0.05 * | 0.02 * | −0.27 * | 0.09 * | 1.00 * | ||||
| (13) Market-to-Book | 0.15 * | −0.01 * | −0.13 * | −0.11 * | −0.15 * | −0.13 * | −0.16 * | −0.02 * | 0.24 * | 0.20 * | −0.04 * | −0.03 * | 1.00 * | |||
| (14) Negative Market-to-Book | −0.08 * | −0.01 * | 0.10 * | 0.12 * | 0.05 * | 0.04 * | −0.04 * | −0.08 * | 0.04 * | −0.02 * | 0.05 * | 0.23 * | −0.22 * | 1.00 * | ||
| (15) Historical Volatility | −0.17 * | −0.03 * | 0.33 * | 0.37 * | −0.21 * | −0.28 * | −0.39 * | −0.36 * | −0.28 * | 0.25 * | 0.02 * | −0.10 * | −0.02 * | 0.09 * | 1.00 * | |
| (16) Momentum | 0.13 * | 0.00 | −0.12 * | −0.14 * | 0.01 * | 0.00 | 0.01 * | 0.19 * | 0.14 * | 0.10 * | −0.16 * | −0.03 * | 0.24 * | −0.05 * | −0.38 * | 1.00 * |
Table 3.
Univariate Tests. This table reports the results from univariate statistics. A firm is classified as a High ESG firm if the firm’s ESG score is above the median score within the respective country. We perform a t-test to check whether the difference in means between High ESG and Low ESG firms is significantly different from zero, where ***, **, * denotes statistical significance at the , , and level.
| High ESG | Low ESG | ||||
|---|---|---|---|---|---|
| Observations | Mean | Observations | Mean | Difference | |
| Tobin’s Q | 734 | 1.7961 | 693 | 2.2803 | −0.4842 *** |
| Size | 596 | 8.5689 | 547 | 6.8190 | 1.7499 *** |
| ROE | 734 | 0.0428 | 693 | 0.0357 | 0.0071 |
| Profitability | 744 | 0.1022 | 706 | 0.0968 | 0.0054 |
| Cash/Assets | 596 | 0.1094 | 547 | 0.1443 | −0.0349 *** |
| Short-term Debt/Assets | 731 | 0.0543 | 675 | 0.0518 | 0.0025 |
| Long-term Debt/Assets | 745 | 0.2207 | 693 | 0.2046 | 0.0161 * |
| Leverage | 731 | 0.2773 | 673 | 0.2562 | 0.0211 ** |
| Market-to-Book | 734 | 2.9714 | 693 | 4.0270 | −1.0556 *** |
| Historical Volatility | 745 | 0.2830 | 707 | 0.3255 | −0.0425 *** |
| Momentum | 745 | 0.1604 | 707 | 0.1539 | 0.0064 |
Table 4.
ESG Ratings and Stock Returns. This table reports the results from OLS regressions. In columns (1) and (3) ((2) and (4)), the dependent variable is the cumulative (abnormal) stock return of a firm from 3 February 2020 to 23 March 2020. In Panel A, the main independent variable of interest is a firm’s ESG Score. In Panel B, the main independent variable of interest is the dummy variable High ESG. We present robust standard errors clustered by country in parentheses, where ***, **, * denotes statistical significance at the , , and level.
| Panel A | (1) | (2) | (3) | (4) |
|---|---|---|---|---|
| Dependent Variable: | Raw Returns | Abnormal Returns | Raw Returns | Abnormal Returns |
| ESG Score | −0.0450 | 0.1772 *** | −0.0278 | 0.1267 ** |
| (0.0344) | (0.0568) | (0.0514) | (0.0603) | |
| Size | −0.0029 | 0.0221 *** | ||
| (0.0065) | (0.0039) | |||
| ROE | 0.2416 ** | 0.2894 *** | ||
| (0.1161) | (0.1101) | |||
| Profitability | 0.0358 | 0.0315 | ||
| (0.0871) | (0.0790) | |||
| Cash/Assets | 0.0068 | 0.1204 * | ||
| (0.0591) | (0.0665) | |||
| Short-term Debt/Assets | −0.3891 ** | −0.3569 ** | ||
| (0.1694) | (0.1650) | |||
| Long-term Debt/Assets | −0.2570 *** | −0.2265 *** | ||
| (0.0427) | (0.0481) | |||
| Market-to-Book | 0.0063 *** | 0.0055 *** | ||
| (0.0016) | (0.0020) | |||
| Negative Market-to-Book | 0.0676 | 0.0278 | ||
| (0.0462) | (0.0467) | |||
| Historical Volatility | −0.1850 * | 0.2231 *** | ||
| (0.1025) | (0.0839) | |||
| Momentum | 0.0182 | 0.0909 *** | ||
| (0.0243) | (0.0345) | |||
| Observations | 1452 | 1452 | 1122 | 1122 |
| Industry/Country FE | yes | yes | yes | yes |
| Adjusted R-Squared | 0.01 | 0.02 | 0.07 | 0.08 |
| Panel B | (1) | (2) | (3) | (4) |
| Dependent Variable: | Raw Returns | Abnormal Returns | Raw Returns | Abnormal Returns |
| High ESG | −0.0188 | 0.0678 *** | −0.0135 | 0.0383 ** |
| (0.0147) | (0.0201) | (0.0190) | (0.0186) | |
| Observations | 1452 | 1452 | 1122 | 1122 |
| Industry/Country FE | yes | yes | yes | yes |
| Firm controls | no | no | yes | yes |
| Adjusted R-Squared | 0.01 | 0.02 | 0.07 | 0.08 |
Table 5.
ESG Ratings and Stock Volatility. This table reports the results from OLS regressions. In columns (1) and (3) ((2) and (4)), the dependent variable is the (idiosyncratic) stock volatility of a firm from 3 February 2020 to 23 March 2020. The main independent variable of interest is a firm’s ESG Score. We present robust standard errors clustered by country in parentheses, where ***, **, * denotes statistical significance at the , , and level.
| Dependent Variable: | (1) | (2) | (3) | (4) |
|---|---|---|---|---|
| Volatility | Idiosyncratic Volatility | Volatility | Idiosyncratic Volatility | |
| ESG Score | −0.0061 | −0.0166 *** | −0.0016 | −0.0085 * |
| (0.0044) | (0.0044) | (0.0042) | (0.0044) | |
| Size | −0.0001 | −0.0008 ** | ||
| (0.0003) | (0.0004) | |||
| ROE | −0.0032 | −0.0049 | ||
| (0.0072) | (0.0084) | |||
| Profitability | −0.0200 *** | −0.0144 *** | ||
| (0.0069) | (0.0052) | |||
| Cash/Assets | 0.0052 | 0.0024 | ||
| (0.0046) | (0.0040) | |||
| Short-term Debt/Assets | 0.0160 ** | 0.0156 *** | ||
| (0.0064) | (0.0056) | |||
| Long-term Debt/Assets | 0.0198 *** | 0.0159 *** | ||
| (0.0053) | (0.0052) | |||
| Market-to-Book | −0.0002 | −0.0002 | ||
| (0.0002) | (0.0002) | |||
| Negative Market-to-Book | 0.0032 | 0.0049 * | ||
| (0.0032) | (0.0029) | |||
| Historical Volatility | 0.0393 *** | 0.0349 *** | ||
| (0.0060) | (0.0051) | |||
| Momentum | 0.0032 * | 0.0003 | ||
| (0.0017) | (0.0018) | |||
| Observations | 1452 | 1452 | 1122 | 1122 |
| Industry/Country FE | yes | yes | yes | yes |
| Adjusted R-Squared | 0.01 | 0.04 | 0.15 | 0.18 |
Table 6.
ESG Ratings and Country Characteristics. This table reports the results from OLS regressions. Across all columns, the dependent variable is the cumulative abnormal stock return of a firm from 3 February 2020 to 23 March 2020 and the main independent variable of interest is High ESG. We present robust standard errors clustered by country in parentheses, where ***, **, * denotes statistical significance at the , , and level.
| Dependent Variable: | Trust | Rule of Law | Disclosure | ASDI | ||||
|---|---|---|---|---|---|---|---|---|
| Abnormal Returns | (1) | (2) | (3) | (4) | (5) | (6) | (7) | (8) |
| Low | High | Low | High | Low | High | Low | High | |
| High ESG | 0.0553 *** | 0.0304 | 0.0336 ** | 0.0536 | 0.0504 ** | 0.0234 | 0.0299 | 0.0503 ** |
| (0.0182) | (0.0397) | (0.0158) | (0.0404) | (0.0245) | (0.0390) | (0.0303) | (0.0209) | |
| Size | 0.0223 *** | 0.0247 ** | 0.0243 *** | 0.0222 ** | 0.0169 *** | 0.0326 *** | 0.0267 *** | 0.0219 *** |
| (0.0052) | (0.0097) | (0.0044) | (0.0086) | (0.0035) | (0.0067) | (0.0070) | (0.0041) | |
| ROE | 0.2653 ** | 0.5160 | 0.2709 *** | 0.3974 | 0.2103 ** | 0.3293 *** | 0.2763 * | 0.2363 ** |
| (0.1121) | (0.3459) | (0.0976) | (0.3156) | (0.0892) | (0.1097) | (0.1474) | (0.0971) | |
| Profitability | −0.1402 ** | 0.1358 ** | −0.0959 | 0.1658 ** | −0.0873 | 0.0506 | 0.0792 | 0.0577 |
| (0.0658) | (0.0619) | (0.0617) | (0.0660) | (0.1546) | (0.1707) | (0.1433) | (0.0843) | |
| Cash/Assets | 0.0109 | 0.2280 *** | −0.0291 | 0.2435 *** | 0.0732 | 0.0972 | 0.1898 ** | 0.0249 |
| (0.0875) | (0.0837) | (0.0653) | (0.0812) | (0.0836) | (0.1343) | (0.0966) | (0.0708) | |
| Short-term Debt/Assets | −0.3329 | −0.5690 *** | −0.2563 | −0.5076 *** | −0.1749 | −0.6304 ** | −0.2333 | −0.4956 * |
| (0.3429) | (0.1342) | (0.3201) | (0.1426) | (0.1831) | (0.2777) | (0.1813) | (0.2650) | |
| Long-term Debt/Assets | −0.1695 *** | −0.2811 ** | −0.1707 *** | −0.3038 *** | −0.3526 *** | −0.1270 * | −0.1925 ** | −0.2725 *** |
| (0.0467) | (0.1238) | (0.0451) | (0.1119) | (0.0597) | (0.0724) | (0.0973) | (0.0557) | |
| Market-to-Book | 0.0108 ** | 0.0036 ** | 0.0108 ** | 0.0031 ** | 0.0034 *** | 0.0100 * | 0.0035 ** | 0.0054 * |
| (0.0051) | (0.0015) | (0.0048) | (0.0013) | (0.0013) | (0.0053) | (0.0018) | (0.0029) | |
| Negative Market-to-Book | −0.0166 | 0.2001 ** | −0.0050 | 0.1974 ** | 0.1651 ** | 0.0108 | 0.0593 | −0.0269 ** |
| (0.0276) | (0.1010) | (0.0238) | (0.0938) | (0.0768) | (0.0289) | (0.1028) | (0.0118) | |
| Historical Volatility | 0.1770 | 0.2019 | 0.2197 * | 0.1766 | 0.2621 * | 0.1398 | 0.2409 ** | 0.1910 |
| (0.1117) | (0.1431) | (0.1201) | (0.1194) | (0.1399) | (0.1013) | (0.1227) | (0.1244) | |
| Momentum | 0.0248 | 0.1403 ** | 0.0425 | 0.1319 ** | 0.1028 * | 0.0631 | 0.1069 ** | 0.0784 |
| (0.0304) | (0.0601) | (0.0302) | (0.0525) | (0.0567) | (0.0558) | (0.0450) | (0.0600) | |
| Observations | 674 | 373 | 710 | 412 | 542 | 566 | 626 | 496 |
| Industry/Country FE | yes | yes | yes | yes | yes | yes | yes | yes |
| Adjusted R-Squared | 0.04 | 0.17 | 0.04 | 0.15 | 0.09 | 0.07 | 0.07 | 0.06 |
Publisher’s Note: MDPI stays neutral with regard to jurisdictional claims in published maps and institutional affiliations. |
© 2021 by the authors. Licensee MDPI, Basel, Switzerland. This article is an open access article distributed under the terms and conditions of the Creative Commons Attribution (CC BY) license (https://creativecommons.org/licenses/by/4.0/).
Share and Cite
MDPI and ACS Style
Engelhardt, N.; Ekkenga, J.; Posch, P. ESG Ratings and Stock Performance during the COVID-19 Crisis. Sustainability 2021, 13, 7133. https://doi.org/10.3390/su13137133
AMA Style
Engelhardt N, Ekkenga J, Posch P. ESG Ratings and Stock Performance during the COVID-19 Crisis. Sustainability. 2021; 13(13):7133. https://doi.org/10.3390/su13137133
Chicago/Turabian StyleEngelhardt, Nils, Jens Ekkenga, and Peter Posch. 2021. "ESG Ratings and Stock Performance during the COVID-19 Crisis" Sustainability 13, no. 13: 7133. https://doi.org/10.3390/su13137133
Note that from the first issue of 2016, this journal uses article numbers instead of page numbers. See further details here.