
Integrated Strategies for Household Food Waste Reduction in Bangkok


1
Department of Civil Engineering, Faculty of Engineering, Chulalongkorn University, 254 Phayathai Road, Phathum Wan, Bangkok 10330, Thailand
2
Sustainable Consumption and Production Area, Institute for Global Environmental Strategies, 2108-11 Kamiyamaguchi, Hayama, Kanagawa 240-0115, Japan
*
Authors to whom correspondence should be addressed.
Sustainability 2021, 13(14), 7651; https://doi.org/10.3390/su13147651
Submission received: 22 May 2021
/
Revised: 30 June 2021
/
Accepted: 6 July 2021
/
Published: 8 July 2021
(This article belongs to the Special Issue Sustainability in Agribusiness Food Chains)
Abstract
:Urban food waste issues in developing economies have recently attracted the attention of policymakers, practitioners, and academics in the course of implementing the Paris Agreement and the SDGs. In our case study city of Bangkok, Thailand, household food waste generation doubled from 2003 to 2018, with a similar increase in per capita amounts. Using an extensive literature review, statistical models, and a questionnaire survey, the authors clarified factors influencing food waste generation and separation before disposal, and reuse/recycling activity in urban households. Results showed that pre-purchase checks can not only prevent food waste but can also increase the reuse/recycling of food waste. Citizens with higher levels of education and those showing more concern about social issues and global warming are more likely to separate food waste before disposal and to participate in reuse/recycling activities. Finally, this paper proposes a seven-stage action-based model of integrated strategies for improving household food and food waste management to prevent/reduce food waste generation as well as remedy existing policy gaps in Bangkok.
1. Introduction
Food waste (FW) is one of the world’s major crises in both developed and developing countries. Up to 1.3 billion tons of food across the globe is thrown away each year, accounting for one third of all food produced for human consumption and presenting tremendous social, economic, and environmental challenges. [1]. While the United States generates a total of 34 million tons of FW per year, the amount generated across the European Union (EU) comes to a staggering 89 million tons, equivalent to 180 kg per capita each year. This figure was expected to jump to 126 million tons in 2020 [2].
Meanwhile, a study from the Institute of Mechanical Engineers says that 30–50% of all food produced globally is lost or wasted before being consumed [3]. At the same time, 870 million people across the world are experiencing starvation, meaning that 1 in 8 people on Earth are subsisting in famine conditions [4]. Food shortages are expected to worsen, as the world’s population is predicted to reach 9 billion in 2050. The food that we throw away could be used to feed millions of people across the world [3]. Moreover, food waste generation also has deleterious effects on the environment due to CO2 emissions. Not only does FW lead to a waste of resources throughout the farming process, such as land, water, and energy, it also contributes to lost economic value [1].
In Thailand, FW causes a significant problem when it comes to waste management, particularly in metropolitan areas. Studies conducted between 2005 and 2009 indicated that FW made up the greatest proportion of all waste collected in Bangkok at between 42% and 45% [5]. This waste was generated in households and was usually thrown away into garbage bins, to be collected and buried in landfills by governmental and private sector companies. One way to minimize the amount of waste for disposal is to reduce FW at the source and this could be done by turning it into compost, bio-extracts, and biogases. However, such methods are not popular as they are incompatible with living patterns in urban areas.
Systems of food production and consumption have become dynamically adapted to urban settings [6]. Factors such as increased income [7], dietary transition towards Westernized consumption patterns [8], modern retail diffusion [9], and time scarcity [10] impact the generation of FW in rapidly urbanizing localities.
Up to now, there has been no serious movement campaigning for household food waste reduction in Thailand. Waste separation is the only practice promoted by society, which has led to the apparent decrease in the amount of recyclable waste at MSW collection sites through a well-organized waste collection process. By contrast, the amount of FW has continued to increase due to lack of knowledge and proper understanding on household food management, so actions such as not eating whole portions, throwing away leftovers, or leaving food to rot become commonplace in households. However, if information is made available on how food loss and food waste is generated in households, the public gain more awareness and can then change their behavior [11]. These trends can be observed in other countries such as China [12,13], Pakistan [14], and Saudi Arabia [15].
It is important to distinguish between food loss and food waste and the circumstances of their occurrence, especially when identifying causes and developing solutions and interventions to address this issue [16]. According to the definition of FAO,
Food loss is mainly caused by the malfunctioning of the food production and supply system or its institutional and policy framework. This could be due to managerial and technical limitations, such as a lack of proper storage facilities, cold chain, proper food handling practices, infrastructure, packaging, or efficient marketing systems.
Food waste refers to the removal from the food supply chain of food which is still fit for human consumption. This is done either by choice or after the food is spoiled or expired due to poor stock management or neglect.
Food waste typically but not exclusively happens at the retail and consumer levels whereas food loss takes place at the earlier stages of the food supply chain—during production, post-harvest, and processing stages.
This paper introduces a paradigm for integrated household FW generation and reduction, as well as step-by-step methods of prevention. The methodology involves literature reviews and analytical methods. The study aims to (1) illustrate fundamental knowledge of food management and approaches for appropriate household FW reduction; (2) inspire public interest in learning how to eliminate food loss before it is wasted; and (3) create guidelines for food waste-related organizations to follow in order to cut FW generation in households, reduce expenditure for waste management, and halt environmental problems.
Several regression techniques and econometric models were used to investigate the relationship between factors influencing food management. In this study, we focus on the behavioral aspects of households, aim to identify the factors influencing household FW generation, and look at how the challenges of FW separation and reduction can be addressed within the context of a self-manageable framework within a household. The proposed scheme is based on food management along with daily food consumption activities and targets low-budget household FW prevention. Householders can integrate the methods into their daily lives in order to achieve the goals. For more elaborated FW policies, strategies, and plans for tackling FW issues at the regional/national level, please refer to [11] for further policy recommendations and potential intervention actions.
2. Literature Review
2.1. Food Waste (FW) Generation in Bangkok
Based on the data collected by our research team, it was found that the food supply chain is geographically separated—food production and most food manufacturing and wholesale centers are based outside of Bangkok, while consumption is carried out inside the city. Not much FW is generated during the production, processing, storage, and transportation stages. It was also found that data on municipal solid waste (MSW) include FW generated by retailers, street vendors, restaurants, and households. Subsequently, the official data on MSW and on the FW component of MSW collected between 2003 and 2018 were used to clarify the time-series changes in FW generation in Bangkok. However, owing to the lack of a systematic FW management system and data collection scheme, it is difficult to subdivide the material flow of FW in Bangkok accurately.
MSW refers to solid waste generated by municipal activities (including that by residences, supermarkets, retail shops, businesses, service providers, marketplaces, and institutions), which is collected and treated by the Bangkok Metropolitan Administration (BMA). Data on MSW and its composition are collected by officially published reports such as the Bangkok State of the Environment [17,18,19,20] and the State of Municipal Solid Waste of Thailand [21,22,23]. The total amount of MSW generation and the percentage of FW in MSW are shown in Figure 1, while FW generation and FW generation per capita are shown in Figure 2. Both the total amount of MSW generation and the percentage of FW in MSW increased between 2003 and 2018. Overall, FW generation doubled from 2860 tons per day in 2003 to 5669 tons per day in 2018. Per capita, it increased by 80% from 0.36 kg per day in 2003 to 0.65 kg per day in 2013 but then decreased to 0.45 kg per day in 2014 owing to the large population inflow (the population was estimated to be 6.82 million in 2013 and 9.06 million in 2014). FW then began to increase again from 2015 and reached 0.61 kg per day per person in 2018. Even supposing the 15 million daytime population was the total population, the per capita FW generation remains at 0.38 kg/day. In addition, the municipality of Bangkok collected an average of 10,705 tons of MSW a day, of which 59% was organic waste. Of the total MSW generated in 2018, 78.3% (8382 tons/day) was landfilled, 16.8% (1798 tons/day) was treated by composting plants, and 4.9% (525 tons/day) was incinerated based on a report by a sanitation technical officer at the BMA’s Department of Environment [11]. The amount of FW generated compared with other large cities (Hanoi, Surabaya, and Phnom Penh) in Southeast Asian developing countries and developed countries can found in [11].
The Department of Environment (DOE), under the BMA, and the Environment and Sanitation Section of each district office are authorities responsible for overall environmental management. Currently, the BMA possesses 2031 waste collection trucks in total. These can be classified into five types including 2-ton compacting truck, 5-ton compacting truck, 8-cubic meter lifting truck, 6-ton dumping truck, and 1.5-ton side loading truck. There are 2587 collection drivers, 7591 collection staff, and 9042 street sweepers [24,25]. The DOE then allocates these resources to districts for waste collection and transportation. The MSW collection and transportation process starts after residents put generated waste, either sorted or unsorted, in a container in front of their households or at designated locations. Then, waste collection staff collect disposed waste as scheduled. All the MSW is then transported to three MSW transfer stations—Saimai, Onnut, and Nongkhaem—based on distance of transportation [26,27]. The current fee for waste collection services (THB 80 or less than USD 3 per month) does not provide an incentive to reduce and separate waste, so there is room to consider a system that can properly collect fees based on volume such as using special garbage bags [28].
2.2. Causes of Food Waste Generation
In households, FW mismanagement and lack of proper planning are the main reasons for food loss. This loss generally means the decrease in edible food products throughout the supply chain, from manufacturing and transportation to human consumption. Most of the food loss occurs at the end of the supply chain (retail and consumption). FW also includes edible leftovers that are thrown away to feed animals. It therefore excludes inedible or undesirable portions of foodstuffs [29,30,31,32]. The causes of household food waste generation are summarized in Table 1. A recent survey on household lifestyles in Bangkok reveals the similar ways in which consumers generate FW [11]. For example, sources of FW generation in Bangkok by consumers are distributed widely in the supply chain owing to diverse eating habits; most consumers often or sometimes waste food for various reasons when eating in, consuming ready-to-eat meals, and eating out; time scarcity prevents people paying attention to food and FW, particularly on weekdays.
2.3. Impacts of Food Waste Generation
The daily increase in the amount of food waste in Thailand has a negative impact on food security for the poor, as well as adversely affecting economic development and environmental issues [1,3,55]. However, a contrasting argument states that reducing food waste will not solve widespread hunger. Famine is often the outcome of inadequate food production in terms of quantity and nutrition. Financial constraints also prevent food purchasing. As a result, FW reduction measures in rich countries where food is wasted do little to tackle these problems. Nevertheless, food waste generation has various adverse impacts as described in Table 2.
2.4. Food Waste Elimination Strategy
Despite suggestions to encourage FW reduction at the source, quite a lot of household food waste ends up in curb-side collections of trash. These are managed either by the government or the private sector which transports the waste to landfills.
There are several ways to reduce food waste. The first is composting, which is a highly effective way of improving the quality of soil for agriculture [5]. Another way is to use waste to produce biogas, which is a renewable energy source. This is the product of the breakdown of food waste and other organic waste, such as leaves and animal dung, by means of fermentation in biogas containers in the absence of oxygen, turning organic waste into useful gases. Biogas includes household cooking gas and is also used to generate electricity. A third method is using waste to produce bio-extract, a liquid that stems from the fermentation of microorganisms, such as leftovers, vegetables, fruits, herbs, and sweeteners like sugar and honey. Organic matter decomposes with the help of microorganisms. The end product of the whole process is a brown concentrated solution consisting of many different microorganisms and organic materials. This liquid can be used to reduce and replace household chemicals, such as dishwashing liquid, detergent, shampoo, and it can also benefit agricultural practices, such as crop growth and livestock [62].
Despite the obvious advantages, these methods do not catch on in metropolitan regions as they are not compatible with urban lifestyles, which do not depend on traditional agriculture. Furthermore, there is a stronger market for chemicals than compost and other organic materials. The supply of organic matter production is relatively low as a result [5]. The procedures used to produce organic material are also complicated, time-consuming, and take up a great deal of space. Such difficulties hamper urban populations from taking advantage of their food waste through composting, biogas, and bio-extract. Therefore, it is inevitable that household food is wasted.
Food waste makes up a large part of other solid waste collected either by governments or the private sector. Waste disposal by open dumping is the easiest and cheapest process whereby all food collected in communities is accumulated and left to decompose naturally. Waste gradually builds up until it turns into a health hazard with offensive odor and vermin including rats, cockroaches, and flies. Decomposing food waste also generates leachate that often pollutes groundwater and other natural water sources nearby, and this poor-quality water has a negative effect on people’s lives. Open dumping is therefore not a healthy way to dispose of food waste and must be avoided. Unfortunately, it is still a common sight in numerous regions across Thailand. There have been attempts to put other less polluting methods into practice by applying appropriate engineering processes such as sanitary landfill, whereby waste is dispersed evenly and then covered with layers of soil. Each layer needs to be compacted repeatedly and covered permanently by soil and plants as they help prevent water runoff. In some cases, a protective base is put in place to block leachate that could leak from the landfill. However, this practice is still not common in local communities [60].
Another practical method is incineration. All solid waste undergoes complete combustion in high-temperature incinerators. The features of incinerators can vary depending on the waste components. Flammable and dry materials are suitable for low-temperature incinerators, while high-temperature incineration must be used for liquid-saturated waste, which is harder to burn down. The latter also pushes up the cost of incineration as it requires substantial energy consumption [60,63,64].
Recently, hydrothermal carbonization (HTC) was proven to be an effective tool for converting waste biomass into a solid high energy dense material (hydrochar) and a liquid residue where the most volatile and oxygenated compounds (mainly furans and organic acids) concentrate during reaction [65]. The most common waste biomass materials include those produced by agro-industries and municipalities (organic fraction of municipal solid waste, food waste, and sewage sludge), as well as from forestry and paper mill industries. HTC can also be conducted with per-sulfate at lower temperatures for hydrochar biofuel production [66,67,68].
2.5. Related Policies, Strategies, and Plans on FW Reduction
Based on a review of official documents on waste management, food loss, FW, and the ‘3Rs’ (i.e., reduce, reuse, recycle), the overall structure of waste management policy, along with related food loss and FW policies, is summarized in Figure 3. Although Thailand has no specific institutions to administer FW policies, the Ministry of Natural Resources and Environment (MONRE) is tasked with developing strategies, action plans, and technical guidance on waste management and the 3Rs; the Ministry of Interior administers MSW management; the Ministry of Industry addresses industrial sources of FW; and the Ministry of Agriculture and Cooperatives is responsible for food loss issues in the planting, harvesting, transportation, and processing phases.
From the perspective of proper management of solid waste, the National Roadmap for Solid Waste and Hazardous Waste Management and the National Master Plan on Waste Management seek participation by provincial governors, local authorities, and the private sector in (1) reducing waste and separating waste at its source; (2) enhancing the efficiency in managing MSW; and (3) using promoting mixed technologies in disposal, including transforming waste to energy [69].
The BMA adopted a Solid Waste Management Plan (2015–2019), pursuant to the National Roadmap for Solid Waste and Hazardous Waste Management and the National Master Plan on Waste Management (2016–2021). This five-year plan envisioned a 7% reduction in household waste by 2019. The current 20-year plan seeks to promote a 20% reduction in waste and a 20% increase in separation at the source from 2013 to 2032, increase waste recycling or treatment to 50%, and reduce waste disposal through landfills by 50%. The BMA has also enacted a ‘Green Metropolis’ policy to make its waste management system more environmentally friendly, particularly through the use of clean technology [70].
3. Data Collection: Survey of Daily Lifestyles and FW Generation
Taking into consideration the concerns and issues raised in how food waste is managed in the metropolitan area, we conducted a data collection activity in Bangkok using a questionnaire survey in December 2017 to investigate the daily lifestyles and FW generation behavior of local residents living in the city center of Bangkok.
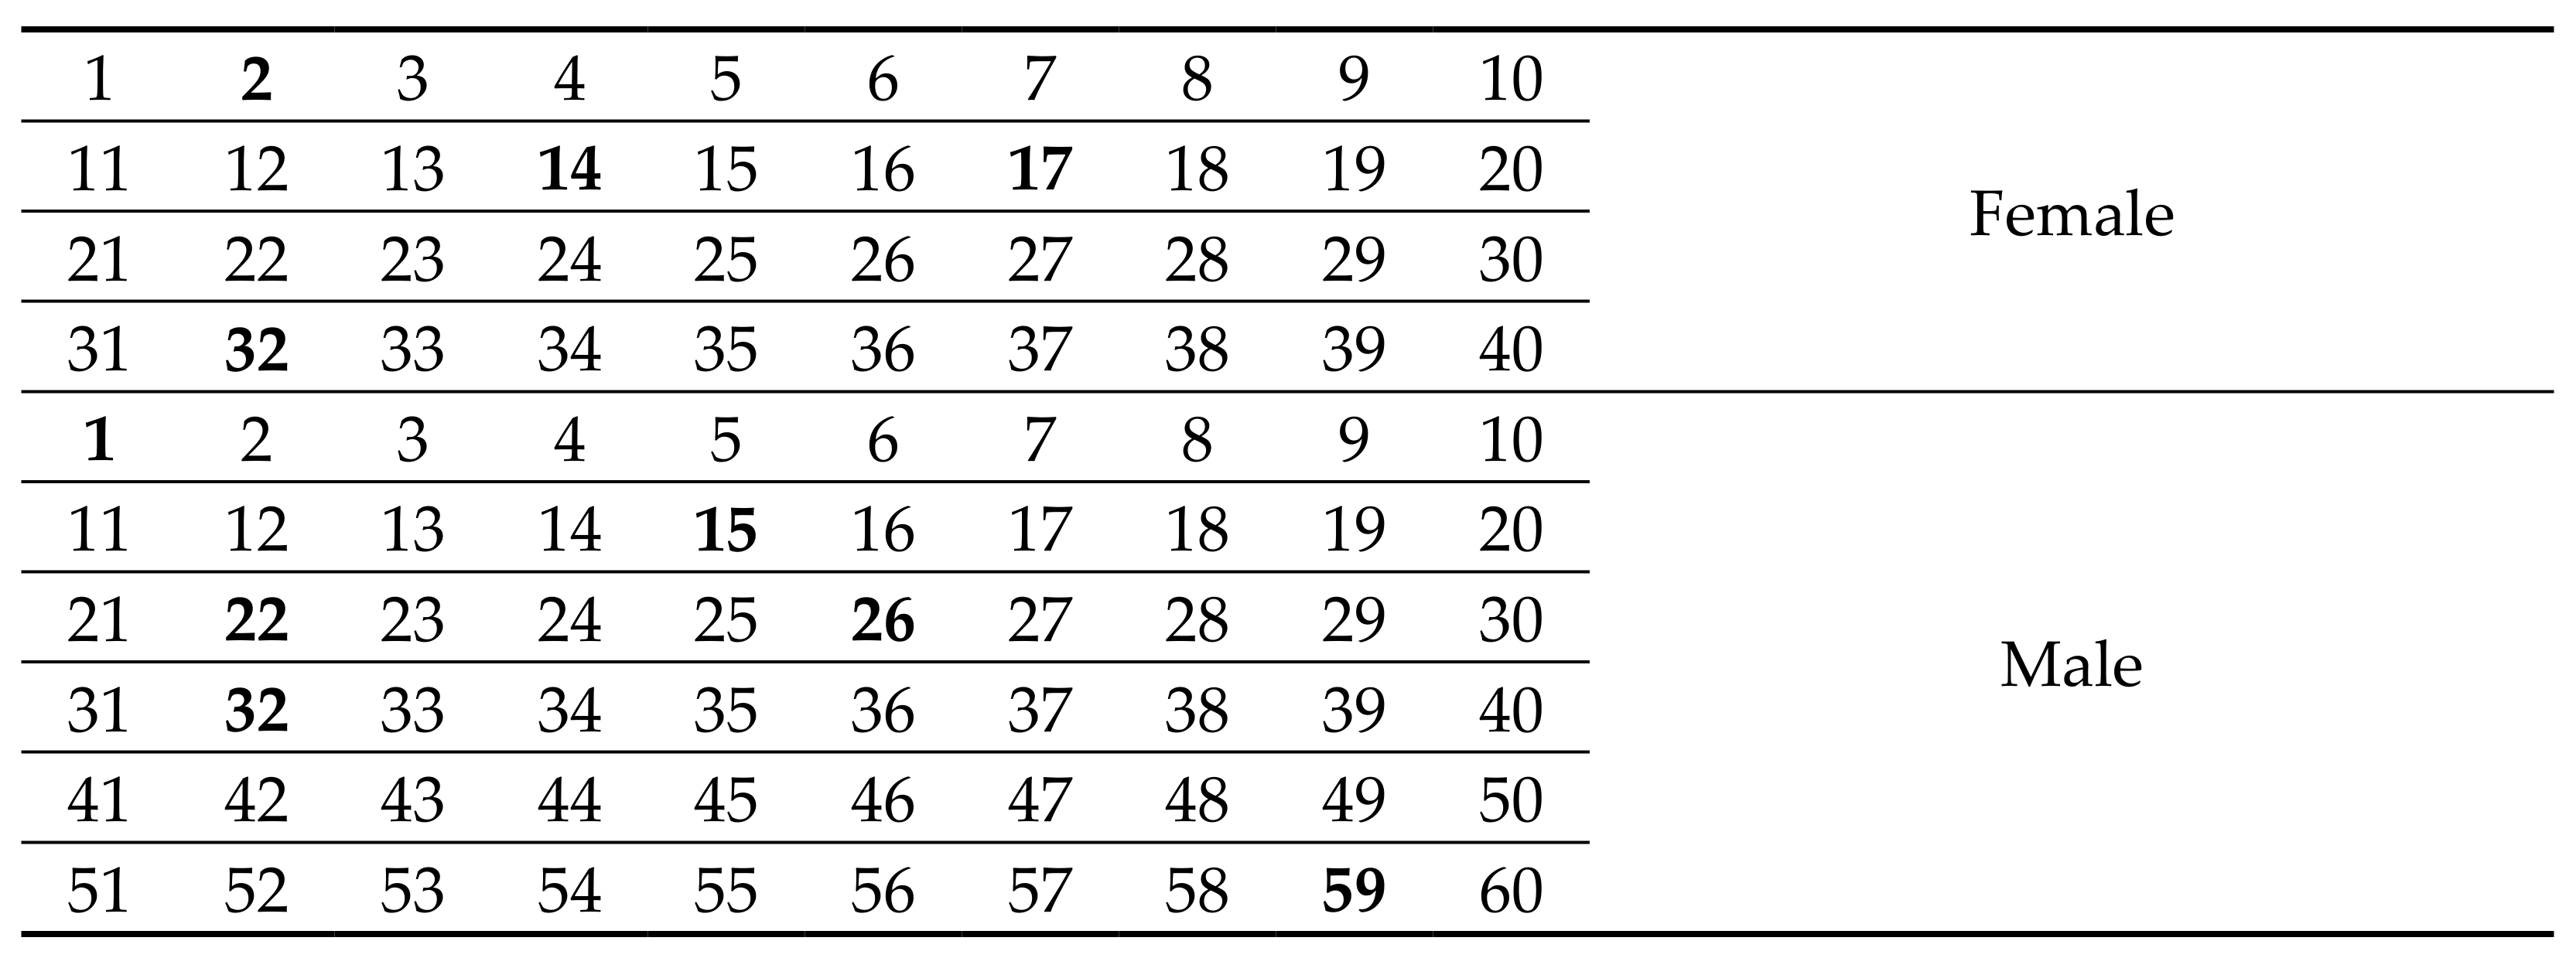
Our sampling procedures incorporated stratified random sampling, which uses existing information to subdivide the population into strata of sampling units [71]. This approach ensured that the units within each stratum were as homogeneous as possible with respect to the stratifying variables—gender and age—by referring to some prior data about Bangkok’s population. Each stratum was then sampled randomly using these predetermined sampling fractions. Figure 4 explains how to randomly select the samples from the population, where 40% of the population is female and 60% of the population is male. The sample selection considering the distribution of gender and age through a random sampling on the street was then implemented by the survey team with a pre-determined number of pedestrians passing by. In this example, the 2nd, 14th, 17th, and 32nd female pedestrians, and 1st, 15th, 22nd, 26th, 32nd, and 59th male pedestrians were selected and asked for their consent to participate in a personal interview survey.
The sample size was calculated based on a formula developed by Yamane [72]. Bangkok has expanded rapidly in both size and population since the 1960s [73] and now occupies 1568.7 km2 with 5,588,222 residents belonging to 3,103,483 households registering Bangkok as their legal domicile in 2020 [74]. To have a sampling confidence level (sampling confidence level is a percentage that reveals how confident you can be that the population would select an answer within a certain range) of 95% with a real value that is within ±7% margin of error (margin of error is a percentage representing how much we can expect the survey results to reflect the views of the overall population; the smaller the margin of error, the closer to the exact answer at a given confidence level), 196 or more respondents were required. Allowing for a 10% sampling error, we accordingly set the appropriate sample size at 218 respondents. Adopting the stratified random sampling, we were careful about a sample selection to make sure that the samples were balanced to reflect the real structure of Bangkok’s population.
The questionnaire survey was conducted through personal interviews instead of self-completion surveys. Personal interview surveys tend to obtain higher response rates and minimize non-response bias. The interviewers can explain the meaning of the questions when needed to maintain respondents’ interest and ensure a full set of responses. The survey covered a range of questions to get a good understanding of the daily activities of people living in Bangkok, including time use, eating habits, reasons for food waste, household kitchen waste separation habits and attitudes towards FW reduction. Some of the questions were about behavior and attitude, so we wanted spontaneous answers from individuals through these personal interviews. To make sure that the questionnaire was reliable, we conducted a pilot survey by interviewing some local residents who were not eligible to participate in the actual survey. We then updated the questions to improve and realign them with the objectives of the study. The list of questions in the questionnaire can be found in the Supplementary Material.
Under the concept of pro-environmental behaviors, this study applied the log-linear regression method, the ordered probit/logit regression method, and the logistic regression method [75,76,77,78] to predict the likelihood or intention that individuals will engage in various pro-environmental behaviors such as FW reduction, FW separation, and food management. The different models are applied due to the distinguishing nature of the “response variables”. The ordered probit/logit regression is suitable for explaining the ‘level’ of behavior having an ordinal scale where the differences between adjacent categories do not necessarily have the same meaning, whereas the logistic regression is applicable to the ‘selection/choice’ of behavior having a nominal scale with categories that do not have a natural order or ranking. The log-linear regression is typically used when the variables potentially have an exponential growth relationship and where a non-linear relationship exists between the independent and dependent variables. The ways of interpreting coefficients are also different among the models.
4. Results and Discussion
The results of questionnaire survey were analyzed using descriptive statistical analysis and the econometric model. Where appropriate, the study also discussed the correlation between food consumption behaviors and other important factors such as family size, waste disposal behavior, and pre-shopping behavior. We first of all introduce the key demographic attributes of the respondents and then give an analysis of the factors influencing FW generation and food management. Finally, we propose and discuss some integrated strategies for household food management.
4.1. Key Attributes from the Survey
Table 3 details the respondents’ characteristics, including gender, age, occupation, education, and household income. In total, we collected primary data from 222 individuals—101 males (45%) and 121 females (55%) (in 2020, the ratio of male and female population living in Bangkok was 47:53. Our samples were satisfactorily representing the sex/gender structure of Bangkok population. However, some discrepancies with respect to the ages of our samples occurred due to the difficulty in distinguishing the age of people passing by the investigators). The age distribution was from 18 to over 60 years, although the largest group was from the 21 to 30 years age group (46%). The education level of the sample varied, from primary school to Master’s degree or higher. Of the respondents, 45% held a university degree and 18% held a Master’s degree or higher. The monthly household income of the sample was distributed from lower than THB 5000 to higher than THB 100,000; more than half of the respondents earned more than THB 30,000. The respondents were involved in various kinds of employment, with the majority working as company employees (36%) followed by the self-employed (20%), government officers (17%), and students (11%). Others included daily laborers, the unemployed (including pensioners), full-time homemakers, part-time workers, and farmers.
4.2. Analyzing Factors Influencing Food Management
This study incorporated various regression techniques and econometric models to investigate the functional relationship between factors influencing food management. When we estimated regression coefficients, we also verified the corresponding statistical problems, such as heteroscedasticity, collinearity, and omitted variables, thereby ensuring an accurate relationship among the variables. We applied a practical econometric solution to any problems in order to validate the results.
4.2.1. Food Waste Generation
We analyzed various factors influencing food waste generation by using the log-linear regression method and taking into account variable elasticity. Table 4 shows that there are two strong coefficients affecting household food waste generation in Bangkok. The first one explains the relationship between the frequency of checking foods or ingredients in the refrigerator before going shopping, and the frequency of throwing foods or ingredients away before trying them even once. Checking foods/ingredients in the refrigerator before going shopping tends to reduce how often foods/ingredients are thrown away before trying them even once by 10.3% The second one is the frequency of making leftovers when eating out. The reduction in the frequency of making leftovers when eating out reduces how often foods/ingredients are thrown away before trying them by 32.6%.
It could be that motivation is the mechanism underlying this correlation. From time to time, people are influenced by attractive discounts or promotions at shopping malls or online food delivery platforms. These campaigns encourage customers to overspend or shop for more items than they actually need, thus increasing the frequency of throwing away foods or ingredients before trying them. On the other hand, checking foods or ingredient before going shopping could stimulate awareness on food waste prevention and convince people to only buy items that they actually need. If people practice this habit regularly, it encourages a positive attitude and reduces food waste.
Another important result is that there is only a weak correlation between how often food/ingredients are thrown away and other variables included in the model, such as sex (+), age (−), the number of children under 18 years old in the household (+), household income (−), and the period of residence (+). It is particularly interesting that there is no significant difference between men and women or between younger and older people when looking at how frequently they generate food waste before eating the food. This goes against the conventional belief that elderly people are more aware about preventing food waste than the younger generation [50,51,52,53,54].
4.2.2. Food Waste Separation
We used the ordered probit regression to analyze the factors affecting the frequency of food waste separation before disposal. The results shown in Table 5 reveal four significant factors. The first factor is related to the characteristics of family. It is shown that adults aged 19 to 55 years old have a significant impact on food waste separation in their households, with other family members having less significant impacts. Households with one extra 19–55-year-old adult tend to reduce the chance of separating household food waste by 1.7%. This figure indicates that family members in this range of ages tend to be very busy working outside the home so they are often unable to influence how household waste is managed. This eventually has a negative impact on the behavior of other family members.
People aged between 19 and 55 years old usually go out to work during the day and do not have much time to pay attention to housework, and tend not to separate food waste. From an environmental psychology perspective, there are some barriers in this situation due to a gap in individual attitudes as well as some external factors [79,80]. These barriers come under individuality, responsibility, and practicality. While other individual barriers, such as laziness or lack of interest, can outweigh environmental concerns; individual perceptions on the role of institutions could influence their responsibility to address relevant problems. Finally, there are also some practical barriers including lack of time or storage for waste separation or disposal, as well as limited information or personal physical limitation to reusing/recycling.
The second factor is how often foods or ingredients are thrown away before eating them. Reducing the frequency of throwing foods/ingredients away before eating them increases the chance of separation of household food waste by 3.3%. This frequency reflects the behavior of people with good habits or good awareness of avoiding food waste. People who tend not to throw away uneaten food are also those who are more likely to separate food waste before disposal.
The third factor is proper separation of general household waste. If general household waste is separated properly, this increases the chance of household food waste being separated by 29.6%.
The fourth and final significant factor is the reuse or recycling of general household waste. Reusing or recycling of general household waste increases the chance that food waste will also be separated by 5.8%.
The mechanism underlying these correlated relationships can partially be explained by the fact that people in Bangkok are highly sensitive to the odor of discarded food at home due to the hot climate and limited living space. Therefore, if food waste is separated, this can alleviate bad odors from the garbage bin. In addition, recycling or reuse of general household waste before disposal can be financially beneficial due to the well-organized waste collection process. Households are thus encouraged to separate food waste from other forms of general waste to facilitate recycling or reuse of general household waste. In this way, this mechanism increases the chance that households separate both their general waste and their food waste.
4.2.3. Reuse and Recycling of Food Waste
Following our analysis of the factors affecting the decision to reuse or recycle food waste generated in households, Table 6 concludes that there are five variables indicating a significant response to reuse/recycling behavior. The first variable is the age of the respondent. Each one-year increase in age decreases the chance that food waste is reused or recycled by 1.19%. The second variable is years in education. Each extra year in education increases the chance that food waste is reused or recycled by 3.13%. The third variable is family characteristics. Households having one extra 19 to 55-year-old adult tend to increase the chance that food waste is reused or recycled by 2.4%. The fourth variable is the frequency of throwing foods/ingredients away before eating them. People who are less likely to throw away foods/ingredients by one order/step show a 21.8% increase in willingness to reuse or recycle their waste. The final variable is the frequency of making leftovers when eating out. People who are less likely to make leftovers when eating out by one order/step show a 10.9% increase in willingness to reuse or recycle their waste.
The effect of the first and second variable is obvious. The more education a person receives, the more chance there is that they will reuse/recycle food waste. However, the older a person gets, the less likely they are to reuse or recycle. The underlying mechanism of having one extra 19 to 55-year-old adult in a family is supposed to be driven by his/her persuasive skills. Adults in this age group have more success in convincing other members to reuse or recycle. Therefore, it could be implied from our results that adults between 19 and 55 years old in Bangkok are currently interested in reuse and recycling activities and additionally make an effort to convince their family members to participate. When people are concerned about social/economic issues and are aware of climate change, they tend not to throw foods/ingredients away before eating them and tend not to make leftovers when eating out. Unsurprisingly, it is these people who more often participate in reuse and recycling activities.
However, people living in Bangkok do not currently have adequate support for reuse or recycling activities. It is not often possible to reuse or recycle food waste, due to lack of convenience and burdensome time constraints.
4.3. Development of Integrated Strategies for Household Food Management
Strategies for FW reduction at source have often been about composting, bio-extract, biogas, and animal farming. These solutions have two main problems. The first is that FW reduction schemes for composting, biogas, and bio-extract are usually carried out because food waste is regarded as valueless and unsanitary. This is why such strategies are neither popular nor successful in urban areas as they are complicated, time-consuming, cause unpleasant smells, and take up a great deal of space. People with urban lifestyles do not depend on the products generated by these strategies. The second problem is that food waste is generated due to household food management, including food purchase, cooking time, and mealtimes. An integrated full-scale waste management target should be set up to tackle household FW generation.
From our study, we found that socio-economic and demographic variables seem to have little explanatory power compared to other factors. Both pre-shopping behavior (checking foods/ingredients in the refrigerator before going shopping) and subjective norms (frequency of making leftovers when eating out) are factors that have an influence on FW reduction in household. It also shows that Thai people care about other people’s perception when disposing of general waste in the community (general waste separation), thus improving residents’ awareness on waste problems and providing a favorable atmosphere for promoting FW source separation in Bangkok. Moreover, good practices on FW reduction and FW separation induce the reciprocal effect on the reuse/recycling activities. The behavior related to daily food consumption activities has a cause–effect relationship. Therefore, integrating all those behaviors into a single comprehensive framework will ensure a holistic solution for tackling FW problems and enhancing the efficiency for preventing and reducing FW in Bangkok.
Van Geffen et al. [81] provided an overview of the literature on drivers of in-home food waste and translated them into guidelines for effective intervention development. Aschemann-Witzel et al. [82] published a study on factors behind the generation of food waste by consumers in households and along supply chains, demonstrating that motivation to avoid food waste, management skills in providing and handling food, and trade-offs between priorities have an extensive influence on the food waste behavior of consumers. Roodhuyzen et al. [83] developed a framework that conceptualized the generation of consumer food waste in relation to stages of the household supply chain and identified and categorized potential factors of consumer food waste as behavioral, personal, product, and societal factors. Schanes et al. [84] systematically reviewed the rising number of empirical studies on consumer food waste practices and the factors that foster and impede the generation of food waste at the household level. Based on the findings of these previous studies and the local context of Bangkok, we thus propose a conceptual model to implement food management and food waste prevention by source.
The proposed scheme is based on food management along with daily food consumption activities and targets low-budget household FW prevention. Householders can integrate the method into their daily lives in order to achieve the goals. The model consists of seven steps, as shown in Figure 5.
- Pre-Shop Planning. The plan can help householders calculate appropriate portion sizes for food consumed by all members in the family without creating leftovers that must be thrown away. Methods include: (1) making a plan of what to buy and to cook; (2) inspecting food on the shelf and in the refrigerator before making a purchase so that householders can avoid buying what they already have; and (3) making a shopping list of foodstuffs to discourage overbuying.
- Shopping. Unnecessary food purchasing inevitably leads to food waste. Householders have to think carefully and take practical advice, such as (1) buying food according to a plan previously made and not overbuying items because of marketing ploys and (2) buying food that can be kept in proper containers and suits the demands of consumers.
- Storage and Preservation of Freshness. Food preservation to reduce food loss is linked to knowledge and skills of types of food. Householders should consider: (1) the appropriateness of storage in relation to types of food. Shelf life has to be taken into account when it comes to perishable ingredients, such as meat kept in the freezer, vegetables like coriander and celery kept in the vegetable compartment, and root vegetables like taro kept at room temperature. Characteristics of food are also important. For example, tofu should not be kept in the freezer as its nutrients will be lost. Weighty fruits should not be placed on top of fresh vegetables which can be easily discolored. Well-planned food storage can also extend the edible life of products. (2) Regularly inspecting the food shelf and refrigerator allows consumers to check the expiry dates of food to ensure that no edible food is thrown away. Different product labels need to be clarified to prevent confusion. ‘Best before’ labels show the date before which products still retain good quality in terms of color and taste when kept under proper conditions. These labels do not indicate spoilage of products. In contrast, ‘use by’ dates, similar to expiry dates, indicate when food becomes harmful to consume because of contamination.
- Cooking. Skills and knowledge in food preparation are essential in cooking. During the cooking process, householders should consider: (1) proper portioning that is suited to the demands of all household members to avoid waste and (2) cooking from what consumers already have before buying new ingredients. Old food that is still edible can also be added to new ingredients, such as cooking Thai basil minced pork and then adding baby corns from the previous meal.
- Eating Habits. Food waste often occurs during mealtimes. To reduce waste, it is crucial to consider the following points: (1) portions of food should not be too excessive. Consumers should not overserve the food and should use small-sized packages or containers for good portioning; and (2) priority must be taken into account when preparing old and new ingredients, as the former must be eaten first because of the impending expiry date.
- Processing of Leftovers. Food waste after consumption can be reduced by means of food processing to extend its life. Methods include: (1) food preservation, which is a way of slowing down the spoilage of vegetables, fruits, and meat. Pickled lettuce, dried fish, pickled chili, and fruit jam are well-known examples of processed products; and (2) food transformation. Cooked food that is left uneaten can be processed into some forms of new dishes. For example, boiled chicken left from Chinese ceremonies can be recooked to make salted chicken.
- Food Waste Recycling. Sometimes, leftovers cannot be safely recooked, and in this case, they can be used to (1) feed animals, such as cats, dogs, and catfish or (2) make compost, bio-extract, and biogas, if householders are well-supplied with resources for such products.
5. Conclusions
Following several attempts to raise food waste problems as a national agenda, the government, municipal, and private sectors in Thailand have been endeavoring to implement regulations and policies around food waste separation and reduction at the source. Food waste problems, in particular, should be addressed urgently as they tend to become worse each year. Not only has food waste adversely affected the environment, it has also played a major role in creating unnecessary economic loss and social problems. We conducted literature reviews for this paper and carried out a series of statistical analyses, and we have developed a conceptual proposal for integrated household food waste reduction. The model for household food waste generation, as well as food waste reduction strategies, provide primary information on how to reduce household FW and inspire public awareness on how to reduce household waste. These strategies can be done within households and can be incorporated as a standard guideline for related responsible organizations to cost-effectively achieve their food waste reduction goals and environmental sustainability.
Our proposed conceptual model of integrated household food waste reduction was chiefly developed and modeled on empirical studies. In practical terms, it needs further analysis to be consistent with related empirical data and the national policies/strategies in Thailand. However, the statistical examination from ex-post practices can ensure the utmost efficiency for the proposed strategies to reduce food waste.
Of course, there are many research questions left unanswered. For example, the pattern and scale of food loss and food waste generation throughout the supply chain in Thailand is still poorly understood. Food waste issues are multifaceted and complex, and we suggest that further studies be carried out, integrating different disciplinary perspectives on FW management.
Supplementary Materials
The following are available online at https://www.mdpi.com/article/10.3390/su13147651/s1, Survey on Daily Lifestyle and Food Waste Generation in Bangkok.
Author Contributions
The first author P.B. made substantial contributions to conceptualization, methodology, and research design, conducting the questionnaire/interview survey, analysis and interpretation of data, and drafting and revising the article; the second author C.L. made substantial contributions to funding acquisition, literature review, and the policy recommendations. All authors have read and agreed to the published version of the manuscript.
Funding
This research was supported by the Environment Research and Technology Development Fund (S-16) of the Environmental Restoration and Conservation Agency of Japan ‘Policy Design and Evaluation to Ensure Sustainable Consumption and Production Patterns in Asian Region’ (2016–2020), and IGES SRF fund 2020.
Institutional Review Board Statement
Not applicable.
Informed Consent Statement
Not applicable.
Data Availability Statement
Supplementary Material associated with this article are openly available in FigShare at https://doi.org/10.6084/m9.figshare.14931066.v1 (accessed on 29 June 2021).
Acknowledgments
The authors would like to express their appreciation to Emma Fushimi of IGES for her careful editing and proofreading of the entire manuscript, as well as to the referees for their valuable comments and suggestions.
Conflicts of Interest
The authors declare no conflict of interest.
References
- Gustavsson, J.; Cederberg, C.; Sonesson, U.; van Otterdijk, R.; Meybeck, A. Global Food Losses and Food Waste: Extent, Causes and Prevention; Food and Agriculture Organization of the United Nations: Rome, Italy, 2011. [Google Scholar]
- Katsarova, I. Tackling Food Waste: The EU’s Contribution to a Global Issue; European Parliamentary Research Service (EPRS): Strasbourg, France, 2014. [Google Scholar]
- Institution of Mechanical Engineers (ImechE). Global Food: Waste Not, Want Not; Institution of Mechanical Engineers: London, UK, 2013. [Google Scholar]
- UN News Center. Nearly 870 Million People Chronically Undernourished, Says New UN Hunger Report. Available online: https://news.un.org/en/story/2012/10/423022#.VPFw4nysV4s (accessed on 29 June 2021).
- Sharp, A.; Sang-Arun, J. A Guide for Sustainable Urban Organic Waste Management in Thailand: Combining Food, Energy, and Climate Co-Benefits; Institute for Global Environmental Strategies: Kanagawa, Japan, 2012. [Google Scholar]
- Soma, T. (Re)framing the food waste narrative: Infrastructures of urban food consumption and waste in Indonesia. Indonesia 2018, 105, 173–190. [Google Scholar] [CrossRef]
- Rangkuti, F.; Wright, T. Indonesia Retail Foods: Indonesia Retail Report Update 2013; Foreign Agricultural Service: Jakarta, Indonesia, 2013; USDA Foreign Agricultural Service, Global Agricultural Information Network (GAIN). [Google Scholar]
- Goodman, D.; Robison, R. The New Rich in Asia: Mobile Phones, McDonald’s and Middle Class Revolution; Routledge: London, UK, 2013. [Google Scholar]
- Reardon, T.; Hopkins, R. The supermarket revolution in developing countries: Policies to address emerging tensions among supermarkets, suppliers and traditional retailers. Eur. J. Dev. Res. 2006, 18, 522–545. [Google Scholar] [CrossRef]
- Lee, K.C. Grocery shopping, food waste, and the retail landscape of cities: The case of Seoul. J. Clean. Prod. 2018, 172, 325–334. [Google Scholar] [CrossRef]
- Liu, C.; Mao, C.; Bunditsakulchai, P.; Sasaki, S.; Hotta, Y. Food waste in Bangkok: Current situation, trends and key challenges. Resour. Conserv. Recycl. 2020, 157, 104779. [Google Scholar] [CrossRef]
- Liu, G. Food Losses and Food Waste in China: A First Estimate. In OECD Food, Agriculture and Fisheries Papers; OECD Publishing: Paris, France, 2014. [Google Scholar]
- Wang, L.; Xue, L.; Li, Y.; Liu, X.; Cheng, S.; Liu, G. Horeca food waste and its ecological footprint in Lhasa, Tibet, China. Resour. Conserv. Recycl. 2018, 136, 1–8. [Google Scholar] [CrossRef]
- Khalid, S.; Naseer, A.; Shahid, M.; Shah, G.M.; Ullah, M.I.; Waqar, A.; Abbas, T.; Imran, M.; Rehman, F. Assessment of nutritional loss with food waste and factors governing this waste at household level in Pakistan. J. Clean. Prod. 2019, 206, 1015–1024. [Google Scholar] [CrossRef]
- Baig, M.B.; Gorski, I.; Neff, R.A. Understanding and addressing waste of food in the Kingdom of Saudi Arabia. Saudi J. Biol. Sci. 2019, 26, 1633–1648. [Google Scholar] [CrossRef]
- Rezaei, M.; Liu, B. Food Loss and Waste in the Food Supply Chain; International Nut and Dried Fruit Council: Reus, Spain, 2017; pp. 26–27. [Google Scholar]
- BMA. Bangkok State of the Environment 2015–2016; BMA: Bangkok, Thailand, 2016. [Google Scholar]
- BMA. Bangkok State of the Environment 2013–2014; BMA: Bangkok, Thailand, 2014. [Google Scholar]
- BMA. Bangkok State of the Environment 2010–2011; BMA: Bangkok, Thailand, 2011. [Google Scholar]
- Lammawichai, J. Solid Waste Management in Bangkok; BMA: Bangkok, Thailand, 2017; Available online: https://www.jesc.or.jp/Portals/0/center/training/10thasia3r/8.10thasia3r_bangkok.pdf (accessed on 21 June 2021).
- Pollution Control Department, Ministry of Natural Resources Environment. Thailand State of Pollution Report 2018; Pollution Control Department, Ministry of Natural Resources Environment: Bangkok, Thailand, 2019.
- Pollution Control Department, Ministry of Natural Resources Environment. Thailand State of Pollution Report 2017; Pollution Control Department, Ministry of Natural Resources Environment: Bangkok, Thailand, 2018.
- Pollution Control Department, Ministry of Natural Resources Environment. Thailand State of Pollution Report 2015; Pollution Control Department, Ministry of Natural Resources Environment: Bangkok, Thailand, 2016.
- Department of Environment. Handbook of Community Based Solid Waste Management; Department of Environment: Bangkok, Thailand, 2013. [Google Scholar]
- Policy and Planning Division. Waste Collection Trucks for the Fiscal Year of 2014; The Bangkok Metropolitan Administration: Bangkok, Thailand, 2015. [Google Scholar]
- Sukholthaman, P.; Sharp, A. A system dynamics model to evaluate effects of source separation of municipal solid waste management: A case of Bangkok, Thailand. Waste Manag. 2016, 52, 50–61. [Google Scholar] [CrossRef]
- Jungrungrueng, S. Bangkok towards sustainable waste management. In Proceedings of the management of the Sai Mai waste transfer and disposal station, Bangkok, Thailand; 2014. [Google Scholar]
- The Nation. Monthly Garbage Fees to Quadruple as New Disposal Cost Adde. The Nation. 9 May 2019. Available online: https://www.nationthailand.com/national/30369133 (accessed on 21 June 2021).
- Parfitt, J.; Barthel, M.; Macnaughton, S. Food Waste within Food Supply Chains: Quantification and Potential for Change to 2050. Philos. Trans. R. Soc. B 2010, 365, 3065–3081. [Google Scholar] [CrossRef] [Green Version]
- Food and Agriculture Organization of the United Nations (FAO). Food Loss Prevention in Perishable Crops. Agriculture Services bulletin No. 43; Food and Agriculture Organization of the United Nations: Rome, Italy, 1981. [Google Scholar]
- Batista, L.; Dora, M.; Garza-Reyes, J.A.; Kumar, V. Improving the sustainability of food supply chains through circular economy practices—A qualitative mapping approach. Manag. Environ. Qual. Int. J. 2021, 32, 752–767. [Google Scholar] [CrossRef]
- Hodges, R.J.; Buzby, J.C.; Bennett, B. Postharvest Losses and Waste in Developed and Less Developed Countries: Opportunities to Improve Resource Use. J. Agric. Sci. 2011, 149, 37–45. [Google Scholar] [CrossRef] [Green Version]
- Priefer, C.; Jörissen, J.; Bräutigam, K. Technology Options for Feeding 10 Billion People: Options for Cutting Food Waste; Science and Technology Options Assessment (STOA): Brussels, Switzerland, 2013. [Google Scholar]
- Lee, P.; Willis, P. Waste Arisings in the Supply of Food and Drink to UK Households; Waste & Resources Action Programme (WRAP): Banbury, UK, 2010. [Google Scholar]
- United States Environmental Protection Agency. Food: Too Good to Waste Pilot; U.S. Environmental Protection Agency-Region 10: Washington, DC, USA, 2012.
- Quested, T.E.; Marsh, E.; Stunell, D.; Parry, A.D. Spaghetti Soup: The Complex World of Food Waste Behaviour. Resources, Conservation and Recycling. Resour. Conserv. Recycl. 2013, 79, 43–51. [Google Scholar] [CrossRef]
- European Commission. Preparation Study on Food Waste across EU27; BIO Intelligence Service: Paris, France, 2010. [Google Scholar]
- Johnson, D.; Hipps, N.; Hails, S. Helping Consumers Reduce Fruit and Vegetable Waste: Final Report; Ipsos MORI and Waste & Resources Action Programme (WRAP): Banbury, UK, 2008. [Google Scholar]
- Bekteş, A. Research and Product Design to Minimize Food Waste in Western Domestic Kitchens. Master's thesis, Middle East Technical University, Ankara, Turkey, 2010. [Google Scholar]
- Corrado, M. Understanding Consumer Food Management Behaviour; Ipsos MORI and Waste & Resources Action Programme (WRAP): Banbury, UK, 2007. [Google Scholar]
- Canali, M.; Amani, P.; Aramyan, L.; Gheoldus, M.; Moates, G.; Östergren, K.; Silvennoinen, K.; Waldron, K.; Vittuari, M. Food waste drivers in Europe, from identification to possible interventions. Sustainability 2017, 9, 37. [Google Scholar] [CrossRef] [Green Version]
- Ponis, S.T.; Papanikolaou, P.-A.; Katimertzoglou, P.; Ntalla, A.C.; Xenos, K.I. Household food waste in Greece: A questionnaire survey. J. Clean. Prod. 2017, 149, 1268–1277. [Google Scholar] [CrossRef]
- Bilska, B.; Tomaszewska, M.; Kołożyn-Krajewska, D. Analysis of the behaviors of polish consumers in relation to food waste. Sustainability 2020, 12, 304. [Google Scholar] [CrossRef] [Green Version]
- Waste & Resources Action Programme (WRAP). Understanding Food Waste; Waste & Resources Action Programme (WRAP): Banbury, UK, 2007. [Google Scholar]
- Glanz, R. Causes of Food Waste Generation in Households—An Empirical Analysis; University of Natural Resources and Applied Life Sciences: Vienna, Austria; Cranfield University: Vienna, Austria, 2008. [Google Scholar]
- Chenene, L.M.L. The Relationship between Household-Generated Food Waste in Rural and Urban Lesotho: An Investigation; University of the Free State: Bloemfontein, South Africa, 2020. [Google Scholar]
- Schneider, F. Wasting Food—An Insistent Behaviour. Available online: http://analyseplatformen.dk/Data/madspildsmonitor/HTML_madspildsplatform/assets/schneider_2008_wasting-food--an-insistent-behaviour..pdf (accessed on 21 June 2021).
- Parizeau, K.; von Massow, M.; Martin, R. Household-level dynamics of food waste production and related beliefs, attitudes, and behaviours in Guelph, Ontario. Waste Manag. 2015, 35, 207–217. [Google Scholar] [CrossRef]
- Mattar, L.; Abiad, M.G.; Chalak, A.; Diab, M.; Hassan, H. Attitudes and behaviors shaping household food waste generation: Lessons from Lebanon. J. Clean. Prod. 2018, 198, 1219–1223. [Google Scholar] [CrossRef]
- Grethe, H.; Dembélé, A.; Duman, N. How to Feed the World’s Growing Billions. Understanding FAO World Food Projections and Their Implications; Heinrich Böll Stiftung und WWF Deutschland: Berlin, Germany, 2011. [Google Scholar]
- Cox, J.; Downing, P. Food Behaviour Consumer Research: Quantitative Phase; Ipsos MORI and Waste & Resources Action Programme (WRAP): Banbury, UK, 2007. [Google Scholar]
- Yamakawa, H.; Williams, I.; Shaw, P.; Watanabe, K. Food waste prevention: Lessons from the Love Food, Hate Waste campaign in the UK. In Proceedings of the 16th International Waste Management and Landfill Symposium, S. Margherita di Pula, Italy, 2–6 October 2017; pp. 2–6. [Google Scholar]
- Hamilton, C.; Denniss, R.; Baker, D. Wasteful Consumption in Australia; The Australia Institute: Canberra, Australia, 2005. [Google Scholar]
- Stancu, V.; Haugaard, P.; Lähteenmäki, L. Determinants of consumer food waste behaviour: Two routes to food waste. Appetite 2016, 96, 7–17. [Google Scholar] [CrossRef]
- The Government Office of Science. The Future of Food and Farming: Challenges and Choices for Global Sustainability; The Government Office of Science: London, UK, 2011.
- UN-Water. Water in a Changing World; World Water Assessment Programme (UNESCO WWAP): Istanbul, Turkey, 2009. [Google Scholar]
- Rahmani, M.; Davary, K.; Teimori, L.A.M.; Shafiei, M. Investigating and Selecting of Assessment Indexes for Sustainable Water Management at Watershed Scale. J. Irrig. Sci. Eng. 2021, 44, 141–154. [Google Scholar]
- Hall, K.; Guo, J.; Dore, M.; Chow, C. The Progressive Increase of Food Waste in America and Its Environmental Impact. PLoS ONE 2009, 4, 1–6. [Google Scholar] [CrossRef] [Green Version]
- Alexander, P.; Brown, C.; Arneth, A.; Finnigan, J.; Moran, D.; Rounsevell, M.D. Losses, inefficiencies and waste in the global food system. Agric. Syst. 2017, 153, 190–200. [Google Scholar] [CrossRef]
- Sinsuwan, P. Municipal Solid Waste: The Significant Problem of Thialand; National Assembly Library of Thailand: Bangkok, Thailand, 2014. [Google Scholar]
- Ventour, L. The Food We Waste; Exodus Market Research and Waste & Resources Action Programme (WRAP): Banbury, UK, 2008. [Google Scholar]
- Chaiyasut, C. Bioextract. Pathumthani: National Science and Technology Development Agency; NSTDA Bookstore: Bangkok, Thailand, 2010. [Google Scholar]
- Wang, K.; Nakakubo, T. Comparative assessment of waste disposal systems and technologies with regard to greenhouse gas emissions: A case study of municipal solid waste treatment options in China. J. Clean. Prod. 2020, 260, 120827. [Google Scholar] [CrossRef]
- Lou, Z.; Bilitewski, B.; Zhu, N.; Chai, X.; Li, B.; Zhao, Y. Environmental impacts of a large-scale incinerator with mixed MSW of high water content from a LCA perspective. J. Environ. Sci. 2015, 30, 173–179. [Google Scholar] [CrossRef]
- Maniscalco, M.P.; Volpe, M.; Messineo, A. Hydrothermal carbonization as a valuable tool for energy and environmental applications: A review. Energies 2020, 13, 4098. [Google Scholar] [CrossRef]
- Wang, T.; Liu, X.; Wang, D.; Gong, Z.; Si, B.; Zhai, Y. Persulfate assisted hydrothermal processing of spirulina for enhanced deoxidation carbonization. Bioresour. Technol. 2021, 322, 124543. [Google Scholar] [CrossRef]
- Wang, T.; Si, B.; Gong, Z.; Zhai, Y.; Cao, M.; Peng, C. Co-hydrothermal carbonization of food waste-woody sawdust blend: Interaction effects on the hydrochar properties and nutrients characteristics. Bioresour. Technol. 2020, 316, 123900. [Google Scholar] [CrossRef] [PubMed]
- Wang, T.; Zhai, Y.; Zhu, Y.; Li, C.; Zeng, G. A review of the hydrothermal carbonization of biomass waste for hydrochar formation: Process conditions, fundamentals, and physicochemical properties. Renew. Sustain. Energy Rev. 2018, 90, 223–247. [Google Scholar] [CrossRef]
- UNCRD. Country 3R Progress Report Kingdom of Thailand, 2018. In Proceedings of the Eight Regional 3R Forum in Asia and the Pacific, Indore, Madhya Pradesh, India, 9–12 April 2018. [Google Scholar]
- Chanhthamixay, B.; Vassanadumrongdee, S.; Kittipongvises, S. Assessing the sustainability level of municipal solid waste management in Bangkok, Thailand by wasteaware benchmarking indicators. Appl. Environ. Res. 2017, 39, 49–61. [Google Scholar] [CrossRef]
- Richardson, A.J.; Ampt, E.S.; Meyburg, A.H. Survey Methods for Transport Planning; Eucalyptus Press: Melbourne, Australia, 1995. [Google Scholar]
- Yamane, T. Statistics, an Introductory Analysis; Harper and Row: New York, NY, USA, 1967. [Google Scholar]
- Losiri, C.; Nagai, M.; Ninsawat, S.; Shrestha, R.P. Modeling urban expansion in Bangkok metropolitan region using demographic–economic data through cellular automata-Markov chain and multi-layer perceptron-Markov chain models. Sustainability 2016, 8, 686. [Google Scholar] [CrossRef] [Green Version]
- Strategy and Evaluation Department, Bangkok Metropolitan Administration. Statistical Profile of Bangkok Metropolitan Administration 2020; Strategy and Evaluation Department, Bangkok Metropolitan Administration: Bangkok, Thailand, 2021. [Google Scholar]
- Maddala, G.S.; Lahiri, K. Introduction to Econometrics; Macmillan: New York, NY, USA, 1992; Volume 2. [Google Scholar]
- Börsch-Supan, A. Econometric Analysis of Discrete Choice: With Applications on the Demand for Housing in the US and West-Germany; Springer Science & Business Media: Berlin/Heidelberg, Germany, 2012; Volume 296. [Google Scholar]
- Asteriou, D.; Hall, S.G. Applied Econometrics; Macmillan International Higher Education: New York, NY, USA, 2015. [Google Scholar]
- Meadowcroft, D.P. Understanding the Effect of Product Displays on Consumer Choice and Food Waste: A Field Experiment; University of Delaware: Newark, DE, USA, 2016. [Google Scholar]
- Nixon, H.; Saphores, J.-D. Information and the Decision to Recycle: Results From a Survey of US Households. J. Environ. Plan. Manag. 2009, 52, 257–277. [Google Scholar] [CrossRef]
- Babaei, A.A.; Alavi, N.; Goudarzi, G.; Teymouri, P.; Ahmadi, K.; Rafiee, M. Household recycling knowledge, attitudes and practices towards solid waste management. Resour. Conserv. Recycl. 2015, 102, 94–100. [Google Scholar] [CrossRef]
- van Geffen, L.; van Herpen, E.; van Trijp, H. Household Food waste—How to avoid it? An integrative review. Food Waste Manag. 2020, 27–55. [Google Scholar] [CrossRef] [Green Version]
- Aschemann-Witzel, J.; De Hooge, I.; Amani, P.; Bech-Larsen, T.; Oostindjer, M. Consumer-related food waste: Causes and potential for action. Sustainability 2015, 7, 6457–6477. [Google Scholar] [CrossRef] [Green Version]
- Roodhuyzen, D.M.; Luning, P.A.; Fogliano, V.; Steenbekkers, L. Putting together the puzzle of consumer food waste: Towards an integral perspective. Trends Food Sci. Technol. 2017, 68, 37–50. [Google Scholar] [CrossRef]
- Schanes, K.; Dobernig, K.; Gözet, B. Food waste matters—A systematic review of household food waste practices and their policy implications. J. Clean. Prod. 2018, 182, 978–991. [Google Scholar] [CrossRef]
Figure 1.
Bangkok MSW generation and ratio of FW from 2003 to 2018. Source: Compiled by the authors.
Figure 1.
Bangkok MSW generation and ratio of FW from 2003 to 2018. Source: Compiled by the authors.

Figure 2.
Bangkok FW generation per capita from 2003 to 2018. Source: Compiled by the authors.

Figure 3.
Overall structure of the waste management policy as well as related food loss and waste policies and regulations. Source: Modified and translated from Executive Summary: Thailand Waste Management Strategies (Reduce Reuse Recycle: 3R) by the authors.
Figure 3.
Overall structure of the waste management policy as well as related food loss and waste policies and regulations. Source: Modified and translated from Executive Summary: Thailand Waste Management Strategies (Reduce Reuse Recycle: 3R) by the authors.

Figure 4.
A stratified random sample from a stratified population. Source: Adapted with permission from [71]. The bold numbers indicate the randomly selected samples.
Figure 4.
A stratified random sample from a stratified population. Source: Adapted with permission from [71]. The bold numbers indicate the randomly selected samples.

Figure 5.
Proposed conceptual model of integrated household food waste reduction.


Table 1.
Causes of household food waste generation.
| Causes | Explanation and Support Evidence |
|---|---|
 Planning | Over-purchasing and lack of planning are among the factors that lead to an increase in household FW. Most consumers who do not plan their food purchases are likely to buy more food than they need [33]. Lee and Willis’s study [34] in the UK discovered that 5.3 million tons, or 64% of household food waste, is avoidable. In addition, a survey in Germany also showed that 59% of household food waste comes from ill-organized planning and suboptimal food storage. By age group, teenagers are less likely than adults to plan their food purchasing in advance [35]. Good pre-shopping planning or using shopping lists are some efficient ways to prevent excessive spending [36] particularly in reducing over-purchase [35]. |
 Food date labeling | Confusion over shelf-life and expiry dates on food labels, such as ‘best before’ date or ‘use by’ date, means that plenty of edible food is unnecessarily thrown away [37]. ‘Best before’ labels show the date before which products still retain good qualities in terms of color and taste when kept under proper conditions. The labels, however, do not indicate spoilage of products. When a product goes past its regulated specified date, consumers can choose whether they want to eat it or not by considering its color and taste. In contrast, a ‘use by’ date indicates when a food product becomes harmful to consume because of contamination. The use by date is quite similar to an expiry date, also known as EXP or Exp. Date. The quality of the food, in terms of texture, color, smell, taste, nutrition, and microorganisms, will deteriorate after the regulated date. As such, it fails to meet the required standards and is best discarded. These labeling distinctions can leave consumers baffled. For instance, more than 50% of consumers in the UK tend to be confused by the difference between the ‘best before’ and ‘use by’ dates, with 20% of all food waste stemming from such label-related confusion [34]. |
 Portion sizes | Package size can also be linked with the amount of food waste. Larger packs of food are generally popular among consumers, because they are cheaper than foodstuffs sold in small- and medium-sized packaging. Food bought in bulk can lead to more waste because consumers are not able to finish the product before it starts to decay. On the other hand, while small-sized packages help to reduce food waste, they can also generate more waste in other forms, such as plastic and glass. Therefore, if consumers have sufficient knowledge about food storage, preservation, and freezing, then they can buy food in bulk or in large-sized packages and make a significant contribution to reducing food waste and packaging, as well as saving money. |
 Unnecessary purchase | FW tends to increase if consumers buy food that is not needed at the time of purchase [36]. Overstocking often leads to more waste generation because food is not eaten by the expiry date. Furthermore, advertisements that tempt consumers into trying new foodstuffs are also another factor in FW generation. This means some food is likely to be thrown away simply because consumers try it once and find they do not like it. |
 Storage | When storing food, it is vital to maintain proper levels of humidity, light, and temperature as these have an impact on food deterioration and spoilage [35]. Poor food storage results in more waste, whereas proper food storage helps extend product shelf-life [37]. Knowledge about food storage also depends on the age of consumers. Older consumers are inclined to organize storage space better than younger consumers [38,39]. Consumer behavior focuses on convenience products, which also means that people do not need to know about food preservation and cooking. Another way to prevent food waste is to re-arrange food storage space frequently. That way, it is possible to check how much food is on the shelf and what the expiry dates are. A survey has shown that when people do not carry out sufficient cleaning and inspection of food storage space, many food products tend to be thrown away [35]. |
 Cooking skills and knowledge | According to Corrado’s study [40], food waste is attributed to a lack of cooking and food preparation skills. Such skills are linked to age. Older people tend to have more skills than young people in this regard. Younger people are more likely to burn or spoil food when they cook and prepare food [40,41,42,43]. In the UK, 50% of people under the age of 24 lack the ability to cook food using ingredients they already have in their refrigerators, so they are forced to buy new foodstuffs. They also do not often make good use of leftovers [43,44]. Proper portioning and good preparation techniques play a useful part in reducing food waste [35]. |
 Eating habits | According to Glanz’s study [43,45,46], food waste is also related to eating habits. Consumers who neglect to prepare in advance when purchasing food often end up throwing away rotten food in landfills. Householders who cook and eat food at home tend to produce less food waste than those who dine out [47,4849]. Up to 60% of food waste in the UK is generated during the cooking and preparation process and from excessive portions of food. |
 Socio-economic trends | Rising wages and changes in consumer behavior are linked to the increased amount of food waste [50]. Affluent households are inclined to produce more food waste [29]. This relationship corresponds to the European Union’s study showing that the amount of food loss tends to increase dramatically in line with household income. The increased amount of food waste has also been linked to consumption patterns, such as the rising trend in imported food product consumption. This is because imported products have quite a short shelf life. Another issue is that women who work outside the home affect the household food management because daily food purchase becomes more difficult without their help. These households inevitably buy and store in large quantities each week, leaving large amounts of food unused which has to be thrown away [33]. |
 Demographic change | The shift from extended family to nuclear family in society is also connected to an increased amount of food waste. This is because the average rate of waste disposal per person in the nuclear family is higher than that in the extended family, because food sharing is less common in the nuclear family. Furthermore, teenagers are likely to produce more food waste than older people as they are less experienced in planning and preparing meals, and often do not have the skills to properly manage food waste [50,51,52,53,54]. |
Table 2.
Adverse impacts of household food waste generation.
| Impacts | Explanation and Support Evidence |
|---|---|
 Food resources | The food industry is the largest generator of greenhouse gases, accounting for 14% of all emissions. Greenhouse gases generated by agricultural sectors are either directly discharged, such as methane and nitrous oxide from composting, livestock, and rice farming, or indirectly discharged from deforestation in order to cultivate lands for food production [33]. |
 Food industry | The food industry also consumes the most resources. Food production in agricultural sectors uses up to 70% of all fresh water [56,57 ]. Water usage is likely to increase by 10–13 trillion square meters a year by the middle of the 21st century [3]. Moreover, monoculture farming uses vast amounts of chemicals in the form of fertilizers and insecticides which are causing contamination of the soil and water. This has a negative impact on biodiversity and ecosystem services [33]. It is clear that if food is excessively and mindlessly consumed and mostly ends up in garbage bins, natural resources will be lost without any real advantages for humankind. |
 Environmental impacts | Food waste will eventually become biodegradable material, which has substantial impacts, namely (1) degradation and deposition causing emissions of methane, a greenhouse gas that accelerates global warming [58,59], (2) food waste elimination requiring large spaces for burial, a more popular method of disposal than incineration which requires high energy consumption, and (3) decomposition of food waste, causing leachate that seeps into groundwater and other natural water sources affecting human water consumption [60]. |
 Economic impacts | The 1.3 billion tons of food waste each year has an economic value of USD 750 billion [4]. In the UK, food disposal costs USD 10.2 billion. Each year, households incur costs of up to USD 420 to dispose of household food waste. Meat and fish make up the majority of waste, costing USD 602 million each year. The cost for wasted bread, apples, and potatoes is USD 360 million, USD 317 million, and USD 302 million, respectively. Fresh food dumped before its expiry date costs up to USD 950 million each year [61]. A survey has also shown that people are generally not particularly aware of the value of the food they throw away. Up to 24% of people never think of the cost of food waste. Another issue is that there are fees incurred from waste collection services provided by government and private sectors. |
Table 3.
Characteristics of the respondents.
| Category | Attributes | Number of Respondents |
|---|---|---|
| Sex | Male | 101 |
| Female | 121 | |
| Age | ≤20 | 4 |
| 21–30 | 102 | |
| 31–40 | 42 | |
| 41–50 | 27 | |
| 51–60 | 29 | |
| >60 | 18 | |
| Occupation | Company employee | 81 |
| Self-employed | 44 | |
| Daily-based labor | 12 | |
| Part-timer | 1 | |
| Full-time housewife | 7 | |
| Farmer/Agriculturist | 1 | |
| Government officer | 37 | |
| Student (university, junior college, etc.) | 25 | |
| Unemployed (including pensioners) | 12 | |
| Others | 2 | |
| Level of Education | No schooling | - |
| Primary school | 33 | |
| Lower secondary school | 16 | |
| Upper secondary school (High school) | 17 | |
| Vocational or technical university | 16 | |
| University | 100 | |
| Master’s Degree or higher | 40 | |
| Household income | ≤5000 THB/month | 2 |
| 5001–10,000 THB/month | 6 | |
| 10,001–15,000 THB/month | 25 | |
| 15,001–30,000 THB/month | 46 | |
| 30,001–50,000 THB/month | 59 | |
| 50,001–100,000 THB/month | 53 | |
| >100,000 THB/month | 31 |
Table 4.
Correlated factors of managing/disposing of generated food waste.
| Factors Affecting the Frequency of Throwing Foods/Ingredients away before Trying Them | Coefficient | p-Value | |
|---|---|---|---|
| Sex (1 = male, 0 = female) | 0.0924 | 0.359 | |
| Age | −0.0051 | 0.285 | |
| Level of education | −0.0024 | 0.946 | |
| Characteristics of family | |||
| No. of children under 18 years old | 0.0676 | 0.202 | |
| No. of adults 19–55 years old | −0.0084 | 0.801 | |
| No. of elderly above 55 years old | 0.0274 | 0.674 | |
| Household income | −0.0060 | 0.900 | |
| Type of residence (1 = dormitory, 0 = somewhere else) | 0.0492 | 0.726 | |
| Period of residence | 0.0033 | 0.475 | |
| Checking foods/ingredients in the refrigerator before going shopping, where 1 = always, 2 = usually, 3 = sometimes, 4 = rarely, 5 = never | 0.1035 | 0.012 * | |
| Frequency of making “leftovers” when eating out, where 1 = often, 2 = sometimes, 3 = rarely, 4 = never | 0.3255 | 0.000 * | |
| Constant | 1.3453 | 0.002 * | |
| Adjusted R2 = 0.1645 | RMSE = 0.7318 | Prob > F = 0.0000 | |
Remark: (1) The results were estimated by the log-linear regression method. (2) The dependent variable (Y) is the frequency that the respondents throw away foods/ingredients without eating them, where 1 = often, 2 = sometimes, 3 = rarely, 4 = never. (3) * = significant at the confidence level 95%.
Table 5.
Marginal effects of food waste separation before disposal.
| Factors Affecting the Frequency of Food Waste Separation before Disposal | Marginal Effect | p-Value |
|---|---|---|
| Sex (1 = male, 0 = female) | 0.0296 | 0.274 |
| Age | −0.0022 | 0.147 |
| Level of education | 0.0024 | 0.847 |
| Characteristics of family | ||
| No. of children under 18 years old | −0.0051 | 0.829 |
| No. of adults 19–55 years old | 0.0172 | 0.075 * |
| No. of elderly above 55 years old | 0.0182 | 0.329 |
| Household income | −0.0024 | 0.838 |
| Type of residence (1 = dormitory, 0 = somewhere else) | 0.0848 | 0.169 |
| Period of residence | −0.0013 | 0.297 |
| Frequency of throwing foods/ingredients away before eating them, where 1 = often, 2 = sometimes, 3 = rarely, 4 = never | −0.0326 | 0.058 * |
| Frequency of making leftovers when eating out, where 1 = often, 2 = sometimes, 3 = rarely, 4 = never | −0.0211 | 0.221 |
| General waste separation (1 = yes, 0 = no) | −0.2964 | 0.000 * |
| Reuse/recycle (1 = yes, 0 = no) | −0.0582 | 0.089 * |
Remark: (1) The results were estimated by the ordered probit regression method. (2) The dependent variable (Y) is the frequency of separating food waste before disposal, where 1 = always, 2 = sometimes, 3 = never. Therefore, an increase in the order implies an adverse impact on the food waste separation. (3) * = significant at the confidence level 90%.
Table 6.
Marginal effects of reuse and recycling activities.
| Factors Affecting Reuse and Recycling Activities | Marginal Effect | p-Value |
|---|---|---|
| Sex (1 = male, 0 = female) | −0.0933 | 0.086 |
| Age | −0.0119 | 0.004 * |
| Level of education (schooling years) | 0.0313 | 0.015 * |
| Characteristics of family | ||
| No. of children under 18 years old | 0.0059 | 0.236 |
| No. of adults 19–55 years old | 0.0238 | 0.030 * |
| No. of elderly above 55 years old | −0.0299 | 0.161 |
| Household income | −0.2220 | 0.119 |
| Type of residence (1 = dormitory, 0 = somewhere else) | −0.0609 | 0.149 |
| Frequency of throwing foods/ingredients away before eating them, where 1 = often, 2 = sometimes, 3 = rarely, 4 = never | 0.2182 | 0.089 * |
| Frequency of making leftovers when eating out, where 1 = often, 2 = sometimes, 3 = rarely, 4 = never | 0.1090 | 0.092 * |
Remark: (1) The results were estimated by the logistic regression method. (2) The dependent variable (Y) is the selection/choice of the disposal method of food waste generated in the respondent’s household as “reuse/recycle” (0 = no, 1 = yes). (3) * = significant at the confidence level 95%.
Publisher’s Note: MDPI stays neutral with regard to jurisdictional claims in published maps and institutional affiliations. |
© 2021 by the authors. Licensee MDPI, Basel, Switzerland. This article is an open access article distributed under the terms and conditions of the Creative Commons Attribution (CC BY) license (https://creativecommons.org/licenses/by/4.0/).
Share and Cite
MDPI and ACS Style
Bunditsakulchai, P.; Liu, C. Integrated Strategies for Household Food Waste Reduction in Bangkok. Sustainability 2021, 13, 7651. https://doi.org/10.3390/su13147651
AMA Style
Bunditsakulchai P, Liu C. Integrated Strategies for Household Food Waste Reduction in Bangkok. Sustainability. 2021; 13(14):7651. https://doi.org/10.3390/su13147651
Chicago/Turabian StyleBunditsakulchai, Pongsun, and Chen Liu. 2021. "Integrated Strategies for Household Food Waste Reduction in Bangkok" Sustainability 13, no. 14: 7651. https://doi.org/10.3390/su13147651
Note that from the first issue of 2016, this journal uses article numbers instead of page numbers. See further details here.