
Are Sustainable Companies More Likely to Default? Evidence from the Dynamics between Credit and ESG Ratings


Faculty of Business and Economics, TU Dortmund University, Otto-Hahn-Str. 6, 44227 Dortmund, Germany
*
Author to whom correspondence should be addressed.
†
These authors contributed equally to this work.
Sustainability 2021, 13(15), 8568; https://doi.org/10.3390/su13158568
Submission received: 16 June 2021
/
Revised: 26 July 2021
/
Accepted: 26 July 2021
/
Published: 31 July 2021
(This article belongs to the Special Issue Corporate Social Responsibility and Corporate Performance)
Abstract
:We investigate the relationship between environmental, social and governance (ESG) performance and the probability of corporate credit default. By using a sample of 902 publicly-listed firms in the US from 2002 to 2017 and by converting Standard & Poor’s credit ratings into default probabilities from rating transition matrices, we find the probability of corporate credit default to be significantly lower for firms with high ESG performance. Furthermore, by expanding the time window in our regression analysis, we observe that the influence of ESG and its constituents strongly varies over time. We argue that these dynamics may be due to financial and regulatory shocks. In a sector decomposition, we additionally find that the energy sector is most influenced by ESG regarding the probability of corporate credit default. We expect an increasing availability of ESG data in the future to reduce possible survivorship bias and to enhance the comparison between ESG-rated and non-ESG-rated firms.
1. Introduction
The relationship between environmental, social and governance (ESG) performance, the cost of capital and firm risk suggests an association with corporate credit default. Credit rating agencies issue credit ratings, which represent an assessment of the overall creditworthiness and the ability of a firm to meet its financial obligations. The credit ratings take into account market-level and firm-level data, as well as risk factors. Therefore, credit ratings reflect the market’s perception of a firm’s financial soundness. Interestingly, the rating agency Standard & Poor (S & P) recently stated that it has started incorporating ESG risk factors in their credit ratings [1]. Nevertheless, the precise methodology of the inclusion of ESG risks and whether ESG had an influence on corporate default in the past remain unclear.
In this study, we analyze the effect of ESG performance on the probability of corporate credit default by using a sample of ESG scores and credit default ratings for 902 firms in the US from 2002 to 2017. We obtain the probabilities of corporate credit defaults from credit rating transition matrices. One main reason for using probabilities instead of rating classes as the dependent variable is that credit rating classes are not equidistant, e.g., a change from rating B to BB is different from AA to AAA. Furthermore, the rating transitions demonstrate relative stability and volatility and thereby enhances the interpretability of our results. We find the probability of corporate credit default to be lower for firms with high ESG performance. We also examine whether the impact of ESG performance changes over time in an expanding window approach. In addition, we consider different sectors in order to further disaggregate the influence on the probability of default. Our results hold in univariate and multivariate tests, as well as in several robustness checks.
Our paper contributes to the existing literature by directly applying corporate credit default probabilities and showing that high ESG performance is associated with a lower default probability. We additionally relate to the development of ESG on credit default probabilities over time, finding that ESG more heavily affects the probability of corporate credit default during financial distress or regulatory shocks (see, e.g., [2]). Furthermore, we investigate this relationship on an industry-level and find that the energy, financial and information technology sectors especially exhibit a negative association between ESG and the probability of corporate credit default. Although our research is limited by missing ESG data on firms that defaulted, we believe that our early findings contribute to the evolving literature on this topic. We expect an increasing availability of ESG data in the future to reduce such survivorship bias and to enhance the comparison between ESG-rated and non-ESG-rated firms.
2. Theoretical Foundation
In order to understand the impact of corporate social responsibility (CSR) on different aspects of firm performance and why CSR can have a possible influence on firm risk, the relationship between CSR and stakeholder theory can be examined. There remains ambiguity as to whether these concepts are subsets of one another, are complementary or are two distinct principles. The difference between those two concepts can be explained by the prioritization of certain responsibilities as CSR only evaluates responsibilities towards society. The stakeholder theory also takes different parties into account, such as financiers, customers or suppliers, whose interests the company responds to. However, an overlap between both concepts exists as, e.g., communities can be seen as stakeholders, which are part of the society at large. This results in the consequence that both the stakeholder theory as well as CSR drives the realization of societal interests in business conduct [3,4]. This contrasts with instrumental theories that see maximizing profits for shareholders within the legal framework as the only accountability [5]. Windsor [6] addresses the question of whether the interests of society and firms converge on a longer time horizon, arguing that wealth accumulation progressively dominates the firms’ concept of responsibility.
Several studies have observed a positive impact of corporate social performance (CSP) on firm performance (see, e.g., [7,8]). A conceptual framework developed by Luo et al. [9] outlines a relationship between a firm’s CSR activities and its market value, suggesting that CSR is a driver of customer satisfaction, which can result in higher future cash flows and increase a firm’s growth prospects [10]. In addition to increasing shareholder wealth, reducing the cost of capital is an important mechanism through which CSR may create firm value where a firm’s cost of capital is directly linked to its risk (see, e.g., [11,12]). Albuquerque et al. [13] linked the association between CSR and firm risk to a product differentiation strategy, suggesting that high ESG firms face a relatively lesser price elastic demand, which results in lower systematic risk. They argue that the effect is stronger for firms with high product differentiation. This is in line with other research, which has shown that firms with higher ESG ratings have lower systematic risk, e.g., Oikonomou et al. [14] show that firms with low ESG performance exhibit higher systematic risk and El Ghoul et al. [12] hypothesized that firms with high ESG performance have lower firm risk since their investor base is relatively larger compared to those of firms with poor ESG performance. Sun and Cui [15] further show that CSR can decrease firm default risk by creating intangible assets, which may protect a firm’s assets during financial turmoil.
Using bond credit ratings, corporate credit ratings or CDS spread as measures of firm risk and there is mixed evidence on the association regarding the impact of ESG. Seltzer et al. [16] show that firms with low environmental scores tend to have poorer credit ratings and higher yield spreads. The authors further show that this is effect is particularly significant if firms are located in states with strict environmental regulations. Oikonomou et al. [17] find that a firm’s CSP reduces bond yield spreads, especially for long maturities, and is thus associated with lower risk. These results are consistent with a study by Attig et al. [18], who also observed a positive impact of good social performance on credit ratings. While Jiraporn et al. [19] assume that a firm’s ESG performance positively affects the corporate bond credit rating, Stellner et al. [20] find no statistically significant relationship between ESG performance and corporate credit ratings among firms in the eurozone. Badayi et al. [21] examined the impact of CSR activities on the probability of default of firms in developing countries. Here, a decreasing influence of CSR performance on default probabilities was observed, which were estimated with the Altman Z-Score model. CSR rating announcements also have a direct impact on credit default swaps (CDS) according to Drago et al. [22]. Using an event study, they find a significant decline in corporate CDS spreads after the announcement of a CSR rating upgrade.
In this paper, we contribute to the mixed findings on the association between ESG ratings and corporate credit default risk. Similar to Badayi et al. [21], we examine CSR performance on corporate credit default probabilities, which we derive from S & P credit rating transition matrices. We find US firms with high ESG performance to have a significantly lower probability of corporate credit default. We additionally decompose ESG into its constituents, showing that all pillars drive this result, while the social pillar exhibits the largest influence.
Moreover, it must be investigated to what extent the effect of CSR activities on firm performance develops over time once a certain market standard has been established. The contrast between proactive and reactive environmental strategies was investigated in an earlier study by Sharma and Vredenburg [23]. It was shown that the proactive implementation of environmental strategies can result in a competitive advantage over reactive firms. Due to the increase in attention and the presence of CSR related topics, the question arises whether this effect is temporary or persistent enough to possibly affect firm performance. In the report on firm CSR reporting, KPMG outline that in 2017, 93% of the world’s 250 largest companies published their CSR activities in reports compared to 45% in 2002. In another sample that includes the 100 largest companies in 52 countries by revenue, the reporting rate is 18% in 2002 compared to 77% in 2017 [24]. The institutionalization of CSR reporting is addressed and explained by Shabana et al. [25] in a three-stage model, which explains the motivation of companies to engage in reporting. According to this model, companies adopt defensive reporting early after they fail to meet stakeholders’ expectations. A subsequent proactive reporting driven by accumulation and knowledge diffusion about CSR reporting and its benefits is later followed by imitative diffusion. For this reason, we also pursue the question of whether the impact of ESG performance on the probability of corporate credit default varies over time. By taking into account the recent statement by S & P [1] on incorporating ESG risks in the credit risk evaluation, our empirical findings suggest that ESG performance may has already, in the past, significantly influenced the probability of corporate credit default.
Consistent with Borghesi et al. [26], we assume that ESG performance varies across industries since it may be difficult for some industries to attain high ESG performance due to differences in the nature of operation. The energy sector takes on a key role in the area of CSR, especially with regard to environmental sustainability (see, e.g., [27]). Patari et al. [28] find that CSR strengths and concerns regarding firms operating in the energy sector have different impacts on the firm’s financial performance. In particular, it was shown that changes in CSR strengths have no influence on profitability, but changes in concerns negatively affecting it. In our analysis of the influence of ESG on the probability of credit default over different industries, we find that the energy sector is most significantly affected.
3. Methods and Results
3.1. Data
Our sample consists of 7776 yearly observations for 902 publicly-listed firms in the US from 2002 to 2017. We obtain long term domestic credit issuer ratings by Standard & Poor’s (S & P) from Compustat/Capital IQ. Intermediate ratings are assigned to the respective major rating category in order to match credit issuer ratings with the corporate default probabilities. The most recently available rating during the year was assigned to the respective observation if several ratings were issued during the year. The probabilities of default for each rating class are provided by the average one-year US credit rating transition matrices provided by Standard & Poor’s [29,30,31,32,33,34,35,36,37,38]. The probabilities of default in our sample are derived from the average one-year US corporate transition rates from a given rating to default (D), which include rating transitions from 1981 to the year of the report. For the years 2002 to 2005, 2008 and 2009, no reports were available and, thus, we assigned the ratings to the probability of default from the upcoming available report. The credit ratings in our sample offer intermediate ratings that have been adjusted to their associated level in order to match them with the default probabilities.
We use Thompson Reuters Refinitiv Eikon to obtain annual ESG scores for the companies in our sample over the respective period. For our analysis, we use the ESG scores, which comprises corporate environmental (E), social (S) and governance (G) performance. The environmental performance includes but is not limited to emissions and resource, while social performance covers human rights and workforce and the governance performance measures management, stakeholder and CSR strategy. Similar to Capelle-Blancard et al. [39], we lag the ESG rating scores in all our specifications by one period. This is due to our interest in the association between ESG and the credit default probability, where ESG influences the . In addition, we hereby reduce problems arising from endogeneity and simultaneity bias. Another practical reason is that we assume that credit rating agencies do not obtain the contemporary ESG score prior to their credit evaluation. Table 1 provides descriptive statistics for the dataset used.
3.2. ESG Performance and Probability of Default
We perform ordinary least squares (OLS) regressions of the following specification to assess the effect of ESG rating scores on the probability of default ():
where i denotes the firm, t denotes the year, and representing industry-fixed and year-fixed effects, respectively, and stands for the error term. The additional k independent or control variables are denoted by the regressor vector X with the coefficient matrix . By using the (in %) instead of ordinally scaled credit ratings, we account for the non-equidistant scaling of credit ratings. We are specifically interested in the lagged independent variable and the respective pillar scores E, S and G. We then extend our analysis by controlling for the market-driven variables abnormal return, denoted as and , which is the firm’s annual idiosyncratic volatility defined as the standard deviation of daily abnormal returns. The daily abnormal returns are defined as the difference between observed daily log returns and expected returns, which in turn are estimated by using a simple market model. We use daily log returns of the S & P 500 index in the market model and retrieve annual abnormal returns from daily by summation.
Additionally, we implement various firm controls proposed by Shumway [40] who developed a hazard model to forecast bankruptcy, as well as industry and time-fixed effects in our regression. For the sector classification, we use the Global Industry Classification Standard’s (GICS), which defines 11 sectors in total. We report cluster-adjusted standard errors at firm-level.
In Table 2, we present the results of our baseline regressions. Our dependent variable is and we employ the one-year lagged ESG score and its lagged single constituents as independent variables in univariate regressions (models (1) to (4)). We then add the contemporary market-driven controls and for each specification (models (5) to (8)). We find that in the univariate models, all independent variables are highly significant and all coefficients are negative. As we include market controls, the coefficients for and its respective pillar scores remain highly significant, even when maintaining controls for industry and time-fixed effects and clustering of standard errors on the firm-level. The coefficients for and the constituents are negative and have nearly half the magnitude compared to the univariate models. As for and abnormal returns , the coefficients are positive and are also highly significant across all specifications. For the aggregate ESG score in the multivariate case, we conclude that an increase in by one unit decreases the probability of default by on average and while holding everything else constant. This first set of results indicates that environmental, social and governance performance as well as the aggregate ESG score significantly affects the probability of corporate credit default.
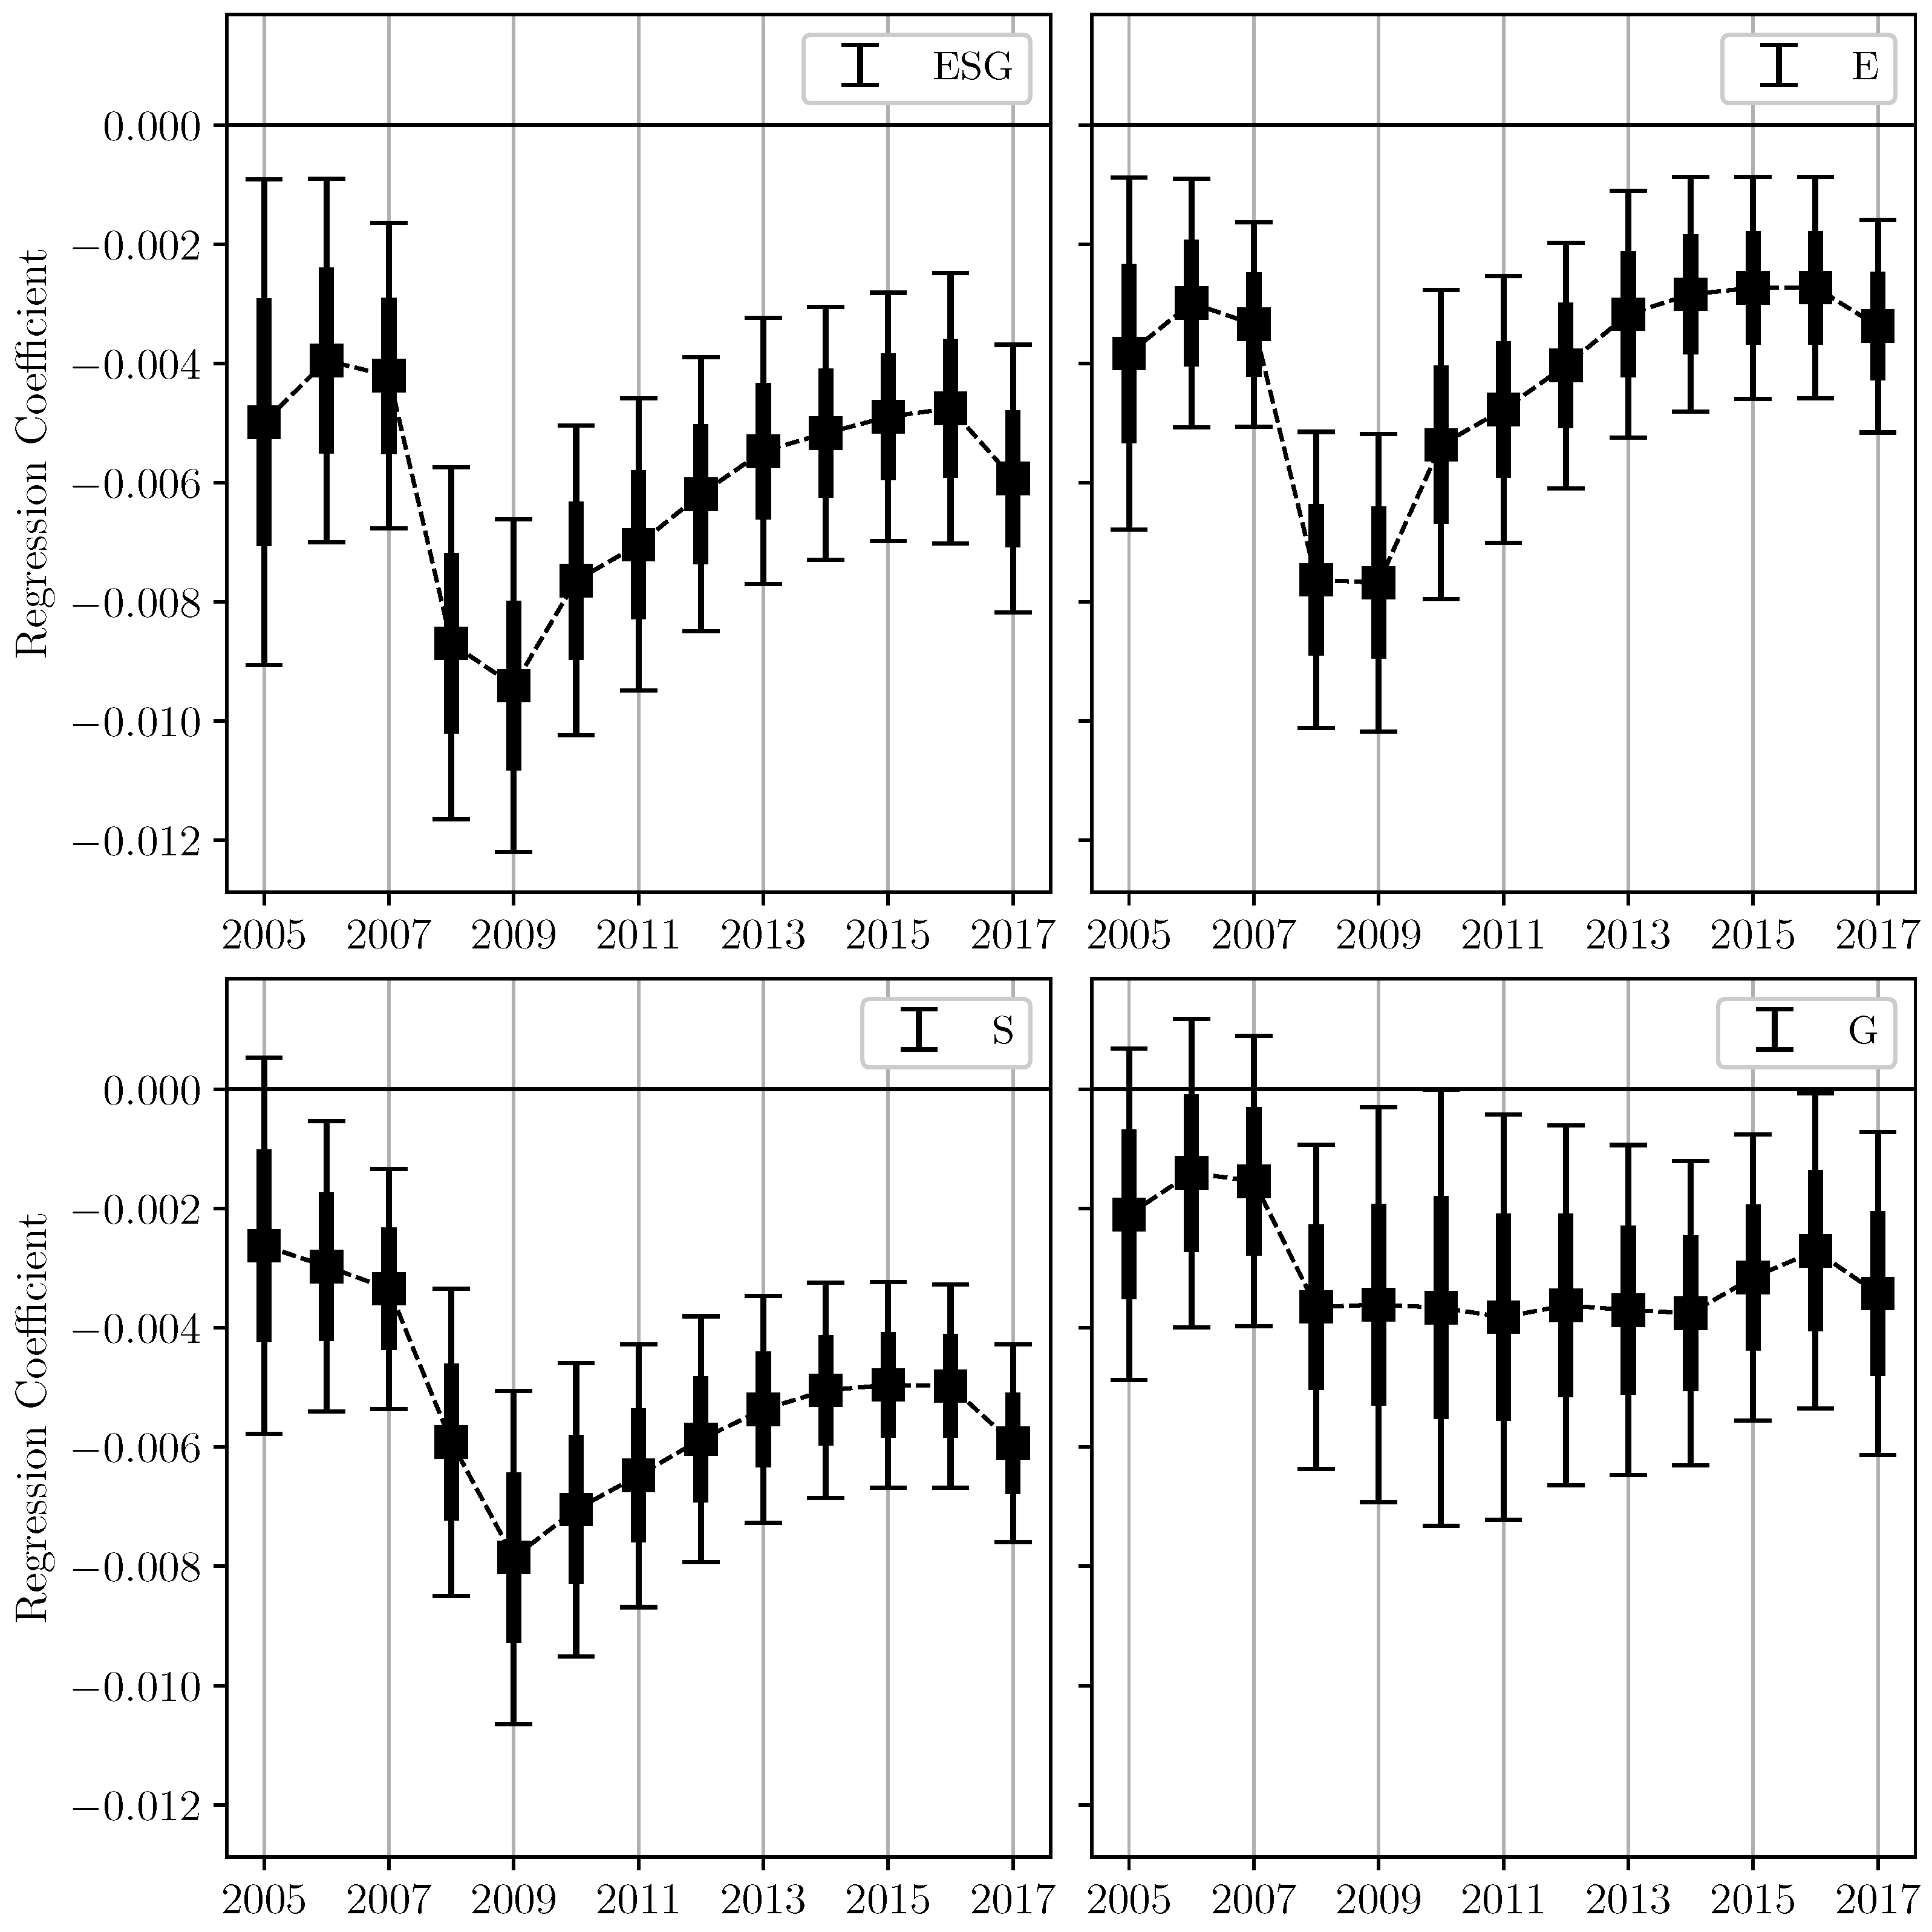
In order to further understand the effect of on over time, we plot the estimated coefficients for and its constituents in the specification from Table 2 (models (5) to (8)) from 2005 to 2017 in Figure 1. By using an expanding time window starting in 2002 for the estimation, we observe that the ESG score and each respective pillar score negatively affect the probability of corporate credit default in every subsample that is created by adding observations from the subsequent year.
We observe a sharp decline of the coefficients’ magnitude from 2007 to 2008, which indicates an increased effect of on . By taking into account the subprime mortgage crisis during the respective period, a stronger impact of ESG performance on the probability of default during this financial shock can be observed. The relevance of ESG criteria is perceived by credit rating agencies, for example, the rating agency Fitch’s addresses the importance and integration of the so-called ESG relevance scores, which are embedded in the credit rating process [41]. From this, it may be deduced that the rating agency readjusted its credit risk model with regard to ESG performance.
The magnitude of the coefficient increases post-crisis to a slightly lower value than pre-crisis, indicating that the rating agencies may have decreased the importance of in their evaluation of credit default risk. We observe that the coefficients for are decreasing since 2016, which might indicate that ESG performance is regaining importance for the risk evaluation of credit rating agencies. The increased emphasis on ESG from 2016 onward is consistent with the literature, which links this trend to the Paris Climate Change Agreement and the UN Principles for Responsible Investment (PRI) initiative of 2016 on ESG in Credit Ratings (see, e.g., [42,43]). Companies that operate in high-emission industries or generally have poor environmental performance tend to a higher average bond yield spread post Paris Climate Change Agreement [16].
Compared with the other pillars, the time evolution of the governance pillar score is very different; in particular, no minimum can be observed around the year 2009 and overall the influence is much smaller and shows little variation. A similar observation was made by Bebchuk et al. [44], who could not document any correlation between governance indices and abnormal returns during the period of 2000–2008. In the original work on the governance index (or G-Index), which uses various guidelines to define a proxy for the level of shareholder rights, a strong correlation between shareholder rights and firm value was observed in the 1990s [45]. The authors explain the subsequent disappearance of the effect with a learning effect on the part of the market participants, which allows them to distinguish between companies that score well and those that score poorly on the governance indices. Moreover, the structural break between the governance-return correlation corresponds to a simultaneous increase in media attention to corporate governance.
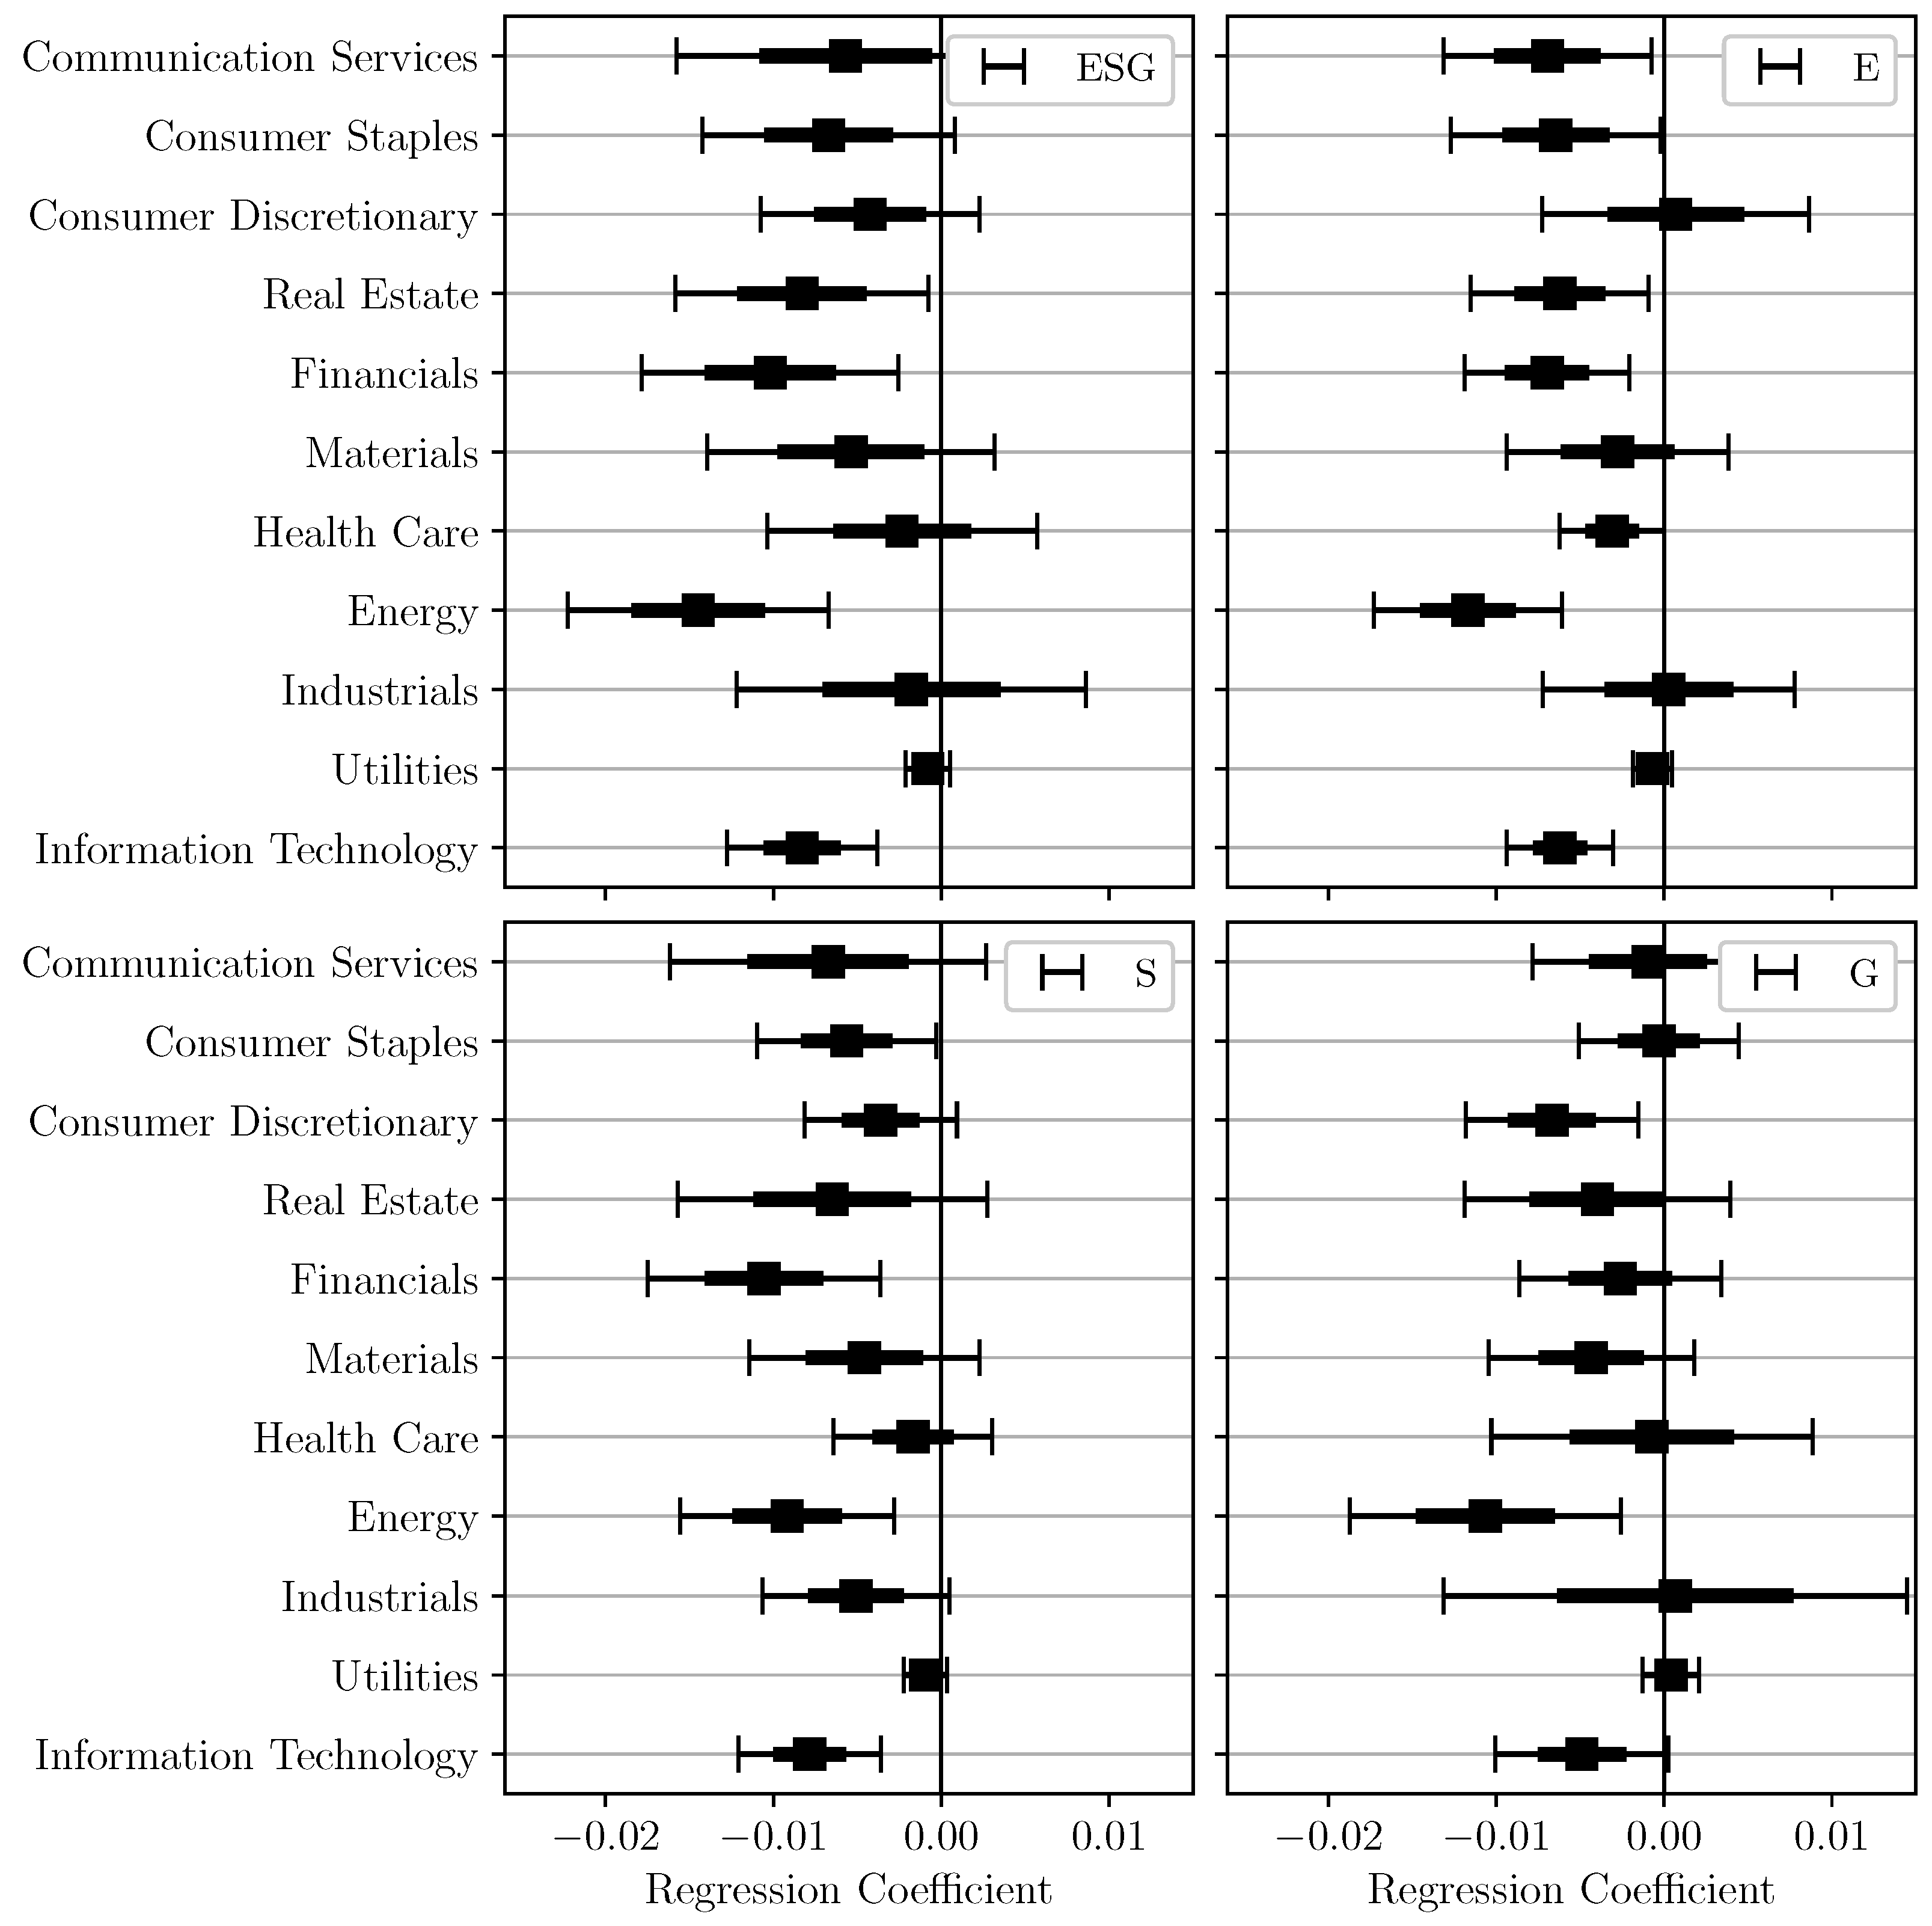
In Figure 2, we partition our panel to observe the magnitude of the estimated coefficient from Table 2 and specification (5) to (7) for different GICS sectors. Considering the aggregated , all industries show a negative influence of on . The industries Energy, Financials and Real Estate are most heavily influenced by in their . By further breaking down into its constituents, we can state that the environmental performance has the highest influence on in the Energy, Financials and Communication Services sectors. This is in line with the ongoing debate on the need for an ecological disruption, which affects the Energy sector in particular [46]. In contrast, we observe that Industrials and Consumer Discretionary have a positive coefficient for the effect of the environmental pillar score on , indicating that an increment in E increases the probability of credit default.
We interpret the positive coefficient that investment in environmental performance may be costly in these sectors and, therefore, negatively affects the . For the social pillar score S, we observe the highest impact of on for Financials, Energy and Information Technology. The effect of governance performance on reducing is most influential in Energy, Consumer Discretionary and Information Technology. The Industrials and Utilities sectors show a positive coefficient, which indicates that increasing governance performance in these sectors is costly and increases the .
Overall, the results from our tests indicate that environmental, social and governance performance significantly affects the probability of credit default. Although the average magnitude of the effect is not very large, we observe that the size of the coefficients varies strongly over time. This finding indicates, that rating agencies may adjust the weighting of performance in their credit risk modeling. We thereby conclude that may contribute to reducing the cost of capital through the credit risk channel.
3.3. Robustness
We perform several robustness checks to ensure the validity of our results. First, we examine the linear dependence in our regression specification by using a scatterplot of standardized residuals against the independent variables, yielding an indication of linear dependence. We further observe a serial correlation in our dependent variable by testing, as proposed by Wooldridge [47] (see, e.g., Table A4), but clustering the standard errors on a firm-level ensures robustness regarding inference [48]. We confirm stationarity for our dependent variable by performing the Dickey–Fuller test in our panel as proposed by Choi [49] (see, e.g., Table A5). Furthermore, a quantile–quantile plot of regression residuals on the inverse normal distribution shows that we have deviations from the normal distribution in the tails. In addition to the linear model estimated in this paper, we estimate a logistic regression with the probability of default as the dependent variable, which is similar to Orlando and Pelosi [50]. Additionally, we estimate an ordered logit with the respective credit rating as the dependent variable in order to better account for possible nonlinearities and the boundedness of our dependent variable. In both models, we estimate univariate models with the ESG Score as our main independent variable. Moreover, we estimate multivariate models by adding idiosyncratic volatility and abnormal returns as market driven control variables. We observe significant parameters and qualitatively equal signs, which are consistent with the results of the linear model. For reasons of brevity, we do not report the respective tables here.
After introducing market control variables in Table 2, we follow [40] and add a set of firm controls which consist of Altman’s [51] variables proposed in his Z-Score model. These include ratios of working capital to total assets (), retained earnings to total assets (), earnings before interest and taxes to total assets (), market equity to total assets () and sales to total assets (). According to the Z-score model, these five selected ratios are particularly well suited for describing or predicting corporate default. From the model estimates, the ratio of retained earnings to total assets () as a measure of cumulative profitability over the company life is shown to be particularly meaningful for describing the probability of default. Furthermore, the ratio describes the degree of leverage of the firm, since firms that finance their assets by retaining profits may require less debt capital. The ratio of EBIT to TA has a significant influence as a measure of the companies’ profitability [52]. Due to the substantially higher leverage compared to other sectors as well as increased sensitivity to financial risks, we neglect financial service firms in the following models [53]. The models were additionally calculated by including the companies from the financial sector and consistent results with significant effects were obtained. In addition, we add ratios of net income to total assets () (return on assets), total liabilities to total assets () to account for firm’s financial leverage and current assets to current liabilities () to control for liquidity as proposed by Zmijewski [54].
Since we leave out interpreting the respective coefficients for the additional control variables, their use in Table 3 and Table 4 is labeled Additional Controls for purposes of clarity. The results presented in Table 3 are similar to those from our baseline and market model, which indicates the aggregate ESG score as well as environmental and social pillar scores to be significantly associated with the lower probability of credit default.
There exists a strong correlation between ESG scores () and firm size (), which can be explained by better organizational legitimacy and resources available to a firm [55,56]. These dissimilarities are also discussed in the context of stakeholder theory and social capital by Russo et al. [57], who argues that a distinction must be made between SMEs and large companies since different idiosyncrasies between large companies and SMEs must be taken into account. Therefore, we further determine whether firm size affects our model and, therefore, estimate models with an interaction term between ESG score and the respective pillar scores with the natural logarithm of total assets as a proxy for firm size. Since the further added firm controls are already calculated as ratios divided by either total assets or current liabilities, we do not adjust it further.
Table 4 displays our results for the regression with as the dependent variable and interacted one-year lagged scores. Despite the coefficients for , and are significant and they are smaller in magnitude compared to the results from Table 3. Although not reported for reasons of brevity, we additionally subdivide our data based upon the investment-grade boundary. Companies with a credit rating better than BB are defined as investment grade. Observations with a credit rating of BB or worse correspond to high yield or speculative grade. We calculate the extended regression specifications from Table 4 with size interaction terms and find more significant results for firms that are marked as investment-grade (). For the subsample corresponding to the speculative grade, no significant influence () of on can be observed (). In addition, we use ESG scores with greater lags and obtain similar results, although the magnitude decreases proportionally with increasing lag (see Table A2). Overall, our various robustness checks provide further support for the negative relationship between and the probability of corporate credit default .
4. Conclusions
In this study, we analyzed whether ESG performance affects the probability of corporate credit default in the US. Investigating a sample of 902 firms, we find that the aggregated ESG scores and its corresponding pillar scores negatively affect the probability of credit default, which indicates that ESG may induce lower credit ratings and thereby lower the cost of capital of the firms. These results emerge from univariate and multivariate regression analysis by using market-driven control variables. In further robustness checks, the results for the aggregated ESG score and social pillar score can be reproduced, while the significance of the influence of the environmental pillar score is reduced and the effect of the governance score cannot be substantiated. We contribute to the literature on ESG performance and its effect on firm risk and the cost of capital. Translating credit ratings into corporate default probabilities circumvents the problem of ordinal scaling of credit ratings in linear models. In particular, the crossing of the investment-grade boundary induces a strong increase in the probability of default. By utilizing control variables from classical credit default prediction models, a robust relationship between ESG performance and the probability of default is shown. In an expanding time window approach, a strong variation in the coefficients for the aggregated ESG as well as the environmental and social pillar score was observed. This trend could not be observed for the governance pillar, which may be attributed to a learning effect of market participants [44]. For the aforementioned scores, the largest effect was observed around 2008 and 2009, which is concurrent with the subprime mortgage crisis. A time-dependent sensitivity or susceptibility to external shocks of the influence of ESG performance can be deduced from this. By conducting a sectoral analysis, it was possible to show that the influence of ESG performance plays a particularly important role in the energy sector since the greatest influence was observed here.
The link between ESG factors and difficult-to-measure risk management practices by firms may explain the effect of ESG on credit risk and, thereby, on the probability of corporate credit default. The identifications and management of low-probability risks using ESG factors inside firms are hypothesized to be correlated with fewer negative shocks on the firm side, e.g., fewer accidents and lawsuits, as well as fewer negative shocks on sales, revenue and profitability [58]. Such material credit events substantially influence the credit risk and are linked to the respective firm ESG performance.
This paper might be limited in the sense of a survivorship bias. During the sample selection process, we did not observe the ESG scores of companies that defaulted, which yields a sample of financially stable firms that might bias our results. On the other side and in the short time window of our panel, it is unlikely to observe large numbers of corporate defaults. Moreover, we expect that the increasing availability of ESG rating data will further reduce the survivorship bias and allow for a more precise comparison between ESG-rated and non-ESG-rated firms regarding the effect of ESG ratings on credit ratings and the probability of default.
The exact determination and definition of ESG criteria continues to be the subject of ongoing debate. Furthermore, there exist methodological differences between different rating agencies, which motivates further investigations of ESG ratings of different rating providers (see, e.g., [59]). Developments at the policy level, such as the discussion on the introduction of an EU taxonomy as a classification system for describing environmentally sustainable economic activities, could have an impact on the assessment of companies’ ESG activities [60]. The use of these redefined measures could reveal new insights between the creditworthiness of firms and their CSR performance.
The results of the study have implications from both a management and investor perspective. Implementing, reporting and pursuing CSR or ESG activities can reduce the probability of corporate credit default. However, this effect depends on the sector in which the company operates. Investors should take the ESG performance of companies into account when assessing default risk.
Author Contributions
Conceptualization, A.A., L.P. and P.P.; methodology, A.A., L.P. and P.P.; software, A.A. and L.P.; validation, A.A., L.P. and P.P.; formal analysis, A.A. and L.P.; investigation, A.A. and L.P.; resources, P.P.; data curation, A.A. and L.P.; writing—original draft preparation, A.A. and L.P.; writing—review and editing, A.A., L.P. and P.P.; visualization, L.P.; supervision, P.P.; project administration, A.A., L.P. and P.P.; funding acquisition, P.P. All authors have read and agreed to the published version of the manuscript.
Funding
This study was funded by Deutsche Forschungsgemeinschaft within the Collaborative Research Center “Statistical modeling of nonlinear dynamic processes” (SFB 823).
Acknowledgments
The authors wish to thank the team of the center for Finance, Risk and Resource management of the Technical University of Dortmund for their technical and administrative support. Further, we acknowledge financial support by Deutsche Forschungsgemeinschaft and Technische Universität Dortmund/TU Dortmund Technical University within the funding programme Open Access Publishing.
Conflicts of Interest
The authors declare no conflict of interest.
Appendix A

Table A1.
Sectoral analysis of the influence of ESG on the probability of default. This table shows the results of looking at each sector separately based on the Global Industry Classification Standard’s (GICS). The dependent variable is the probability of default (PD). The independent variable is the ESG or one of the associated pillar scores. In addition, abnormal returns (AR) and idiosyncratic volatility are added as market-driven control variables. All models are controlled for year-fixed effects. We report robust cluster-adjusted standard errors on firm-level in parentheses, where ***, ** and * denotes the coefficient’s statistical significance at the 1%, 5% and 10% levels.
| Dependent Variable: PD | All | Utilities | Industrials | Information Technology |
|---|---|---|---|---|
| (1) | (2) | (3) | (4) | |
| ESG | −0.0062 *** | −0.0008 | −0.0018 | −0.0083 *** |
| (0.0012) | (0.0007) | (0.0053) | (0.0023) | |
| Volatility | 6.3159 *** | 3.4782 *** | 10.2472 *** | 7.4106 *** |
| (0.9597) | (0.8253) | (3.8605) | (1.0021) | |
| Abnormal Return | 0.2774 ** | 0.1476 | 0.1597 | −0.0717 |
| (0.1162) | (0.1123) | (0.3105) | (0.1446) | |
| Observations | 6992 | 633 | 462 | 1056 |
| Year Fixed Effects | yes | yes | yes | yes |
| Adjusted R-Squared | 0.1705 | 0.4386 | 0.3375 | 0.1736 |
| Dependent Variable: PD | Materials | Health Care | Consumer Staples | Consumer Discretionary |
| (5) | (6) | (7) | (8) | |
| ESG | −0.0054 | −0.0023 | −0.0067 * | −0.0042 |
| (0.0044) | (0.0041) | (0.0038) | (0.0033) | |
| Volatility | 5.2968 *** | 6.4142 *** | 5.4909 *** | 6.8514 *** |
| (1.7721) | (1.6136) | (1.9346) | (1.6320) | |
| Abnormal Return | 0.5980 | 0.0635 | 0.1975 | 0.3710 ** |
| (0.5109) | (0.2171) | (0.1924) | (0.1840) | |
| Observations | 410 | 588 | 562 | 1053 |
| Year Fixed Effects | yes | yes | yes | yes |
| Adjusted R-Squared | 0.1401 | 0.3926 | 0.2039 | 0.1612 |
| Dependent Variable: PD | Energy | Financials | Real Estate | Communication Services |
| (9) | (10) | (11) | (12) | |
| ESG | −0.0145 *** | −0.0102 *** | −0.0083 ** | −0.0057 |
| (0.0040) | (0.0039) | (0.0038) | (0.0051) | |
| Volatility | 4.3164 ** | 7.8471 * | 7.9379 | 4.5445 *** |
| (1.6824) | (4.2104) | (4.9089) | (1.6212) | |
| Abnormal Return | 0.6064 | 0.4889 | 1.7132 * | 0.2125 |
| (0.4111) | (0.5312) | (1.0086) | (0.2363) | |
| Observations | 543 | 984 | 444 | 257 |
| Year Fixed Effects | yes | yes | yes | yes |
| Adjusted R-Squared | 0.1596 | 0.1738 | 0.3397 | 0.1830 |
Table A2.
Influence of greater lagged ESG scores on the probability of default. This table shows the influence of increasing lagged ESG scores on corporate default probabilities, where corresponds to the ESG score used as independent variable in Table 2, Table 3 and Table 4. In addition to the dependent variable , abnormal returns and idiosyncratic volatility are used as market-driven control variables. All models are controlled for industry-fixed and year-fixed effects. We report robust cluster-adjusted standard errors on the firm-level in parentheses, where ***, ** and * denotes the coefficient’s statistical significance at the 1%, 5% and and 10% levels.
| (1) | (2) | (3) | (4) | |
|---|---|---|---|---|
| −0.0062 *** | ||||
| (0.0012) | ||||
| −0.0049 *** | ||||
| (0.0013) | ||||
| −0.0041 *** | ||||
| (0.0014) | ||||
| −0.0033 ** | ||||
| (0.0014) | ||||
| Volatility | 6.3159 *** | 6.4684 *** | 6.5107 *** | 6.7274 *** |
| (0.9597) | (1.1018) | (1.1925) | (1.2669) | |
| Abnormal Return | 0.2774 ** | 0.2608 * | 0.3409 ** | 0.3573 ** |
| (0.1162) | (0.1337) | (0.1389) | (0.1547) | |
| Observations | 6992 | 6204 | 5500 | 4978 |
| Industry Fixed Effects | yes | yes | yes | yes |
| Year Fixed Effects | yes | yes | yes | yes |
| Adjusted R-Squared | 0.1705 | 0.1671 | 0.1645 | 0.1662 |
Table A3.
This table provides an overview of the variables used and their definition, respectively. Accounting data were obtained from Compustat/Capital IQ, ESG and pillar scores and stock prices from Thomson Reuters Eikon. The scores used are defined as continuous variables between 0 and 100, corresponding to a percentile score [61].
| Variable | Definition |
|---|---|
| Dependent variables: | |
| PD | Probability of default taken from averaged one-year corporate transition probabilities for U.S. based firms provided by Standard and Poor’s. |
| Independent variables: | |
| ESG Score | ESG Score. |
| E Score | Environmental Pillar Score |
| S Score | Social Pillar Score. |
| G Score | Govnernance Pillar Score. |
| Control variables: | All continuous variables are winsorized at the 1st and 99th percentiles. |
| Abnormal Return | Abnormal Return given as the difference between observed returns and expected returns from a market model based on daily log returns. The annual returns are determined by summation. The market returns are being proxied by the S & P 500 Index returns, which are used to estimate the market beta. |
| Volatility | Idiosyncratic Volatility derived from market model residuals, i.e., the standard deviation of the estimated abnormal returns. |
| WC/TA | Working Capital to Total Assets. |
| RE/TA | Retained Earnings to Total Assets. |
| EBIT/TA | Earnings before Interests and Taxes to Total Assets. |
| ME/TL | Market Equity to Total Liabilities. |
| S/TA | Sales to Total Assets. |
| NI/TA | Net Income to Total Assets (Return on Assets). |
| TL/TA | Total Liabilities to Total Assets. |
| CA/CL | Current Assets to Current Liabilities. |
| Size | Natural logarithm of Total Assets. |
Table A4.
Wooldridge test for serial correlation in panel data. This table shows the results of the Wooldridge test for serial correlation in panel data. The null hypothesis states that there is no first-order autocorrelation present in the panel data. The test is run with for the panel of our multivariate specification containing the dependent variable as well as the independent variables , and . We report p-values, where ***, ** and * denotes statistical significance at the 1%, 5% and 10% levels.
| Statistic | p-Value | |
|---|---|---|
| F-statistic | 8.196 | 0.00 *** |
Table A5.
Augmented Dickey–Fuller unit root test. This table shows the results of the Fisher-type Augmented Dickey–Fuller unit root test on our dependent variable . The null hypothesis states that all panels contain unit roots while the alternative states that at least one panel is stationary. The test is run with an ADF regression lag of one and a finite number of panels. We report p-values, where ***, ** and * denotes statistical significance at the 1%, 5% and 10% levels.
| Statistic | p-Value | |
|---|---|---|
| Inverse | 2801.64 | 0.00 *** |
Table A6.
This table presents the correlation coefficients for the variables used in this paper. The definitions of the variables are provided in Table A3.
Table A6.
This table presents the correlation coefficients for the variables used in this paper. The definitions of the variables are provided in Table A3.
| (1) | (2) | (3) | (4) | (5) | (6) | (7) | (8) | (9) | (10) | (11) | (12) | (13) | (14) | (15) | (16) | |
|---|---|---|---|---|---|---|---|---|---|---|---|---|---|---|---|---|
| (1) PD | 1.00 | |||||||||||||||
| (2) ESG | −0.14 | 1.00 | ||||||||||||||
| (3) E | −0.12 | 0.85 | 1.00 | |||||||||||||
| (4) S | −0.13 | 0.88 | 0.71 | 1.00 | ||||||||||||
| (5) G | −0.10 | 0.69 | 0.43 | 0.39 | 1.00 | |||||||||||
| (6) Volatility | 0.38 | −0.18 | −0.17 | −0.15 | −0.12 | 1.00 | ||||||||||
| (7) AR | −0.05 | −0.00 | 0.00 | −0.00 | 0.01 | −0.22 | 1.00 | |||||||||
| (8) WC/TA | 0.03 | −0.05 | −0.04 | −0.02 | −0.07 | 0.12 | −0.02 | 1.00 | ||||||||
| (9) RE/TA | −0.28 | 0.12 | 0.14 | 0.09 | 0.09 | −0.20 | 0.04 | 0.08 | 1.00 | |||||||
| (10) EBIT/TA | −0.16 | 0.09 | 0.11 | 0.10 | 0.03 | −0.20 | 0.15 | 0.14 | 0.35 | 1.00 | ||||||
| (11) ME/TL | −0.11 | 0.02 | 0.05 | 0.04 | −0.03 | −0.10 | 0.13 | 0.38 | 0.28 | 0.40 | 1.00 | |||||
| (12) S/TA | 0.01 | 0.05 | 0.08 | 0.03 | 0.05 | 0.06 | 0.05 | 0.19 | 0.20 | 0.35 | 0.12 | 1.00 | ||||
| (13) NI/TA | −0.20 | 0.09 | 0.10 | 0.10 | 0.03 | −0.29 | 0.19 | 0.13 | 0.35 | 0.78 | 0.38 | 0.22 | 1.00 | |||
| (14) TL/TA | 0.21 | 0.04 | −0.03 | 0.04 | 0.01 | 0.09 | −0.04 | −0.35 | −0.34 | −0.09 | −0.51 | −0.05 | −0.18 | 1.00 | ||
| (15) CA/CL | 0.05 | −0.07 | −0.06 | −0.05 | −0.09 | 0.12 | −0.04 | 0.82 | 0.05 | 0.04 | 0.36 | −0.03 | 0.06 | −0.39 | 1.00 | |
| (16) Size | −0.21 | 0.42 | 0.35 | 0.39 | 0.22 | −0.19 | −0.03 | −0.32 | 0.00 | −0.19 | −0.18 | −0.28 | −0.09 | 0.21 | −0.30 | 1.00 |
References
- Standard & Poor’s. Environmental, Social, and Governance Principles in Credit Ratings; Technical Report; Standard & Poor’s: New York, NY, USA, 2021. [Google Scholar]
- Amiraslani, H.; Lins, K.V.; Servaes, H.; Tamayo, A. A Matter of Trust? The Bond Market Benefits of Corporate Social Capital during the Financial Crisis. 2017. CEPR Discussion Paper No. DP12321. Available online: https://ssrn.com/abstract=3042634 (accessed on 24 June 2021).
- Freeman, R.; Dmytriyev, S. Corporate Social Responsibility and Stakeholder Theory: Learning From Each Other. Symphonya Emer. Issues Manag. 2017, 7. [Google Scholar] [CrossRef] [Green Version]
- Garriga, E.; Melé, D. Corporate Social Responsibility Theories: Mapping the Territory. J. Bus. Ethics 2004, 53, 51–71. [Google Scholar] [CrossRef]
- Friedman, M. The social responsibility of business is to increase its profits. In Corporate Ethics and Corporate Governance; Springer: Berlin/Heidelberg, Germany, 2007; pp. 173–178. [Google Scholar]
- Windsor, D. The Future of Corporate Social Responsibility. Int. J. Organ. Anal. 2001, 9, 225–256. [Google Scholar] [CrossRef]
- Waddock, S.; Graves, S. The Corporate Social Performance-Financial Performance Link. Strateg. Manag. J. 1997, 18, 303–319. [Google Scholar] [CrossRef]
- Donker, H.; Poff, D.; Zahir, S. Corporate Values, Codes of Ethics, and Firm Performance: A Look at the Canadian Context. J. Bus. Ethics 2008, 82, 527–537. [Google Scholar] [CrossRef]
- Luo, X.; Bhattacharya, C. Corporate Social Responsibility, Customer Satisfaction, and Market Value. J. Mark. 2006, 70, 1–18. [Google Scholar] [CrossRef]
- Gruca, T.; Rego, L. Customer Satisfaction, Cash Flow, and Shareholder Value. J. Mark. 2005, 69, 115–130. [Google Scholar] [CrossRef]
- Starks, L.T. EFA Keynote Speech: “Corporate Governance and Corporate Social Responsibility: What Do Investors Care about? What Should Investors Care about?”. Financ. Rev. 2009, 44, 461–468. [Google Scholar] [CrossRef]
- El Ghoul, S.; Guedhami, O.; Kwok, C.C.; Mishra, D.R. Does corporate social responsibility affect the cost of capital? J. Bank. Financ. 2011, 35, 2388–2406. [Google Scholar] [CrossRef]
- Albuquerque, R.; Koskinen, Y.; Yang, S.; Zhang, C. Corporate Social Responsibility and Firm Risk: Theory and Empirical Evidence. Manag. Sci. 2018, 65, 4451–4949. [Google Scholar] [CrossRef] [Green Version]
- Oikonomou, I.; Brooks, C.; Pavelin, S. The Impact of Corporate Social Performance on Financial Risk and Utility: A Longitudinal Analysis. Financ. Manag. 2012, 41, 483–515. [Google Scholar] [CrossRef] [Green Version]
- Sun, W.; Cui, K. Linking corporate social responsibility to firm default risk. Eur. Manag. J. 2014, 32, 275–287. [Google Scholar] [CrossRef]
- Seltzer, L.; Starks, L.T.; Zhu, Q. Climate Regulatory Risks and Corporate Bonds; Working Paper; University of Texas at Austin: Austin, TX, USA, 2021. [Google Scholar] [CrossRef]
- Oikonomou, I.; Brooks, C.; Pavelin, S. The Effects of Corporate Social Performance on the Cost of Corporate Debt and Credit Ratings. Econom. Model. Corp. Financ. Gov. J. 2014. [Google Scholar] [CrossRef]
- Attig, N.; Ghoul, S.E.; Guedhami, O.; Suh, J. Corporate Social Responsibility and Credit Ratings. J. Bus. Ethics 2013, 117, 679–694. [Google Scholar] [CrossRef]
- Jiraporn, P.; Jiraporn, N.; Boeprasert, A.; Chang, K. Does Corporate Social Responsibility (CSR) Improve Credit Ratings? Evidence from Geographic Identification. Financ. Manag. 2014, 43, 505–531. [Google Scholar] [CrossRef]
- Stellner, C.; Klein, C.; Zwergel, B. Corporate social responsibility and Eurozone corporate bonds: The moderating role of country sustainability. J. Bank. Financ. 2015, 59, 538–549. [Google Scholar] [CrossRef]
- Ahmed Badayi, S.; Matemilola, B.; Bany-Ariffin, A.; Lau, W.T. Does corporate social responsibility influence firm probability of default? Int. J. Financ. Econ. 2020. [Google Scholar] [CrossRef]
- Drago, D.; Carnevale, C.; Gallo, R. Do corporate social responsibility ratings affect credit default swap spreads? Corp. Soc. Responsib. Environ. Manag. 2019, 26, 644–652. [Google Scholar] [CrossRef]
- Sharma, S.; Vredenburg, H. Proactive Corporate Environmental Strategy and the Development of Competitively Valuable Capabilities. Strateg. Manag. J. 1998, 19, 729–753. [Google Scholar] [CrossRef]
- KPMG. The KPMG Survey of Sustainability Reporting 2020. Technical Report. 2020. Available online: https://home.kpmg/xx/en/home/insights/2020/11/the-time-has-come-survey-of-sustainability-reporting.html (accessed on 28 June 2021).
- Shabana, K.; Buchholtz, A.; Carroll, A. The Institutionalization of Corporate Social Responsibility Reporting. Bus. Soc. 2017, 56, 1107–1135. [Google Scholar] [CrossRef]
- Borghesi, R.; Houston, J.F.; Naranjo, A. Corporate socially responsible investments: CEO altruism, reputation, and shareholder interests. J. Corp. Financ. 2014, 26, 164–181. [Google Scholar] [CrossRef]
- Omer, A.M. Green energies and the environment. Renew. Sustain. Energy Rev. 2008, 12, 1789–1821. [Google Scholar] [CrossRef]
- Pätäri, S.; Arminen, H.; Tuppura, A.; Jantunen, A. Competitive and responsible? The relationship between corporate social and financial performance in the energy sector. Renew. Sustain. Energy Rev. 2014, 37, 142–154. [Google Scholar] [CrossRef]
- Vazza, D.; Aurora, D.; Kraemer, N.; Kesh, S.; Torres, J. Annual 2006 Global Corporate Default Study and Ratings Transitions; Technical Report; Standard & Poor’s: New York, NY, USA, 2007. [Google Scholar]
- Vazza, D.; Aurora, D.; Kraemer, N. 2007 Annual Global Corporate Default Study and Rating Transitions (Premium); Technical Report; Standard & Poor’s: New York, NY, USA, 2008. [Google Scholar]
- Standard & Poor’s. 2010 Annual Global Corporate Default Study and Rating Transitions; Technical Report; Standard & Poor’s: New York, NY, USA, 2011. [Google Scholar]
- Vazza, D.; Kraemer, N. 2011 Annual Global Corporate Default Study and Rating Transitions; Standard & Poor’s: New York, NY, USA, 2012. [Google Scholar]
- Vazza, D.; Kraemer, N. 2012 Annual Global Corporate Default Study and Rating Transitions; Standard & Poor’s: New York, NY, USA, 2013. [Google Scholar]
- Vazza, D.; Kraemer, N. 2013 Annual Global Corporate Default Study and Rating Transitions; Standard & Poor’s: New York, NY, USA, 2014. [Google Scholar]
- Vazza, D.; Kraemer, N. 2014 Annual Global Corporate Default Study and Rating Transitions; Standard & Poor’s: New York, NY, USA, 2015. [Google Scholar]
- Vazza, D.; Kraemer, N. 2015 Annual Global Corporate Default Study and Rating Transitions; Standard & Poor’s: New York, NY, USA, 2016. [Google Scholar]
- Vazza, D.; Kraemer, N. 2016 Annual Global Corporate Default Study and Rating Transitions; Standard & Poor’s: New York, NY, USA, 2017. [Google Scholar]
- Vazza, D.; Kraemer, N. 2017 Annual Global Corporate Default Study and Rating Transitions; Standard & Poor’s: New York, NY, USA, 2018. [Google Scholar]
- Capelle-Blancard, G.; Crifo, P.; Diaye, M.A.; Oueghlissi, R.; Scholtens, B. Sovereign bond yield spreads and sustainability: An empirical analysis of OECD countries. J. Bank. Financ. 2019, 98, 156–169. [Google Scholar] [CrossRef]
- Shumway, T. Forecasting Bankruptcy More Accurately: A Simple Hazard Model. J. Bus. 2001, 74, 101–124. [Google Scholar] [CrossRef] [Green Version]
- Fitch Ratings. ESG in Credit; Technical Report; White Paper; Fitch Ratings: New York, NY, USA, 2020. [Google Scholar]
- Ilhan, E.; Sautner, Z.; Vilkov, G. Carbon Tail Risk. Rev. Financ. Stud. 2021, 34, 1540–1571. [Google Scholar] [CrossRef]
- PRI. Shifting Perceptions: ESG, Credit Risk and Ratings—Part 1: The State of Play. Technical Report. 2017. Available online: https://www.unpri.org/download_report/36678 (accessed on 27 June 2021).
- Bebchuk, L.A.; Cohen, A.; Wang, C.C. Learning and the disappearing association between governance and returns. J. Financ. Econ. 2013, 108, 323–348. [Google Scholar] [CrossRef] [Green Version]
- Gompers, P.; Ishii, J.; Metrick, A. Corporate Governance and Equity Prices. Q. J. Econ. 2003, 118, 107–156. [Google Scholar] [CrossRef] [Green Version]
- REN21. Renewables 2020 Global Status Report. Technical Report. 2020. Available online: https://www.ren21.net/gsr-2020/ (accessed on 25 June 2021).
- Wooldridge, J.M. Econometric Analysis of Cross Section and Panel Data; MIT Press: Cambridge, MA, USA, 2002. [Google Scholar]
- Petersen, M.A. Estimating Standard Errors in Finance Panel Data Sets: Comparing Approaches. Rev. Financ. Stud. 2009, 22, 435–480. [Google Scholar] [CrossRef] [Green Version]
- Choi, I. Unit root tests for panel data. J. Int. Money Financ. 2001, 20, 249–272. [Google Scholar] [CrossRef]
- Orlando, G.; Pelosi, R. Non-Performing Loans for Italian Companies: When Time Matters. An Empirical Research on Estimating Probability to Default and Loss Given Default. Int. J. Financ. Stud. 2020, 8, 68. [Google Scholar] [CrossRef]
- Altman, E.I. Financial Ratios, Discriminant Analysis and the Prediction of Corporate Bankruptcy. J. Financ. 1968, 23, 589–609. [Google Scholar] [CrossRef]
- Altman, E.I. Corporate Credit Scoring–insolvency Risk Models. In Corporate Financial Distress and Bankruptcy; John Wiley & Sons, Ltd.: Hoboken, NJ, USA, 2011; Chapter 11; pp. 231–264. [Google Scholar]
- Foerster, S.R.; Sapp, S.G. Valuation of financial versus non-financial firms: A global perspective. J. Int. Financ. Mark. Inst. Money 2005, 15, 1–20. [Google Scholar] [CrossRef]
- Zmijewski, M.E. Methodological Issues Related to the Estimation of Financial Distress Prediction Models. J. Account. Res. 1984, 22, 59–82. [Google Scholar] [CrossRef]
- Drempetic, S.; Klein, C.; Zwergel, B. The Influence of Firm Size on the ESG Score: Corporate Sustainability Ratings Under Review. J. Bus. Ethics 2020, 167. [Google Scholar] [CrossRef]
- Hahn, R.; Kühnen, M. Determinants of sustainability reporting: A review of results, trends, and opportunities in an expanding field of research. J. Clean. Prod. 2013, 59, 5–21. [Google Scholar] [CrossRef]
- Russo, A.; Perrini, F. Investigating Stakeholder Theory and Social Capital: CSR in Large Firms and SMEs. J. Bus. Ethics 2010, 91, 207–221. [Google Scholar] [CrossRef]
- Henisz, W.J.; McGlinch, J. ESG, Material Credit Events, and Credit Risk. J. Appl. Corp. Financ. 2019, 31, 105–117. [Google Scholar] [CrossRef]
- Dorfleitner, G.; Halbritter, G.; Nguyen, M. Measuring the level and risk of corporate responsibility–An empirical comparison of different ESG rating approaches. J. Asset Manag. 2015, 16, 450–466. [Google Scholar] [CrossRef]
- Technical Expert Group on Sustainable Finance. Taxonomy: Final Report of the Technical Expert Group on Sustainable Finance; Technical Report; European Union: Brussel, Belgium, 2020. [Google Scholar]
- Refinitiv. Environmental, Social and Governance (ESG) Scores from Refinitiv; Technical Report; Refinitiv: New York, NY, USA, 2021. [Google Scholar]
Figure 1.
Influence of ESG performance on the probability of default over time. This figure shows the results of OLS models estimated with annual extending window samples starting with the first year covered by the study, 2002. The dependent variable is the probability of default (). The independent variable is ESG or one of the associated pillar scores. In addition, abnormal returns () and idiosyncratic volatility are added as market-driven control variables. Due to the small number of observations, the first two time windows are neglected. The coefficient for the year 2017 corresponds to the coefficients from models (5)–(8) in Table 2. The thicker inner bar describes the estimated standard error ( confidence interval), while the thinner error bar depicts the confidence interval. All models are controlled for industry-fixed effects based on the Global Industry Classification Standard’s (GICS). We report robust cluster-adjusted standard errors on firm-level. The corresponding Table A1 can be found in the Appendix A.

Figure 2.
Sectoral analysis of the influence of ESG on the probability of default. This figure shows the results in separately examining the effect of on for each industry based on the Global Industry Classification Standard’s (GICS) by using OLS regression models. The independent variable is or the associated pillar scores (E, S or G). In addition, abnormal returns () and idiosyncratic volatility are added as market-driven control variables. All models are controlled for year-fixed effects. The thicker inner bar describes the estimated standard error (68% confidence interval), while the thinner error bar depicts the 95% confidence interval. The associated results can be observed in Table A1. A description of the variables can be found in Table A3. We report robust cluster-adjusted standard errors on firm-level.

Table 1.
Descriptive Statistics. This table presents summary statistics for the variables used in this paper. The sample consists of 902 US firms. The definitions of the involved variables are provided in Appendix A Table A3.
Table 1.
Descriptive Statistics. This table presents summary statistics for the variables used in this paper. The sample consists of 902 US firms. The definitions of the involved variables are provided in Appendix A Table A3.
| Obs. | Minimum | Maximum | Mean | Median | Standard Deviation | |
|---|---|---|---|---|---|---|
| PD | 7774 | 0.0000 | 28.8500 | 0.6545 | 0.2400 | 1.6503 |
| ESG | 6994 | 0.6250 | 95.0733 | 42.8084 | 40.6092 | 19.6751 |
| E | 6994 | 0.0000 | 98.5288 | 29.4241 | 22.2561 | 28.8941 |
| S | 6994 | 0.8260 | 97.7517 | 44.3801 | 41.7488 | 21.3936 |
| G | 6994 | 0.2516 | 98.5049 | 51.5762 | 52.9908 | 22.2557 |
| Volatility | 7776 | 0.0766 | 1.6521 | 0.2521 | 0.2113 | 0.1442 |
| Abnormal Return (AR) | 7776 | −2.4462 | 2.5907 | −0.0108 | 0.0089 | 0.2783 |
| WC/TA | 5935 | −0.3193 | 0.7681 | 0.1241 | 0.1001 | 0.1433 |
| RE/TA | 7769 | −8.8191 | 2.3369 | 0.1980 | 0.1785 | 0.4214 |
| EBIT/TA | 7774 | −2.7568 | 1.2852 | 0.0871 | 0.0767 | 0.0863 |
| ME/TL | 7042 | 0.0063 | 37.5695 | 2.0685 | 1.4178 | 2.3964 |
| S/TA | 7774 | −0.0524 | 5.7449 | 0.7746 | 0.6135 | 0.6916 |
| NI/TA | 7774 | −2.2832 | 1.0235 | 0.0464 | 0.0418 | 0.0754 |
| TL/TA | 7773 | 0.0317 | 2.3667 | 0.6598 | 0.6427 | 0.2023 |
| CA/CL | 5939 | 0.1749 | 17.3875 | 1.7144 | 1.4840 | 0.9993 |
| Size | 7774 | 4.8543 | 14.7606 | 9.4016 | 9.1773 | 1.4063 |
Table 2.
ESG performance and the probability of default. In this table, the results from the univariate regression analysis (models (1)–(4)) for ESG Score and the associated pillar score are shown. Additionally, the models are extended into multivariate analysis by adding idiosyncratic volatility and abnormal returns in models (5)–(8), which are estimated by using a simple market model. In order to account for heterogeneities between different industries and years, the models have been estimated with years and industry fixed effects (FE) based on the Global Industry Classification Standard’s (GICS) sector classification. We report robust cluster-adjusted standard errors on firm-level in parentheses, where ***, ** and * denotes the coefficient’s statistical significance at the 1%, 5% and 10% levels.
| Dependent Variable: PD | (1) | (2) | (3) | (4) | (5) | (6) | (7) | (8) |
|---|---|---|---|---|---|---|---|---|
| ESG | −0.0134 *** | −0.0062 *** | ||||||
| (0.0015) | (0.0012) | |||||||
| E | −0.0088 *** | −0.0038 *** | ||||||
| (0.0011) | (0.0010) | |||||||
| S | −0.0118 *** | −0.0060 *** | ||||||
| (0.0014) | (0.0009) | |||||||
| G | −0.0069 *** | −0.0035 *** | ||||||
| (0.0015) | (0.0013) | |||||||
| Volatility | 6.3159 *** | 6.3512 *** | 6.3310 *** | 6.4681 *** | ||||
| (0.9597) | (0.9631) | (0.9404) | (0.9489) | |||||
| Abnormal Return | 0.2774 ** | 0.2789 ** | 0.2811 ** | 0.2919 ** | ||||
| (0.1162) | (0.1161) | (0.1160) | (0.1165) | |||||
| Observations | 6992 | 6992 | 6992 | 6992 | 6992 | 6992 | 6992 | 6992 |
| Industry FE | yes | yes | yes | yes | yes | yes | yes | yes |
| Year FE | yes | yes | yes | yes | yes | yes | yes | yes |
| Adjusted R-Squared | 0.0228 | 0.0197 | 0.0213 | 0.0082 | 0.1705 | 0.1693 | 0.1710 | 0.1679 |
Table 3.
ESG scores and the probability of default with additional controls. In this table, the results from the OLS models that take further firm controls into account are shown, which consists of various accounting variable ratios. The dependent variable is probability of default. We report robust cluster-adjusted standard errors on firm-level in parentheses, where ***, ** and * denotes the coefficient’s statistical significance at the 1%, 5% and 10% levels.
| Dependent Variable: PD | (1) | (2) | (3) | (4) |
|---|---|---|---|---|
| ESG | −0.0033 ** | |||
| (0.0016) | ||||
| E | −0.0021 * | |||
| (0.0013) | ||||
| S | −0.0032 *** | |||
| (0.0011) | ||||
| G | −0.0018 | |||
| (0.0018) | ||||
| Volatility | 4.7083 *** | 4.7170 *** | 4.7202 *** | 4.7830 *** |
| (0.5755) | (0.5851) | (0.5582) | (0.5587) | |
| Abnormal Return | 0.1342 | 0.1344 | 0.1362 | 0.1423 |
| (0.1119) | (0.1120) | (0.1123) | (0.1123) | |
| Observations | 5197 | 5197 | 5197 | 5197 |
| Industry Fixed Effects | yes | yes | yes | yes |
| Year Fixed Effects | yes | yes | yes | yes |
| Additional Controls | yes | yes | yes | yes |
| Adjusted R-Squared | 0.2758 | 0.2755 | 0.2760 | 0.2750 |
Table 4.
ESG scores and the probability of default with size interaction. This table shows the extended models where interactions between ESG variables and firm size are considered. The independent variable is the probability of default while firm size is defined as the natural logarithm of total assets. We report robust cluster-adjusted standard errors on firm-level in parentheses, where ***, ** and * denotes the coefficient’s statistical significance at the 1%, 5% and 10% levels.
| Dependent Variable: PD | (1) | (2) | (3) | (4) |
|---|---|---|---|---|
| −0.0003 ** | ||||
| (0.0002) | ||||
| −0.0002 * | ||||
| (0.0001) | ||||
| −0.0003 *** | ||||
| (0.0001) | ||||
| −0.0002 | ||||
| (0.0002) | ||||
| Volatility | 4.6742 *** | 4.7043 *** | 4.6861 *** | 4.7346 *** |
| (0.5837) | (0.5888) | (0.5669) | (0.5706) | |
| Abnormal Return | 0.1333 | 0.1342 | 0.1355 | 0.1398 |
| (0.1116) | (0.1117) | (0.1120) | (0.1119) | |
| Observations | 5197 | 5197 | 5197 | 5197 |
| Industry Fixed Effects | yes | yes | yes | yes |
| Year Fixed Effects | yes | yes | yes | yes |
| Additional Controls | yes | yes | yes | yes |
| Adjusted R-Squared | 0.2761 | 0.2755 | 0.2762 | 0.2755 |
Publisher’s Note: MDPI stays neutral with regard to jurisdictional claims in published maps and institutional affiliations. |
© 2021 by the authors. Licensee MDPI, Basel, Switzerland. This article is an open access article distributed under the terms and conditions of the Creative Commons Attribution (CC BY) license (https://creativecommons.org/licenses/by/4.0/).
Share and Cite
MDPI and ACS Style
Aslan, A.; Poppe, L.; Posch, P. Are Sustainable Companies More Likely to Default? Evidence from the Dynamics between Credit and ESG Ratings. Sustainability 2021, 13, 8568. https://doi.org/10.3390/su13158568
AMA Style
Aslan A, Poppe L, Posch P. Are Sustainable Companies More Likely to Default? Evidence from the Dynamics between Credit and ESG Ratings. Sustainability. 2021; 13(15):8568. https://doi.org/10.3390/su13158568
Chicago/Turabian StyleAslan, Aydin, Lars Poppe, and Peter Posch. 2021. "Are Sustainable Companies More Likely to Default? Evidence from the Dynamics between Credit and ESG Ratings" Sustainability 13, no. 15: 8568. https://doi.org/10.3390/su13158568
Note that from the first issue of 2016, this journal uses article numbers instead of page numbers. See further details here.