Article

LCA of the Collection, Transportation, Treatment and Disposal of Source Separated Municipal Waste: A Southern Italy Case Study

1
Department of Industrial Engineering (DIIN), University of Salerno, via Giovanni Paolo II 132, 84084 Fisciano (Sa), Italy
2
M.Sc. in Env. Science, Via R. Nicodemi 34, 84084 Fisciano (Sa), Italy
3
Agenzia Regionale per la Protezione dell’Ambiente della Campania, Via Vicinale Santa Maria del Pianto, Centro Polifunzionale, Torre n. 1, 80143 Naples, Italy
*
Author to whom correspondence should be addressed.
Sustainability 2016, 8(11), 1084; https://doi.org/10.3390/su8111084
Submission received: 23 July 2016 / Revised: 19 September 2016 / Accepted: 19 October 2016 / Published: 25 October 2016

Abstract

:
This study performed a Life Cycle Assessment of the collection, transport, treatment and disposal of source-separated municipal waste (MW) in Baronissi, a town of 17,000 inhabitants in the Campania region of Italy. Baronissi is a high-performing town in a region with scarcity of MW facilities. The environmental impacts were assessed with three different methods—IPCC 2007, Ecological Footprint and ReCiPe 2008—in order to evaluate how they influence the results as well as how the global warming affects the results, since it is one of the major environmental concerns of people. The obtained results showed how the presence of facilities in the area is fundamental. Their lack means high environmental loads due to the transportation of materials for long distances, particularly for the organic fraction. The presence of a composting plant at 10 km from the municipality would result in a decrease of 65% of the impacts due to the external transport, regardless of the evaluation method. The results obtained with ReCiPe 2008 and Ecological Footprint agreed, while those obtained with IPCC 2007 were very different since global warming is strongly affected by the transport phase. IPCC 2007 does not allow to take into account the advantages obtainable with a good level of separate collection. Considering a single impact evaluation method, there is a high risk of coming to misleading conclusions.

Graphical Abstract

1. Introduction

Four hierarchical subsequent levels are at the base of a proper waste management system, according to the European Union strategy: (1) reduction of waste production; (2) recovery of material; (3) recovery of energy; and finally, (4) landfill disposal (EU, 2006).
Between (1) and (2) there are the source-separated collection systems that allow for the recovery of secondary raw materials from municipal waste (MW). There are different types of separate collection: the bring system and the house-to-house kerbside collection system [1]. The main difference between the two collection methods is that with the house-to-house kerbside collection system, there are no stable street containers and the citizens have to put out the different waste fractions daily based on a detailed collection schedule [2].
The use of infrastructure, equipment and vehicles needed for the delivery of waste by the citizens and their subsequent collection and transportation to the MW facilities produces several environmental impacts (due to the consumption of raw materials and energy as well as pollutant emissions). The procedure of Life Cycle Assessment (LCA) is able to effectively evaluate these environmental impacts [3].
LCA is one of the more useful instruments since it allows to evaluate the environmental performance of alternative systems considering both the whole life cycle (i.e., from cradle-to-grave) and only some parts (e.g., from cradle to gate or from gate to grave, as in the case of MW management) [4].
LCA allows to carry out comparisons between systems considering resource consumption and pollutant emissions in the environment by including the extraction of raw materials, processing, manufacture, use and end of life of these systems [5].
LCA is a powerful decision making tool when it is applied to the waste management sector, because it is able to consider both site-specific conditions and improvement opportunities [6]. A sustainable waste management system requires a multidisciplinary approach; consequently, it is necessary to adopt a holistic view of the system [7].
The early studies of LCA applied to waste management systems date back to the early nineties [8]. During the subsequent years, the application of the methodology to the waste sector was increasingly refined in order to follow the growing modelling complexity. In most of the studies, LCA was applied to MW trying to take into account different aspects of the problem [6].
Some authors focused on aspects related to the management of waste disposal processes, comparing the environmental impacts of alternative treatment systems. Some examples concern the assessment of the most environmentally sound plastic waste management scenario [9], or the comparison between possible scenarios for the residual waste treatment [10,11], or the evaluation of alternative strategies for organic waste disposal [12,13].
Other authors expanded the system boundaries, also taking into account logistical or transportation aspects (e.g., different waste collection alternatives). In fact, there are studies dealing with the application of LCA to alternative scenarios of MW management in relation to different separate collection systems or different collection percentages [2,14,15,16].
These studies provided important results such as:
  • for higher separate collection percentages, it is preferable to adopt a management system finalized to materials recovery and recycling rather than to incineration [14];
  • it is important to correctly define the recycling rate for each recovered material, together with the percentage of separate collection [2];
  • it is necessary to support waste management systems based on the separate collection with suitable facilities for the treatment of all the separately collected fractions [15].
Other authors also evaluated the influence of governmental and social aspects on MW management systems; they showed that these aspects could play an important role in decreasing the efficiency that waste treatment plants could provide [17].
An important aspect highlighted from many of these studies is that the obtained results are site-specific [6,8]. The availability of MW treatment facilities in the territory under study is an example of the importance of local specific conditions. In fact, the lack of near facilities generates environmental impacts due to waste transportation over long distances with a worsening of the global environmental performance of the waste management system.
The present study arises in this context. It proposes an LCA study of the collection, transportation, treatment and disposal of the source-separated MW in Baronissi, a town of around 17,000 inhabitants in the Province of Salerno, in the Campania region of Italy [1]. The impacts of the waste management system under study were calculated with three different evaluation methods—IPCC 2007, Ecological Footprint and ReCiPe 2008—in order to assess how the choice of the method could affect the results. In fact, the three adopted methods differ for the increasing level of complexity as well as for number and type of environmental impact categories considered.
The municipality of Baronissi is a high-performing town in terms of waste management if compared with the regional context. In fact, in the whole region there is a scarcity of suitable MW facilities, especially for the treatment of recyclable and compostable materials. In order to evaluate the positive effects due to the presence of near treatment facilities, a part of the study deals with the comparison of the environmental performance of today’s waste management system, and that of an alternative future scenario where a composting plant has been planned for the aerobic treatment of waste organic fraction at 10 km from the town.

2. Material and Methods

2.1. The Area and the Separated Collection System under Study

The study was performed in 2014 for the town of Baronissi in the province of Salerno, in the Campania region of Southern Italy. The population of Baronissi was 16,820 inhabitants with a population density of 942.3 inhabitants/km2 (corresponding to an area of 17.85 km2). The town has one principal centre and twelve geographical districts.
The following MW components were separately collected by means of a kerbside collection system: organic for composting (three times a week); paper and cardboard (once a week); glass (twice a month); aluminium and other metals together with plastic for recycling (twice a week); non-recycling residues for RDF production (twice a month); sanitary towels, nappies and incontinence pads (six days a week); bulk refuses and Waste Electrical and Electronic (WEEE); used clothing and, finally, hazardous MW.
One of the principal features of the Baronissi system is the frequency of collection for non-recycling residues that is typical of some areas of Northern Italy, like Consorzio Priula, in the Province of Treviso [18]. In the Central-Southern Italy, this is a novelty. The adoption of this solution, together with the opening of a Separate Collection Centre (SCC), allowed the municipality of Baronissi to improve the percentage of separate collection. Moreover, it allowed to reduce the waste fee in the period 2010–2012: 5% during 2010, 5% during 2011, and 7% during 2012, when the Municipality of Baronissi received a Green Public Procurement Award from the Italian Ministry of Economy and Finance [1].
SCCs are centralised collection sites where the citizens can deliver the recyclable fractions of MW, integrating the two collection modalities as well as exploiting the advantages of the two systems and minimizing their defects [19].
Organic and recyclable materials were sent out of the Campania region due to the absence of treatment facilities [20], while non-recycling residues were treated in a RDF production plant in the town of Battipaglia, in the Province of Salerno. Each MW component was directly collected near the home of every resident except for bulk refuse and WEEE, which were collected on demand or directly delivered to the SCC of the city. The waste cooking oil could only be delivered to the SCC [1].
The construction of the SCC was completed in 2009, but it was only opened to the public in 2010 due to red tape issues. In Italy, the construction and management of separate collection centres (named “municipal collection centres”) are specifically regulated by the Ministry Decree of 8 April 2008, as amended and supplemented by the Decree of the Ministry of the Environment dated 13 May 2009. Citizens can directly deliver to the SCC all the MSW separate collection fractions, except putrescible materials and non-recycling residues [1].

2.2. The LCA Approach

The performed LCA study took into account the level of separated collection, the location of treatment and disposal facilities, the management of the collection program and the transportation of the collected materials inside (performed with a separate kerbside collection system) and outside the town (transportation toward the facilities).
The assessment was developed regarding two scenarios: (1) the treatment and disposal, collection and external transportation scenario for the year 2013 (Scenario 1); (2) an alternative scenario, differing from Scenario 1 by the presence of a composting plant at 10 km from the town of Baronissi, without a transfer station (Scenario 2).
The LCA was performed using the software tool SimaPro v.7.3 (PRé Consultants, Amersfoort, The Netherlands), using the Ecoinvent 2.2 database and a modelling approach developed subsequently [3].
The goal and scope of the study was the use of LCA to calculate the resources used and the environmental impacts produced to carry out the MW kerbside separate collection service of the town under study in a year. The function of the LCA study was the activities of the MW components delivery by citizens and the subsequent collection and transport to the MW facilities, while the functional unit (i.e., unit of output for which results will be presented [21]) was one ton of waste with a defined composition and, finally, the reference flow (i.e., the flow to which all other modelled flows of the system are related [22]) was quantified as the amount of waste treated in a year.
It was hypothesized that MW was only composed by the following components: aluminium, steel, glass, organic, paper and cardboard, HDPE plastic, PET plastic, mix plastic, plastic discards.
Table 1 shows the average composition analysis of the total MW, the source-separated fractions and, finally, the unsorted residual waste (i.e., the residue). Materials amounts in the residue were calculated on the base of the composition analysis of MW and the MW fractions separately collected.
Regarding the modelling of the waste treatment plants for the different MW fractions unfortunately, some site-specific data are not available and this is a limitation of the study; for this reason the processes of the Ecoinvent System v.2 database were used, as shown in Table 2. Table 3 shows the main features as well as data of the Mechanical Biological Treatment plant (MBT) [23] and recycling plants for plastics materials [24].
For the modelling of the vehicles used for waste transportation, the processes of the Ecoinvent System v.2 database were also used (see Table 4). Table 4 also shows the distance covered by the vehicles for the separate collection of the different materials and the distance for the transportation from the SCC to the waste treatment plants for each single material.
The environmental impacts were evaluated using three methods: IPCC 2007 GWP 100y, Ecological Footprint, and ReCiPe 2008 H.
The IPCC 2007 GWP 100y indicator is based on the factors of climate change over a period of 100 years, considering the gaseous emissions of high potential greenhouse effect [25]. The Ecological footprint method calculates the amount of biologically productive land and water required by a population to produce the resources it consumes and to dispose of the waste generated by the consumption of fossil and nuclear fuel [25]. The ReCiPe 2008 H indicator combines a midpoint level approach (problem-oriented) with an endpoint approach (damage-oriented) considering impact categories such as ozone depletion, agricultural land occupation, fresh water depletion, fossil fuel depletion, etc. The hierarchist perspective (H) is based on the most common policy principles concerning the time frame and other issues [26].
The three adopted methods have an increasing level of complexity. Global warming is the unique impact category taken into account with the IPCC method, and thus it represents 100% of the method. Instead, in the Ecological Footprint, global warming is one category out of three, thus numerically it represents 33% of all the categories. Finally, in the case of ReCiPe 2008, the global warming appears one time out of eighteen (corresponding to 5.9%) at the midpoint level, and two times out of seventeen at the endpoint level (11.8%). With ReCiPe, going from the midpoint to the endpoint categories, each single impact is weighted according to the adopted perspective (H in this study).

3. Results and Discussion

3.1. Analysis of Scenario 1 with IPCC 2007 100y

Table 5 shows the results obtained with IPCC 2007 100y in terms of the environmental impacts of each considered material for the treatment phase, collection phase and external transport to the treatment and disposal facilities. It also contains the percentage contribution (in absolute terms) that each material provides to the total value for the different phases.
Negative values represent an advantage in environmental terms because impacts are avoided. If a process provides negative impacts, it means that, after its adoption, the avoided impacts are greater than the produced impacts.
As shown in Table 5, the impact values related to the treatment and disposal of the collected materials produce an overall negative impact (with positive and negative values for the single phases). On the other hand, the collection and external transport phases produce only positive impacts. It is worth noting that with IPCC 2007 100y, the overall environmental impacts of the waste management system of Baronissi municipality was positive. In fact, in terms of carbon footprint, the environmental burdens of the transport phases overcame the environmental benefits of the recycling and recovery phases.
In terms of total impact, for eight materials (i.e., aluminium, steel, glass, paper and cardboard, HDPE and PET from the separate collection; aluminium from the residual waste) out of sixteen (namely the 50%), the values of the impacts correspond to avoided impacts. The other eight materials gave positive impacts, with the organic fraction from the separated collection being the most impacting.
Regarding the source-separated organic fraction, the major contributors to the total impact were the collection and external transport. This depended on two factors: the large amounts collected and long distances to reach the composting plants outside the region.
Only four materials provided a percentage contribution greater than 10%: the source-separated aluminium (10.8%), the residual organic fraction (11.8%), the source-separated PET (11.5%), and the PET in the residue (14.5%).
The results obtained for the source-separated aluminium confirm the importance of the aluminium recycling in terms of global warming saving as already reported in other studies [2,27].
It is worth noting that the source-separated PET contributed to the total global warming burden as avoided impact, whilst the residual PET generated positive impacts. In fact, on the one hand, recycling is the treatment for the source-separated plastic materials, while, on the other, incineration is the disposal method for the residual plastic materials. The obtained results emphasize the importance of the separate collection. In particular, the source separation of the plastic materials avoids the consumption of fossil fuels, on the one hand, and avoids the generation of hazardous pollutants due to the incineration processes, on the other [28].
As shown in Table 5, the organic fraction provided the greatest percentage contribution to the total impact for both the internal collection and external transportation. The high quantity of material produced as well as the long distances to reach the treatment plants were the main reasons for such an occurrence.
The phase of internal collection of source-separated paper and cardboard gave another important contribution for the total impact due to the large quantities produced. Finally, the external transportation of glass phase gave a significant contribution due to the long distances to reach the treatment plants.

3.2. Analysis of Scenario 1 with Ecological Footprint and ReCiPe 2008 H

Table 6 shows the single point environmental impacts generated from the treatment phase, internal collection and external transport to facilities for each considered material calculated with Ecological Footprint and ReCiPe 2008 H. Analogously to IPPC 2007, for both the methods, the processing materials phase overall generated a negative impact, while the collection and external transport phases generated positive impacts.
However, for both the methods, contrary to what happened with IPCC 2007, the overall environmental impacts of the waste management system were negative, because the total avoided impacts of the treatment and disposal phases overcame the environmental loads produced by the collection and external transport phases.
The IPCC method, that only considers the impact category of the global warming, tends to overestimate the environmental burden of the transport phase compared with the avoided impacts of the treatment and disposal phases. Thus, the carbon footprint is not able to take into account the different advantages obtainable with a good level of separate collection and consequent recovery of materials. In fact, only considering the obtained results from a global warming perspective, it had to be concluded that it would not be convenient to push for an increase of the separate collection level.
Analysing the results for each single MW fraction, with Ecological Footprint and ReCiPe 2008 H, ten materials out of sixteen gave total avoided impacts. They were the same eight of the IPPC plus the source-separated organic fraction and the source-separated plastic mix.
The source-separated organic fraction goes to the composting process for the production of an agriculture soil conditioner (i.e., the compost) with a proper fertilising capacity [29,30]. The use of compost avoids the production of mineral fertilizers. Due to their multiple-issues approach, Ecological Footprint and ReCiPe 2008 are able to take into consideration the avoided impacts due to the avoided production of mineral fertilizers. On the other hand, due to its single-issue approach, IPCC 2007 is not able to consider all the advantages and drawbacks of the recovery of materials and energy obtainable with the source-separated collection.
The recycling process of the source-separated plastics mix provides recycled plastic as a final product to use as street furniture components (benches, fences, planters); this would avoid using wood for the construction of such components [24]. Analysing the contributions of each damage category of Ecological Footprint (see Table 7), it is evident that Land occupation predominates largely over the others and provides a contribution in terms of avoided impact, while the category that takes into account the CO2 production contributes with a positive impact. This is in line with the results obtained with the IPCC method that, in fact, assigns a positive impact to the treatment source-separated plastic mix.
The Land occupation category of Ecological Footprint takes into account the avoided wood, replaced by recycled heterogeneous plastic. In fact, this category expresses the direct use of soil that is the quantity of biologically productive land needed to produce the resources consumed [25] and therefore, in this specific case, it expresses the avoided utilization of land required in the production of wood.
The climate change impact category itself will not be able to evaluate properly all the aspects related to the recycling processes.
Similarly, ReCiPe 2008 takes into account the benefit of the avoided use of wood through one of its endpoints categories: damage to ecosystems. In fact, this category is the one that most influences the total impact and contributes in terms of avoided impact (see Table 7).
Even for Ecological Footprint and ReCiPe 2008 H, it is interesting to analyse the obtained results in terms of percentage contributions that the impact of each single phase gave to the total impact, at the endpoint level (at the midpoint level this is obviously not possible due to the different impact category indicators). Table 8 shows only the percentage contributions relating to the treatment phase of materials because for the phases of internal collection and external transport, the percentage contributions are very similar to those obtained with IPCC (see Table 5).
Regarding the results obtained with the Ecological Footprint, only the treatment of two materials provided a percentage contribution greater than 10%: the source-separated paper and cardboard (42.4%), and the source-separated PET (10%). While, in terms of ReCiPe 2008 H, three fractions gave a contribution greater than 10%: the source-separated paper and cardboard (27.5%), the source-separated PET (16.2%), and the source-separated steel (11.9%).
The source-separated paper and cardboard, especially in terms of Ecological Footprint but also for ReCiPe 2008 H, gave a predominant percentage incidence compared with the other materials. On the contrary, with IPCC, the contribution to the total provided by the source-separated paper and cardboard was only 5.8%.
To understand why the recycling process of source-separated paper and cardboard had such a significant influence on the total impacts calculated with Ecological Footprint and ReCiPe 2008 H, it is necessary to go into the details of the impact/damage categories of these two methods (see Table 7).
Even in this case, as for the recycling process of source-separated plastics mix, the categories that most influenced the total impact giving a contribution in terms of avoided impacts were Land occupation for Ecological Footprint and Ecosystem for ReCiPe 2008. The use of recycled paper avoids the production of virgin paper for the same use: Ecological Footprint and ReCiPe 2008 H are able to take better into account the positive effects of the avoided production of virgin paper while regarding the problem of the deforestation.
It is interesting to carry out a focus on the results obtained with ReCiPe 2008 in order to evaluate what were the impact categories that contributed the most to the total impact of the waste management system (Scenario 1).
Among the categories that contributed for more than one percent, only Climate change provided a positive impact, thus representing an environmental burden.
Agricultural land occupation is the impact category that contributed the most (as an environmental saving) to the total impact with 36.3%; at the midpoint level, this impact was equal to −2,133,180 m2/year (corresponding to −126.8 m2/year/inhabitant). Fossil depletion and Metal depletion provided a percentage contribution of 28.4% and 16.2%, respectively; the impacts at midpoint level were equal to −274,099 kg oil eq. (corresponding to −16.3 kg oil eq./inhabitant) and −362,475 kg Fe eq. (corresponding −21.6 kg Fe eq./inhabitant), respectively. The results obtained for such categories highlight the environmental advantages achievable with a good level of source-separate collection that allows to recycle materials and, thus, to avoid the use of virgin raw materials.
The other two categories that contributed for more than one percent even providing a negative impacts were Particulate matter formation (3.0%; −1211.5 kg PM10 eq.) and Human toxicity (2.2%; −329,017 kg DB eq.). As already mentioned, Climate change was the only category, among those with a contribution more than one percent, that provided a positive value of impact (500,940 kg CO2 eq., corresponding to 29.8 kg CO2 eq./inhabitant). Such category at endpoint level is considered for damage caused to human health (Climate change Human Health) as well as for ecosystems damage (Climate change Ecosystems), and together they provided a contribution to the total impact of about 12%. The positive value of the impact is not a surprise and the reasons are the same previously discussed for the results obtained with the IPCC 2007 method.
The results highlight the importance of considering more than one single impact assessment method or, alternatively, more environmental impact categories in order to be able to assess all the different aspects related to the analysed processes. Considering more impact categories, it is important to try to put together the results obtained for the single categories. In fact, it is necessary to remember that LCA is a procedure to support decision makers. From this point of view, it is difficult to take decisions if the midpoint impact categories give conflicting results. In current literature, there are many studies discussing the results of LCA studies for each single impact category (usually global warming, acidification, eutrophication, etc.) without trying to give some suggestions to the decision makers. The damage categories at the endpoint level offer a valuable help in this sense.

3.3. Scenario 1 vs. Scenario 2

The obtained results highlighted the importance of the source-separate organic fraction collection and transportation to the treatment plants. This material contributed for 40% of the total impact of the internal collection and for 67% to the total impact of the external transport, with all the evaluation methods considered. As discussed above, there were two main reasons for this result: the high quantities collected as well as the huge distances to transport these quantities to the treatment plants located out of the region.
In order to highlight, in environmental terms, the importance of the presence on the territory of adequate treatment facilities, a second scenario was modelled in which the presence of a composting plant 10 km from the municipality of Baronissi was hypothesized. Comparing the environmental performances of the two scenarios, it was possible to show how the environmental performance of the common waste management system could improve.
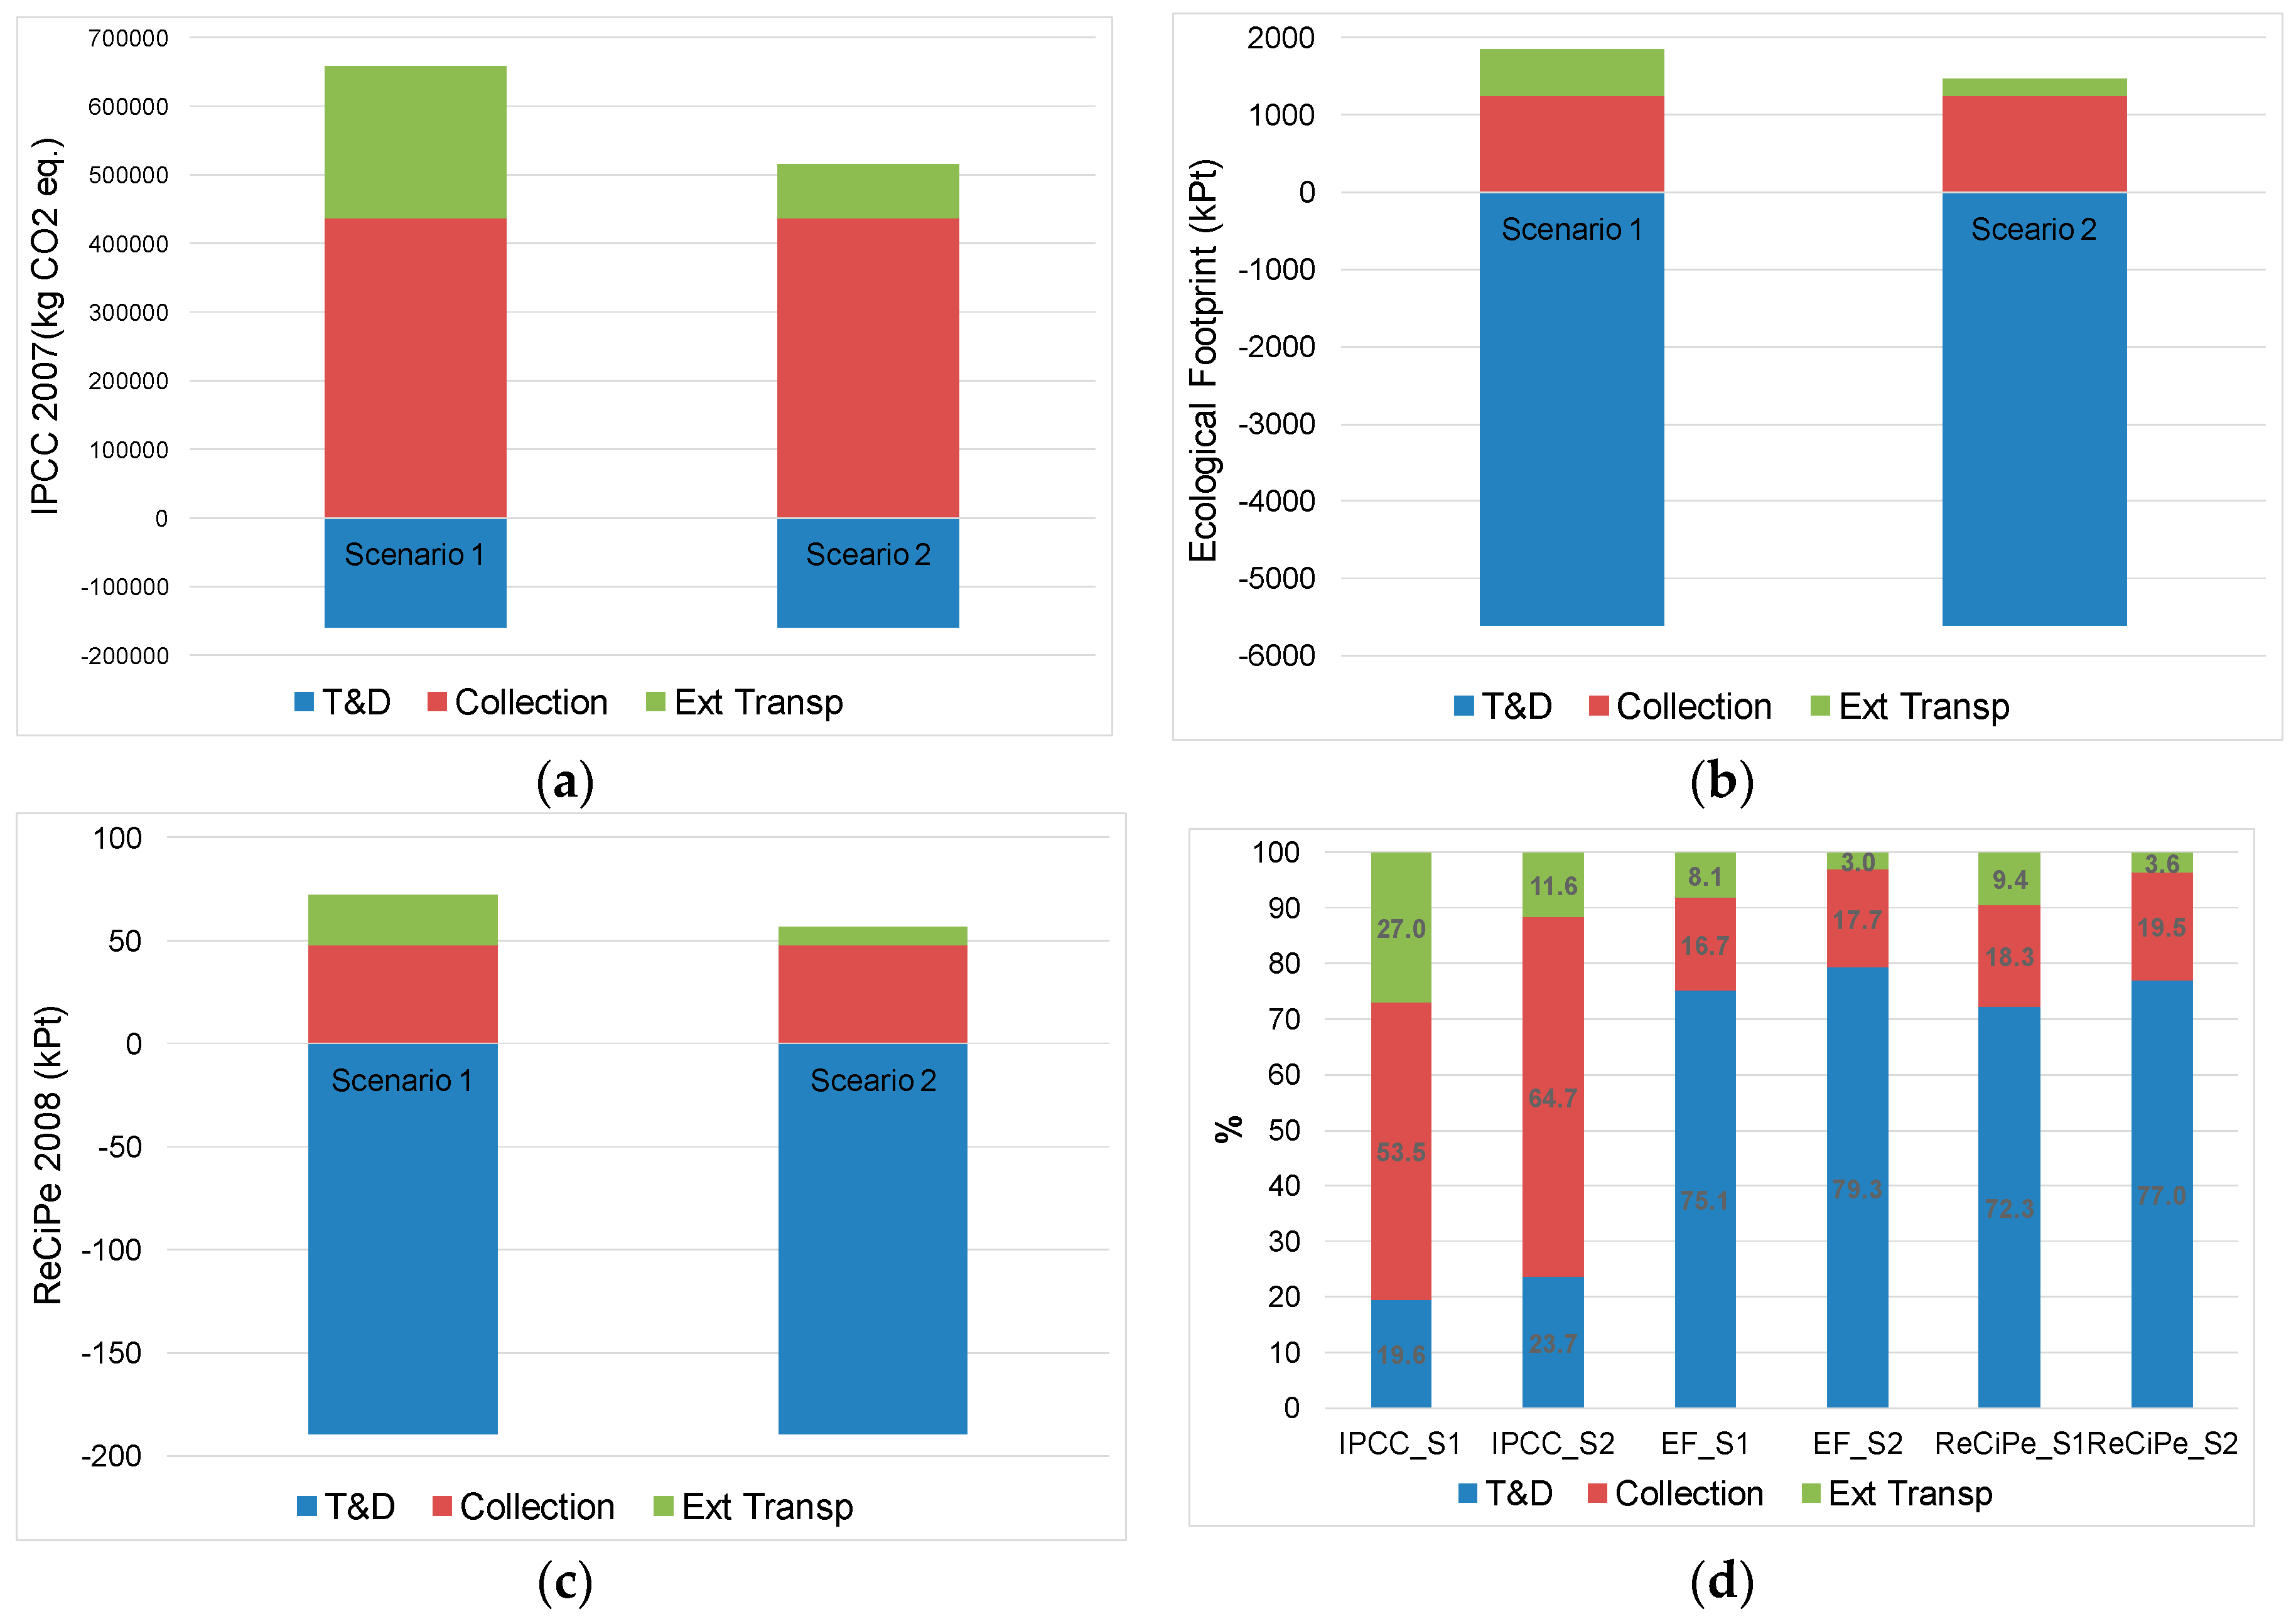
Figure 1a–c show the comparison between the environmental performances of the two scenarios considered, with the three evaluation methods adopted.
The results obtained for Scenario 2 show that there would be a clear improvement in the environmental profile of the waste management system because of the significant reduction of environmental impacts due to external transport, which are about one-third of the impact obtained for Scenario 1. Therefore, it is necessary to take into consideration the importance of the presence on the territory of appropriate facilities to support and improve the environmental performance of waste management systems based on the source-separate collection [15].
The environmental impacts of the transport derive from the combination of travelled distances and transported quantities (of organic fraction in this case). Therefore, in order to reduce these impacts, in addition to shortening the distances, it can be useful to reduce the organic waste amount.
Using an openwork basket for the household collection of the organic waste allows to easily and conveniently reduce the quantity of putrescibles. In fact, the uniform openings around the entire basket (also below), together with a compostable plastic bag or compostable paper bag, facilitate water evaporation. The results are a weight reduction of 20%–30% as well as a complete disappearance of odours due to the reduction of putrescibility. The weight loss produces a consequent reduction of the environmental impacts of the municipal collection as well as the external transport to the composting plants.
Figure 1d shows that the transport phases (internal collection and external transport) gave the most significant percentage contribution with IPCC 2007 for both the compared scenarios. On the contrary, the treatment and disposal phases (T & D) had a percentage incidence on the total impacts calculated with Ecological Footprint and ReCiPe 2008 H greater than 72%.
Once again, the obtained results show that, considering an assessment method that consider a unique impact category, there is a certain risk of misleading conclusions.

4. Conclusions

This study assessed the environmental impacts of the MW management system of Baronissi, a town in Southern Italy, for the year 2013. The environmental performance of the system was compared with that of a hypothetical alternative scenario in which the presence of a composting facility 10 km from the municipality was assumed.
The environmental impacts were assessed with three evaluation methods: IPCC 2007 100y, Ecological Footprint and ReCiPe 2008 H.
Different aspects arose from the results. First, the presence in the area of adequate waste treatment and disposal facilities, which support the separate collection system, is fundamental. In fact, the lack of facilities means high environmental loads due to the transportation of materials for long distances, particularly for those abundant materials such as the organic fraction. The results obtained for Scenario 2 showed that the presence of a composting plant at 10 km from the municipality would result in a decrease of about 65% of the impacts of the waste management system due to the external transport, regardless of the evaluation method used.
Another important aspect is the choice of the impacts evaluation method. In fact, the results obtained showed that the choice of the method significantly influence the results. The main reason for this was because the global warming category is significantly affected by the transport phase. The categories related to climate change, thus, do not allow to take into account the advantages obtainable with a good level of separate collection as well as the consequent increase in the recovery of materials. Therefore, the obtained results pointed out that by only considering a single impacts evaluation method, there is a high risk of misleading conclusions.

Acknowledgments

This article is part of the research project called SNECS—Social Network delle Entità dei Centri Storici (“Social Network Entities of Historic Places”)—Notice 713/Ric 29 October 2010. The authors wish to thank Sacha A. Berardo for the English revision.

Author Contributions

Giovanni De Feo conceived and designed the study; Carmen Ferrara and Cristina Iuliano performed the calculations; Alberto Grosso provided some data; Giovanni De Feo, Carmen Ferrara, Cristina Iuliano and Alberto Grosso analysed the data; Giovanni De Feo and Carmen Ferrara wrote the paper.

Conflicts of Interest

The authors declare no conflict of interest.

References

  1. De Feo, G.; Polito, A. Using economic benefits for recycling in a separate collection centre managed as a “reverse supermarket”: A sociological survey. Waste Manag. 2015, 38, 12–21. [Google Scholar] [CrossRef] [PubMed]
  2. Giugliano, M.; Cernuschi, S.; Grosso, M.; Rigamonti, L. Material and energy recovery in integrated waste management systems—An evaluation based on life cycle assessment. Waste Manag. 2011, 31, 2092–2101. [Google Scholar] [CrossRef] [PubMed]
  3. De Feo, G.; Malvano, C. Technical, economic and environmental analysis of a MSW kerbside collection system applied to small communities. Waste Manag. 2012, 32, 1760–1774. [Google Scholar] [CrossRef] [PubMed]
  4. Curran, M.A. Life cycle assessment. Encycl. Ecol. 2008, 3, 2168–2174. [Google Scholar]
  5. International Organization for Standardization (ISO). Environmental Management—Life Cycle Assessment—Principles and Framework; ISO 14040:2006; ISO: Geneva, Switzerland, 2002. [Google Scholar]
  6. Laurent, A.; Bakas, I.; Clavreul, J.; Bernstad, A.; Niero, M.; Gentil, E.; Hauschild, M.Z.; Christensen, T.H. Review of LCA studies of solid waste management systems—Part I: Lessons learned and perspectives. Waste Manag. 2014, 34, 573–588. [Google Scholar] [CrossRef] [PubMed]
  7. Bing, X.; Bloemhof, J.M.; Ramos, T.R.P.; Barbosa-Pavoa, A.P.; Wong, C.Y.; Van der Vorst, J.G.A.J. Research challenges in municipal solid waste logistics management. Waste Manag. 2016, 48, 584–592. [Google Scholar] [CrossRef] [PubMed]
  8. Gentil, E.C.; Damgaard, A.; Hauschild, M.; Finnveden, G.; Eriksson, O.; Thorneloe, S.; Kaplan, P.O.; Barlaz, M.; Muller, O.; Matsui, Y.; et al. Models for waste life cycle assessment: Review of technical assumptions. Waste Manag. 2010, 30, 2636–2648. [Google Scholar] [CrossRef] [PubMed]
  9. Rigamonti, L.; Grosso, M.; Møller, J.; Martinez Sanchez, V.; Magnani, S.; Christensen, T.H. Environmental evaluation of plastic waste management scenarios. Resour. Conserv. Recycl. 2014, 85, 42–53. [Google Scholar] [CrossRef]
  10. Cimpan, C.; Wenzel, H. Energy implications of mechanical and mechanical-biological treatmentcompared to direct waste-to-energy. Waste Manag. 2013, 33, 1648–1658. [Google Scholar] [CrossRef] [PubMed]
  11. Panepinto, D.; Blengini, G.A.; Genon, G. Economic and environmental comparison between two scenarios of waste management: MBT vs. thermal treatment. Resour. Conserv. Recycl. 2015, 97, 16–23. [Google Scholar] [CrossRef]
  12. Takata, M.; Fukushima, K.; Kawai, M.; Nagao, N.; Niwa, C.; Yoshida, T.; Toda, T. The choice of biological waste treatment method for urban areas in Japan—An environmental perspective. Renew. Sustain. Energy Rev. 2013, 23, 557–567. [Google Scholar] [CrossRef]
  13. Pubule, J.; Blumberga, A.; Romagnoli, F.; Blumberga, D. Finding an optimal solution for biowaste management in the Baltic States. J. Clean. Prod. 2015, 88, 214–223. [Google Scholar] [CrossRef]
  14. De Feo, G.; Malvano, C. The use of LCA in selecting the best MSW management system. Waste Manag. 2009, 29, 1901–1915. [Google Scholar] [CrossRef] [PubMed]
  15. Chi, Y.; Dong, J.; Tang, Y.; Huang, Q.; Ni, M. Life cycle assessment of municipal solid waste source-separeted collection and integrated waste management systems in Hangzhou, China. J. Mater. Cycles Waste Manag. 2015, 17, 695–706. [Google Scholar] [CrossRef]
  16. Yildiz-Geyhan, E.; Yilan-Çiftҫi, G.; Altun-Çiftҫioğlu, A.; Kadirgan, M.A.N. Environmental analysis of different packaging waste collection systems for Istanbul–Turkey case study. Resour. Conserv. Recycl. 2016, 107, 27–37. [Google Scholar] [CrossRef]
  17. Zabaleta, I.; Rodic, L. Recovery of essential nutrients from municipal solid waste—Impact of waste management infrastructure and governance aspects. Waste Manag. 2015, 44, 178–187. [Google Scholar] [CrossRef] [PubMed]
  18. Contò, P. Il Caso studio del Consorzio Priula (TV) (“The case study of Consorzio Priula (TV)”). In Rifiuti solidi (“Solid Waste”); De Feo, G., De Gisi, S., GAlasso, M., Eds.; DArio Flaccovio Editore: Palermo, Italy, 2009; pp. 253–259. (In Italian) [Google Scholar]
  19. De Feo, G.; De Gisi, S. Domestic separation and collection of municipal solid waste: Option and awareness of citizens and workers. Sustainability 2010, 2, 1297–1326. [Google Scholar] [CrossRef]
  20. De Feo, G.; De Gisi, S.; Williams, I.D. Public perception of odour and environmental pollution attributed to MSW treatment and disposal facilities: A case study. Waste Manag. 2013, 33, 974–987. [Google Scholar] [CrossRef] [PubMed]
  21. Curran, M.A. Environmental Life Cycle Assessment; McGraw-Hill: New York, NY, USA, 1996. [Google Scholar]
  22. Baumann, H.; Tillman, A.M. The Hitch Hiker’s Guide to LCA; Studentlitteratur: Lund, Sweeden, 2004. [Google Scholar]
  23. Arena, U.; Mastellone, M.L.; Perugini, F. The environmental performance of alternative solid waste management options: A life cycle assessment study. Chem. Eng. J. 2003, 96, 207–222. [Google Scholar] [CrossRef]
  24. Rigamonti, L.; Grosso, M. Riciclo dei Rifiuti: Analisi del Ciclo di Vita dei Materiali da Imballaggio (2009); ISBN 978-88-7758-897-5. Dario Flaccovio Editore s.r.l: Palermo, Italy, 2009; p. 286. (In Italian) [Google Scholar]
  25. PRé. SimaPro Database Manual Methods Library, Report Version: 2.8. 2015. Available online: http://www.pre-sustainability.com/download/DatabaseManualMethods.pdf (accessed on 14 August 2015).
  26. Goedkoop, M.; Heijungs, R.; Huijbregts, M.; De Schryver, A.; Struijs, J.; van Zelm, R. ReCiPe 2008—A Life Cycle Impact Assessment Method Which Comprises Harmonised Category Indicators at the Midpoint and the Endpoint Level First Edition (Version 1.08), Report I: Characterisation. 2013. Available online: http://www.lcia-recipe.net/file-cabinet/ReCiPe_main_report_MAY_2013.pdf?attredirects=0 (accessed on 14 August 2015).
  27. Brogaard, L.K.; Damgaard, A.; Jensen, M.B.; Barlaz, M.; Christensen, T.H. Evaluation of life cycle inventory data for recycling systems. Resour. Conserv. Recycl. 2014, 87, 30–45. [Google Scholar] [CrossRef] [Green Version]
  28. Simon, B.; Amor, M.B.; Földényi, R. Life cycle impact assessment of beverage packaging systems: Focus on the collection of post-consumer bottles. J. Clean. Prod. 2016, 112, 238–248. [Google Scholar] [CrossRef]
  29. Makan, A.; Ossobhei, O.; Mountader, M. Initial air pressure influence on in-vessel composting for the biodegradable fraction of municipal solid waste in Morocco. Int. J. Environ. Sci. Technol. 2014, 11, 53–58. [Google Scholar] [CrossRef]
  30. Quirós, R.; Villalba, G.; Gabarrell, X.; Muñoz, P. Life cycle assessment of organic and mineral fertilizers in a crop sequence of cauliflower and tomato. Int. J. Environ. Sci. Technol. 2015, 12, 3299–3316. [Google Scholar] [CrossRef]
Figure 1. Environmental impacts of Scenario 1 and Scenario 2 calculated with IPCC 2007 (a); Ecological Footprint (b); ReCiPe 2008 (c); Percentage contributions of each phase (Treatment and Disposal—T & D, Collection, and External Transport) to total impact, for Scenario 1 (S1) and Scenario 2 (S2), obtained with the three evaluation methods adopted (d).
Sustainability 08 01084 g001
Table 1. Composition analysis of the total municipal waste (MW) (“Total”), the source-separated fractions (“Separate Collection”), and the unsorted residual waste (“Residue”).
MaterialsTotalSeparate CollectionResidue
kg%kg%kg%
Aluminium43,298.20.830,425.80.712,873.40.8
Steel 303,087.25.3212,973.25.090,114.05.8
Glass577,309.010.0416,960.09.9160,349.010.3
Organic2,886,545.050.02,419,840.057.3466,705.030.1
Paper & Cardboard1,154,618.020.0659,050.015.6495,568.032.0
HDPE plastic80,823.31.448,416.01.132,407.32.1
PET plastic404,116.37.0242,081.05.7162,035.310.5
Mix plastic161,646.52.896,832.02.364,815.54.2
Plastic discards161,646.52.896,832.02.364,815.54.2
Total5,773,090.0100.04,223,409.0100.01,549,681.0100.0
Table 2. Specific Ecoinvent 2 System Processes used for modelling the main waste treatment processes adopted in MW management scenarios considered.
ProcessMaterialEcoinvent System Process
RecyclingAluminiumAluminium, secondary, from old scrap, at plant/RER
SteelSteel, electric, un- and low-alloyed, at plant/RER
GlassPackaging glass, green at plant/RER
PaperPaper, recycling, no deinking, at plant/RER
CompostingOrganicCompost at plant/CH
LandfillGlassDisposal, inert material, 0% water, to sanitary landfill/CH
PaperDisposal, paper, 11.2% water, to sanitary landfill/CH
PlasticsDisposal, plastics, mixture, 15.3% water, to sanitary landfill/CH
PE plasticDisposal, polyethylene, 0.4% water, to sanitary landfill/CH
PET plasticDisposal, polyethylene terephthalate, 0.2% water, to sanitary landfill/CH
IncineratorPaperDisposal, paper, 11.2% water, to municipal incineration/CH
PlasticsDisposal, plastics, mixture, 15.3% water, to municipal incineration/CH
PE plasticDisposal, polyethylene, 0.4% water, to municipal incineration/CH
PET plasticDisposal, polyethylene terephthalate, 0.2% water, to municipal incineration/CH
Table 3. Main characteristics of the mechanical and biological treatment (MBT) [23] and plastics recycling facilities (considering the consumption per t of recycled plastic material) [24] adopted in the MW management scenarios considered.
Mechanical and Biological Treatment (MBT)
General Characteristics
Polyethylene Film (kg)/kg RDFWater (l)/kg RDFDiesel (MJ)/kg RDFElectricity (MJ)/kg RDF
1.6 × 10−40.0880.010.083
Plastics Recycling Processes
General Characteristics
Plastic FractionFuel (Kwh/t)Natural Gas (MJ/t)
HDPE plastic 379650
PET plastic 2582500
Mix plastic 381650
Table 4. Specific Ecoinvent 2 System Processes used for modelling the vehicles required for waste transport and the data in km of distances required for separate collection in the town (Internal Transport) and for subsequent waste transportation to treatment plants (External Transport). Step 1 is the distance between the separate collection centre (SCC) and selection and screening plant, while step 2 is the distance between selection and screening plants and waste treatment plants (only for plastic fractions of separate collection it was necessary a step 3).
FractionInternal Transport (km)External Transport (km)
Transport of Separate Collection MaterialsTransport of Residual MaterialsVehiclesTransport of Separate Collection MaterialsTransport of Residual MaterialsVehicles
Step1Step2Step3Step1Step2
Aluminium199.1224.7Transport, lorry 3.5–7.5 t, EURO3/RER S (Ecoinvent System Process)40.6 28.78-31.516.22Transport, lorry > 32 t, EURO3/RER S (Ecoinvent System Process)
Steel199.1224.740.6 28.78-31.516.22
Aluminium SCC a--4.9----
Steel SCC a--4.9----
Glass 224.5224.731.5617.08-31.595.98
Organic191.3224.740.6497.79-31.5227.35
Paper & cardboard 237.0224.76--31.595.98
HDPE plastic 199.1224.740.649.8610031.5 95.98
PET plastic 199.1224.740.649.8610031.5 95.98
Mix plastic 199.1224.740.649.8610031.5 95.98
Plastic discards 199.1224.740.649.8610031.5 95.98
a materials directly collected to the SCC.
Table 5. IPCC 2007 100y environmental impacts generated from the treatment phase, internal collection and external transport to facilities for each considered material. The values are in terms of kg of CO2 eq. for each phase as well as in terms of percentage contribution that each material provides to the total absolute impact of the phase, calculated in terms of absolute values.
MaterialsTreatment & DisposalCollectionExternal TransportTotal
kg CO2 eq|kg CO2 eq||%|kg CO2 eq%kg CO2 eq%kg CO2 eq|kg CO2 eq||%|
Aluminium (SC a)−276,916276,91610.818740.42200.1−274,822274,8229.6
Aluminium (R b)−155,277155,2776.113940.3980.0−153,784153,7845.4
Steel (SC)−201,679201,6797.913,1213.015360.7−187,022187,0226.5
Steel (R)−111,299111,2994.397582.26890.3−100,852100,8523.5
Glass (SC)−131,264131,2645.133,9787.830,75113.9−66,53566,5352.3
Glass (R)737473740.313,0783.024651.122,91822,9180.8
Organic (SC)84,96284,9623.3168,03138.4148,30267.1401,296401,29614.0
Organic (R)302,411302,41111.838,0668.714,5686.6355,045355,04512.4
Paper & Cardb. (SC)−149,224149,2245.856,76513.04770.2−91,98191,9813.2
Paper & Cardb. (R)46,04046,0401.840,4209.276193.494,07894,0783.3
HDPE Plastic (SC)−42,41342,4131.758321.313190.6−35,26335,2631.2
HDPE Plastic (R)143,847143,8475.644051.08300.4149,082149,0825.2
PET Plastic (SC)−294,828294,82811.519,8284.557672.6−269,233269,2339.4
PET Plastic (R)371,337371,33714.514,9783.428231.3389,139389,13913.6
Mix Plastic (SC)48,87248,8721.993312.122551.060,45960,4592.1
Mix Plastic (R)197,849197,8497.770491.613290.6206,226206,2267.2
Total−160,2072,565,592100437,909100221,048100498,7502,857,735100
a SC = Separate Collection; b R = Residue (i.e., residual waste).
Table 6. Ecological Footprint and ReCiPe 2008 H single point environmental impacts generated from the treatment phase, internal collection and external transport to facilities for each considered material.
MaterialsEcological Footprint (kPt)ReCiPe 2008 H (kPt)
T & D cCollectionExt. Transp.TotalT & D cCollectionExt. Transp.Total
Aluminium (SC a)−718.55.40.6−712.6−24.50.20.02−24.3
Aluminium (R b)−403.04.00.3−398.8−13.80.20.01−13.6
Steel (SC)−469.337.54.2−427.6−34.41.40.17−32.8
Steel (R)−258.627.91.9−228.8−19.21.10.08−18.0
Glass (SC)−103.997.084.377.4−4.23.73.433.0
Glass (R)18.837.36.862.90.71.40.272.4
Organic (SC)−340.8479.6406.5545.4−7.518.416.5427.4
Organic (R)251.4108.739.9400.015.64.21.6221.4
Paper & Cardb. (SC)−4057.4162.01.3−3894.1−79.66.20.05−73.3
Paper & Cardb. (R)68.3115.420.9204.64.24.40.859.4
HDPE Plastic (SC)−127.016.63.6−106.8−9.30.60.15−8.5
HDPE Plastic (R)251.812.62.3266.65.90.50.096.4
PET Plastic (SC)−960.356.615.8−887.9−46.92.20.64−44.1
PET Plastic (R)855.442.87.7905.915.41.60.3117.3
Mix Plastic (SC)−145.526.66.2−112.6−0.11.00.251.2
Mix Plastic (R)528.520.13.6552.38.20.80.159.1
Total−5610.01249.9606.0−3754.1−189.547.924.6−116.9
a SC = Separate Collection; b R = Residue (i.e., residual waste); c T & D = Treatment and Disposal.
Table 7. Ecological Footprint and ReCiPe 2008 H damage endpoints of the treatment phase of the fractions relating to the source-separated paper and cardboard and the source-separated mix of plastic.
MaterialsEcological Footprint (kPt)ReCiPe 2008 H (kPt)
Carbon DioxideNuclearLand OccupationHuman HealthEcosystemsResources
Paper & Cardb. (SC a)−469.1−659.4−2928.9−9.0−60.1−10.4
Mix Plastic (SC a)71.7−3.1−214.11.6−3.31.6
a SC = Separate Collection.
Table 8. Environmental impact expressed in terms of percentage contributions that each material provides to total impact of the treatment phase, calculated with the three evaluation methods adopted. For the calculation of the percentage contributions, it was considered the absolute values of the impacts. The table shows the values of the relationship between the percentage contribution of each material obtained with Ecological Footprint (EF) and IPCC 2007 and those between the contributions obtained with ReCiPe 2008 and IPCC 2007.
MaterialsTreatment and Disposal
IPCC (%)EF (%)ReCiPe (%)EF/IPCC (%/%)ReCiPe/IPCC (%/%)
Aluminium (SC a)10.87.58.50.70.8
Aluminium (R b)6.14.24.80.70.8
Steel (SC)7.94.911.90.61.5
Steel (R)4.32.76.60.61.5
Glass (SC)5.11.11.50.20.3
Glass (R)0.30.20.20.70.9
Organic (SC)3.33.62.61.10.8
Organic (R)11.82.65.40.20.5
Paper & Cardb. (SC)5.842.427.57.34.7
Paper & Cardb. (R)1.80.71.40.40.8
HDPE Plastic (SC)1.71.33.20.81.9
HDPE Plastic (R)5.62.62.00.50.4
PET Plastic (SC)11.510.016.20.91.4
PET Plastic (R)14.58.95.30.60.4
Mix Plastic (SC)1.91.50.00.80.0
Mix Plastic (R)7.75.52.80.70.4
a SC = Separate Collection; b R = Residue (i.e., residual waste).

