
Mitigating Supply Chain Risk via Sustainability Using Big Data Analytics: Evidence from the Manufacturing Supply Chain


1
Faculty of Economics, University of Porto, Dr. Roberto Frias, 4200-464 Porto, Portugal
2
Department of Marketing and Supply Chain Management, University of Tennessee, Knoxville, TN 37996, USA
3
Maruti 3PL Private Ltd., Navdurga Society, Faizal Navapur, Bardoli, Gujarat 394601, India
*
Author to whom correspondence should be addressed.
Sustainability 2017, 9(4), 608; https://doi.org/10.3390/su9040608
Submission received: 14 December 2016
/
Revised: 14 March 2017
/
Accepted: 10 April 2017
/
Published: 14 April 2017
(This article belongs to the Special Issue Big Data and Predictive Analytics for Sustainability)
Abstract
:The use of big data analytics for forecasting business trends is gaining momentum among professionals. At the same time, supply chain risk management is important for practitioners to consider because it outlines ways through which firms can allay internal and external threats. Predicting and addressing the risks that social issues cause in the supply chain is of paramount importance to the sustainable enterprise. The aim of this research is to explore the application of big data analytics in mitigating supply chain social risk and to demonstrate how such mitigation can help in achieving environmental, economic, and social sustainability. The method involves an expert panel and survey identifying and validating social issues in the supply chain. A case study was used to illustrate the application of big data analytics in identifying and mitigating social issues in the supply chain. Our results show that companies can predict various social problems including workforce safety, fuel consumptions monitoring, workforce health, security, physical condition of vehicles, unethical behavior, theft, speeding and traffic violations through big data analytics, thereby demonstrating how information management actions can mitigate social risks. This paper contributes to the literature by integrating big data analytics with sustainability to explain how to mitigate supply chain risk.
1. Introduction
The term social sustainability can be defined as the product and process factors affecting people involved in the manufacturing value chain [1]. Furthermore, social dimensions (e.g., inequality, safety, health and welfare), ethical issues, and bad labor practices affecting the workforce have been described in terms of a supply chain’s social sustainability [2,3]. As competition increases globally, companies are finding new ways to strengthen their supply chain and to explore sustainable ways to gain a competitive advantage [4,5,6]. Thus, managers are revisiting their competitive strategies [7] with many investing considerable time and effort to capitalize on data analytics as a means of gaining competitive advantage [8]. However, the application of big data analytics in supply chain social sustainability is scant, given that managers still use traditional data sources (e.g., enterprise resource planning, customer relationship management, and optimization algorithms) in making supply chain decisions [9,10,11].
In reviewing literature on big data analytics (BDA) and sustainability, Keeso [12] argues that the application of big data in sustainable operations is often slow to achieve desired outcomes. Although sustainable supply chain management has little history in academic literature, it has become a mainstream area for practitioners [13,14,15]. On the other hand, building on the knowledge-based perspective some suggest the need for BDA as a knowledge resource that can be harvested and retained. The knowledge-based view can be traced from Simon’s [16] seminal work with significant extensions by Grant [17,18], Huber [19] and Levitt and March [20]. Further, the knowledge-based perspective suggests how big data can fuel the purposive search for market and resource innovation opportunities [21]; such resources can provide corporations a competitive advantage [22].
While building knowledge-based resources, it is also imperative to predict and avoid risks causing potential disruptions [23]. Recently, supply chain risk management (SCRM) has become a priority because of its capability to avert potential disruption and recover more quickly from disruptions that cannot be averted [24]. There are various risks including material flow risk, information flow risk and financial flow risk that cause supply chain disruptions [25]. Among these risks, supply chain social issues can impose significant operational risks on the supply chain [26]. In the literature the linkage between supply chain social issues, and risk management has been established [26]. Further, Klassen and Vreecke [26] show that social issues can be managed through effective monitoring, innovation capability and collaboration. They further assert that such social management capabilities not only avert potential risk in the supply chain but also evoke tangible outcomes [26]. Others point out several supply-chain-related disruptions (e.g., road accidents, drinking and driving, and floods) that cause delays in the supply chain [25]. These disruptions must be monitored in real time and should be broadcast to supply chain partners. This process ensures both detection of supply chain risk and disruption recovery [27,28].
Although scholars recognize the importance of using big data to enhance sustainability [29,30,31], practitioners have had some problems when integrating big data for sustainability, especially in mitigating social risk in supply chain decisions [25,30,32]. Additionally, research investigating the link between big data analytics (BDA) and sustainability in the supply chain is urgently needed. Closing this research gap, our paper integrates BDA and supply chain sustainability to predict and address issues related to sustainability. Guiding research questions include the following: What are social issues pertaining to logistics and supply chain management in developing nations? How can these issues be predicted and mitigated? Our contributions are two-fold. First we identify various forms of social sustainability risk that disrupt the supply chain through panel discussion and survey methods. Second, we describe a novel way of mitigating such risks by effectively adopting BDA to predict failures. This research helps practitioners know how to use big data in sustainability-related decision making.
The remainder of this paper is organized as follows. First, the theoretical foundation and literature related to big data and social sustainability are explored in Section 2. Section 3 describes the methodology followed by results and analysis in Section 4. Section 5 discusses the study’s theoretical and practical contributions. Finally, the conclusions and future research directions are presented in Section 6.
2. Review of Literature
2.1. Big Data Analytics and Supply Chain Management
Through globalization and digital technology, BDA has emerged as a new capability to provide value from massive data and create a competitive advantage for corporations [33,34]. Big data can be referred to as data characterized by high levels of volume (amount of data), variety (number of types), and velocity (speed) [30]. Thus, big data analytics refers a business’s capability to gain business insights from big data by applying statistical tools, algorithms, simulations and optimizations [35]. Researchers categorize big data analytics into descriptive, predictive, and prescriptive [5,11,36]. While descriptive analytics is used to identify problems and opportunities through existing processes such as online analytical processing (OLAP), predictive analytics aims at discovering explanatory or predictive patterns using data, text and web mining, so as to accurately project future trends [36,37]. On the other hand, prescriptive analytics involves use of data and mathematical algorithms to determine and assess alternative decisions in order to improve business performance [37,38]. According to Mishra et al. [39], application of BDA in supply chain management and forecasting has been gaining importance over the past decade. Supply chain practitioners are seriously considering the use of BDA in their supply chains to gain strategic benefits. For example, Accenture’s survey revealed that many managers have already started applying big data knowledge in making their supply chain decisions [40].
Supply chain management faces serious challenges in the form of delayed shipments, inefficiencies, accidents, rising fuel costs, and ever-increasing consumer expectations that potentially harm the supply chain’s efficiency [41]. Applying BDA at both strategic and operational levels is considered crucial for sustainability. Particularly in the supply chain’s operation-planning phase, big data analytics has been used widely to solve problems with procurement, inventory, and logistics [38]. Others point out how big data helps in efficiency of design, production, intelligence and service processes employed in product life cycle management (PLM) [42]. For example, Xia et al. [43] apply a robust big data system to avoid stock-outs and maintain high fill rates that enable more accurate sales forecasting. Shen and Chan [44] address demand forecasting and supply forecasting using BDA. Similarly, Hofmann [45] shows how big data can be used to avert and mitigate the bullwhip effect in the supply chain operations. However, most scholars emphasize that applying big data analytics in supply chain decisions is still in its infancy; therefore, studies related to BDA and supply chain management are scant [11,36,38,46].
2.2. Big Data Analytics and Sustainable Supply Chain Management
Although sustainable supply chain management has been discussed in corporate offices for some time, actually implementing the sustainability phenomenon in the extended supply chain has proved difficult [47]. Nevertheless, large corporations perceive sustainability efforts as long-term investments aimed toward building strategic resources [48]. Corporations are increasingly interested in using big data analytics in their sustainable efforts, which in turn give them a strategic edge [21] According to a Mckinsey survey report, companies using BDA are able to predict the 65% of customers that make repeated purchases through shop alerts and 75% of those customers reported that they are likely to use the service again [22].
Several scholars acknowledge sustainability (environmental, social and financial) as an emerging area for BDA applications in business [30,49]. However, such applications need to be implemented throughout the supply chain in order to reap full benefits [8]. As a company aligns itself with data-based decision-making processes, the company’s organizational and strategic capabilities are bound to change, thus affecting sustainability efforts. However, because of the increasing importance of BDA and sustainability, these areas need to merge to yield the maximum competitive advantage [31,49]. Although practitioners and scholars understand the pressing need for integrating big data analytics with sustainable logistics and supply chain management, progress has been limited [12]. Few scholars emphasize the need for integration of BDA and sustainability to avail the business and strategic benefits [31,49]. Garetti and Taisch [50] advocate the need for methods that can process a large volume of data to gain actionable insights into economic, social and environmental sustainability.
Studies have explored big data usage in predicting natural disasters such as seismic and tsunami hazards and mitigating other environmental hazards through big data simulation [51]. Big data are also collected about melting glaciers, deforestation, and extreme weather through satellite images, weather radar and terrestrial monitoring devices. Such data are used to comprehensively study global climate change and assign specific causality [52]. One of the other compelling social applications of big data is people’s health and welfare. For example, some scholars have applied big data analytics in identifying prostate cancer biomarkers which can act as predictors of certain prognoses in health and social work activities in Europe and US [53,54]. Yet another study has illustrated using policy-driven big data to support sustainability in various operations. For instance, computer platforms have been established to share environmental data (i.e., big data) and to use such data for environmental protection and government-led publication of information on medical records for research and risk mitigation, among other applications [55]. However, literature on the application of BDA for supply chain sustainability has been much less explored. Thus, scholars acknowledge the need for further exploration in this domain [21,29,30,44]. Furthermore, for the supply chain to be sustainable, the potential risks disrupting operations must be identified and predicted. In the next section, we explore the literature related to supply chain risk management.
2.3. Big Data Analytics and Risk Mitigation
Many supply chain practitioners are attempting to manage supply chain risks, which can disrupt the supply chain in many ways. The strategies for mitigating such risk and averting disruption are a key agenda for supply chain professionals. According to Tang and Musa [25] risk can be referred to as events with small probability but may occur abruptly; these events brings negative consequences to the system. Further, Tang and Musa [25] classify the potential risks associated with supply chain as materials, cash, and information risks.
Mason-Jones and Towill [56] identify five overlapping sources of risk for supply chain: demand, supply, environmental, process, and control. Environmental risk sources are any external uncertainties arising out of political (e.g., fuel crisis); natural (e.g., fire and earth quakes); and social (e.g., terrorist attacks and strikes). Others argue natural disasters, terrorist attacks, labor strikes and accidents can disrupt the supply chain [57,58,59,60,61,62]. Such disruptions halt operations; furthermore, without precautions and preparation, much time is required for the affected system to recover [63,64]. Expanding the study of supply chain risk, we argue that such risk determines supply chain vulnerability, defined as “an exposure to disturbances stemming out of supply chain risks and impacting the supply chain ability to effectively serve the end customer market” [65]. To be sustainable, these risks must be predicted and averted. On the other hand, Choi et al. [66] asserts big data is a powerful tool that can be used effectively to solve problems related to operational and supply chain risk. Others acknowledge the similar need for big data applications in risk and operation management in industrial applications [67].
Rising use of the Internet and of traditional enterprise resource planning ERP systems has helped companies share real- time information to reduce transaction time, information inaccuracy, and redundancy [58,68,69,70]. However, because of network complexity, consumers’ variety seeking, and supply chain efficiency, predicting and managing such risks in real time are difficult. However, BDA can be used not only to predict and avert the risks but also to build innovative resources, which can provide strategic advantage and sustainability.
2.4. Theoretical Background
Innovation across the value chain is a central element of business model and such innovation fosters long-term sustainability for profit, survival, and dynamic fit with the changing environment [21]. We refer to a knowledge-based view (NBV) to suggest a schematic outline of how and where big data analytics can facilitate resource innovation for sustainability. Sustainability refers to addressing an enterprise’s social, environmental, and financial needs. Alternatively, it may also refer to long-term survival and fit with the environment. Firms constantly need to innovate their resources to better fit with the business environment and to get the strategic advantage. The knowledge-based view (KBV) can be traced back to Simon’s [16] research, which was later extended by Grant [17,18], Levitt and March [20], and Huber [19]. According to KBV, “knowledge is an important resource of the firm. Knowledge management is the inimitable process that facilitates knowledge based strategy for competitive advantage” [17]. Therefore, knowledge management refers to how organizations accumulate, absorb and apply knowledge based on prior experiences to decide future actions [17,20,71,72]. We build upon the knowledge-management perspective to further describe big data as a knowledge driver for the spectrum of sustainability innovations in the supply chain. The knowledge-management perspective also drives innovations in sourcing, transportation, material use, design, and manufacturing. KBV also indicates the longer-term perspectives of expanding existing resources (e.g., speed, efficiency, methodology, material usage, and firm capabilities), which can change the way a firm works. Building upon KBV, we explore big data innovations in the supply chain to build the knowledge base for sustainability.
3. Methodology
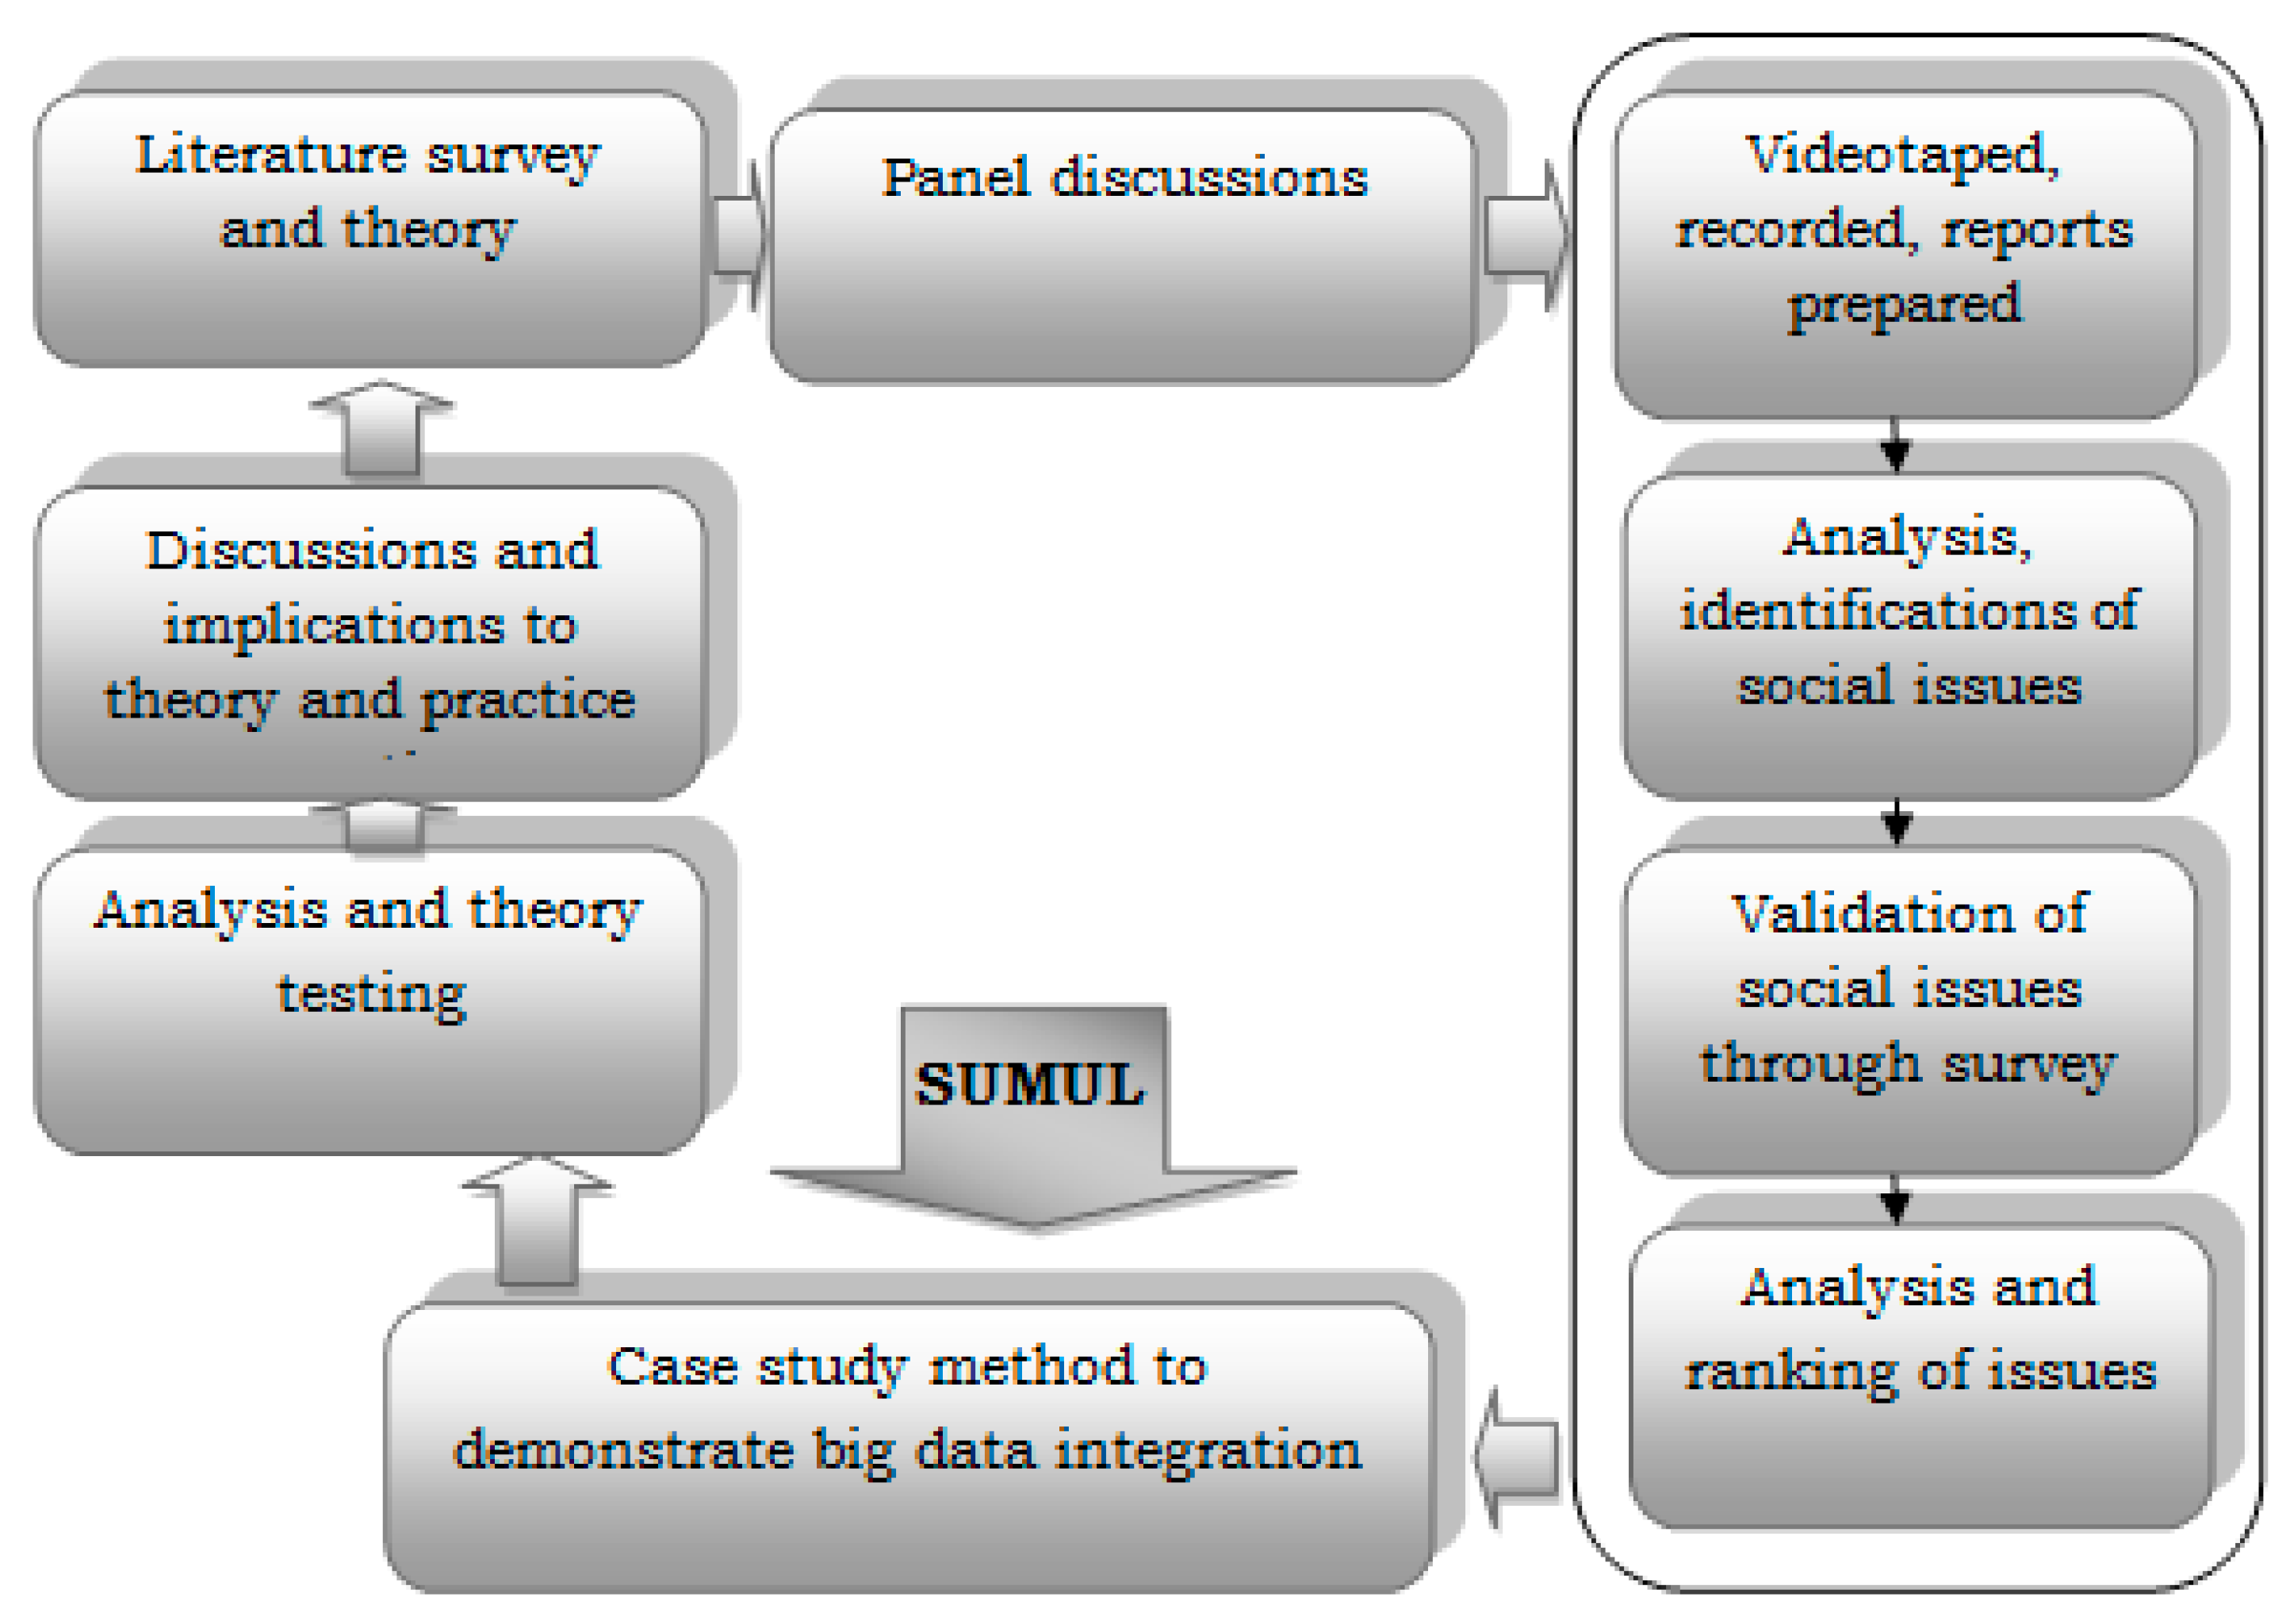
We adopted an exploratory approach because the research revolves around supply chain issues that create risk and subsequently lead to disruptions. Qualitative research methods are appropriate for research exploring new methods, process, and functioning because it addresses the “how” part of the research phenomenon [73]. Case studies are useful for preliminary, exploratory stages of research that investigates contemporary phenomenon with its real life context, especially when the boundaries between phenomenon and context are not clearly evident [74]. According to Yin [73], “case studies are the preferred strategy when how or why questions are being posed and when the focus is on a contemporary phenomenon within some real-life context”. However, he also emphasizes that investigators must be careful when designing and conducting case studies to overcome traditional criticism [73]. To overcome such criticisms, our case study research design follows valid protocols as suggested by Yin [73], including study questions, identification of study population, unit of data analysis, and what must be done after data collection. Others suggest that the investigator must understand whether the case study’s purpose is to develop or to test the theory in the design phase [75]. In this study, we use a knowledge-based perspective to view how big data integration in the supply chain might predict social issues.
We used two procedures to identify potential risks. First, a panel discussion on “challenges and opportunities to supply chain of Indian manufacturing” was conducted in December of 2014. The panel members included three prominent academicians with over three decades’ experience teaching supply chain management in premier business schools and six senior executives from industries. The senior executives were selected based on their previous experience and current role in logistics sector in Indian industry. The executives were either chief executive officers (CEOs) or senior vice presidents of logistics companies in India. These discussions were videotaped and later transcribed for analysis.
The panel discussions’ outcomes suggest various potential issues plaguing supply chain. These issues were later validated by 54 supply chain managers through a survey conducted between January and March of 2015 in India. The managers were asked to rate the relevance of the issues potentially disrupting the supply chain on a five-point Likert scale with 1 being “not at all relevant” and 5 being “highly relevant”. Based on the managers’ opinions and ratings, all the issues are ranked as listed in Table 1. The reliability test using Cronbach’s Alpha was calculated to ascertain internal consistency. The Alpha value was 0.757. The descriptive statistics of mean and standard deviation for all the issues are presented in Table 1. Based on their mean values, issues are ranked. All the issues in Table 2 indicate significant correlations. The methodology is depicted in Figure 1. The second part of our study involves a case study as described in the preceding section.
Case studies are conducted to demonstrate decisions, programs, implementation process, and organizational change. We used obtrusive and unobtrusive methods for data collection that include interviews, memoranda, business plans, organizational charts, observations, physical artifacts, employee actions and interactions etc. The goal is to understand fully to an extent possible the phenomenon being studied through what is called “perceptual triangulation” [76]. This process ensures multiple sources of evidences to assure that facts being collected are indeed correct. Single case studies are appropriate when the case is unique for some reason in relation to established theory. The choice of single case arises when the case provides critical details to well-established theory or where the case is unique, extreme or has something special to reveal [77]. For instance, Feagin et al. [78] and Drucker [79] wrote classic single-case studies to elucidate theories. Yin [80] asserts that through case study research, analytical generalizations, which are on par with statistical generalizations, can be made [80]. The case study’s validity can be judged based on the robust design the investigator adopts. For example, to fulfill the construct validity, multiple sources of evidence and key informant interviews are required; for internal validity, pattern matching and explanation building is needed; and for reliability, a case study protocol is necessary [81,82]. We adopted a single-case study design to demonstrate how big data innovation in the supply chain can mitigate social issues. Many scholars believe that a single-case study design is appropriate when an investigator can observe and analyze phenomena previously inaccessible for scientific investigation [83]. We used Surat Milk Union Limited (SUMUL), Gujarat, India as a case study to demonstrate integrating big data analytics into the supply chain can mitigate a social risk.
3.1. Data Collection
The data were collected through interviews with chief executives; supply chain managers; operations managers; senior logistics executives; and other stakeholders including drivers and employees. We visited SUMUL during September and October of 2015 multiple times for data collection and observations. Data was also collected from company manuals, periodicals, and a knowledge-management system. The data set was corroborated with the statistical foot prints that Maruti 3PL Logistics Private Ltd, Gujarat, India obtained through its “Fleeton” servers. Scholars suggest that process mapping, interviewing, and quantitative data analysis bring new insights to the case method [84,85]. Furthermore, to ensure the data’s reliability, a valid protocol was used to interview members from both 3PL Logistics and SUMUL as recommended by Yin [73]. Additionally we used process mapping and explanation building procedures to describe the case study [82].
The following section explains the reason for choosing SUMUL, integration of the Internet of things (IOT), and the big data systems developed. Also discussed is the way social issues are predicted, monitored and mitigated in the supply chain.
3.2. Indian Logistical Industry
The Indian logistical industry is estimated to grow rapidly because of favorable infrastructure policies that include “make in India”, a national integrated logistics policy, and 100% direct investment in foreign warehouses and store facilities. Some of these initiatives have led to logistics companies’ significant improvement, as is reflected in India’s logistics performance index (LPI) rank moving from the 54th to the 35th position [86]. Furthermore, regarding India’s gross domestic product (GDP) growth, the logistical industry is projected to grow 15–20% during 2016–2017 [87]. The Indian logistic industry consists of four sectors: transportation, warehousing, freight forwarding, and value-added services. Transportation represents 60% of this industry. Logistics chains in Indian firms are either owned by the firm or outsourced to third-party logistics providers. In the event of outsourcing, the company is responsible for its logistic providers’ actions because of business interest and corporate image. However, serious social issues are plaguing Indian logistics that not only disrupt the supply chain but also degrade the environment. These issues include workforce safety, excessive fuel consumption, vehicle theft, workforce health, fuel economy, workforce’s unethical behavior, workforce security, traffic violations, and natural calamities.
Practitioners recognize the importance of predicting, monitoring and mitigating such issues. However, to our knowledge, no innovative, integrated approach to solve this menace has been presented. In our illustrative case, we clarify how integrating knowledge-based big data into the supply chain helps mitigate social and environmental risks.
3.3. Big Data Integration and SUMUL
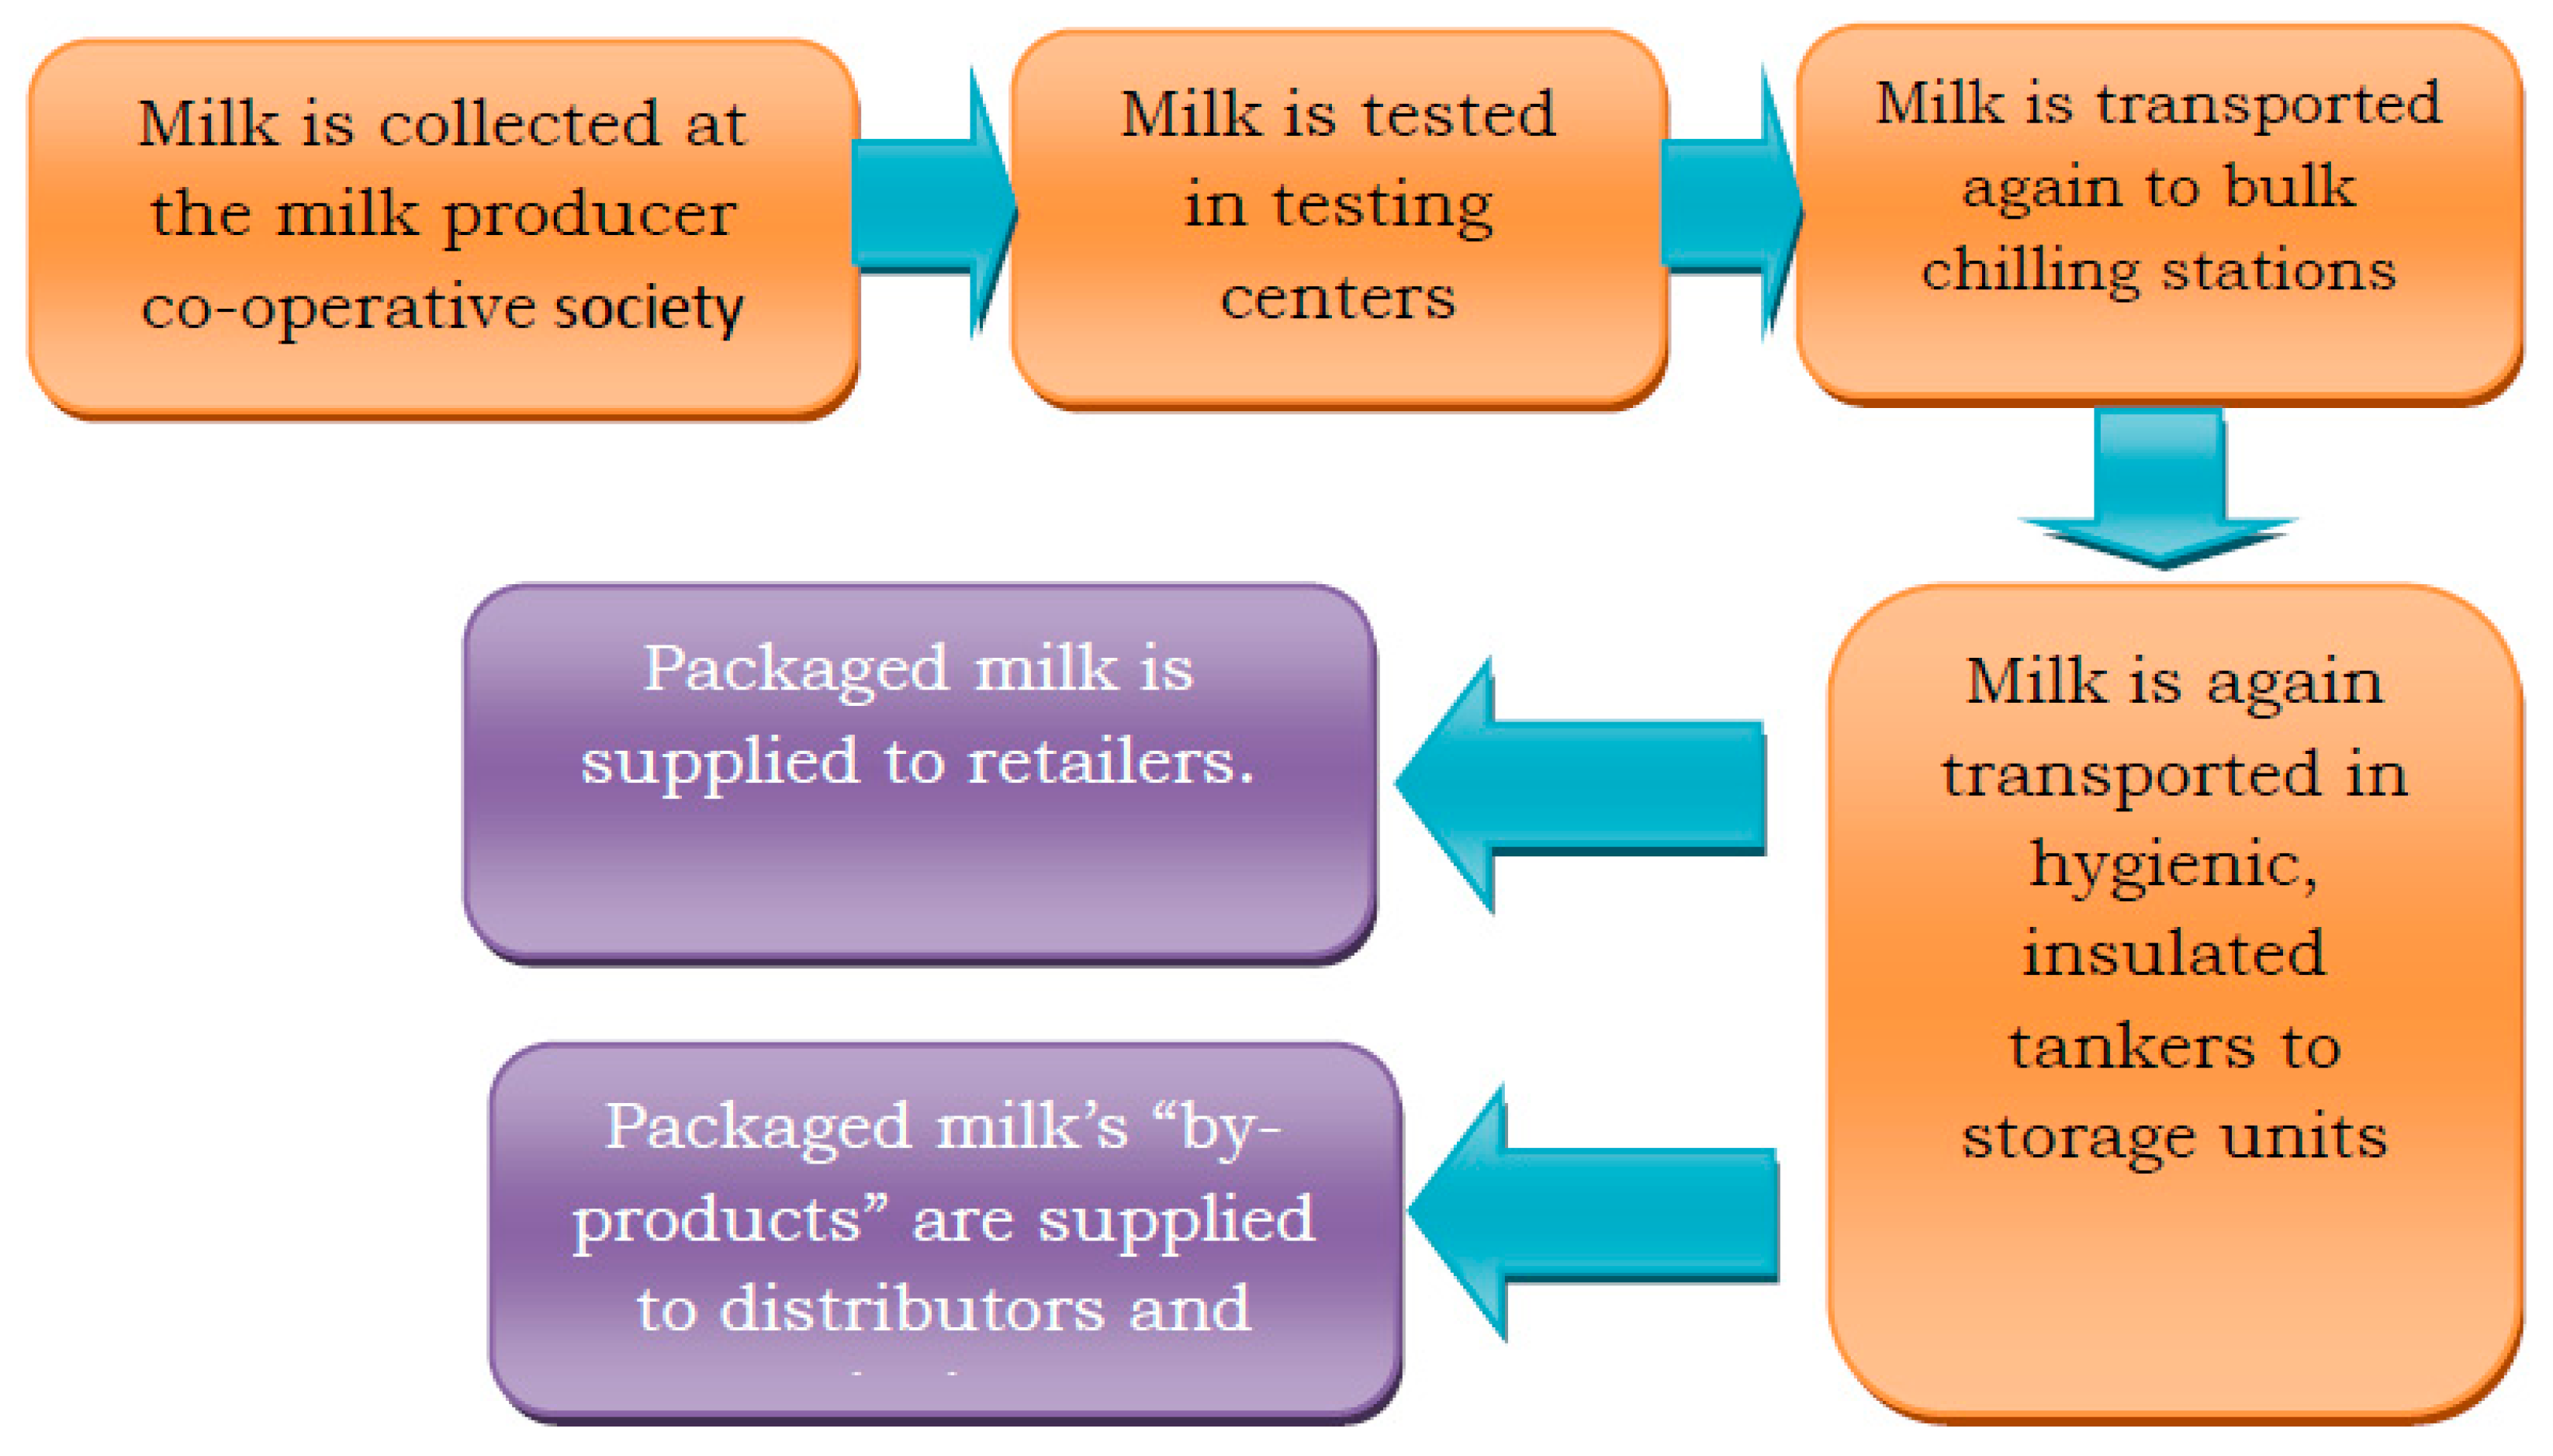
A co-operative milk-processing organization, Surat Milk Union Limited (SUMUL) is a member of the Gujarat Cooperative Milk and Marketing Federation (GCMMF), which is the largest milk processing and marketing organization in India under the brand name AMUL. The GCMMF’s products include milk, butter, varieties of sweets, flavored milk, ice cream, chocolates, and packaged ready-to-eat food. SUMUL established a three-tier supply chain system that includes village-level co-operatives that procure milk from farmers, block-level co-operatives, and district-level processing centers. Since milk is a perishable product, SUMUL has also established 489 bulk collection units (BCUs) and chilling centers. BCUs are spread across four states: South Gujarat, Mid-Gujarat, North West Maharashtra and Goa. SUMUL operates thousands of vehicles to support its inbound and outbound logistics. The stages of milk supply chain activities are identified in Figure 2.
SUMUL is an interesting example of how complex supply chains are operated, social issues are addressed, and an environmentally friendly supply chain can be built. As milk’s shelf life is short, operating all the vehicles on time is imperative. Monitoring vehicles and the workforce is also key for successful operations because milk theft en route is common. Other challenges include route planning and management, BCU allocations, and unscheduled stoppages. In addition, real-time tracking of door operations is necessary because of pilferage/theft with the workforce’s help. Furthermore, if a driver deviates from the assigned route, the dairy’s production cycle is affected, thus disturbing the milk supply.
Unethical practices among the workforce include fuel adulteration, impacting environment and efficiency; communal clashes, putting people and the system at risk; gross traffic violations; changes in specified routes; and entering restricted areas. These unethical behaviors in turn lead to law enforcement authorities’ seizing vehicles, causing operational delays. Other unscrupulous behavior includes loading prohibited materials, sharing information with competitors, and keeping vehicle doors open while driving. These behaviors potentially risk people’s health and safety and can potentially halt operations. Other threatening issues include communal clashes, riots, and protests. In fact, SUMUL’s president said, “It was evident when there was communal clash and agitation during 2015, when the major community took on to streets vandalizing public properties, many of our vehicles were abandoned, our workforce and vehicles were at risk”. Thus, tracing both vehicles and workforce behavior is important.
In outbound logistics, timely delivery is important as the company has a short cycle time because of the products’ short shelf life. Since the vehicles traverse four states, workforce safety and security is very important. Any deviation in the route may signal risk and disruption. For instance, if a vehicle travels the shortest route identified by the company, less energy is consumed and the environmental impact is reduced. Robbery en route to a destination is another issue that puts the system at risk. According to one driver, “Many of us drive the vehicles over 24 h and in hilly areas, during night vehicles are stopped and robbed. Few months back, to escape the robbery attempt, I jumped from the vehicle and ran away from the scene”.
These issues have challenged SUMUL operations over three decades. Thus, the entire supply chain was at risk and disturbed. In turn, business and survival were affected. Because of SUMUL’s large-scale operations and the involvement of over 1000 vehicles and people, tracking big volumes of data and identifying issues in advance has been challenging. Furthermore, SUMUL has consistently invested in innovative solutions for business processes and believes that innovation efforts can lead to a sustainable competitive advantage and an unmatched leadership position in the market. To address social and environmental issues in the supply chain, SUMUL has integrated big data analytics, the first of its kind in India, into its supply chain in association with Maruti 3PL Logistics Private Ltd., a service provider. In the following section, we discuss the big data analytics system and its role in identifying and mitigating issues causing disruption.
4. Results and Analysis
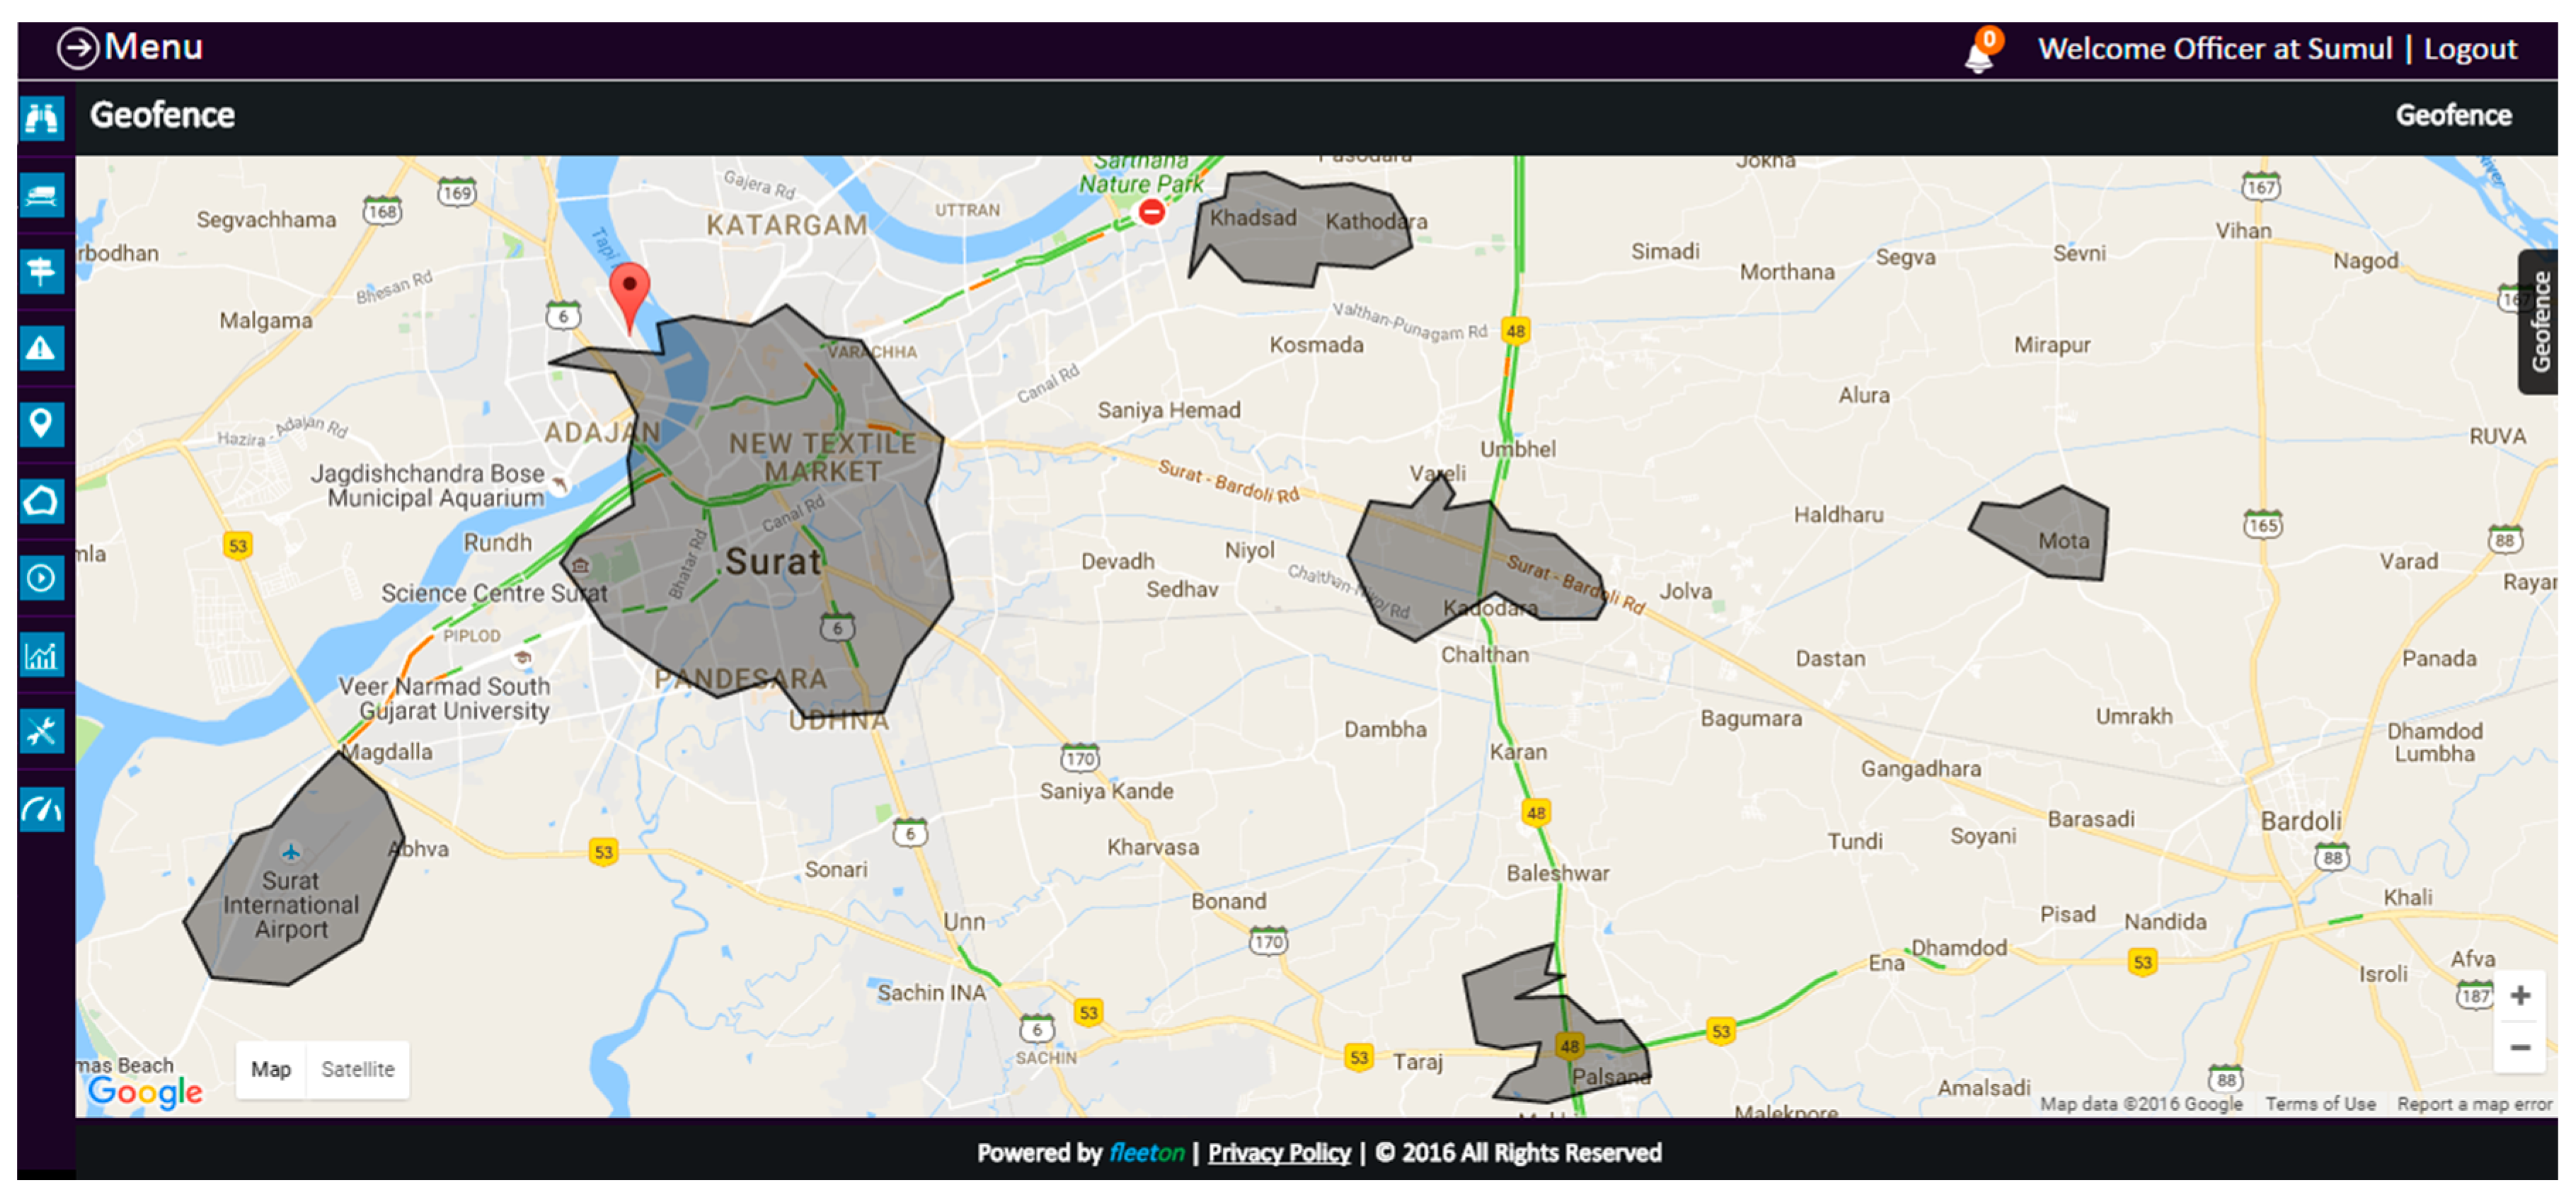
SUMUL has installed an online fleet-management and vehicle-tracking software system (Fleeton). Additionally, an Internet of things (IOT) device is mounted on all vehicles. An IOT device consists of sensors (e.g., GPS, accelerometer, digital voltage sensor (1 or 0), and analog sensor). This device has an integrative on-board GSM module, which runs a continued TCP/IP connection with the centralized server, enabling the system to track vehicle data. In addition, all the block chilling units (BCUs) are marked on the Google Map’s licensed engine that is integrated into Fleeton servers. Fleeton regularly records millions of data points and tracks alarm situations such as reckless driving, speeding, doors open at unscheduled locations, non-BCU stoppage location, geo-fence entry/exit (government restricted or prohibited areas), and route deviation. Mr. Patel, chief executive of Maruti 3PL Private Ltd., reported that Fleeton is a patented integrative logistic solution that not only predicts the risk and disruptions in the supply chain but also assists in mitigating through large volumes of data guided by seasoned professionals.
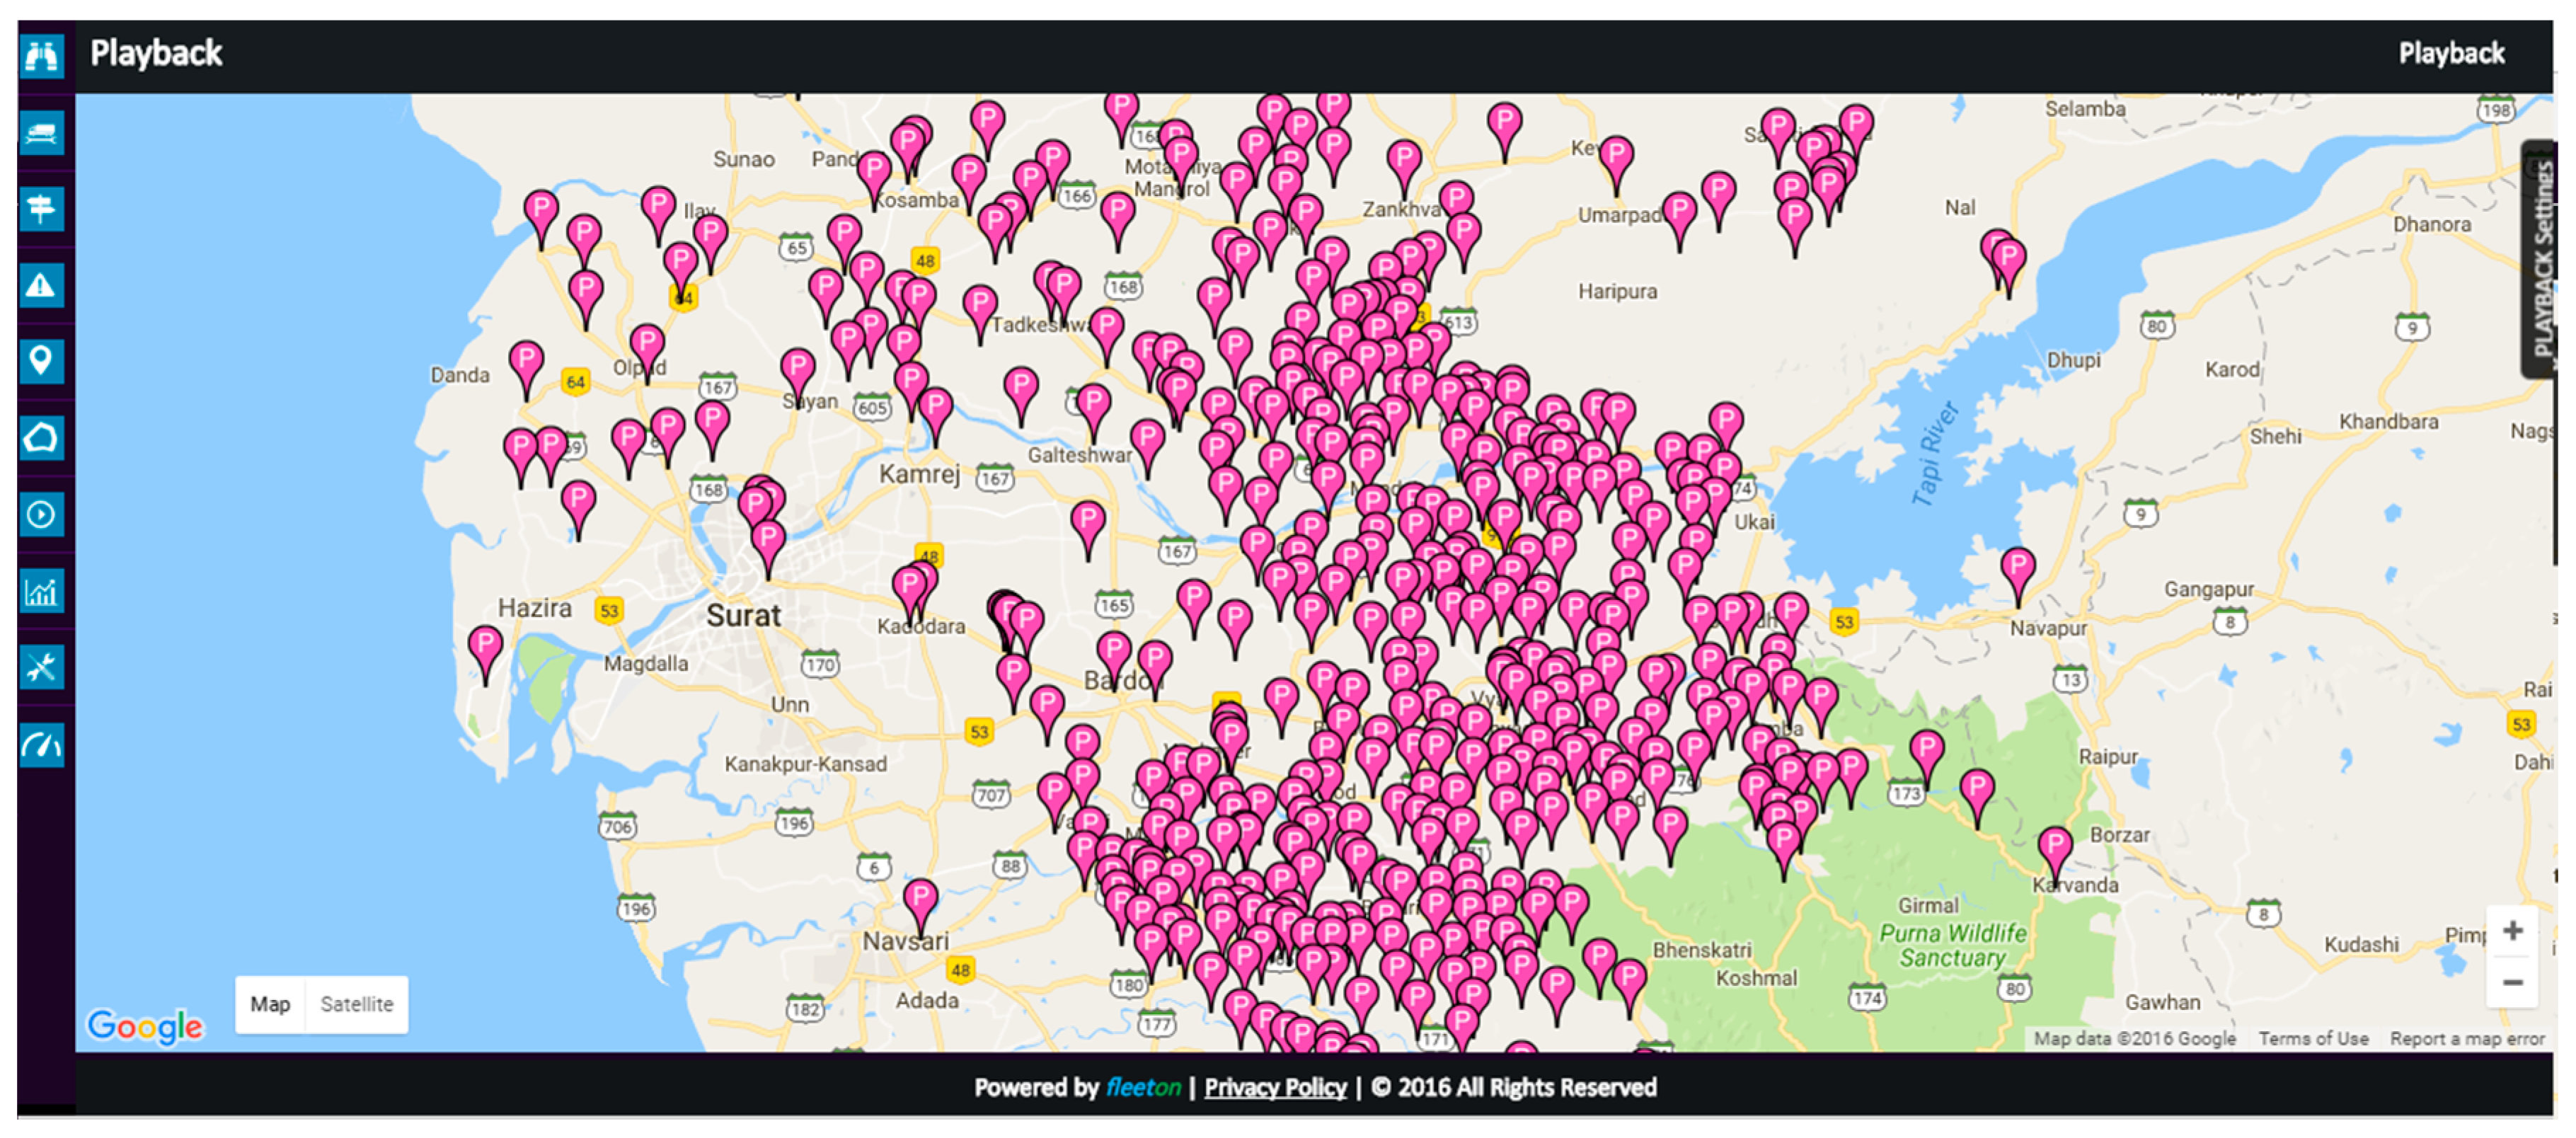
The Fleeton system is pre-loaded with the data that can be seen through Fleeton screen shots of BCU’s locations (Figure 3), geo-fences (Figure 4), and routes with vehicle assignments (Figure 5). The system records in real time the behavior of vehicles and people involved in logistics. The Fleeton system is also connected with the supply chain managers’ cell phones, thus enabling managers to have real-time information on supply chain activities. As the managers or decision makers are updated with this information, they can predict risks and mitigate such risks. Figure 6 shows the distance vehicles cover on a particular day. Distance data for a 30-day period runs into a few million data points (Table 3), providing managers a realistic of vehicle use and its environmental impact.
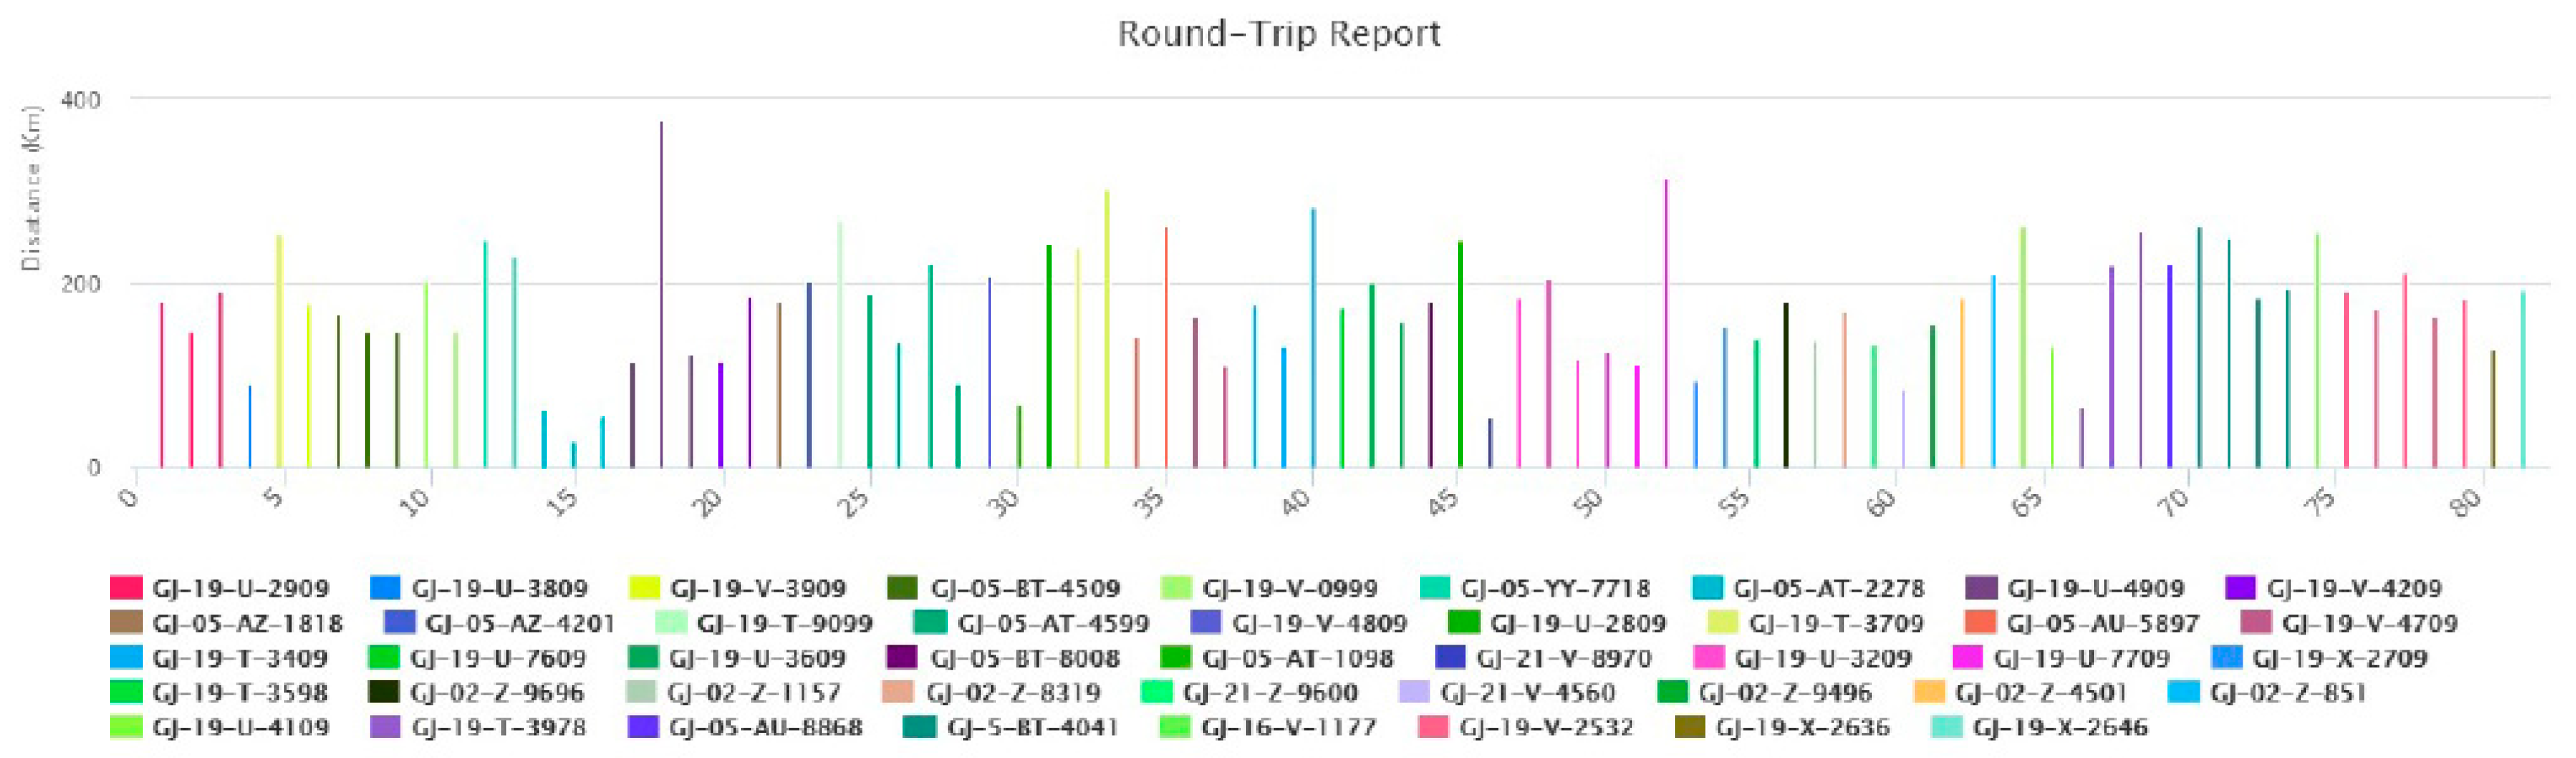
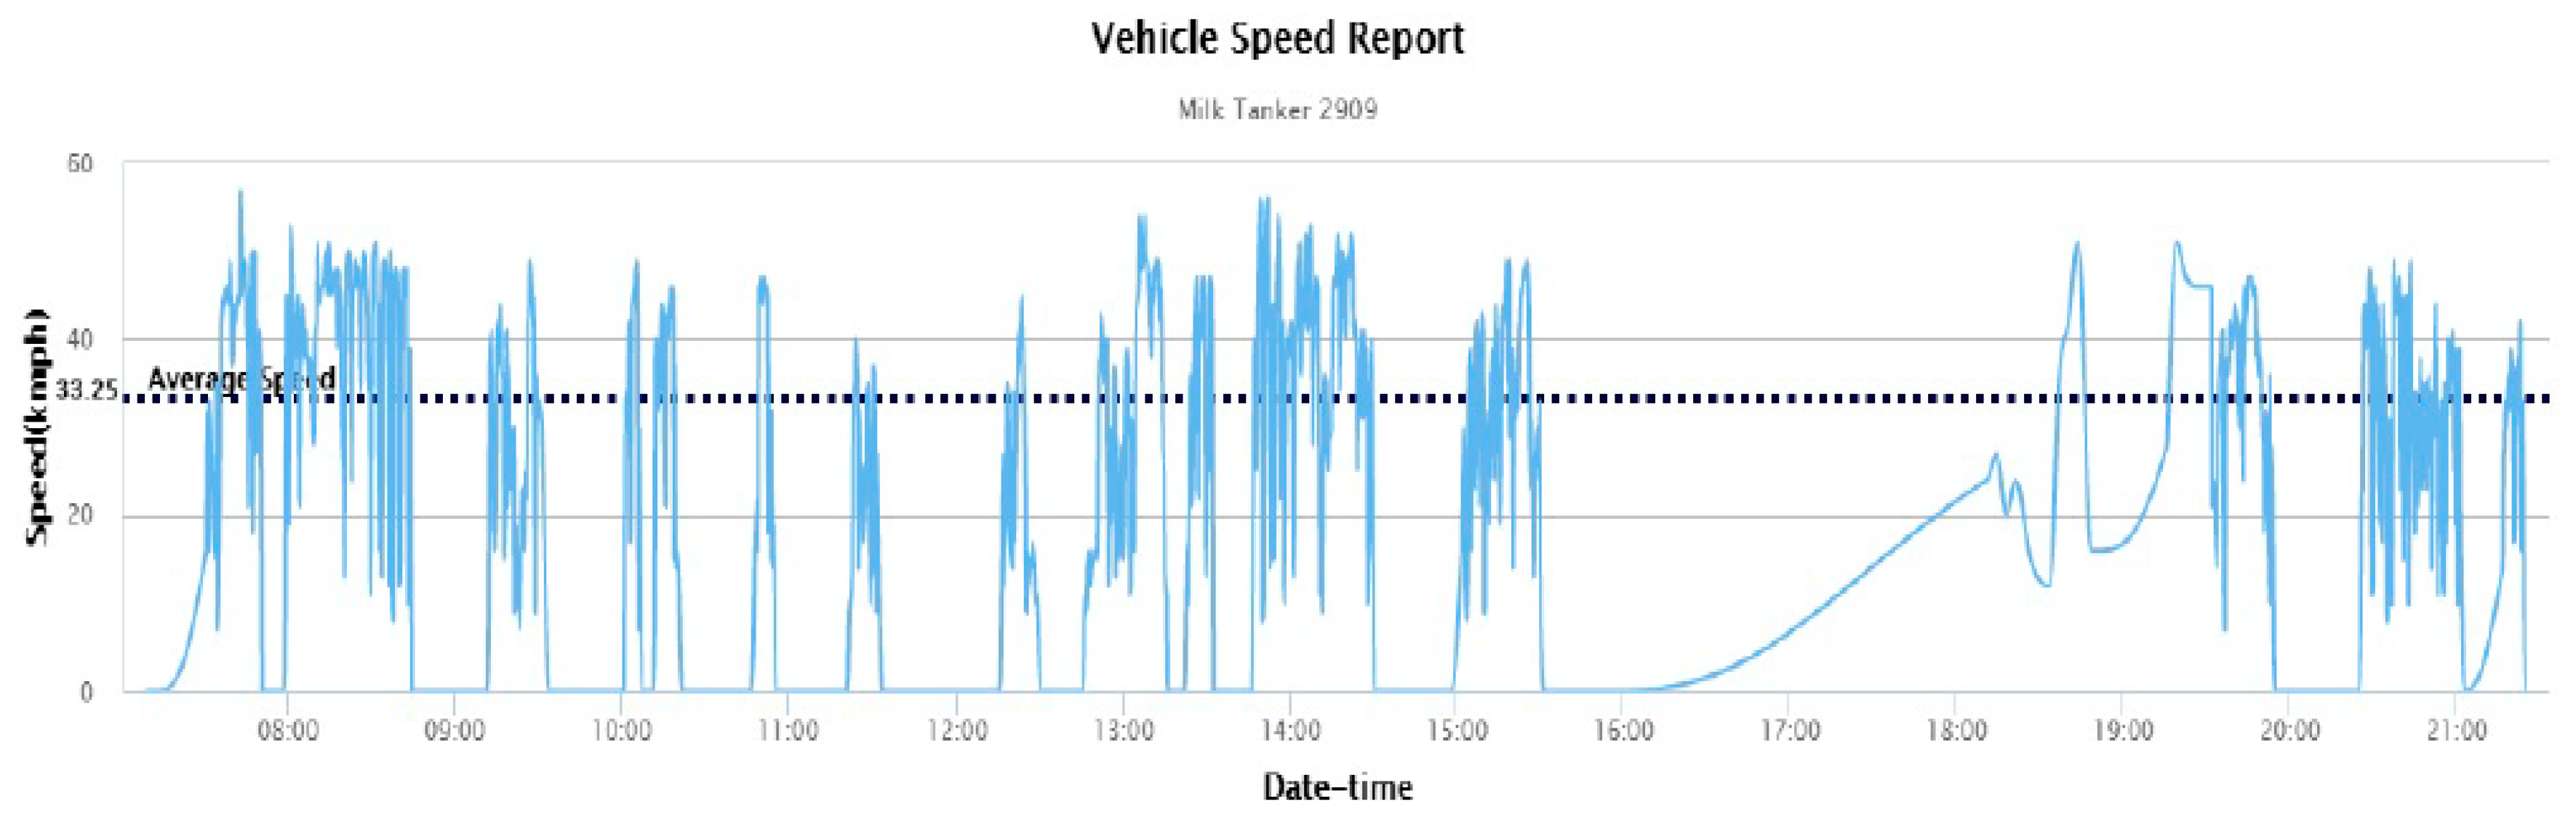
Table 4 shows frequency of engine run-time, stoppages and intervals, and associated places. These data help track the vehicle and the driver’s actions, and ensure vehicle and personal safety. Based on this information, managers can obtain in-depth views of workforce safety, which can help them to avert these issues. Figure 7 shows the round-trip report, which reveals how much time the vehicle has taken for each round trip; in turn, managers can identify thefts, unnecessary stoppages, and delays. Table 5 is the fleet-utilization report, which reflects underutilization or overutilization. Using the underutilized fleet and optimizing resources help reduce the carbon footprint. Figure 8 and Table 6 plot vehicle speed and show the percentage of times vehicles exceeded the average speed. Data related to vehicle speed helps managers to track speed violations, thus helping to avoid potential damage to other people and society at large. Table 7 reports vehicle stoppages, indicating the time taken at each stage and unwanted stoppages, to identify theft and unethical behavior. Because the data is in real time, many issues such as speeding (reckless driving), accidents, traffic violations and penalties can be prevented. In addition, fuel efficiency can be increased and the environmental impact decreased. Through geo-fencing, vehicles’ entry into prohibited areas can be predicted and mitigated, thus preventing unwanted vehicle seizure by law-enforcement authorities that leads to time delays and disruptions. Furthermore, this statistical information helps in identifying drivers’ violations and tracks them in the supply chain. By adopting big data analytics in logistics and supply chain management, SUMUL can predict and mitigate supply chain issues that cause disruptions leading to risk.
5. Discussions and Implications
Practitioners have used big data analytics in different domains [88,89,90,91]. Through the SUMUL case study, we have illustrated the value of adopting big data analytics for predicting and managing social and environmental risks, which disrupt the supply chain. This study is significant in the literature because supply chain risk management has emerged as one of companies’ top priorities in predicting and mitigating potential disruptions [24]. Social and environmental issues (e.g., workforce safety, health, robbery, vehicle theft, unethical actions, workforce security, speeding and natural calamities) were issues plaguing manufacturing in India. Our study demonstrates how big data innovation can not only predict these issues in real time but also mitigate them in the supply chain.
This study assists the supply chain practitioners and policy makers in looking for big data innovations to solve social and environmental issues, thus helping to ensure sustainability. Our results align with those of Jelinek and Bergey [21], whose results proved big data knowledge and innovations drive organizations’ sustainability. Our findings also concur with earlier research that proved adopting big data analytics enhances supply chain innovation’s capability [92]. Such innovation capabilities combined with big data analytics knowledge help create an inimitable knowledge base, which not only provides a strategic advantage but also is the basis for sustainability. Our results also confirm a knowledge-based view that asserts knowledge is a firm’s fundamental resource, which is inimitable and facilitates sustainability [18]. Furthermore, a firm’s big data capabilities unify today’s business with innovation to achieve a competitive advantage. Our results are consistent with Xia et al. [43] who employed a versatile sales forecasting system in Hong Kong’s fashion retail industry there by averting inventory stock outs. A knowledge-based perspective can also be discerned in the work of Womack et al. [93], Wheelwright and Clark [94]. Their work involving the Japanese auto industry proved that building innovative resources and capabilities to support new offerings invariably produces a competitive advantage.
Our study confirms earlier research by Chronopoulous et al. [95] that employed real options approach to study the production capacity planning problem by incorporating risk aversion and operational flexibility in an analytical model. This demonstrated how big data analytics was leveraged to avert risk and realize optimal capacity. Similar results were obtained by Hofmann [45] whose study showed how big data analytics helped to manage the bullwhip effect in customer service operations. Our research further corresponds with research suggesting that adopting big data in chemical processing industries positively affects sustainability [51]. Similarly, research in Korea proved that the combined use of big data and a green IT platform can mitigate environmental risks and enhance sustainability [41,96]. In contrast, research on a sustainable digital environment shows that excessive use of digital technology may lead to an unsustainable environment [32]. Our results concur with those of Choy and Park [97], who describes how consumer-centric innovation and big data knowledge in the supply chain contribute to a firm’s survival and sustainability.
As big data analytics gains importance in business, adopting big data in various business domains is becoming a reality. The theory involving big data integration in sustainability, especially in the supply chain operation domain, is limited but growing. Our research fills this gap by demonstrating how big data analytics can be used effectively in predicting and mitigating supply chain risks for survival and competitive advantage, thereby adding knowledge to this domain. Another managerial implication of this research is that it can assist supply chain domain’s practitioners in adopting big data knowledge so they will be able to not only predict and mitigate the issues but also build sustainable supply chains.
6. Conclusions and Future Research
The literature on integrating big data into supply chain sustainability is scant. This research is an early attempt to explore such integration with the outcome of contributing to the body of knowledge. The aim of this research was to explore social and environmental issues causing disruptions in the supply chain and to determine how to mitigate such risks through BDA. Furthermore, this research explored and has illustrated the practitioner’s perspective through real-time implementation of BDA for supply chain sustainability. Through this research, we have identified various social and environmental issues leading to supply chain risk. The outcome of this research shows how BDA could mitigate the risks caused by social and environmental issues and in turn lead to sustainability.
While this research is an early attempt at integrating two disciplines (i.e., big data and sustainable operations) into emerging economies, it can be extended to other developing and developed economies to get more insights. Because social issues tend to vary based on social evolution, this research should be extended into other economies. Further research can empirically examine the relationship between BDA and its impact on operational and firm performance.
Acknowledgments
We acknowledge the contribution of Purvishkumar Patel, Chief Executive, 3PL Logistics Private Ltd. for timely information and data sharing. We extend our sincere gratitude to SUMUL senior executives and employees for their contribution without which it would not have been possible to complete this research on time.
Author Contributions
The research was designed by Venkatesh Mani and Catarina Delgado was responsible for supervision. All authors contributed to the development of the manuscript.
Conflicts of Interest
The authors declare no conflict of interest.
References
- Wood, D.J. Corporate social performance revisited. Acad. Manag. Rev. 1991, 16, 691–718. [Google Scholar]
- Mani, V.; Agrawal, R.; Gunasekaran, A.; Papadopoulos, T.; Dubey, R.; Childe, S. Social sustainability in the supply chain: Construct development and measurement validation. Ecol. Indic. 2016, 71, 270–279. [Google Scholar] [CrossRef]
- Mani, V.; Gunasekaran, A.; Papadopoulos, T.; Benjamin, H.; Dubey, R. Supply Chain Social Sustainability for Developing Nations: Evidence from India. Resour. Conserv. Recycl. 2016, 111, 42–52. [Google Scholar] [CrossRef]
- Ketchen, D.J., Jr.; Hult, G.T.M. Bridging organization theory and supply chain management: The case of best value supply chains. J. Oper. Manag. 2007, 25, 573–580. [Google Scholar]
- Slone, R.E. Leading a supply chain turn around. Harv. Bus. Rev. 2004, 82, 114–121. [Google Scholar] [PubMed]
- Whipple, J.M.; Frankel, R. Strategic alliance success factors. J. Supply Chain Manag. 2000, 36, 21–28. [Google Scholar] [CrossRef]
- Zacharia, Z.G.; Sanders, N.R.; Nix, N.W. The emerging role of the third-party logistics provider (3PL) as an orchestrator. J. Bus. Logist. 2011, 32, 40–54. [Google Scholar] [CrossRef]
- Davenport, T.H. Competing on analytics. Harv. Bus. Rev. 2006, 84, 84–93. [Google Scholar]
- Chae, B.; Olson, D. Business analytics for supply chain: A dynamic-capabilities frame work. Int. J. Inf. Technol. Decis. Mak. 2013, 12, 9–26. [Google Scholar] [CrossRef]
- Hazen, B.T.; Boone, C.A.; Ezell, J.D.; Jones-Farmer, L.A. Data quality for data science, predictive analytics, and big data in supply chain management: An introduction to the problem and suggestions for research and applications. Int. J. Prod. Econ. 2014, 154, 72–80. [Google Scholar] [CrossRef]
- Trkman, P.; McCormack, K.; de Oliveira, M.P.V.; Ladeira, M.B. The impact of business analytics on supply chain performance. Decis. Support Syst. 2010, 49, 318–327. [Google Scholar] [CrossRef]
- Keeso, A. Big Data and Environmental Sustainability: A Conversation Starter; Smith School Working Paper Series; Working Paper 14-04; Smith School of Enterprise and the Environment, University of Oxford: Oxford, UK, 2014; Available online: http://www.smithschool.ox.ac.uk/library/workingpapers/workingpaper%2014-04.pdf (accessed on 7 May 2015).
- Chen, L.; Olhager, J.; Tang, O. Manufacturing facility location and sustain- ability: A literature review and research agenda. Int. J. Prod. Econ. 2014, 149, 154–163. [Google Scholar] [CrossRef]
- Giannakis, M. The intellectual structure of the supply chain management discipline: A citation and social network analysis. J. Enterp. Inf. Manag. 2012, 25, 136–169. [Google Scholar] [CrossRef]
- Seuring, S.; Müller, M. From a literature review to a conceptual framework for sustainable supply chain management. J. Clean. Prod. 2008, 16, 1699–1710. [Google Scholar] [CrossRef]
- Simon, H.A. Administrative Behavior; Free Press: New York, NY, USA, 1965. [Google Scholar]
- Grant, R.M. Prospering in dynamically-competitive environments: Organizational capability as knowledge integration. Organ. Sci. 1996, 7, 375–387. [Google Scholar] [CrossRef]
- Grant, R.M. Toward a knowledge-based theory of the firm. Strateg. Manag. J. 1996, 17, 109–122. [Google Scholar] [CrossRef]
- Huber, G.P. Organizational learning: The contributing processes and literatures. Organ. Sci. 1991, 2, 71–87. [Google Scholar] [CrossRef]
- Levitt, B.; March, J.G. Organizational learning. Annu. Rev. Sociol. 1988, 14, 319–340. [Google Scholar] [CrossRef]
- Jelinek, M.; Bergey, P. Innovation as the strategic driver of sustainability: Big data knowledge for profit and survival. IEEE Eng. Manag. Rev. 2013, 41, 14–22. [Google Scholar] [CrossRef]
- Manyika, J.; Sinclair, J.; Dobbs, R.; Strube, G.; Rassey, L.; Mischke, J.; Remes, J.; Roxburg, C.; George, K.; O’Halloran, D.; et al. Manufacturing the Future: The Next Era of Global Growth and Innovation. 2012, pp. 1–184. Available online: http://www.mckinsey.com/business-functions/operations/our-insights/the-future-of-manufacturing (accessed on 22 July 2016).
- Hazen, B.T.; Sankar, C. Cross-border process innovations: Improving the fit between information processing needs and capabilities. Int. J. Innov. Technolo. Manag. 2015, 12, 1–26. [Google Scholar] [CrossRef]
- Chopra, S.; Sodhi, M. Reducing the risk of supply chain disruptions. MIT Sloan Manag. Rev. 2014, 55, 72–80. [Google Scholar]
- Tang, O.; Nurmaya Musa, S. Identifying risk issues and research advancements in supply chain risk management. Int. J. Prod. Econ. 2011, 133, 25–34. [Google Scholar] [CrossRef]
- Klassen, R.D.; Vereecke, A. Social issues in supply chains: Capabilities link responsibility, risk (opportunity), and performance. Int. J. Prod. Econ. 2012, 140, 103–115. [Google Scholar] [CrossRef]
- Kumar, S.; Havey, T. Before and after disaster strikes: A relief supply chain decision support frame work. Int. J. Prod. Econ. 2013, 145, 613–629. [Google Scholar] [CrossRef]
- O’Leary, D. The use of social media in the supply chain: Survey and extensions. Intell. Syst. Account. Financ. Manag. 2011, 18, 121–144. [Google Scholar] [CrossRef]
- Dubey, R.; Gunasekaran, A.; Childe, S.J.; Wamba, S.F.; Papadopoulos, T. The impact of big data on world-class sustainable manufacturing. Int. J. Adv. Manuf. Technol. 2016, 84, 631–645. [Google Scholar] [CrossRef]
- Hazen, B.T.; Skipper, J.B.; Ezell, J.D.; Boone, C.A. Big Data and predictive analytics for supply chain sustainability: A theory-driven research agenda. Comput. Ind. Eng. 2016, 101, 592–598. [Google Scholar] [CrossRef]
- Hsu, J. Why Big Data Will Have an Impact on Sustainability. The Guardian. Available online: http://www.theguardian.com/sustainable-business/big-dataimpact-sustainable-business (accessed on 31 January 2014).
- Scholz, R.W. Sustainable Digital Environments: What Major Challenges Is Humankind Facing? Sustainability 2016, 8, 726. [Google Scholar] [CrossRef]
- Chen, H.; Chiang, R.H.; Storey, V.C. Business intelligence and analytics: From big data to big impact. MIS Q. 2012, 4, 1165–1188. [Google Scholar]
- Spotfire. Big Data in Manufacturing: Rise of the Machine: TIBCO Spotfire’s Trends and Outliers Blog. Available online: http://spotfire.tibco.com/blog/?p=20446>.2013 (accessed on 22 June 2016).
- Wamba, S.; Akter, S.; Edwards, A.; Chopin, G.; Gnanzou, D. How ‘big data’ can make big impact: Findings from a systematic review and a longitudinal case study. Int. J. Prod. Econ. 2015. [Google Scholar] [CrossRef]
- Demirkan, H.; Delen, D. Leveraging the capabilities of service-oriented decision support systems: Putting analytics and big data in cloud. Decis. Support Syst. 2013, 55, 412–421. [Google Scholar] [CrossRef]
- Hazen, B.T.; Skipper, J.B.; Boone, C.A.; Hill, R.R. Back in business: Operations research in support of big data analytics for operations and supply chain management. Ann. Oper. Res. 2016. [Google Scholar] [CrossRef]
- Wang, G.; Gunasekaran, A.; Ngai, E.W.; Papadopoulos, T. Big data analytics in logistics and supply chain management: Certain investigations for research and applications. Int. J. Prod. Econ. 2016, 176, 98–110. [Google Scholar] [CrossRef]
- Mishra, D.; Gunasekaran, A.; Papadopoulos, T.; Childe, S.J. Big Data and supply chain management: A review and bibliometric analysis. Ann. Oper. Res. 2016. [Google Scholar] [CrossRef]
- Accenture Global Operations Mega Trends Study. Big Data Analytics in Supply Chain: Hype or Here to Stay? Available online: http://www.accenture.com/us-en/Pages/insight-global-operations-megatrends-big-data-analytics.aspx (accessed on 7 December 2014).
- Barnaghi, P.; Sheth, A.; Henson, C. From data to actionable knowledge: Big data challenges in the web of things. IEEE Intell. Syst. 2013, 28, 67–71. [Google Scholar] [CrossRef]
- Li, J.; Tao, F.; Cheng, Y.; Zhao, L. Big data in product lifecycle management. Int. J. Adv. Manuf. Technol. 2015, 81, 667–684. [Google Scholar] [CrossRef]
- Xia, M.; Zhang, Y.; Weng, L.; Ye, X. Fashion retailing forecasting based on extreme learning machine with adaptive metrics of inputs. Knowl. Based Syst. 2012, 36, 253–259. [Google Scholar] [CrossRef]
- Shen, B.; Chan, H.L. Forecast Information Sharing for Managing Supply Chains in the Big Data Era: Recent Development and Future Research. Asia Pac. J. Oper. Res. 2017, 34, 1740001. [Google Scholar] [CrossRef]
- Hofmann, E. Big data and supply chain decisions: The impact of volume, variety and velocity properties on the bullwhip effect. Int. J. Prod. Res. 2015. [Google Scholar] [CrossRef]
- Souza, G.C. Supply chain analytics. Bus. Horiz. 2014, 57, 595–605. [Google Scholar] [CrossRef]
- Brockhaus, S.; Kersten, W.; Knemeyer, A.M. Where do we go from here? Progressing sustainability implementation efforts across supply chains. J. Bus. Logist. 2013, 34, 167–182. [Google Scholar] [CrossRef]
- McWilliams, A.; Siegel, D.S. Creating and capturing value: Strategic corporate social responsibility, resource-based theory, and sustainable competitive advantage. J. Manag. 2011, 37, 1480–1495. [Google Scholar] [CrossRef]
- Hsu, J.M. Big Business + Big Data = Big Sustainability. 2013. Available online: http://www.sustainablebrands.com/news_and_views/info_tech/john-m-hsu/big business-Big-data-big-sustainability (accessed on 16 January 2016).
- Garetti, M.; Taisch, M. Sustainable manufacturing: Trends and research challenges. Prod. Plan. Control 2012, 23, 83–104. [Google Scholar] [CrossRef]
- Belaud, J.P.; Negny, S.; Dupros, F.; Michéa, D.; Vautrin, B. Collaborative simulation and scientific big data analysis: Illustration for sustainability in natural hazards management and chemical process engineering. Comput. Ind. 2014, 65, 521–535. [Google Scholar] [CrossRef]
- Kambatla, K.; Kollias, G.; Kumar, V.; Grama, A. Trends in big data analytics. J. Parallel Distrib. Comput. 2014, 74, 2561–2573. [Google Scholar] [CrossRef]
- Bettencourt-Silva, J.H.; Clark, J.; Cooper, C.S.; Mills, R.; Rayward-Smith, V.J.; De La Iglesia, B. Building data-driven pathways from routinely collected hospital data: A case study on prostate cancer. JMIR Med. Inf. 2015, 3, e26. [Google Scholar] [CrossRef] [PubMed]
- Halamka, J.D. Early experiences with big data at an academic medical center. Health Aff. 2014, 33, 1132–1138. [Google Scholar] [CrossRef] [PubMed]
- Baek, H.; Park, S.K. Sustainable developments plan for Korea through expansion of green IT: Policy issues for the effective utilization of big data. Sustainability 2015, 7, 1308–1328. [Google Scholar] [CrossRef]
- Mason-Jones, R.; Towill, D.R. Shrinking the supply Chain Uncertainty Cycle, Control. Available online: http://www.enterrasolutions.com/media/docs/2011/02/19980901d.pdf (accessed on 10 July 2015).
- Berger, P.D.; Gerstenfeld, A.; Zeng, A.Z. How many suppliers are best? A decision-analysis approach. Omega 2004, 32, 9–15. [Google Scholar] [CrossRef]
- Christopher, M.; Lee, H. Mitigating supply chain risk through improved confidence. Int. J. Phys. Distrib. Logist. Manag. 2004, 34, 388–396. [Google Scholar] [CrossRef]
- LaLonde, B.J. A Crisis in Transportation. In Supply Chain Management Review; EH Publishing: Framingham, MA, USA, 2004; pp. 7–8. [Google Scholar]
- Norrman, A.; Jansson, U. Ericsson’s proactive supply chain risk management approach after a serious sub-supplier accident. Int. J. Phys. Distrib. Logist. Manag. 2004, 34, 434–456. [Google Scholar] [CrossRef]
- Quinn, F. Risky Business. In Supply Chain Management Review; EH Publishing: Framingham, MA, USA, 2006. [Google Scholar]
- Tang, C.S. Perspectives in supply chain risk management. Int. J. Prod. Econ. 2006, 103, 451–488. [Google Scholar] [CrossRef]
- Hendricks, K.B.; Singhal, V.R. An Empirical Analysis of the Effect of Supply Chain Disruptions on Long-Run Stock Price Performance and Equity Risk of the Firm. Prod. Oper. Manag. 2005, 14, 35–52. [Google Scholar] [CrossRef]
- Sheffi, Y.; Rice, J.B. A Supply Chain View of the Resilient Enterprise. MIT Sloan Manag. Rev. 2005, 47, 41–48. [Google Scholar]
- Jüttner, U. Supply chain risk management: Understanding the business requirements from a practitioner perspective. Int. J. Logist. Manag. 2005, 16, 120–141. [Google Scholar] [CrossRef]
- Choi, T.M.; Chan, H.K.; Yue, X. Recent development in big data analytics for business operations and risk management. IEEE Trans. Cybern. 2017, 47, 81–92. [Google Scholar] [CrossRef] [PubMed]
- Chan, H.K.; Choi, T.M.; Yue, X. Guest Editorial Big Data Analytics: Risk and Operations Management for Industrial Applications. IEEE Trans. Ind. Inf. 2016, 12, 1214–1218. [Google Scholar] [CrossRef]
- Lee, H.L. Aligning Supply Chain Strategies with Product Uncertainties. Calif. Manag. Rev. 2002, 44, 105–119. [Google Scholar] [CrossRef]
- Lee, H.L. The Triple-A Supply Chain. Harv. Bus. Rev. 2004, 82, 102–112. [Google Scholar] [PubMed]
- Narayanan, V.G.; Raman, A. Aligning Incentives in Supply Chains. Harv. Bus. Rev. 2004, 82, 94–102. [Google Scholar] [PubMed]
- Amit, R.; Schoemaker, P.J.H. Strategic assets and organizational rents. Strateg. Manag. J. 1993, 14, 33–46. [Google Scholar] [CrossRef]
- Cohen, W.; Levinthal, D. Absorptive capability: A new perspective on learning and innovation. Admin. Sci. Q. 1990, 35, 128–152. [Google Scholar] [CrossRef]
- Yin, R.K. Case Study Research: Design and Methods; Sage Publications: London, UK, 2013. [Google Scholar]
- Eisenhardt, K.M. Building theories from case study research. Acade. Manag. Rev. 1989, 14, 532–550. [Google Scholar]
- Markus, M.L. Power, politics, and MIS implementation. Commun. ACM 1983, 26, 430–444. [Google Scholar] [CrossRef]
- Bonoma, T.V. Case research in marketing: Opportunities, problems, and a process. J. Mark. Res. 1985, 22, 199–208. [Google Scholar] [CrossRef]
- Rowley, J. Using case studies in research. Manag. Res. News 2002, 25, 16–27. [Google Scholar]
- Feagin, J.R.; Orum, A.M.; Sjoberg, G. Conclusion: The present crisis in US sociology. In A Case for the Case Study; University of North Carolina Press: Chapel Hill, NC, USA, 1991; pp. 269–278. [Google Scholar]
- Drucker, P.F. The changed world economy. Foreign Aff. 1986, 64, 768–791. [Google Scholar] [CrossRef]
- Yin, R.K. Qualitative Research from Start to Finish; The Guilford Press: New York, NY, USA, 2011. [Google Scholar]
- Judd, C.M. Combining process and outcome evaluation. New Dir. Progr. Eval. 1987, 35, 23–41. [Google Scholar] [CrossRef]
- Kidder, L.H.; Fine, M. Qualitative and quantitative methods: When stories converge. New Dir. Eval. 1987, 35, 57–75. [Google Scholar] [CrossRef]
- Liebow, E. Tally’s Corner: A Study of Negro Street Corner Men; Rowman & Littlefield Publishers: New York, NY, USA, 2003. [Google Scholar]
- Naim, M.M.; Childerhouse, P.; Disney, S.M.; Towill, D.R. A supply chain diagnostic methodology: Determining the vector of change. Comput. Ind. Eng. 2002, 43, 135–157. [Google Scholar] [CrossRef]
- Wang, Y.; Lalwani, C.S. Using e-business to enable customized logistics sustainability. Int. J. Logist. Manag. 2007, 18, 402–419. [Google Scholar] [CrossRef]
- World Bank Report. International LPI Global Rankings. Available online: http://lpi.worldbank.org/international/global (accessed on 15 June 2016).
- Chandra, P.; Jain, N. The logistics sector in India: Overview and challenges. In World Scientific Series on 21st Century Business; Working Paper Series 2007; Indian Institute of Management: Ahmedabad, India, 2007; p. 105. Available online: http://iimahd.ernet.in/publications/data/2007-03-07Pankajchandra.pdf (accessed on 7 September 2016).
- Joshi, K.; Yesha, Y. Workshop on analytics for big data generated by healthcare and personalized medicine domain. In Proceedings of the 2012 Conference of the Center for Advanced Studies on Collaborative Research, Toronto, ON, Canada, 5–7 November 2012; pp. 267–269. [Google Scholar]
- Henschen, D. Merck Optimizes Manufacturing with Big Data Analytics: Information Week Connecting the Business Technology Community. Available online: http://www.informationweek.com/strategic-cio/executive-insights-and-innovation/merck-optimizes-manufacturing-with-big-data-analytics/d/d-id/1127901>.2014 (accessed on 22 July 2016).
- Peat, M. Big data in finance. In Finance: The Magazine for Finsia Members; Financial Services Institute of Australasia: Sydney, Australia, 2013; Volume 127, p. 34. [Google Scholar]
- Zhong, R.Y.; Xu, C.; Chen, C.; Huang, G.Q. Big data analytics for physical internet-based intelligent manufacturing shop floors. Int. J. Prod. Res. 2015. [Google Scholar] [CrossRef]
- Tan, K.H.; Zhan, Y.; Ji, G.; Ye, F.; Chang, C. Harvesting big data to enhance supply chain innovation capabilities: An analytic infrastructure based on deduction graph. Int. J. Prod. Econ. 2015, 165, 223–233. [Google Scholar] [CrossRef]
- Womack, J.P.; Jones, D.T.; Roos, D. The Machine that Changed the World; Rawson Associates: New York, NY, USA, 1990. [Google Scholar]
- Wheelwright, S.; Clark, K. Revolutionizing New Product Development; Free Press: New York, NY, USA, 1992. [Google Scholar]
- Chronopoulos, M.; De Reyck, B.; Siddiqui, A. The value of capacity sizing under risk aversion and operational flexibility. IEEE Trans. Eng. Manag. 2013, 60, 272–288. [Google Scholar] [CrossRef]
- Choi, J.; Jun, S.; Park, S. A Patent Analysis for Sustainable Technology Management. Sustainability 2016, 8, 688. [Google Scholar] [CrossRef]
- Choy, M.; Park, G. Sustaining Innovative Success: A Case Study on Consumer-Centric Innovation in the ICT Industry. Sustainability 2016, 8, 986. [Google Scholar] [CrossRef]
Figure 1.
Steps involved in research methodology.

Figure 2.
Surat Milk Union Limited (SUMUL) Supply chain activities.

Figure 3.
Block chilling units marked in Fleeton.

Figure 4.
Geo-fence markings in Fleeton.

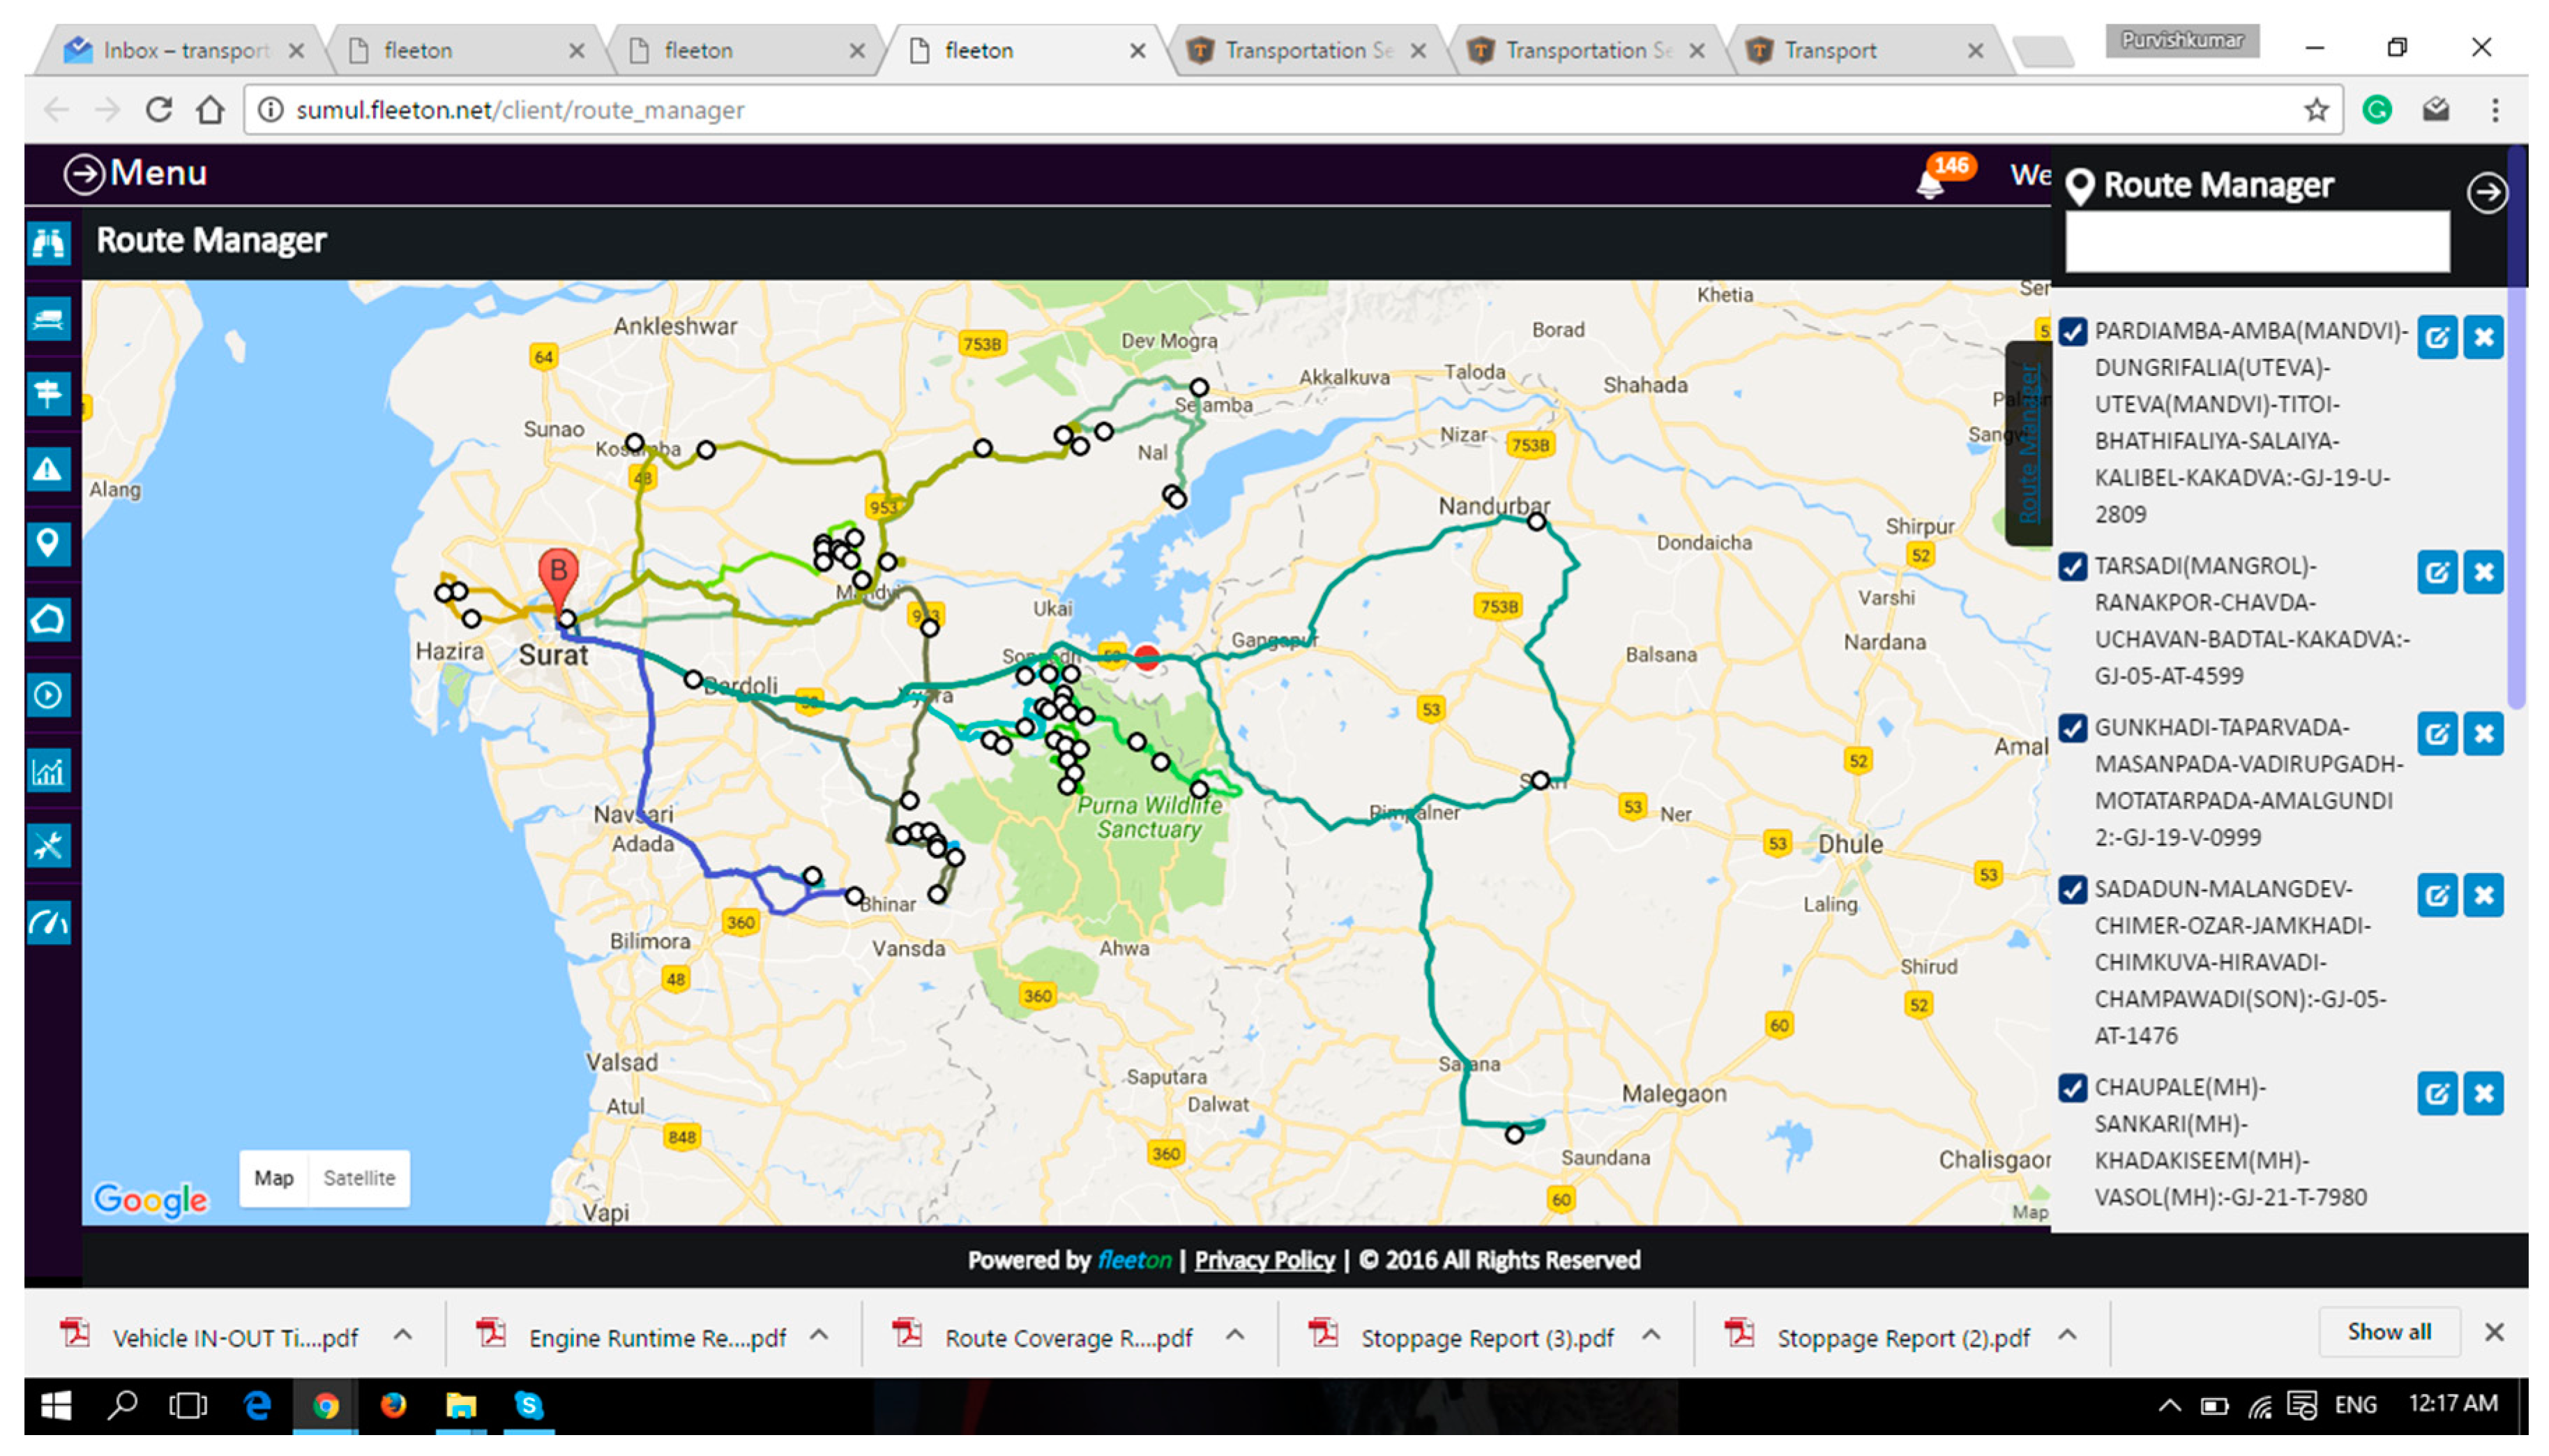
Figure 5.
Different routes vs. vehicle assignments.

Figure 6.
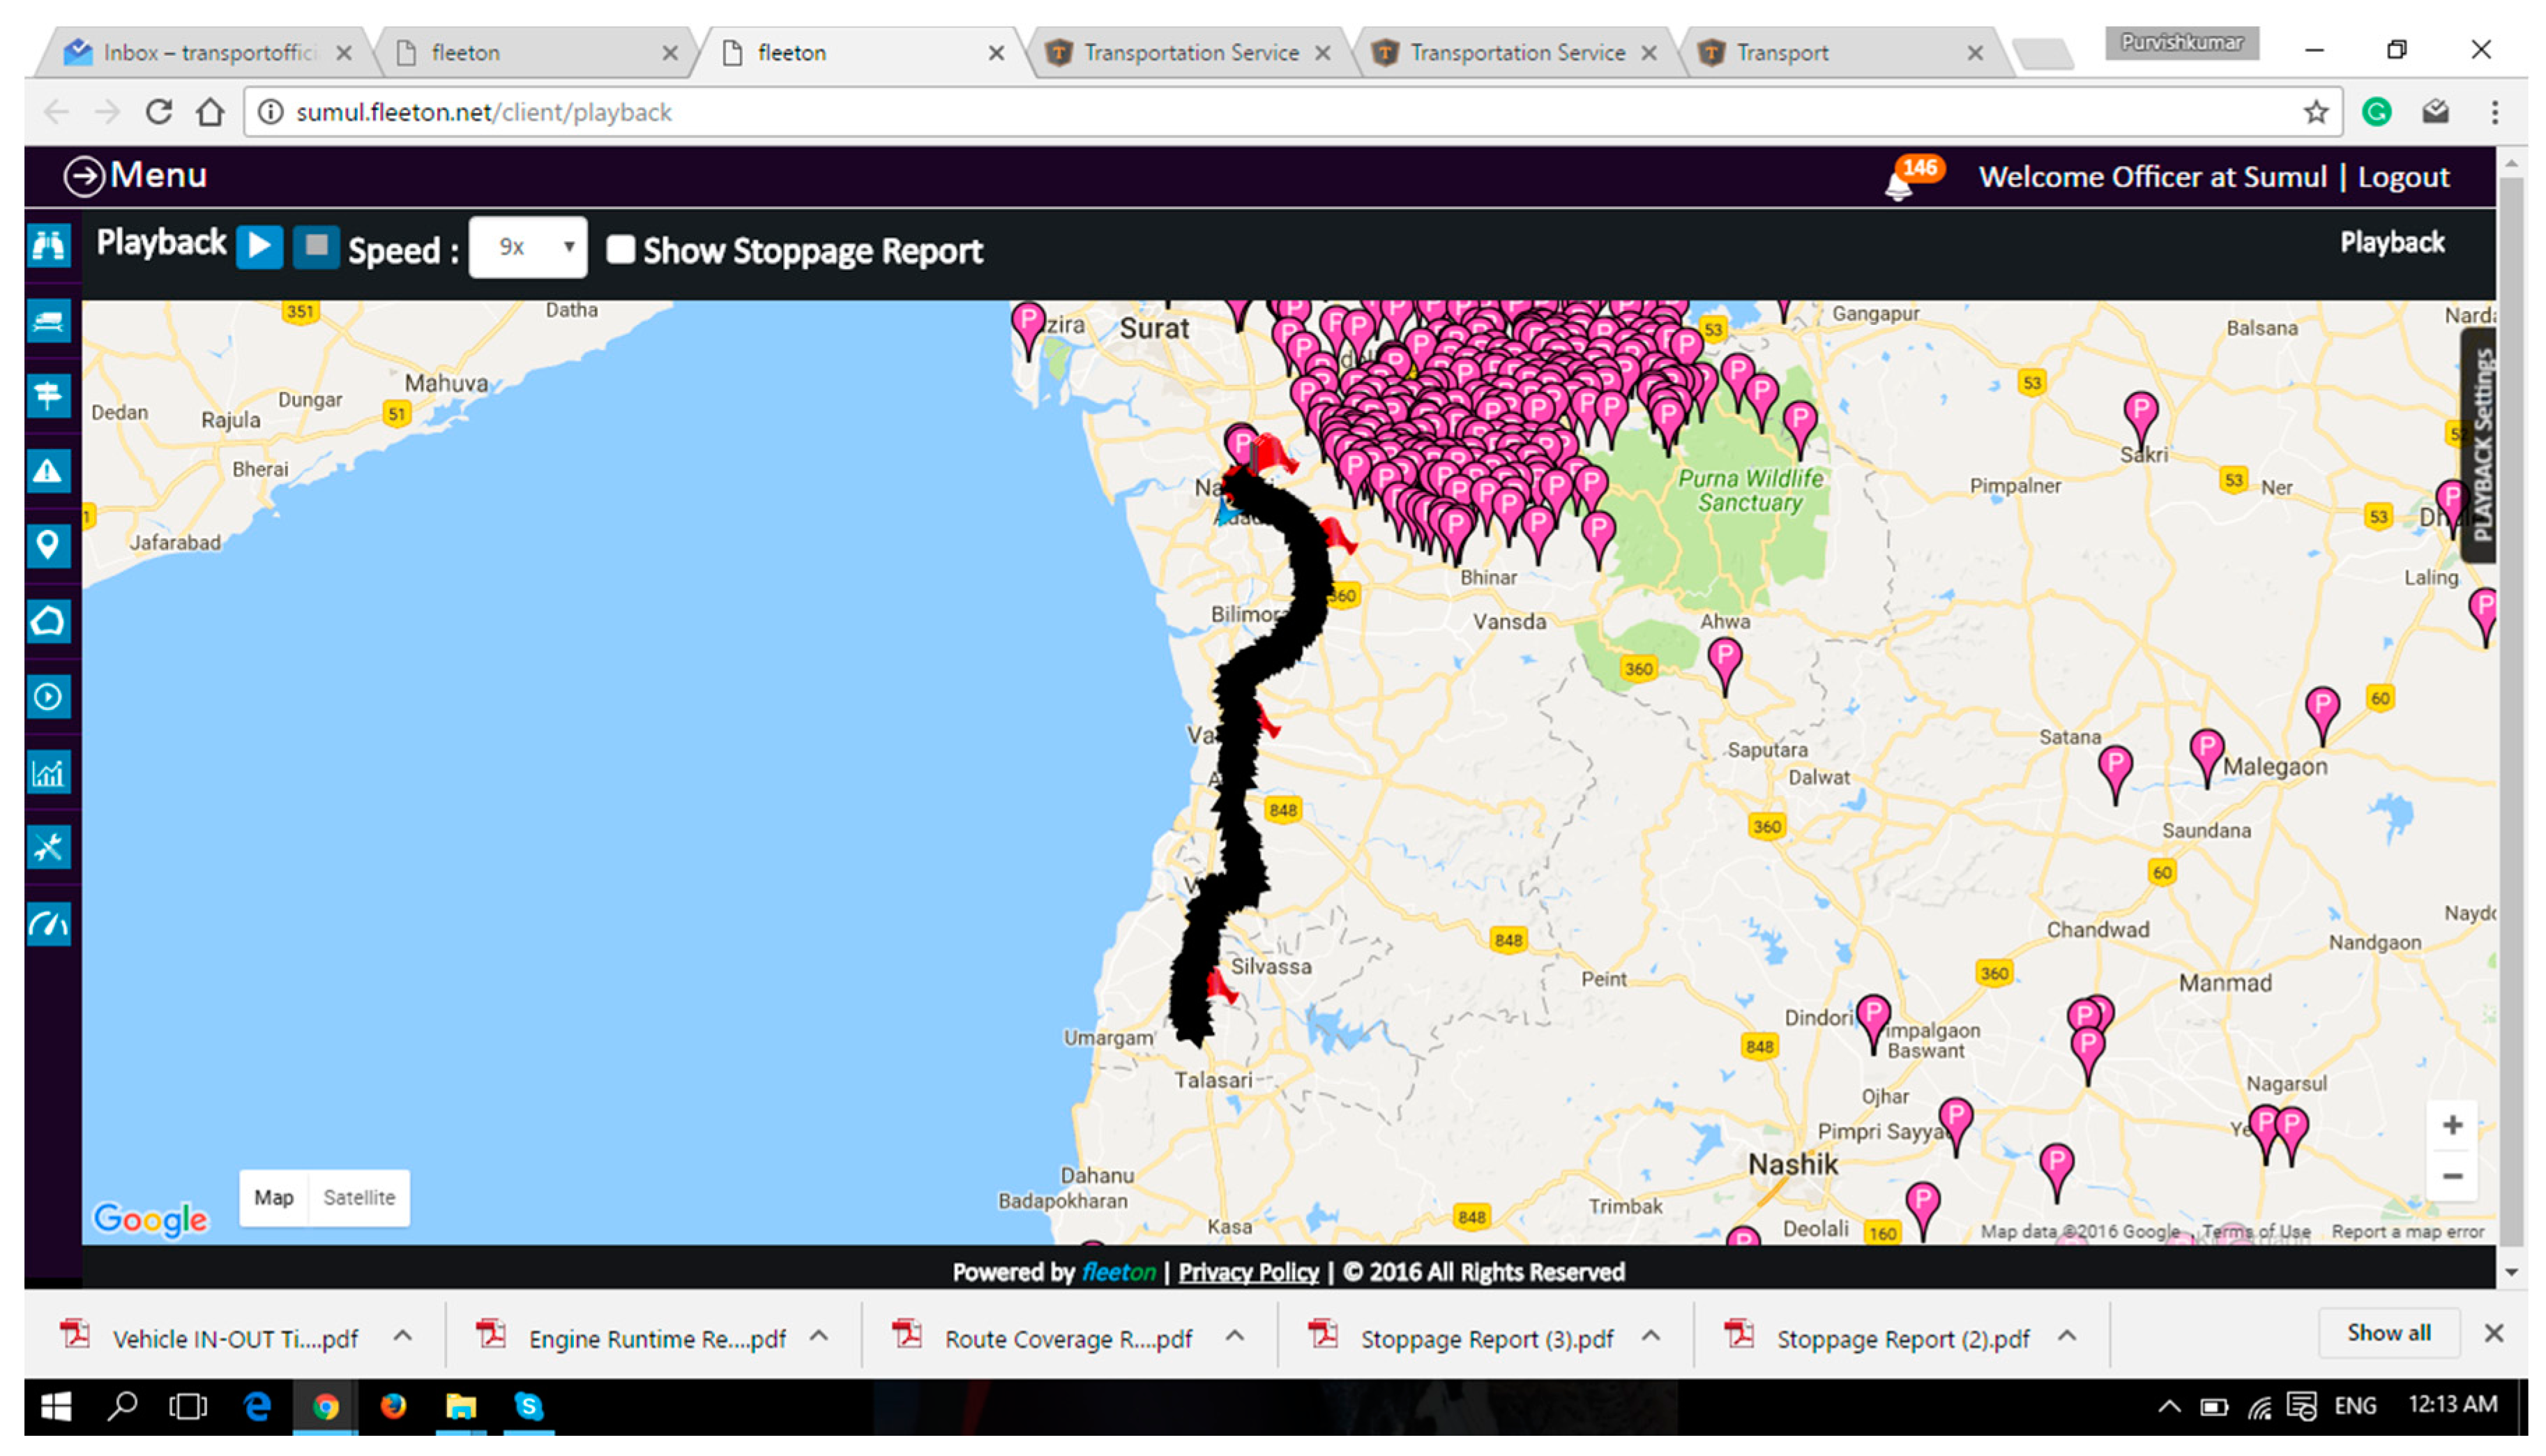
Play-back tracing (historical route).

Figure 7.
Round-trip report from Fleeton server indicating total distance vehicles traveled.

Figure 8.
Vehicle speed report for the vehicle no GJ 19, 2909 on 5 November 2016.


Table 1.
Supply chain social issues and their ranking.
| Serial. No. | Logistical Issues that Cause Disruptions | Mean | Ranking | Standard Deviation |
|---|---|---|---|---|
| 1 | Workforce safety | 4.29 | 1 | 0.757 |
| 2 | Monitoring fuel-consumption (looking for excessive fuel consumption) | 3.98 | 2 | 1.033 |
| 3 | Theft of vehicles and goods | 3.96 | 3 | 1.167 |
| 4 | Tracking workforce health and drinking and driving | 3.89 | 4 | 1.112 |
| 5 | Controlling fuel cost (fuel economy) | 3.84 | 5 | 1.167 |
| 6 | Route optimization (time, route, energy, go green) | 3.73 | 6 | 1.321 |
| 7 | Proof of delivery | 3.64 | 7 | 1.228 |
| 8 | Unethical workforce activities (fuel adulteration, goods theft, information sharing) | 3.62 | 8 | 1.248 |
| 9 | Workforce security (robbery, communal clash) | 3.62 | 9 | 1.072 |
| 10 | Traffic violations (parking in no parking areas, signal jumping, abandoning vehicles) | 3.60 | 10 | 1.214 |
| 11 | Unscrupulous workforce behavior (loading unwanted and restricted material, vehicle movements in restricted areas, door open) | 3.60 | 11 | 1.268 |
| 12 | Natural calamities (floods, earthquakes, riots, agitations, fire) | 3.49 | 12 | 1.456 |
| 13 | Overspeeding | 3.29 | 13 | 1.359 |
Table 2.
Correlation matrix among the sustainability issues.
| Social issues | 13 | 12 | 11 | 10 | 9 | 8 | 7 | 6 | 5 | 4 | 3 | 2 | 1 |
|---|---|---|---|---|---|---|---|---|---|---|---|---|---|
| Traffic violations (parking in no parking areas, signal jumping, abandoned vehicles) | −0.157 | 0.047 | −0.051 | −0.189 | −0.295 * | 0.244 | −0.189 | −0.267 | 0.003 | 0.189 | 0.209 | −0.237 | |
| Unethical acts by workforce (fuel adulteration, goods theft, information sharing etc.) | 0.054 | −0.148 | −0.145 | 0.073 | 0.489 ** | −0.119 | 0.146 | 0.262 | −0.230 | −0.098 | −0.296 * | ||
| Over-speeding thereby causing injury and accidents | −0.062 | −0.044 | 0.172 | 0.404 ** | −0.412 ** | 0.115 | 0.077 | −0.061 | 0.023 | 0.280 | |||
| Unscrupulous workforce behavior (loading unwanted and restricted material, vehicle movements in restricted areas) | −0.002 | 0.028 | 0.274 | 0.009 | −0.011 | 0.049 | 0.053 | 0.005 | 0.018 | ||||
| Theft of vehicle and goods | −0.054 | 0.244 | 0.346 * | 0.052 | 0.036 | 0.162 | −0.032 | 0.092 | |||||
| Workforce safety | 0.384 ** | −0.050 | 0.309 * | 0.382 ** | 0.101 | 0.078 | −0.086 | ||||||
| Workforce security (robbery, communal clash) | −0.141 | −0.151 | −0.036 | −0.035 | 0.264 | −0.302 * | |||||||
| Controlling fuel cost (fuel economy) | 0.367 * | −0.229 | −0.066 | −0.151 | −0.160 | ||||||||
| Route optimization | −0.025 | 0.029 | −0.113 | −0.256 | |||||||||
| Proof of goods delivery | 0.188 | −0.042 | 0.370 * | ||||||||||
| Workforce health and tracking (workforce health, drunk and driving) | 0.104 | 0.077 | |||||||||||
| Fuel consumption monitoring (excessive fuel consumptions) | −0.098 | ||||||||||||
| Natural calamities such as flood, earthquake, riots, agitations, fire etc. |
*, ** shows the degree of correlation between issues.
Table 3.
Volume of data captured by Fleeton servers on daily basis.
| No. | Summary of Vehicle Activities | Daily Average Report/Vehicle | Tankers 79-In/97 Out | Block Chilling Units (Total No: 489) | Data Captured (Inbound, Outbound) | Total Volume of Data Captured (Daily) |
|---|---|---|---|---|---|---|
| 1 | Distance report | 20 * | 20 × 79 | 20 × 79 × 489 | In | 7,72,620 data points |
| 2 | Engine run time report | 30 * | 30 × 79 | 30 × 79 × 489 | In | 1,158,930 data points |
| 3 | Fleet utilization report | 79 * | 79 | 79 × 489 | In | 38,631 data points |
| 4 | Round-trip report | 25 * (RT1) 35 * (RT2) | 79 × 25 79 × 35 | 1975 × 489 2765 × 489 | In | 965,775 data points 1,352,085 data points |
| 5 | Vehicle stoppage report | 95 * | 95 × 79 | 95 × 79 × 489 | In | 3,669,945 data points |
| 6 | Vehicle speed | 958 * | 958 × 79 | 958 × 79 × 489 | In | 37,008,498 data points |
| 7 | Vehicle in–out | 36 * | 36 × 79 | 36 × 79 × 489 | In | 1,390,716 data points |
| 8 | Geo-fencing report | 19 * | 19 × 79 | 19 × 79 × 489 | In | 733,989 data points |
| 10 | Playback tracing | 920 * | 920 × 79 | 920 × 79 × 489 | In | 35,540,520 data points |
* Average values are calculated based on previous records from Fleeton server (total data captured in a month/30). RT = round trip.
Table 4.
Engines’ run-time report of vehicle GJ-19-U-2909 (Milk Tanker 2909).
| SR No. | From Date | From Location | To Date | To Location | Duration |
|---|---|---|---|---|---|
| 1 | 6 November 2016 00:20:06 | Mahuva-Anawal Rd., Tarkani, Gujarat 394248, India | 6 November 2016 00:42:50 | Mahuva-Anawal Rd., Bamaniya, Gujarat 394246, India | 22 min 44 s |
| 2 | 6 November 2016 00:58:10 | Mahuva-Anawal Rd., Bamaniya, Gujarat 394246, India | 6 November 2016 01:04:07 | SH 180, Vadi Faliya, Gujarat 394246, India | 5 min 57 s |
| 3 | 6 November 2016 02:12:18 | SH 180, Gunasvel, Gujarat 394246, India | 6 November 2016 02:20:09 | SH 180, Kumbhar Faliya, Gujarat 394245, India | 7 min 51 s |
| 4 | 6 November 2016 03:24:30 | SH 180, Kumbhar Faliya, Gujarat 394245, India | 6 November 2016 04:28:04 | Thakorji Complex, 121, Surat-Kadodara Rd., Kadodra, Kadodara, Gujarat 394325, India | 1 h 3 min 34 s |
| 5 | 6 November 2016 05:13:38 | 61, Surat-Kadodara Rd., Kadodara, Gujarat 394327, India | 6 November 2016 05:38:17 | JayPrakash Narayan Marg, Sahara Darwaja, Begampura, Surat, Gujarat 395003, India | 24 min 39 s |
| 6 | 6 November 2016 05:45:21 | Jay Prakash Narayan Marg, Sahara Darwaja, Begampura, Surat, Gujarat 395003, India | 6 November 2016 05:49:38 | 81, Sumul Dairy Rd., Sardar Nagar Society, Sardar Nagar, Patel Nagar, Surat, Gujarat 395008, India | 4 min 17 s |
| 7 | 6 November 2016 05:56:55 | 81, Sumul Dairy Rd., Sardar Nagar Society, Sardar Nagar, Patel Nagar, Surat, Gujarat 395008, India | 6 November 2016 05:59:10 | 3, Sumul Dairy Rd., Sahyog Society, Alkapuri Society, Patel Nagar, Surat, Gujarat 395008, India | 2 min 15 s |
| 8 | 6 November 2016 06:12:14 | 3, Sumul Dairy Rd., Sahyog Society, Alkapuri Society, Patel Nagar, Surat, Gujarat 395008, India | 6 November 2016 07:28:33 | 3, Sumul Dairy Rd., Sahyog Society, Alkapuri Society, Patel Nagar, Surat, Gujarat 395008, India | 1 h 16 min 19 s |
| 9 | 6 November 2016 07:47:48 | 3, Sumul Dairy Rd., Sahyog Society, Alkapuri Society, Patel Nagar, Surat, Gujarat 395008, India | 6 November 2016 08:20:00 | Surat-Bardoli Rd., Jolva, Gujarat 394310, India | 32 min 12 s |
| 10 | 6 November 2016 08:22:35 | Surat-Bardoli Rd., Jolva, Gujarat 394310, India | 6 November 2016 08:28:13 | Surat-Bardoli Rd., Dastan, Gujarat 394305, India | 5 min 38 s |
| 11 | 6 November 2016 08:30:36 | Surat-Bardoli Rd., Dastan, Gujarat 394305, India | 6 November 2016 08:57:02 | Kadodra-Antapur, Khali, Gujarat 394620, India | 26 min 26 s |
| 12 | 6 November 2016 09:21:37 | Kadodra-Antapur, Khali, Gujarat 394620, India | 6 November 2016 09:25:37 | Songada-Surat, Khali, Gujarat 394620, India | 4 min |
| 13 | 6 November 2016 09:25:57 | Songada-Surat, Khali, Gujarat 394620, India | 6 November 2016 09:27:26 | Songada-Surat, Tajpor Khurd, Gujarat 394620, India | 1 min 29 s |
| 14 | 6 November 2016 09:43:01 | Songada-Surat, Tajpor Khurd, Gujarat 394620, India | 6 November 2016 09:43:12 | Songada-Surat, Tajpor Khurd, Gujarat 394620, India | 11 s |
| 15 | 6 November 2016 09:43:38 | Songada-Surat, Tajpor Khurd, Gujarat 394620, India | 6 November 2016 10:01:01 | Bajipura Bypass Rd., Bajipura, Gujarat 394690, India | 17 min 23 s |
| 16 | 6 November 2016 10:51:19 | Bajipura Bypass Rd., Bajipura, Gujarat 394690, India | 6 November 2016 11:21:11 | Unnamed Road, Chakalia, Gujarat 394650, India | 29 min 52 s |
| 17 | 6 November 2016 11:54:12 | Unnamed Road, Chakalia, Gujarat 394650, India | 6 November 2016 12:23:06 | Unnamed Road, Nishana, Gujarat 394651, India | 28 min 54 s |
| 18 | 6 November 2016 13:22:19 | Unnamed Road, Nishana, Gujarat 394651, India | 6 November 2016 13:43:33 | 21 min 14 s | |
| 19 | 6 November 2016 14:16:15 | Unnamed Road, Chorvad, Gujarat 394650, India | 6 November 2016 14:24:22 | Unnamed Road, Khambhala, Gujarat 394650, India | 8 min 7 s |
| 20 | 6 November 2016 14:42:20 | Unnamed Road, Khambhala, Gujarat 394650, India | 6 November 2016 14:44:33 | Songada-Surat, Khambhala, Gujarat 394650, India | 2 min 13 s |
| 21 | 6 November 2016 14:53:36 | Songada-Surat, Khambhala, Gujarat 394650, India | 6 November 2016 15:01:54 | Unnamed Road, Kanala, Gujarat 394365, India | 8 min 18 s |
| 22 | 6 November 2016 15:32:36 | Unnamed Road, Kanala, Gujarat 394365, India | 6 November 2016 15:59:41 | Unnamed Road, Chapaldhara, Gujarat 394365, India | 27 min 5 s |
| 23 | 6 November 2016 16:04:05 | Unnamed Road, Chapaldhara, Gujarat 394365, India | 6 November 2016 16:10:00 | Unnamed Road, Songadh, Gujarat 394365, India | 5 min 55 s |
| 24 | 6 November 2016 16:54:37 | Unnamed Road, Songadh, Gujarat 394365, India | 6 November 2016 17:14:53 | Unnamed Road, Jharali, Gujarat 394365, India | 20 min 16 s |
| 25 | 6 November 2016 17:15:36 | Unnamed Road, Jharali, Gujarat 394365, India | 6 November 2016 17:20:52 | Unnamed Road, Bedvan P Umarda, Gujarat 394365, India | 5 min 16 s |
| 26 | 6 November 2016 17:45:40 | Unnamed Road, Bedvan P Umarda, Gujarat 394365, India | 6 November 2016 18:03:51 | Unnamed Road, Vadpada P Tokarva, Gujarat 394365, India | 18 min 11 s |
| 27 | 6 November 2016 18:19:18 | Unnamed Road, Vadpada P Tokarva, Gujarat 394365, India | 6 November 2016 18:56:39 | GJ SH 172, Vyara, Gujarat 394650, India | 37 min 21 s |
| 28 | 6 November 2016 19:37:26 | GJ SH 176, Vyara, Gujarat 394650, India | 6 November 2016 20:57:45 | Chhatrala Complex, 111-112, Surat-Kadodara Rd., Tal. Palsana, Vareli, Gujarat 394327, India | 1 h 20 min 19 s |
Table 5.
Fleet-utilization report for the period from 18 October 2016 to 27 October 2016.
| SR# | Vehicle | Utilized (%) | Unutilized (%) |
|---|---|---|---|
| 1 | GJ-19-U-2809 (Milk Tanker 2809) | 31.74 | 68.26 |
| 2 | GJ-05-AV-3499 (Milk Tanker 3499) | 21.48 | 78.52 |
| 3 | GJ-19-X-2709 (Milk Tanker 2709) | 39.67 | 60.33 |
| 4 | GJ-19-U-3809 (Milk Tanker 3809) | 33.45 | 66.55 |
| 5 | GJ-19-U-4909 (Milk Tanker 4909) | 35.61 | 64.39 |
| 6 | GJ-19-V-0999 (Milk Tanker 0999) | 52.57 | 47.43 |
| 7 | GJ-05-BT-8008 (Milk Tanker 8008) | 29.18 | 70.82 |
| 8 | GJ-05-AU-5897 (Milk Tanker 5897) | 40.47 | 59.53 |
| 9 | GJ-19-V-4709 (Milk Tanker 4709) | 39.35 | 60.65 |
| 10 | GJ-19-T-3409 (Milk Tanker 3409) | 33.02 | 66.98 |
| 11 | GJ-21-T-7737 (Milk Tanker 7737) | 40.97 | 59.03 |
| 12 | GJ-19-V-3909 (Milk Tanker 3909) | 35.49 | 64.51 |
| 13 | GJ-05-AT-2278 (Milk Tanker 2278) | 32.37 | 67.63 |
| 14 | GJ-19-U-3609 (Milk Tanker 3609) | 32.4 | 67.6 |
| 15 | GJ-19-U-7609 (Milk Tanker 7609) | 35.36 | 64.64 |
| 16 | GJ-21-V-9060 (Milk Tanker 9060) | 41.31 | 58.69 |
| 17 | GJ-19-V-8181 (Milk Tanker 8181) | 19.53 | 80.47 |
| 18 | GJ-05-AT-1098 (Milk Tanker 1098) | 28.79 | 71.21 |
| 19 | GJ-19-T-3709 (Milk Tanker 3709) | 36.45 | 63.55 |
| 20 | GJ-19-V-4809 (Milk Tanker 4809) | 31.29 | 68.71 |
| 21 | GJ-19-V-4509 (Milk Tanker 4509) | 35.89 | 64.11 |
| 22 | GJ-05-AZ-4201 (Milk Tanker 4201) | 34.66 | 65.34 |
| 23 | GJ-19-V-4209 (Milk Tanker 4209) | 40.2 | 59.8 |
| 24 | GJ-19-X-2636 (Milk Tanker 2636) | 22.29 | 77.71 |
| 25 | GJ-19-U-2909 (Milk Tanker 2909) | 45.06 | 54.94 |
| 26 | GJ-19-U-7709 (Milk Tanker 7709) | 36.64 | 63.36 |
| 27 | GJ-05-YY-7236 (Milk Tanker 7236) | - | - |
| 28 | GJ-05-AT-1476 (Milk Tanker 1476) | 34.38 | 65.62 |
| 29 | GJ-05-AT-4599 (Milk Tanker 4599) | 38.18 | 61.82 |
| 30 | GJ-05-AZ-1818 (Milk Tanker 1818) | 32.08 | 67.92 |
| 31 | GJ-05-AU-8868 (Milk Tanker 8868) | 34.04 | 65.96 |
| 32 | GJ-19-T-9099 (Milk Tanker 9099) | 39.61 | 60.39 |
| 33 | GJ-21-V-8970 (Milk Tanker 8970) | 44.17 | 55.83 |
| 34 | GJ-19-T-3445 (Milk Tanker 3445) | 32.89 | 67.11 |
| 35 | GJ-21-T-7980 (Milk Tanker 7980) | 40.89 | 59.11 |
| 36 | GJ-21-V-5640 (Milk Tanker 5640) | 38.75 | 61.25 |
| 37 | GJ-21-T-7773 (Milk Tanker 7773) | 44.62 | 55.38 |
| 38 | GJ-19-T-3598 (Milk Tanker 3598) | 83.47 | 16.53 |
| 39 | GJ-02-Z-9696 (Milk Tanker 9696) | 39.77 | 60.23 |
| 40 | GJ-02-Z-881 (Milk Tanker 881) | 30.23 | 69.77 |
| 41 | GJ-02-Z-1157 (Milk Tanker 1157) | 39.41 | 60.59 |
| 42 | GJ-02-Z-8319 (Milk Tanker 8319) | 44.68 | 55.32 |
| 43 | GJ-21-Z-9600 (Milk Tanker 9600) | 31.36 | 68.64 |
| 44 | GJ-21-V-4560 (Milk Tanker 4560) | 36.55 | 63.45 |
| 45 | GJ-21-V-9330 (Milk Tanker 9330) | 41.07 | 58.93 |
| 46 | GJ-02-Z-9496 (Milk Tanker 9496) | 20.23 | 79.77 |
| 47 | GJ-02-Z-4501 (Millk Tanker 4501) | 24.98 | 75.02 |
| 48 | GJ-02-Z-851 (Milk Tanker 851) | 26.33 | 73.67 |
| 49 | GJ-19-U-4109 (Milk Tanker 4109) | 42.14 | 57.86 |
| 50 | GJ-05-BT-4509 (Milk Tanker 4509) | 56.58 | 43.42 |
Table 6.
Vehicle Speed Report for (GJ-19-U-2909) Milk Tanker 2909 on 5 November 2016.
| SR# | Date/Time | Speed | Driver Name |
|---|---|---|---|
| 1 | 5 November 2016 07:09:12 am | 0 KMPH | |
| 2 | 5 November 2016 07:13:31 am | 0 KMPH | |
| 3 | 5 November 2016 07:13:42 am | 0 KMPH | |
| 4 | 5 November 2016 07:30:38 am | 16 KMPH | |
| 5 | 5 November 2016 07:30:58 am | 32 KMPH | |
| 6 | 5 November 2016 07:31:18 am | 16 KMPH | |
| 7 | 5 November 2016 07:31:38 am | 33 KMPH | |
| 8 | 5 November 2016 07:33:58 am | 15 KMPH | |
| 9 | 5 November 2016 07:34:18 am | 35 KMPH | |
| 10 | 5 November 2016 07:34:38 am | 7 KMPH | |
| 11 | 5 November 2016 07:35:39 am | 23 KMPH | |
| 12 | 5 November 2016 07:35:59 am | 41 KMPH | |
| 13 | 5 November 2016 07:36:19 am | 43 KMPH | |
| 14 | 5 November 2016 07:36:39 am | 44 KMPH | |
| 15 | 5 November 2016 07:36:59 am | 45 KMPH | |
| 16 | 5 November 2016 07:37:19 am | 45 KMPH | |
| 17 | 5 November 2016 07:37:39 am | 46 KMPH | |
| 18 | 5 November 2016 07:38:19 am | 44 KMPH | |
| 19 | 5 November 2016 07:38:39 am | 45 KMPH | |
| 20 | 5 November 2016 07:39:19 am | 49 KMPH | |
| 21 | 5 November 2016 07:39:39 am | 37 KMPH | |
| 22 | 5 November 2016 07:39:59 am | 37 KMPH | |
| 23 | 5 November 2016 07:40:19 am | 40 KMPH | |
| 24 | 5 November 2016 07:40:39 am | 44 KMPH | |
| 25 | 5 November 2016 07:40:59 am | 43 KMPH | |
| 26 | 5 November 2016 07:41:19 am | 42 KMPH | |
| 27 | 5 November 2016 07:41:39 am | 45 KMPH | |
| 28 | 5 November 2016 07:41:59 am | 44 KMPH | |
| 29 | 5 November 2016 07:42:19 am | 45 KMPH | |
| 30 | 5 November 2016 07:42:39 am | 44 KMPH |
Table 7.
Vehicle stoppage report for GJ-19-V-0999 from 31 October 2016 to 6 October 2016.
| SR# | Stoppage Time | Stoppage Duration | Stoppage Location |
|---|---|---|---|
| 1 | From 31 October 2016, 09:33:26 to 31 October 2016, 09:34:31 | 1 min 5 s | Vyara Bypass Rd., Virpur, Gujarat 394650, India |
| 2 | From 31 October 2016, 20:48:42 to 31 October 2016, 20:50:45 | 2 min 3 s | Songada-Surat, Hindolia, Gujarat 394620, India |
| 3 | From 1 November 2016, 07:32:37 to 1 November 2016, 07:46:46 | 14 min 9 s | Gujarat State Highway 167, Kamrej, Gujarat 394185, India |
| 4 | From 1 November 2016, 08:21:29 to 1 November 2016, 08:57:20 | 35 min 51 s | Gujarat State Highway 167, Vihan, Gujarat 394140, India |
| 5 | From 1 November 2016, 14:48:46 to 1 November 2016, 14:53:54 | 5 min 8 s | Gujarat State Highway 167, Netrang, Gujarat 394180, India |
| 6 | From 1 November 2016, 22:12:04 to 1 November 2016, 22:13:10 | 1 min 6 s | Unnamed Road, Panchol, Gujarat 394635, India |
| 7 | From 3 November 2016, 07:50:07 to 3 November 2016, 08:00:35 | 10 min 28 s | Gujarat State Highway 167, Kamrej, Gujarat 394185, India |
| 8 | From 4 November 2016, 09:48:44 to 4 November 2016, 09:55:24 | 6 min 40 s | Vyara Bypass Rd., Katgadh, Gujarat 394650, India |
| 9 | From 4 November 2016, 18:47:25 to 4 November 2016, 18:53:47 | 6 min 22 s | Surat-Kadodara Rd., Bareli, Tal. Palsana, Naya Bazar, Kadodra, Vareli, Gujarat 394327, India. |
| 10 | From 5 November 2016, 08:29:59 to 5 November 2016, 08:39:29 | 9 min 30 s | Mahuva-Bardoli Rd., Isroli, Gujarat 394620, India |
© 2017 by the authors. Licensee MDPI, Basel, Switzerland. This article is an open access article distributed under the terms and conditions of the Creative Commons Attribution (CC BY) license (http://creativecommons.org/licenses/by/4.0/).
Share and Cite
MDPI and ACS Style
Mani, V.; Delgado, C.; Hazen, B.T.; Patel, P. Mitigating Supply Chain Risk via Sustainability Using Big Data Analytics: Evidence from the Manufacturing Supply Chain. Sustainability 2017, 9, 608. https://doi.org/10.3390/su9040608
AMA Style
Mani V, Delgado C, Hazen BT, Patel P. Mitigating Supply Chain Risk via Sustainability Using Big Data Analytics: Evidence from the Manufacturing Supply Chain. Sustainability. 2017; 9(4):608. https://doi.org/10.3390/su9040608
Chicago/Turabian StyleMani, Venkatesh, Catarina Delgado, Benjamin T. Hazen, and Purvishkumar Patel. 2017. "Mitigating Supply Chain Risk via Sustainability Using Big Data Analytics: Evidence from the Manufacturing Supply Chain" Sustainability 9, no. 4: 608. https://doi.org/10.3390/su9040608
Note that from the first issue of 2016, this journal uses article numbers instead of page numbers. See further details here.