
The Influence of Green Supply Chain Integration on Firm Performance: A Contingency and Configuration Perspective


1
Institute of Management Science and Engineering, Henan University, Kaifeng 475004, China
2
School of Economic and Management, Xi’an University of Technology, Xi’an 710054, China
3
Business School, Shandong University (Weihai), Weihai 264209, China
4
School of Management, Northwestern Polytechnical University, Xi’an 710072, China
*
Author to whom correspondence should be addressed.
Sustainability 2017, 9(5), 763; https://doi.org/10.3390/su9050763
Submission received: 3 April 2017
/
Revised: 28 April 2017
/
Accepted: 2 May 2017
/
Published: 6 May 2017
(This article belongs to the Section Economic and Business Aspects of Sustainability)
Abstract
:This study investigates the impacts of three dimensions of green supply chain integration (GSCI) on operational and financial performance, from both a contingency and a configuration perspective. From the contingency perspective, we used hierarchical regression to determine the impacts of individual GSCI dimensions (green internal, customer and supplier integration) and their interactions on firm performance. From the configuration perspective, we used cluster analysis to develop patterns of GSCI, which were analyzed in terms of GSCI strength and balance. Analysis of variance was used to examine the relationship between GSCI pattern and firm performance. We used data collected from manufacturing firms in Shanxi, Shandong, Beijing, Guangdong and Jiangsu to test hypotheses. The findings from both the contingency and configuration perspective indicate that GSCI was related to both operational and financial performance. Furthermore, the interaction between green internal integration and green customer integration was positively related to both operational and financial performance, while the interaction between green internal integration and green supplier integration was negatively related to financial performance. The interaction between green customer integration and green supplier integration was positively related to financial performance.
1. Introduction
Facing increasingly serious environmental pollution, sustainable development is becoming an important challenge for firms [1,2,3]. However, it may be difficult for an individual firm to deal with the challenges of environmental issues [4]. Firms need to integrate the resources and information possessed by different supply chain partners into its green practices to achieve environmental goals [5]. Although the importance of green supply chain integration (GSCI) has long been recognized, our understanding on its impact on firm performance is mixed. While some scholars found GSCI has positive influence on firm performance [6,7,8], others argued that GSCI may be detrimental to firm performance [9].
Thus, how GSCI influences firm performance should be well addressed to advance our understanding. In this study, we attribute the inconsistent previous findings to incomplete and evolving definitions and dimensions of GSCI. While some research focuses on the individual dimensions of GSCI [5,6], others use various synthetic definitions [10], examining GSCI as a unidimensional construct. In addition, many conceptualizations of GSCI are incomplete, leaving out the important role of green internal integration in implementing GSCI. This study will define GSCI systematically and divide it into three dimensions: green internal, customer and supplier integration.
Furthermore, findings from a contingency perspective and a configuration perspective may be complementary, which is likely to help us interpret the inconsistency in existing literature. To fully understand GSCI and its performance effect, there is a need to investigate GSCI from both a contingency and a configuration perspective. In specific, this study aims to examine both how individual dimensions of GSCI are related to different types of firm performance, as well as how patterns of GSCI are related to different types of firm performance. It is particularly important to integrate both perspectives within a single study, in order to determine whether the findings are due to the relationship between GSCI and firm performance or are an artifact of the data collection and survey design. To examine these relationships, we collected survey data from manufacturing firms in Shaanxi, Shandong, Beijing, Guangdong and Jiangsu.
From a contingency perspective, we examine the impacts of three dimensions of GSCI (green internal, customer and supplier integration) on operational and financial performance. We propose that green customer and supplier integration moderate the relationship between green internal integration and firm performance. The findings from a contingency perspective may contribute to both theory and practice by drawing more nuanced conclusions.
From a configuration perspective, we explore how different dimensions of GSCI work together to better understand how various GSCI patterns are linked with both operational and financial performance. This allows us to consider whether GSCI patterns that are either strong or balanced are more strongly related to specific performance measures, or whether organizations that have value creation processes that are well involved (strength) across the board (balance) will have better performance on all dimensions. These questions are important to decision makers because they provide insights about strategies for implementing GSCI.
The remainder of this study is structured as follows. Section 2 defines GSCI and develops research hypotheses from both a contingency and a configuration perspective. Section 3 describes the research method, and the analysis results are presented in Section 4. Following this, research findings are discussed in Section 5. Finally, theoretical contributions, managerial implications, and research limitations are presented in Section 6.
2. Theoretical Foundations and Hypotheses
2.1. Definition and Dimensions of GSCI
Previous research on GSCI has offered numerous definitions characterizing the concept. Although these studies touch many of the critical elements of GSCI, they are broad in focus. In addition, most fail to consider the strategic nature of GSCI. Consideration of the dimensionality of GSCI is also important for understanding the way that the individual dimensions operate, as well as how they function jointly. Building upon the existing literature on GSCI [3,4,5], we conceptualize GSCI as consisting of the three dimensions of green customer, supplier and internal integration. Thus, GSCI involves both inter-organizational (green customer and supplier integration) and intra-organizational (green internal integration) interfaces that integrating flows of products/services, information, capital and decisions, with the ultimate goal of providing maximum value to multiple stakeholders of the manufacturer.
Green customer and supplier integration are commonly referred to as green external integration. Green customer integration is defined as the environmental collaboration, information sharing and jointly environmental problem solving activities with major customers that provide the firm with rich information and knowledge related to green practices [3,4]. Green supplier integration involves environmental collaboration, information sharing and jointly environmental problem solving activities with major suppliers that provide the firm with core information and resources related to green practices [3,4]. In contrast, green internal integration is defined as the degree of interaction and communication, the extent of information and resource sharing, and the level of coordination across different functions and departments in the environmental management practices [3,4].
Green internal integration and green external integration may play different roles within a firm. While green internal integration recognizes that the departments and functions within a manufacturer should communicate, coordinate and share information with each other, green external integration recognizes the importance of establishing close and interactive relationships with major customers and suppliers. Both perspectives are important in allowing supply chain members to solve environmental problems jointly and co-create value, to maximize the value of different stakeholders.
2.2. Contingency Perspective of GSCI
Contingency theory is often employed to understand organizational issues from a contextual perspective [11]. Contingency theory suggests that organizations should align their structures and processes with environment to enhance performance [12]. In a supply chain, customers and suppliers can be deemed as important parts of a firm’s environment. According to structural contingency theory, the performance of an organization is influenced by how its practices are aligned [11]. Suggested by structural contingency theory, the individual dimensions of GSCI should be aligned to enhance firm performance.
2.2.1. Performance Effect of Green Internal Integration
The importance of green internal integration has been increasingly emphasized in improving firm performance. Green internal integration breaks down the hierarchical and spatial barriers and improves the linkages among different functions [4,13]. The improvement of horizontal linkages allows for information and resource sharing and cooperation among employees from different departments within the firm [14]. Green internal integration also increases the amount and variety of information available to the manufacturer [5]. These advantages from green internal integration provide the basis for sound decision making when dealing with environmental issues. In addition, frequent interactions and confrontation with different perspectives may reduce mistakes and wastes, acquire opportunities for simplification and achieve concurrent engineering [15]. In this sense, green internal integration is the base for GSCI and will be positively related to operational and financial performance.
Furthermore, green internal integration can help firms acquire knowledge related to environmental issues and achieve a balance between environmental protection and economic profits [5]. Previous studies have found that the components of green internal integration, such as cross-functional collaboration and environmental management systems have positive impacts on firm performance [3,4,5,16]. Thus, we propose:
- H1a:
- Green internal integration is positively related to operational performance of the manufacturer within a supply chain.
- H1b:
- Green internal integration is positively related to financial performance of the manufacturer within a supply chain.
2.2.2. Performance Effect of Green Customer and Supplier Integration
From the contingency perspective, manufacturers need to achieve the fit between green internal and external integration. This is consistent with the concept of “fit” between information processing capabilities and needs in information processing theory [16,17]. We can consider green internal integration as information processing capacities and consider green external integration as information processing needs [18]. To gain better performance, green internal integration should be appropriately fit with green external integration. Thus, green internal integration serves as a base for implementing green customer and supplier integration.
Since value is realized in the customer usage process rather than in the supplier value chain, green customer integration contributes to the process of marketing, consumption and delivery of products and services [19]. Green customer integration also offers opportunities for enabling manufacturers to develop environmentally friendly products in a more effective and efficient way. Moreover, green customer integration helps to build mutual understanding between a manufacturer and its customers. Thus, the manufacturer and its customers can establish international problem-solving routines to deal with environmental issues [5].
Considering suppliers sit at the intersection of many firms, they maintain extensive social ties and networks. Integrating suppliers into green practices provides manufacturers with opportunities for accessing valuable information, core resources and green technologies, which can improve their responsiveness, flexibility and customer service [5,15]. Furthermore, green supplier integration allows manufacturers to be more efficient in quality and cost management, which, in turn, helps the manufacturers improve their financial performance [20].
Green internal integration is important for effective green customer and supplier integration [21]. To implement green customer and supplier integration successfully, manufacturers need to be well internally integrated because green internal integration functions as coordination and learning mechanisms for green customer and supplier integration [22]. Green customer and supplier integration extend green internal integration by establishing a cross-functional team integrating external organizations. Accordingly, we propose:
- H2a:
- Green customer and supplier integration are positively related to operational performance of the manufacturer within a supply chain, given the relationship between green internal integration and operational performance.
- H2b:
- Green customer and supplier integration are positively related to financial performance of the manufacturer within a supply chain, given the relationship between green internal integration and financial performance.
2.2.3. Interaction Effects
Contingency theory also suggests that individual dimensions of GSCI will interact to influence firm performance. Suggested by the work of [22], there are four different relationships between green internal and external integration: (1) Green internal integration serves as a coordination capability for facilitating green external integration; (2) Green internal integration norms are similar to green external integration norms; (3) Green external integration may stimulate green internal integration; (4) Green internal integration represents an organizational capability for learning from external partners. Luo et al. [23] found that internal coordination capability moderates the relationship between supplier involvement and product development performance. Feng et al. [24] addressed that the interaction between customer involvement and internal integration is related to time to market of new products. According to the above arguments, we hypothesize:
- H3a:
- The two- and three-way interactions between green internal, customer and supplier integration are positively related to operational performance of the manufacturer within a supply chain.
- H3b:
- The two- and three-way interactions between green internal, customer and supplier integration are positively related to financial performance of the manufacturer within a supply chain.
2.3. Configuration Perspective of GSCI
Since contingency perspective views GSCI in a reductionist way, the complicated relationships among three dimensions of GSCI are not explored holistically. To complement the findings of contingency perspective, we also investigate GSCI from configuration perspective. Configuration theory argues that organizational elements tend to cluster together to form distinct configurations [25]. Thus, in a large sample of firms, a relatively small number of configurations will arise, where various green supply chain practices are aligned. Performance results from the co-alignment or fit among organizational elements [26]. This implies that to be maximally effective, organizations must have configurations that are consistent with each other among multiple GSCI dimensions. A configuration perspective might provide an opportunity to gain a deeper understanding of the link between GSCI and firm performance.
2.3.1. Configurations of GSCI
Suggested by configuration theory, the alignment of strategies and/or practices for an organization is reflected in the patterns of different practices [27]. Thus, there is a need to empirically develop an emergent taxonomy of GSCI. A taxonomy study of GSCI contributes to both theory and practice by providing strategic choices from the operational perspective for manufacturers. Although research from the configuration perspective has been widely conducted in the domain of strategy management [28,29], research in the field of GSCI is still lacking.
Since firm may face differing levels of resource constraints and business environments, few firms treat all three dimensions of GSCI equally. Firms tend to place different degrees of emphasis on the individual dimensions of GSCI according to their actual situations [3,30]. Thus, various configurations of GSCI may exist. With reference to the work of supply chain integration by Flynn et al. [27], these patterns can be described in terms of GSCI strength and balance. SCI strength refers to the extent to which GSCI activities are carried out. In contrast, GSCI balance refers to the extent to which a company pays equal attention to all three dimensions of GSCI. The existing literature suggested that manufacturers may not place equal emphasis on each dimension of GSCI. Thus, an organization may take several steps to implement GSCI [31]. While some firms may have well implemented green internal integration, these firms may not have integrated their customers and suppliers into green practices. Other firms may be strong in green customer or supplier integration, but weaker in their green internal integration.
To have better insights about the relationship between GSCI patterns and performance, there is a need for developing a taxonomy based on significant gaps between the groups. In addition, the taxonomy of GSCI that incorporates green internal integration, as well as green customer and supplier integration has not been well studied in previous literature. We thus propose that:
- H4:
- An emergent taxonomy of manufacturers can be developed, based on their patterns of green internal, customer and supplier integration.
2.3.2. Performance Effect of GSCI Patterns
Performance is the most important consideration when assessing the suitability of supply chain practices [32]. Configuration perspective suggests that organizations will perform better when they develop better configurations of interconnected elements [27,33]. Therefore, the emergent patterns of GSCI will be related to both operational and financial performance. For example, a GSCI pattern that is higher in green customer integration is likely to have a stronger relationship to responsiveness and customer service than a pattern that is higher in green supplier integration. The faster response and better customer service will, in turn, lead to better financial performance [34]. Furthermore, the performance effect of GSCI may be determined by the GSCI pattern, in terms of the strength and balance of the three dimensions. For example, manufacturers with the strongest overall GSCI will have the best operational and financial performance (strength). Manufacturers with higher degrees of green internal, customer and supplier integration are likely to have better performance than manufacturers with higher degrees of green customer and supplier integration, but lower degree of green internal integration (balance). Thus, we propose:
- H5a:
- The patterns of GSCI are related to operational performance of the manufacturer within a supply chain.
- H5b:
- The patterns of GSCI are related to financial performance of the manufacturer within a supply chain.
3. Research Method
3.1. Sampling and Data Collection
As an important manufacturing base, manufacturers in China play important roles in global supply chains, and as such provide a good opportunity for supply chain research [35]. We collected data from five provinces (or municipality) in China: Shaanxi, Shandong, Beijing, Guangdong and Jiangsu. They represent industry centers of Western China, Bohai Sea region, Pearl River Delta and Yangtze River Delta, respectively, and are representative of the Chinese economic development with different degrees of market economy.
The research unit of this study was the manufacturing company and its supply chain. To obtain a representative sample, we developed our sampling pool using the government directories of firms in the manufacturing sector in China. For each randomly selected manufacturer, we identified a key informant, who typically had a title such as CEO/president, vice president or director, supply chain manager, and was knowledgeable about the green supply chain management. We contacted the key informants by phone to obtain their preliminary agreement to participate.
According to the name list of manufacturers, we mailed 750 questionnaires to manufacturers who cover a wide range of industries, including food and beverage, non-metallic mineral products, mechanical and engineering, electronics and electrical, instruments and related products, etc. A cover letter explaining our research objectives and assuring confidentiality was also provided. As an incentive, our aggregate survey results would be made available to the respondents if they returned a completed questionnaire. To improve the response rate, both follow-up calls and mailings were used. With three rounds of reminders, we received 226 replies, of which 214 questionnaires were complete and acceptable, yielding a response rate of 28.5%. Table 1 presents the descriptive statistics of the respondents.
This study evaluated non-response bias in two ways. First, we compared the differences in number of employees and annual sales between the responding and non-responding firms. The results were not significant at the 0.05 level, suggesting that non-response bias is not an issue. Second, the responses of early and late waves of received surveys were compared to all variables using t-test [36]. No significant differences were found, providing further indication of non-response bias. These results suggest that non-response bias is not serious.
To assess potential single-respondent bias, we selected two informants in each of the ten responding firms and then interviewed them separately with the same questionnaire. For practical reasons, these ten firms were selected according to their geographic proximity to our university. The reliability test suggested a high level of internal consistency between two sets of answers, which suggests common method variance is not serious. Additionally, Harman’s one-factor test of common method variance identified five distinct factors, which indicates that common method variance is unlikely to be serious. As a third test of common method variance, a measurement model including only the traits and one including a method factor in addition to the traits were tested [37]. The results of the method factor model marginally improved the model fit indices (NNFI by 0.01 and CFI by 0.01), with the common method factor accounting for 2.5% of the total variance. Moreover, the factor loadings of the trait factors and their significance were similar between the two models, suggesting that the model was robust, despite the inclusion of a method factor [27]. This provides additional evidence that the common method variance is not a serious issue.
3.2. Questionnaire Design
The questionnaire included questions relating to the demographic profile of the company and questions about green internal integration, green customer integration, green supplier integration, operational performance and financial performance. An English version of the questionnaire was initially developed. Then, with the aid of operations management researchers well versed in both languages, the translation back-translation method was used to develop a Chinese version. The Chinese version of the questionnaire was used in the final survey. We pre-tested the questionnaire using a sample of eight companies, resulting in final additional modifications and clarifications to ensure it was understandable and relevant to the practices in China.
To generate measurement items for our constructs, we extensively reviewed previous research. The measurement items for the related constructs are listed in Appendix A. Green internal integration, green customer integration and green supplier integration were measured using four, five and five items, respectively, which were adapted from Wu [5]. The scale of operational performance, measured using four items, was similar to the one used by Flynn et al. [27]. The five-item financial performance scale was largely derived from Li et al. [38] and Flynn et al. [27]. All items were measured on a seven-point Likert scale.
3.3. Reliability and Validity
Cumulative normal probability plots reveal that each of the measures appeared to be approximately normally distributed. Content validity of the construct was ensured by grounding it in existing literature whenever possible. The scales were all reliable, with alpha values ranging from 0.863 to 0.938 and composite reliability (CR) values ranging from 0.866 to 0.939 (see Table 2). The exploratory factor analysis (EFA) results reveal that five factors with eigenvalues above 1.0 emerged, explaining 79.3% of the total variance. In addition, all items have strong factor loadings on the construct they were supposed to measure, but lower factor loadings on the constructs they were not supposed to measure, thereby establishing construct unidimensionality.
Following O’Leary-Kelly and Vokurka [39], we conducted confirmatory factor analysis (CFA) to assess convergent validity. Each measurement item was linked to its corresponding construct, and the covariance among the constructs was freely estimated. The model fit indices were χ2 (220) = 632.56 (χ2/d.f. = 2.9), RMSEA = 0.092, NNFI = 0.96, CFI = 0.97 and SRMR = 0.068. Thus, the model was acceptable [40], indicating convergent validity. Furthermore, all factor loadings were higher than 0.60 and the t-values were all greater than 2.0, further demonstrating convergent validity [27]. The estimates for the average variance extracted (AVE) were higher than 0.50 for all the five constructs. Therefore, our constructs have satisfactory convergent validity.
Finally, discriminant validity was assessed by building a constrained CFA model for each possible pair of latent constructs, in which the correlations between the paired constructs are fixed to 1.0. Subsequently, we compared this model with the original unconstrained model, in which the correlations among constructs were freely estimated. A significant difference of the Chi-square statistics between the fixed and unconstrained models would indicate high discriminant validity [41]. In this study, all the differences are significant at the 0.001 level, and thus discriminant validity is ensured. Furthermore, the AVE value for each construct is greater than the squared correlation between that construct and the other constructs. Thus, the measurement items share common variance with their hypothesized constructs more than with the other constructs, which provides further evidence of discriminant validity.
4. Analysis Results
4.1. Contingency Perspective of GSCI
Hierarchical regression analysis was employed to test H1–H3. In Model 1, the direct impact of green internal integration on operational and financial performance was examined. In Model 2, we assessed the effects of green customer and supplier integration on operational or financial performance, given the effect of green internal integration on operational or financial performance. Model 3 examined the impacts of two- and three-way interactions of green internal, customer and supplier integration on operational or financial performance, in order to determine whether there was a moderating effect.
The results of the hierarchical regression analysis for operational and financial performance are presented in Table 3 and Table 4, respectively. Table 3 indicates that green internal integration has a significant direct effect on operational performance, supporting H1a. Adding green customer and supplier integration to Model 1 yielded a significant change in R2, indicating that the addition of green customer and supplier integration contributed significantly to the predictive power of the model. The coefficients for both green customer and supplier integration were statistically significant, indicating that green customer and supplier integration have direct impacts on operational performance, given the effect of green internal integration on operational performance. Therefore, these results supported H2a.
Adding the interaction terms further significantly increased the predictive power of the regression model. However, only the interaction between green customer integration and green internal integration was statistically significant, while the interaction between green supplier integration and green internal integration was not. This indicates that green customer integration moderates the relationship between green internal integration and operational performance, and H3a was partially supported.
Table 4 indicates that green internal integration positively influences financial performance, supporting H1b. The addition of green customer and supplier integration in Model 2 significantly increased the predictive power of the model, and the change in R2 was significant. Both green customer and supplier integration have significant impacts on financial performance, given the effect of green internal integration on operational performance, supporting H2b.
Similarly, the addition of the interaction terms in Model 3 contributed significantly to the predictive power of the model. While all the two-way interactions of green internal, customer and supplier integration have significant effects on financial performance, the effect of three-way interaction was not significant. However, the impact of the interaction between green supplier integration and green internal integration on financial performance was negative. Thus, H3b was partially supported and partially rejected.
4.2. Configuration Perspective of GSCI
4.2.1. Emergent Taxonomy of GSCI
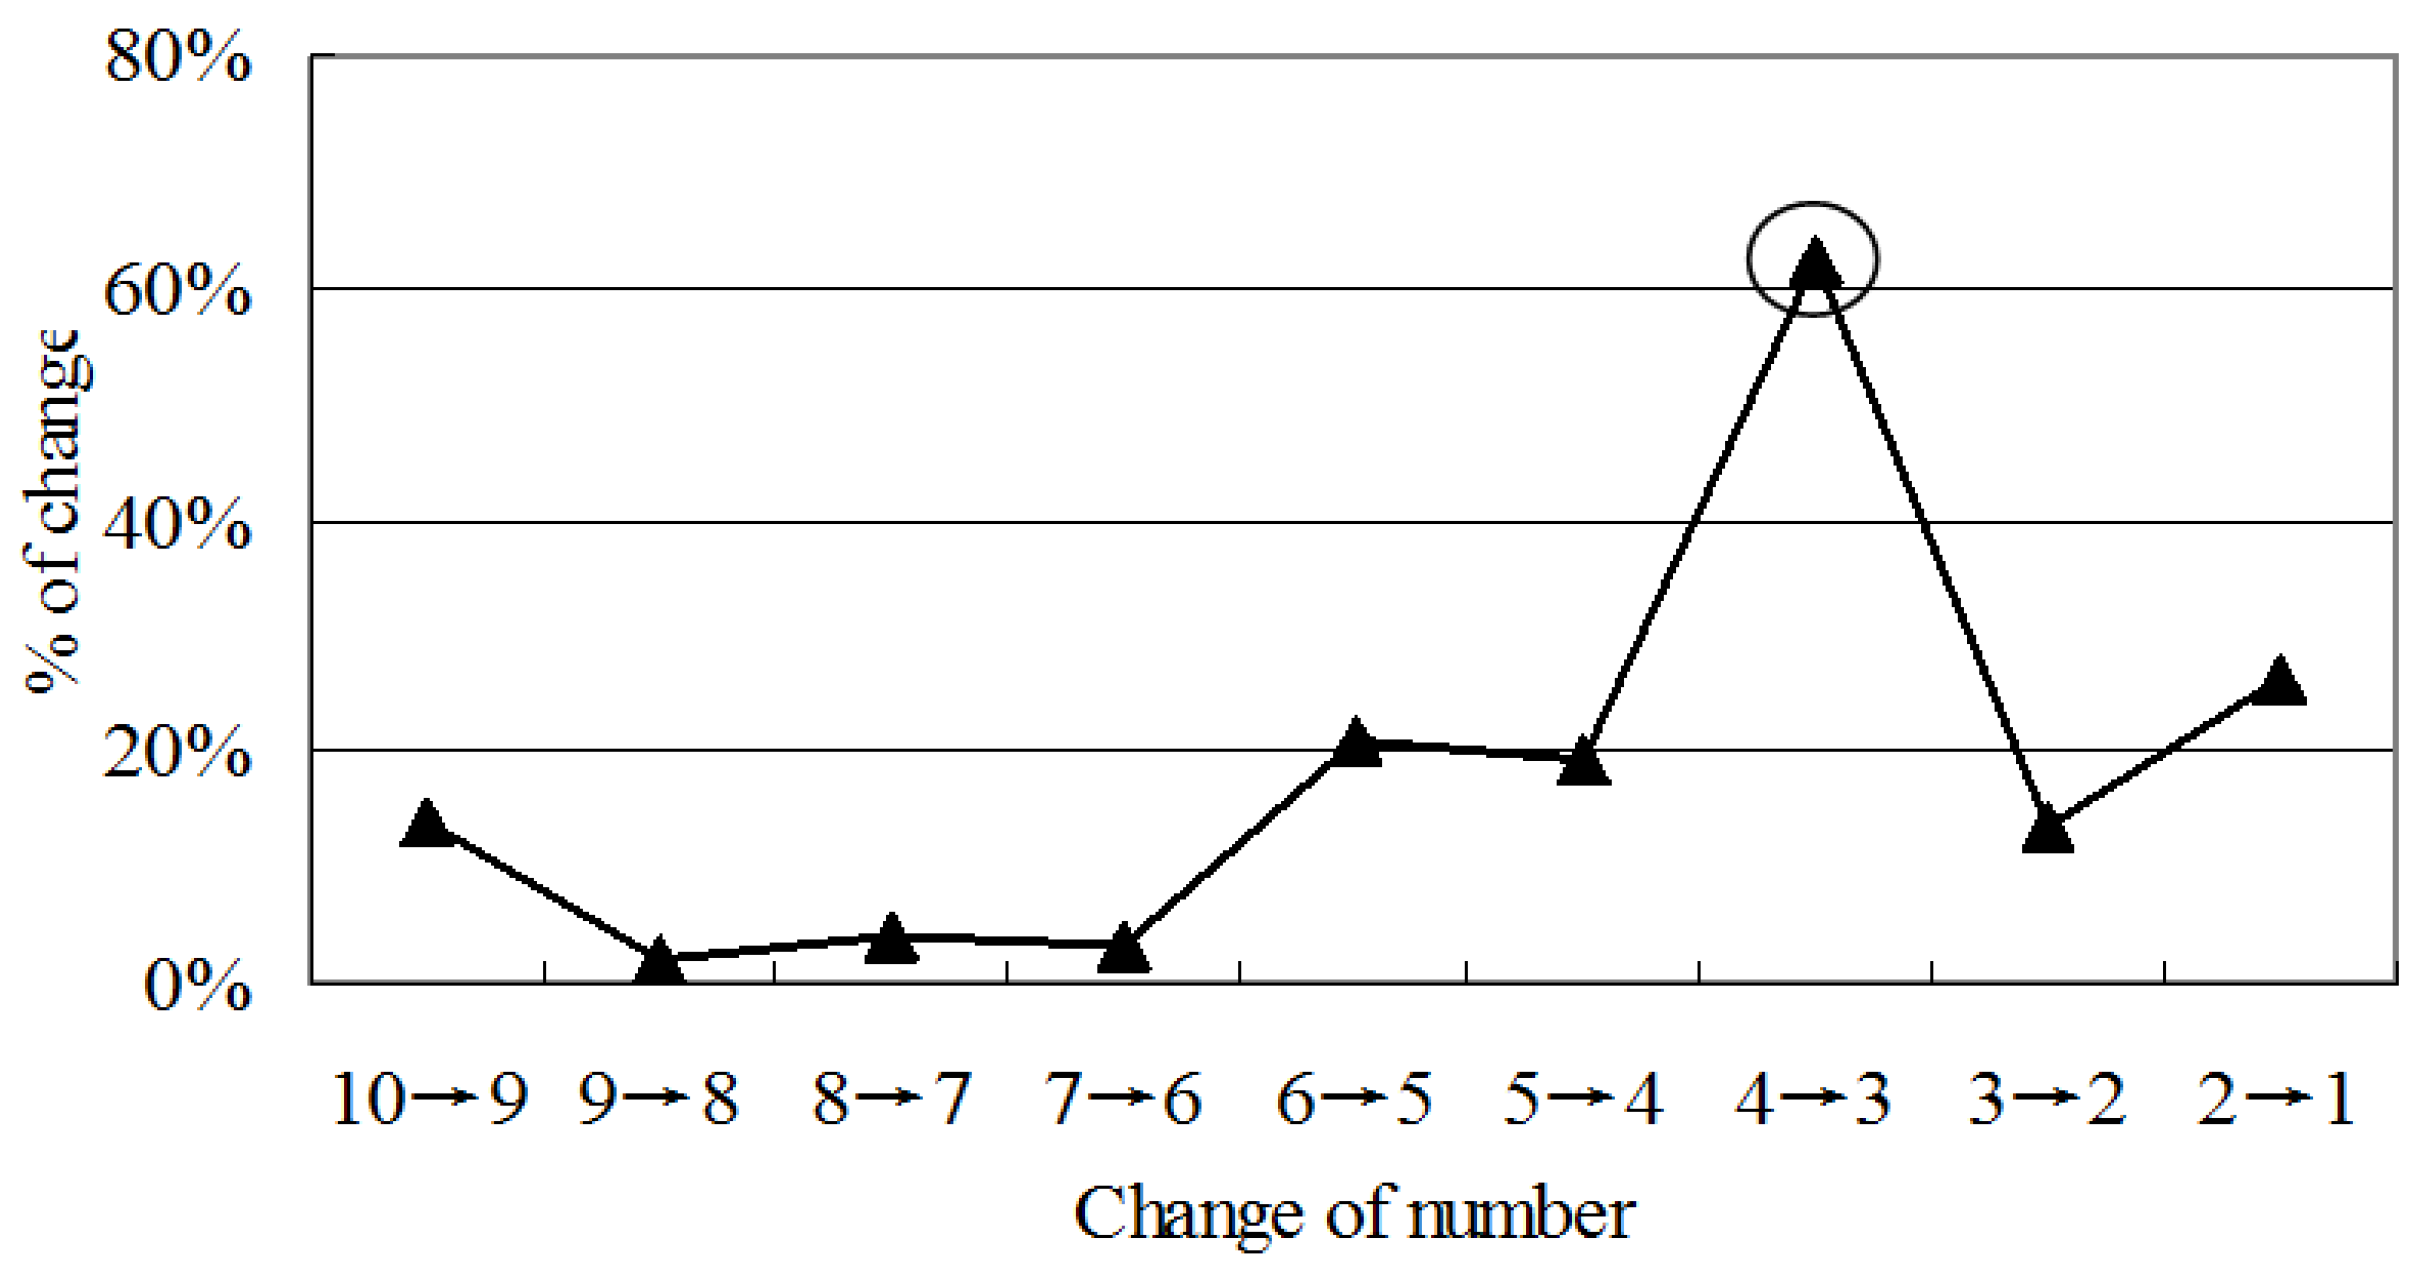
In H4, we hypothesize that an emergent taxonomy can be developed, based on the degrees of green internal, customer and supplier integration. We used cluster analysis to classify the responding firms into different GSCI patterns. Hierarchical clustering procedures determined the number of clusters that should be formed, and then non-hierarchical clustering was applied to produce the final clusters [40]. Finally, the cluster solution was validated. We used the agglomeration coefficient to determine the similarity of clusters. A large increase in the change of agglomeration coefficient suggests the merger of dissimilar clusters and therefore can be seen as a good cutoff point. The percentage of change in the agglomeration coefficient was highest when the number of groups changed from four to three, suggesting that four clusters were sufficient (see Figure 1). To ensure the cluster solution established is stable, another two cluster analyses with different starting centroids were conducted. The results reveal that the solutions are stable with almost the same number of manufacturers in each cluster. The significant gap in the means of the constructs between the clusters further provides support for the stability of cluster solution. Thus, using four clusters represents the best solution.
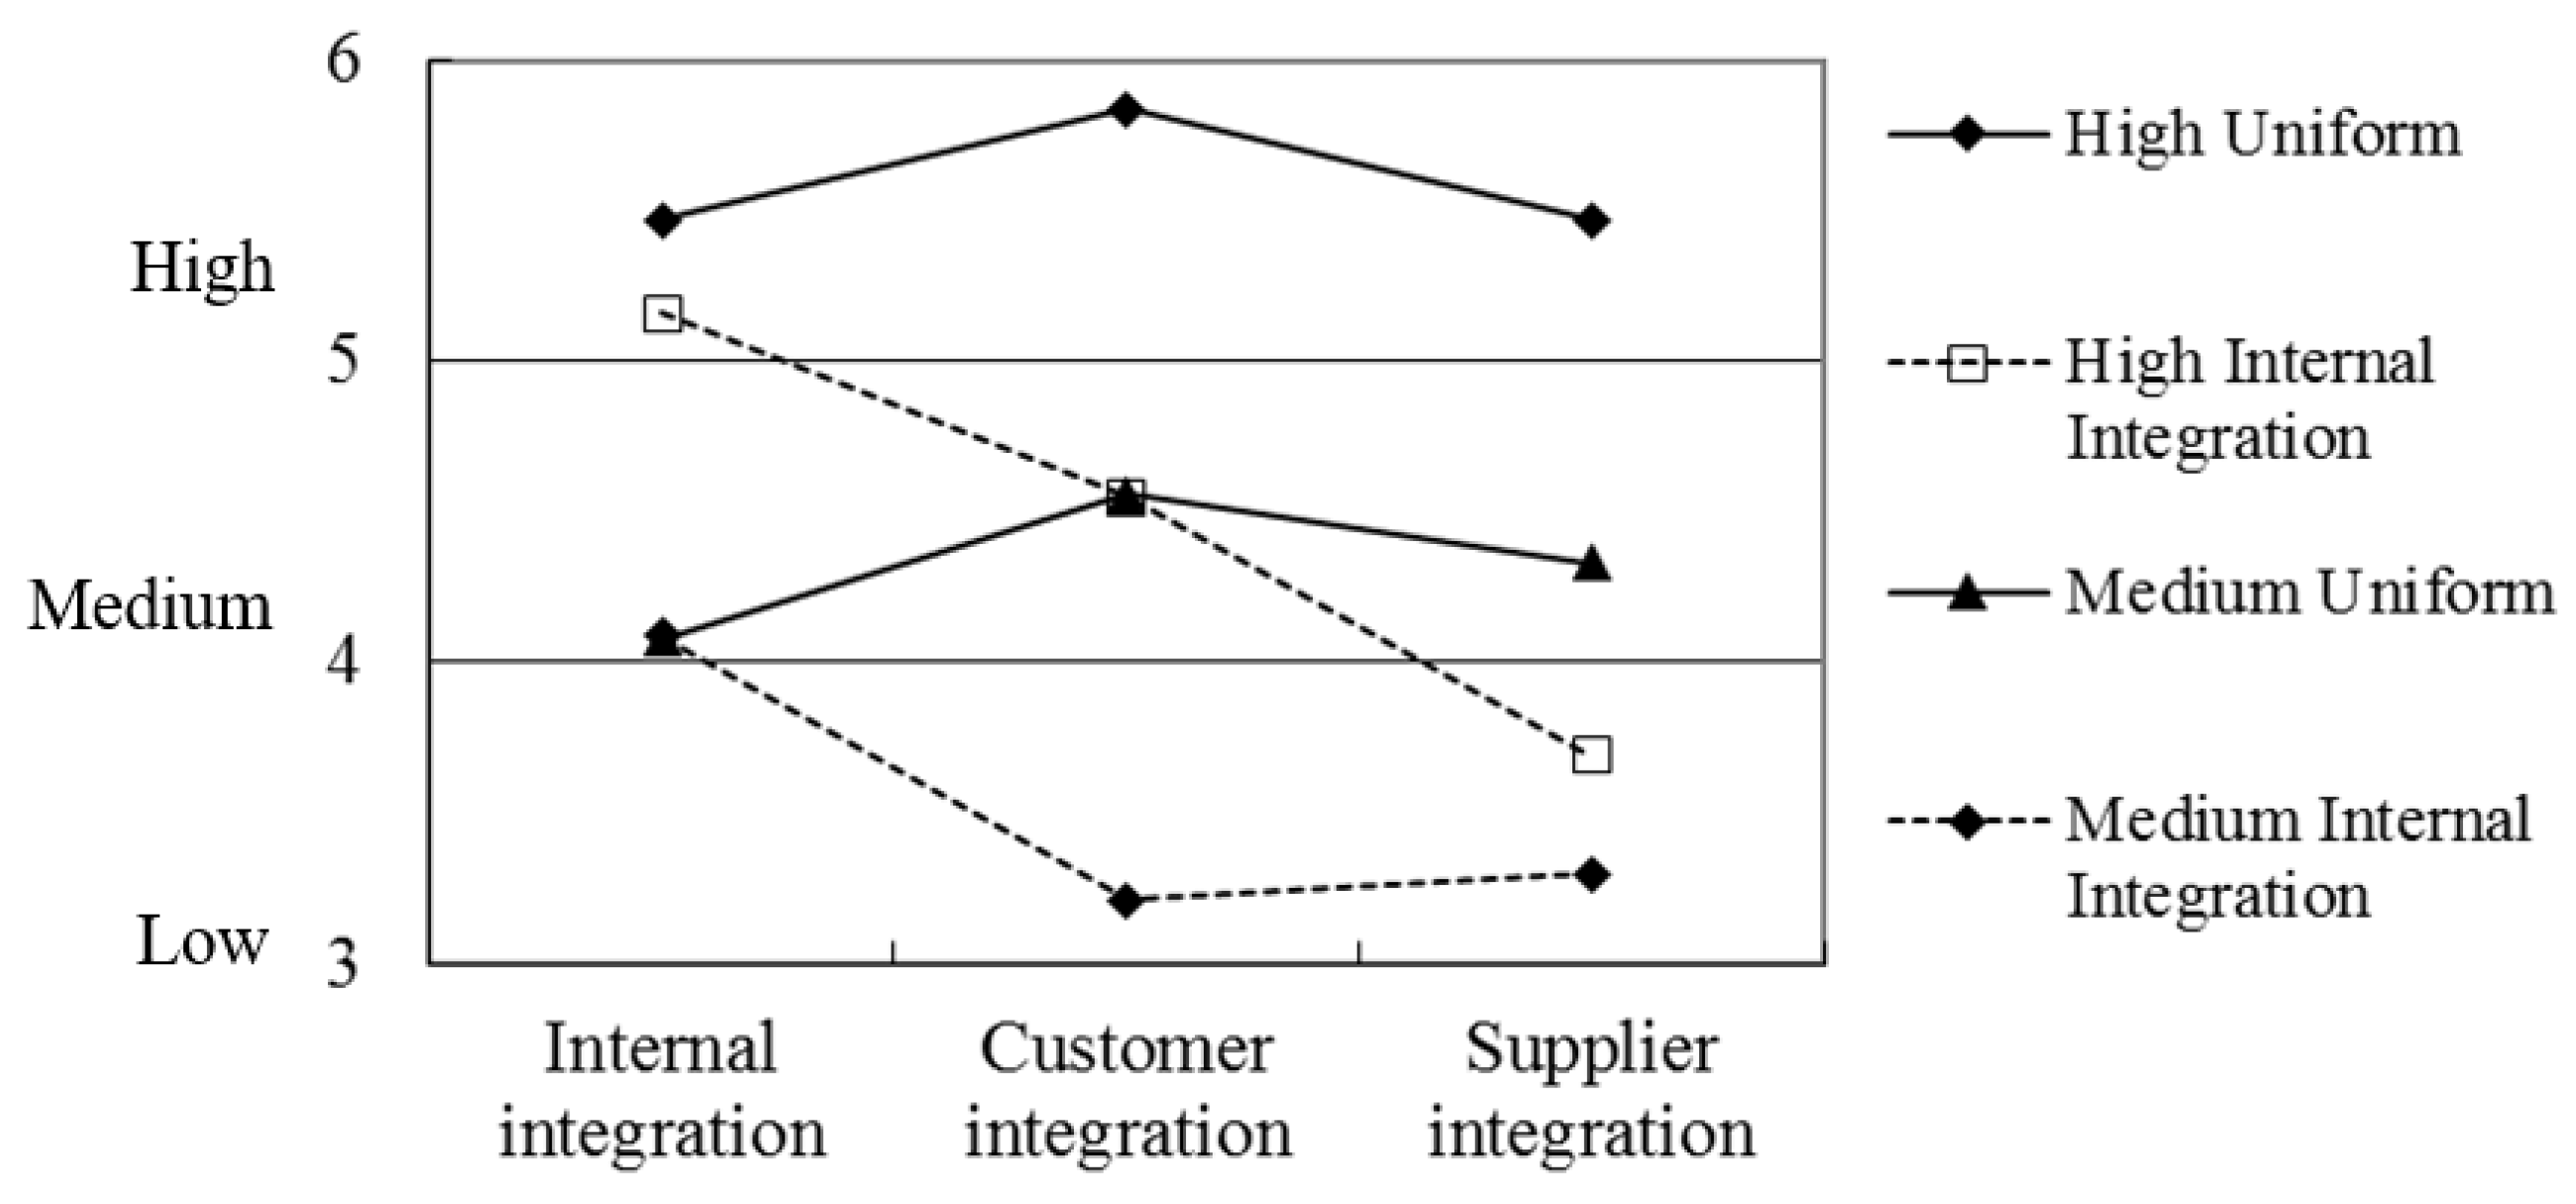
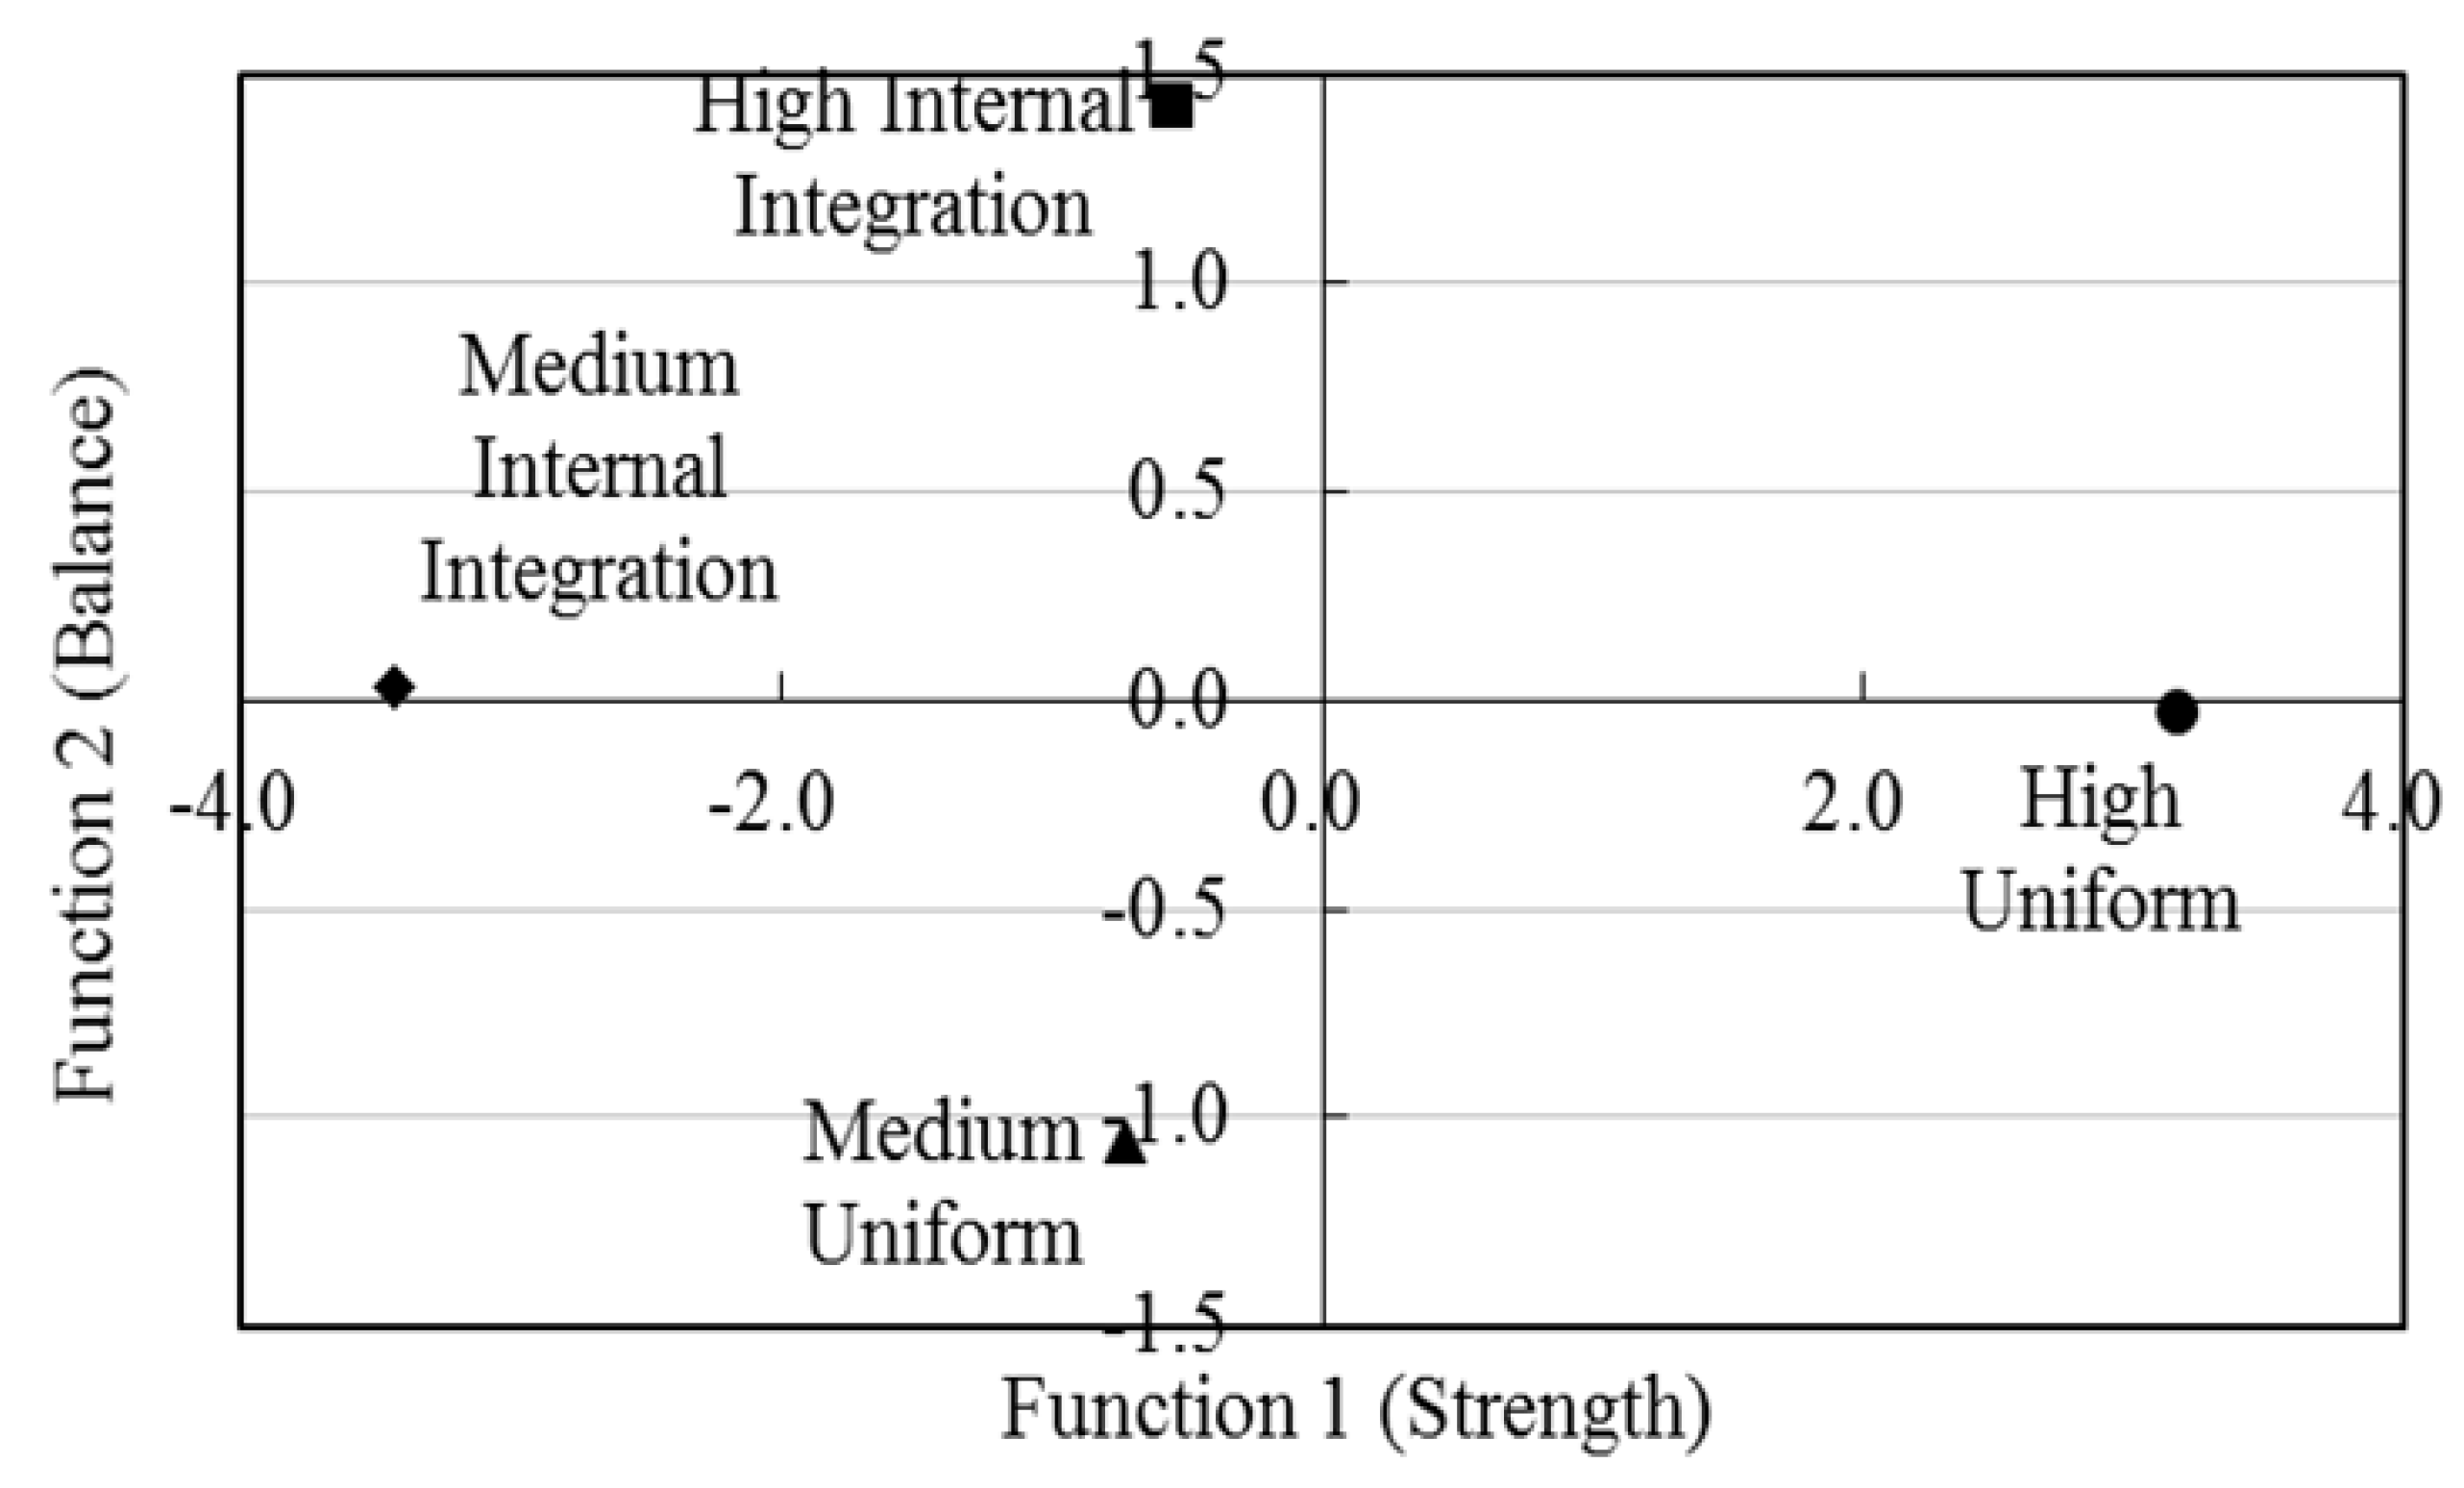
To interpret the results in Table 5 and Figure 2, we examined GSCI strength and balance. Two of the GSCI patterns were stronger in green internal integration than they were in green customer and supplier integration. We labeled these the High Green Internal Integration and Medium Green Internal Integration patterns and describe them as unbalanced GSCI patterns. The other two GSCI patterns were balanced, with similar degrees of green customer, supplier and internal integration within each pattern. We labeled these the High Uniform and Medium Uniform patterns, reflecting their balance among green customer, supplier and internal integration. We conducted canonical discriminant analysis to identify the underlying dimensions that defined the clusters. Table 6 presents three functions, but only the first one had eigenvalue greater than 1, explaining 87.9% of the variance. Since the second function explains 11.1% of the variance, we include it in the following analysis. Table 7 reveals that all three dimensions of SCI were important in forming Function 1, which divided the clusters into those with high GSCI (High Uniform), medium GSCI (High Green Internal Integration and Medium Uniform) and low GSCI (Medium Green Internal Integration). Thus, Function 1 represents GSCI strength, and it was the greatest differentiator between the patterns.
Function 2 reflects GSCI balance, indicated by the positive loading of green internal and customer integration and negative loading of green supplier integration. It grouped the patterns into those with greater (High Uniform and Medium Uniform) and less (High Green Internal Integration and Medium Green Internal Integration) GSCI balance. However, these differences between the patterns were relatively weaker than their difference in GSCI strength. Figure 3 indicates that four clusters were differentiated from each other by the discriminant functions representing GSCI strength and GSCI balance. Between 95.3% and 100% of the respondents were correctly classified, indicating very high predictive ability. Therefore, these patterns of GSCI are independent and are not prone to misclassification. We conclude that manufacturers can be clustered into groups with differing levels of GSCI strength and balance, based on green customer, supplier and internal integration, supporting H4.
4.2.2. Performance Effect of GSCI Patterns
We applied analysis of variance to test the performance effect of GSCI patterns. Table 8 shows that there were statistically significant differences in operational performance between the GSCI patterns, supporting H5a. Scheffe post hoc analysis was used to determine differences between specific patterns. The High Uniform pattern had the best operational performance, and Medium Green Internal Integration pattern had the worst operational performance. This indicates that GSCI strength was more strongly related to operational performance than GSCI balance. Interestingly, there was not a significant difference in operational performance among the High Green Internal Integration, Medium Uniform and Medium Green Internal Integration patterns of GSCI.
Table 8 also shows the impact of GSCI pattern on financial performance, revealing that the High Uniform, followed by the High Green Internal Integration pattern and Medium Uniform, supporting H5b. The Medium Green Internal Integration pattern of GSCI had the worst financial performance. Similarly, the difference in financial performance among the High Green Internal Integration, Medium Uniform and Medium Green Internal Integration patterns was not significant. GSCI strength was more important than GSCI balance in influencing financial performance.
5. Discussion
We found that most of our hypotheses were supported or partially supported, indicating that GSCI is important for enhancing firm performance. From the contingency perspective, we found that green internal, customer and supplier integration were all related to firm performance both directly and indirectly. Specifically, green internal, customer and supplier integration were directly related to both financial and operational performance. In addition, the interaction between green internal integration and green customer integration was positively related to both operational and financial performance, while the interaction between green internal integration and green supplier integration was negatively related to financial performance. Although the interaction between green customer integration and green supplier integration was positively related to financial performance, it was not related to operational performance.
When we compare our results with those from previous research on GSCI, our finding that green internal integration was significantly related to operational and financial performance is consistent with Droge et al. [42] and Luo et al. [23]. Thus, our research reinforces the importance of green internal integration in improving firm performance. This is an important finding, since much of the existing literature on GSCI does not include green internal integration as an independent dimension. Our finding that green customer integration was directly related to operational and financial performance is consistent with Singh and Power [43], and Zhu et al. [44]. Our finding that green supplier integration was significantly related to operational and financial performance is also consistent with the findings of several previous studies [45]. However, some scholars argued that GSCI may be detrimental to financial performance in some circumstances [9,46].
Although green internal, customer and supplier integration were all directly related to firm performance, their indirect effects on firm performance were different. While green customer integration was indirectly and positively related to both operational and financial performance through its interaction with green internal integration, green supplier integration was only indirectly and negatively related to financial performance. This suggests that implementing GSCI is not free, and the cost of GSCI may outweigh its benefits in some conditions [31]. Since the objective of GSCI is to provide maximum value customers through reducing and preventing pollution, implementing green internal and customer integration simultaneously may not influence financial performance negatively. However, implementing green internal and supplier integration simultaneously may counteract their profits in some degree, which is reflected in the negative coefficient for the interaction between green internal integration and green supplier integration. This study also suggests that the interaction between green customer integration and green supplier integration was positively related to financial performance. This may be because firms usually have strong collaborative arrangements with both demand and supply sides [43]. Overall, to fully understand the relationship between GSCI and firm performance, all three dimensions of GSCI should be considered in an integrated model. Studies considering only one or two dimensions of GSCI or aggregate green internal, customer and supplier integration in a single construct may be drawing inaccurate conclusions.
From the configuration perspective, we found that the GSCI patterns were related to both operational and financial performance. Because GSCI strength was more strongly related to firm performance than GSCI balance, manufacturers that were strong across the board in green internal, customer and supplier integration achieved the best performance. However, the Medium Green Internal Integration pattern was indistinguishable from the Medium Uniform pattern, in terms of its relationship with firm performance. This means that both patterns have a similar effect on firm performance. Our findings also reveal that improvements in GSCI will not lead to improved operational and financial performance, when the level of GSCI is relatively low (from Medium Green Internal Integration to High Green Internal Integration or Medium Uniform). However, once a threshold level of GSCI has been achieved, further improvements in GSCI, even small improvements, will be associated with significantly improved performance. Thus, findings from the configuration perspective indicate that the performance effect of GSCI may be cumulative, providing significant insight for companies in pursuing it. This finding is consistent with supply chain integration research [27].
The findings from the contingency perspective and those from the configuration perspective are complementary. First, the contingency perspective reveals that green internal, customer and supplier integration were directly related to firm performance. These findings are further confirmed by the significant performance differences between High Uniform pattern and other three patterns. Second, the contingency perspective found that the interaction between green internal integration and green supplier integration was negatively related to financial performance. The non-significant difference between the financial performance of the High Green Internal Integration pattern and that of the Medium Uniform pattern in the configuration perspective echoes this contingent finding. Third, the contingency perspective found that each dimension of GSCI and the interactions between them are related to firm performance, which was overlooked by the configuration perspective. However, the configuration perspective found that GSCI patterns are related to firm performance and the performance effect of GSCI is cumulative, which was not revealed by the contingency perspective. Thus, it is important that investigating GSCI continues to apply both a contingency and a configuration perspective to uncover all of the important relationships.
6. Conclusions and Limitations
6.1. Theoretical Contributions
Our study contributes to the GSCI literature in several important ways. The first contribution consists in extending and enriching the literature by empirically examining the effect of GSCI on firm performance. By incorporating green internal, customer and supplier integration and their two- and three-way interactions, and including both operational and financial performance, this research adds greater richness and comprehensiveness to the GSCI literature and enhances our understanding toward the performance effect of GSCI.
The second contribution lies in dividing GSCI into three dimensions, green internal, customer and supplier integration, and finding that green internal integration forms the foundation upon which building green customer and supplier integration. Patterns of GSCI were further developed based on green internal, customer and supplier integration. This is one of the few empirical efforts to systematically examine the performance effect of GSCI from both a contingency and a configuration perspective. Our findings provide preliminary evidence of the links between GSCI patterns and firm performance, and the moderating effects of green customer and supplier integration on the relationship between green internal integration and firm performance. Green internal integration provides a vital link between green customer and supplier integration, without which firms are unable to reap the full benefits of their GSCI efforts.
The third contribution derives from extending the GSCI literature by revealing the importance of GSCI practices across industries in China. Previous related research has focused on other contexts, such as US [15] and Canada [47]. China plays an important role in global supply chains and most Fortune 500 firms have built their manufacturing bases here [48]. Effective GSCI can make Chinese companies even more environmentally friendly, which will, in turn, enable them become more attractive supply chain partners. Chinese manufacturers can improve their operational and financial performance through enhancing their green internal and external (customer and supplier) integration.
6.2. Managerial Implications
This study also provides several implications for managers. First, the significantly and positively direct impacts of three dimensions of GSCI on both operational and financial performance suggest that managers should not overlook the importance of GSCI. Second, we conclude that green internal integration forms the foundation upon which green customer and supplier integration is built from the contingency perspective. This suggests that manufacturers should begin GSCI with green internal integration in order to lay the foundation for green customer and supplier integration. This finding is particularly important, since much of the previous research has failed to include green internal integration, instead focusing only on green customer and/or supplier integration. This suggests that the best approach of implementing GSCI is to start from green internal integration and then to green external (customer and supplier) integration. Third, the finding that the emergent GSCI patterns are related to different levels of firm performance provides significant implications for managers attempting to enhance firm performance through better GSCI configuration. For example, there is no significant difference in firm performance between the Medium Green Internal Integration pattern and the Medium Uniform pattern, which suggests possible steps for implementing GSCI. If a manufacturer has limited resources or is early in its GSCI efforts, it can start by establishing a foundation of green internal integration, then follow on by pursuing high degree of green customer and supplier integration.
6.3. Research Limitations
Although this study provides several new insights into understanding the performance effect of GSCI, it has several limitations. First, since the data were only collected from manufacturers, some measurement inaccuracy may be generated. Future studies can broaden the research scope by collecting data from all supply chain partners, including manufacturers and their customers and suppliers. Second, this study derives results using a cross-sectional design, which means causality cannot be established. Because GSCI is developed over time, it will be fruitful for future research to examine how GSCI patterns may evolve over time into creating a more effective climate for co-creating value. Third, although this research provides some interesting findings about the relationship between GSCI and firm performance in China, it is not clear whether these relationships will be the same in other contexts. As with most research, generalization beyond the sample frame must be undertaken with care. The findings may be limited to the institutional and business culture context of China, since it could be argued that different relationships between GSCI and firm performance might exist in alternative settings. Future research should examine cross-cultural differences in the relationship between GSCI and firm performance, and include national-level factors such as economic development, social norms and business cultures in an integrated analysis. Fourth, by focusing on various firm sizes, ownership types, industries and regions, we developed a broad picture of the relationship between GSCI and firm performance. However, this relationship may be different across different firm sizes, ownership types, industries or regions. Future efforts should be made to examine the differences in the relationship between GSCI and firm performance across different firm sizes, ownership types, industries or regions. Finally, besides the contingency and configuration analysis of GSCI, an inquiry into the antecedents of the degree of green internal, customer and supplier integration might also be an interesting research topic. For example, organizational strategies for pursuing GSCI may be influenced by some antecedents (such as business environment, relationship commitment, trust and organizational culture).
Acknowledgments
This work was supported by the Fundamental Research Funds for the Central Universities (3102016RW003).
Author Contributions
Yongtao Song contributed reagents/materials/analysis tools; Junya Cai performed the experiments and analyzed the data; Taiwen Feng conceived and designed the experiments; Yongtao Song and Taiwen Feng wrote the paper.
Conflicts of Interest
The authors declare no conflict of interest.
Appendix A. Measurement items
Green internal integration [5]
- II1:
- Cross-functional cooperation for environmental improvements
- II2:
- Environmental issues are well communicated among departments
- II3:
- Environmental knowledge is accumulated and shared across departments
- II4:
- An environmental management system exists
Green customer integration [5]
- CI1:
- Achieving environmental goals through joint planning with major customer
- CI2:
- Cooperating with major customer to reduce environmental impact of our products
- CI3:
- Cooperating with major customer for cleaner production, green packaging, or other environmental activities
- CI4:
- Collaborating with major customer to implement environmental management system
- CI5:
- Implementing environmental audit for major customer’s internal management
Green supplier integration [5]
- SI1:
- Collaborating with major supplier to set up environmental goals
- SI2:
- Implementing environmental audit for major supplier’s internal management
- SI3:
- Providing major supplier with environmental design requirements related to design specifications and cleaner production technology
- SI4:
- Requiring major supplier to implement environmental management or obtain third-party certification of environmental management system (e.g., ISO 14001)
- SI5:
- Selecting suppliers according to environmental criteria
Operational performance [27]
- OP1:
- Our company can quickly modify products to meet our major customer’s requirements
- OP2:
- Our company can quickly respond to changes in market demand
- OP3:
- Our company has an outstanding on-time delivery record to our major customer
- OP4:
- Our company provides a high level of customer service to our major customer
Financial performance [27,38]
- BP1:
- Return on investment
- BP2:
- Return on sales
- BP3:
- Growth in sales
- BP4:
- Growth in profit
- BP5:
- Growth in market share
References
- Lin, H.; Zeng, S.X.; Ma, H.Y.; Qi, G.Y.; Tam, V.W. Can political capital drive corporate green innovation? Lessons from China. J. Clean. Product. 2014, 64, 63–72. [Google Scholar] [CrossRef]
- Tseng, M.L.; Wang, R.; Chiu, A.S.; Geng, Y.; Lin, Y.H. Improving performance of green innovation practices under uncertainty. J. Clean. Product. 2013, 40, 71–82. [Google Scholar] [CrossRef]
- Wolf, J. Sustainable supply chain management integration: A qualitative analysis of the German manufacturing industry. J. Bus. Ethics 2011, 102, 221–235. [Google Scholar] [CrossRef]
- Yu, W.; Chavez, R.; Feng, M.; Wiengarten, F. Integrated green supply chain management and operational performance. Supply Chain Manag. Int. J. 2014, 19, 683–696. [Google Scholar] [CrossRef]
- Wu, G.C. The influence of green supply chain integration and environmental uncertainty on green innovation in Taiwan’s IT industry. Supply Chain Manag. Int. J. 2013, 18, 539–552. [Google Scholar] [CrossRef]
- Dai, J.; Cantor, D.E.; Montabon, F.L. How environmental management competitive pressure affects a focal firm’s environmental innovation activities: A green supply chain perspective. J. Bus. Logist. 2015, 36, 242–259. [Google Scholar] [CrossRef]
- Kirchoff, J.F.; Tate, W.L.; Mollenkopf, D.A. The impact of strategic organizational orientations on green supply chain management and firm performance. Int. J. Phys. Distrib. Logist. Manag. 2016, 46, 269–292. [Google Scholar] [CrossRef]
- Kuei, C.; Madu, C.N.; Chow, W.S.; Chen, Y. Determinants and associated performance improvement of green supply chain management in China. J. Clean. Prod. 2015, 95, 163–173. [Google Scholar] [CrossRef]
- Zhu, Q.; Feng, Y.; Choi, S.B. The role of customer relational governance in environmental and economic performance improvement through green supply chain management. J. Clean. Prod. 2016. [Google Scholar] [CrossRef]
- Dangelico, R.M.; Pontrandolfo, P. Being ‘green and competitive’: The impact of environmental actions and collaborations on firm performance. Bus. Strategy Environ. 2015, 24, 413–430. [Google Scholar] [CrossRef]
- Jayaram, J.; Xu, K.; Nicolae, M. The direct and contingency effects of supplier coordination and customer coordination on quality and flexibility performance. Int. J. Prod. Res. 2011, 49, 59–85. [Google Scholar] [CrossRef]
- Peteraf, M.; Reed, R. Managerial discretion and internal alignment under regulatory constraints and change. Strateg. Manag. J. 2007, 28, 1089–1112. [Google Scholar] [CrossRef]
- Love, J.H.; Roper, S. Organizing innovation: Complementarities between cross-functional teams. Technovation 2009, 29, 192–203. [Google Scholar] [CrossRef]
- Brettel, M.; Heinemann, F.; Engelen, A.; Neubauer, S. Cross-functional integration of R & D, marketing, and manufacturing in radical and incremental product innovations and its effects on project effectiveness and efficiency. J. Prod. Innov. Manag. 2011, 28, 21–269. [Google Scholar]
- Green, K.W., Jr.; Zelbst, P.J.; Meacham, J.; Bhadauria, V.S. Green supply chain management practices: Impact on performance. Supply Chain Manag. Int. J. 2012, 17, 290–305. [Google Scholar] [CrossRef]
- Feng, T.; Zhao, G.; Su, K. The fit between environmental management systems and organisational learning orientation. Int. J. Prod. Res. 2014, 52, 2901–2914. [Google Scholar] [CrossRef]
- Premkumar, G.; Ramamurthy, K.; Saunders, C.S. Information processing view of organizations: An exploratory examination of fit in the context of interorganizational relationships. J. Manag. Inform. Syst. 2005, 22, 257–294. [Google Scholar]
- Stock, G.N.; Tatikonda, M.V. The joint influence of technology uncertainty and interorganizational interaction on external technology integration success. J. Oper. Manag. 2008, 26, 65–80. [Google Scholar] [CrossRef]
- Dong, B.; Evans, K.R.; Zou, S. The effects of customer participation in co-created service recovery. J. Acad. Mark. Sci. 2008, 36, 123–137. [Google Scholar] [CrossRef]
- Feng, T.; Sun, L.; Zhang, Y. The effects of customer and supplier involvement on competitive advantage: An empirical study in China. Ind. Mark. Manag. 2010, 39, 1384–1394. [Google Scholar] [CrossRef]
- Lau, A.K.W. Supplier and customer involvement on new product performance. Ind. Manag. Data Syst. 2011, 111, 910–942. [Google Scholar] [CrossRef]
- Hillebrand, B.; Biemans, W.G. Links between internal and external cooperation in product development: An exploratory study. J. Prod. Innov. Manag. 2004, 21, 110–122. [Google Scholar] [CrossRef]
- Luo, C.; Mallick, D.N.; Schroeder, R.G. Collaborative product development: Exploring the role of internal coordination capability in supplier involvement. Eur. J. Innov. Manag. 2010, 13, 244–266. [Google Scholar] [CrossRef]
- Feng, T.; Sun, L.; Sohal, A.S.; Zhu, V.C.Y. External involvement and time-to-market of new products: The moderating role of internal integration. In Proceedings of the 5th International Conference on Operations and Supply Chain Management, Beijing, China, 17–19 July 2011. [Google Scholar]
- Meyer, A.D.; Tsui, A.S.; Hinings, C.R. Configurational approaches to organizational analysis. Acad. Manag. J. 1993, 36, 1175–1195. [Google Scholar] [CrossRef]
- Wiklund, J.; Shepherd, D. Entrepreneurial orientation and small business performance: A configurational approach. J. Bus. Ventur. 2005, 20, 71–91. [Google Scholar] [CrossRef]
- Flynn, B.B.; Huo, B.; Zhao, X. The impact of supply chain integration on performance: A contingency and configuration approach. J. Oper. Manag. 2010, 28, 58–71. [Google Scholar] [CrossRef]
- Kathuria, R. Competitive priorities and managerial performance: A taxonomy of small manufacturers. J. Oper. Manag. 2000, 18, 627–641. [Google Scholar] [CrossRef]
- Frohlich, M.T.; Dixon, J.R. A taxonomy of manufacturing strategies revisited. J. Oper. Manag. 2001, 19, 541–558. [Google Scholar] [CrossRef]
- Dubey, R.; Gunasekaran, A.; Ali, S.S. Exploring the relationship between leadership, operational practices, institutional pressures and environmental performance: A framework for green supply chain. Int. J. Prod. Econ. 2015, 160, 120–132. [Google Scholar] [CrossRef]
- Zhao, G.; Feng, T.; Wang, D. Is more supply chain integration always beneficial to financial performance? Ind. Mark. Manag. 2015, 45, 162–172. [Google Scholar] [CrossRef]
- Katsikeas, C.S.; Samiee, S.; Theodosiou, M. Strategy fit and performance consequences of international marketing standardization. Strateg. Manag. J. 2006, 27, 867–890. [Google Scholar] [CrossRef]
- Sinha, K.K.; Van de Ven, A.H. Designing work within and between organizations. Organ. Sci. 2005, 16, 389–408. [Google Scholar] [CrossRef]
- Feng, T.; Wang, D.; Prajogo, D. Incorporating human resource management initiatives into customer services: Empirical evidence from Chinese manufacturing firms. Ind. Mark. Manag. 2014, 43, 126–135. [Google Scholar] [CrossRef]
- Huo, B.; Qi, Y.; Wang, Z.; Zhao, X. The impact of supply chain integration on firm performance: The moderating role of competitive strategy. Supply Chain Manag. Int. J. 2014, 19, 369–384. [Google Scholar] [CrossRef]
- Armstrong, J.S.; Overton, T.S. Estimating nonresponse bias in mail surveys. J. Mark. Res. 1977, 14, 396–402. [Google Scholar] [CrossRef]
- Podsakoff, P.M.; MacKenzie, S.B.; Lee, J.Y.; Podsakoff, N.P. Common method variance in behavioral research: A critical review of the literature and recommended remedies. J. Appl. Psychol. 2003, 88, 879–903. [Google Scholar] [CrossRef] [PubMed]
- Li, Y.H.; Huang, J.W.; Tsai, M.T. Entrepreneurial orientation and firm performance: The role of knowledge creation process. Ind. Mark. Manag. 2009, 38, 440–449. [Google Scholar] [CrossRef]
- O’Leary-Kelly, S.W.; Vokurka, R.J. The empirical assessment of construct validity. J. Oper. Manag. 1998, 16, 387–405. [Google Scholar] [CrossRef]
- Hair, J.F.; Black, W.C.; Babin, B.J.; Anderson, R.E.; Tatham, R.L. Multivariate Data Analysis, 6th ed.; Prentice-Hall: Upper Saddle River, NJ, USA, 2006. [Google Scholar]
- Fornell, C.; Larcker, D.F. Evaluating structural equation models with unobservable variables and measurement error. J. Mark. Res. 1981, 18, 29–50. [Google Scholar] [CrossRef]
- Droge, C.; Jayaram, J.; Vickery, S.K. The effects of internal versus external integration practices on time-based performance and overall firm performance. J. Oper. Manag. 2004, 22, 557–573. [Google Scholar] [CrossRef]
- Singh, P.J.; Power, D. The nature and effectiveness of collaboration between firms, their customers and suppliers: A supply chain perspective. Supply Chain Manag. Int. J. 2009, 14, 189–200. [Google Scholar] [CrossRef]
- Zhu, Q.; Sarkis, J.; Lai, K.H. Institutional-based antecedents and performance outcomes of internal and external green supply chain management practices. J. Purch. Supply Manag. 2013, 19, 106–117. [Google Scholar] [CrossRef]
- Blome, C.; Hollos, D.; Paulraj, A. Green procurement and green supplier development: Antecedents and effects on supplier performance. Int. J. Prod. Res. 2014, 52, 32–49. [Google Scholar] [CrossRef]
- Hoejmose, S.; Brammer, S.; Millington, A. “Green” supply chain management: The role of trust and top management in B2B and B2C markets. Ind. Mark. Manag. 2012, 41, 609–620. [Google Scholar] [CrossRef]
- Vachon, S.; Klassen, R.D. Extending green practices across the supply chain: The impact of upstream and downstream integration. Int. J. Oper. Prod. Manag. 2006, 26, 795–821. [Google Scholar] [CrossRef]
- Feng, T.; Wang, D. The influence of environmental management systems on financial performance: A moderated-mediation analysis. J. Bus. Ethics 2016, 135, 265–278. [Google Scholar] [CrossRef]
Figure 1.
Change of percentage in agglomeration coefficient.

Figure 2.
Taxonomy of green supply chain integration.

Figure 3.
Cluster centroids.


Table 1.
Demographic data for the respondents.
| Sample Size | Total | Shandong | Shanxi | Beijing | Guangdong | Jiangsu |
|---|---|---|---|---|---|---|
| 214 | 53 | 50 | 39 | 38 | 34 | |
| Industry (%) | ||||||
| Food and beverage | 2.80 | 0.00 | 6.00 | 2.56 | 0.00 | 5.88 |
| Textile and apparel | 3.27 | 0.00 | 2.00 | 5.13 | 5.26 | 5.88 |
| Paper and printing | 1.40 | 0.00 | 2.00 | 2.56 | 0.00 | 2.94 |
| Chemicals and petrochemicals | 5.14 | 9.43 | 4.00 | 5.13 | 5.26 | 0.00 |
| Rubber and plastics | 1.40 | 3.77 | 0.00 | 0.00 | 2.63 | 0.00 |
| Non-metallic mineral products | 6.54 | 13.21 | 4.00 | 5.13 | 2.63 | 5.88 |
| Smelting and pressing | 5.14 | 15.09 | 4.00 | 0.00 | 2.63 | 0.00 |
| Metal products | 9.81 | 16.98 | 10.00 | 2.56 | 2.63 | 14.71 |
| Mechanical and engineering | 19.16 | 13.21 | 34.00 | 10.26 | 10.53 | 26.47 |
| Electronics and electrical | 25.70 | 16.98 | 20.00 | 28.46 | 34.21 | 23.53 |
| Instruments and related products | 12.15 | 5.67 | 10.00 | 12.82 | 21.05 | 14.71 |
| Others | 7.48 | 5.67 | 4.00 | 15.38 | 13.16 | 0.00 |
| Number of employees (%) | ||||||
| Less than 50 | 11.68 | 1.89 | 18.00 | 20.51 | 7.89 | 11.76 |
| 50–99 | 18.69 | 26.42 | 12.00 | 17.95 | 23.68 | 11.76 |
| 100–299 | 27.10 | 41.51 | 24.00 | 23.08 | 26.32 | 14.71 |
| 300–999 | 18.69 | 20.75 | 10.00 | 17.95 | 21.05 | 26.47 |
| 1000–1999 | 9.35 | 1.89 | 16.00 | 2.56 | 10.53 | 17.65 |
| 2000–4999 | 8.88 | 3.77 | 14.00 | 7.69 | 5.26 | 14.71 |
| More than 5000 | 5.61 | 3.77 | 6.00 | 10.26 | 5.26 | 2.94 |
Table 2.
Construct measures validity and reliability analysis.
| Construct | Item | Factor Loading | Cronbach’s α | AVE | CR |
|---|---|---|---|---|---|
| Green internal integration | II1 | 0.73 | 0.863 | 0.620 | 0.866 |
| II2 | 0.83 | ||||
| II3 | 0.87 | ||||
| II4 | 0.71 | ||||
| Green customer integration | CI1 | 0.90 | 0.938 | 0.747 | 0.936 |
| CI2 | 0.78 | ||||
| CI3 | 0.84 | ||||
| CI4 | 0.89 | ||||
| CI5 | 0.91 | ||||
| Green supplier integration | SI1 | 0.87 | 0.938 | 0.756 | 0.939 |
| SI2 | 0.91 | ||||
| SI3 | 0.85 | ||||
| SI4 | 0.88 | ||||
| SI5 | 0.84 | ||||
| Operational performance | OP1 | 0.93 | 0.912 | 0.742 | 0.919 |
| OP2 | 0.93 | ||||
| OP3 | 0.64 | ||||
| OP4 | 0.91 | ||||
| Financial performance | BP1 | 0.63 | 0.922 | 0.713 | 0.924 |
| BP2 | 0.82 | ||||
| BP3 | 0.94 | ||||
| BP4 | 0.95 | ||||
| BP5 | 0.85 |
AVE: average variance extracted; CR: composite reliability.
Table 3.
Regression results for operational performance.
| Model | Independent Variables | β | t | R2 | F | ∆R2 |
|---|---|---|---|---|---|---|
| 1 | Green internal integration | 0.554 | 9.689 *** | 0.307 | 93.869 *** | - |
| 2 | Green internal integration | 0.323 | 5.526 *** | 0.464 | 60.711 *** | 0.158 *** |
| Green customer integration | 0.252 | 3.507 *** | ||||
| Green supplier integration | 0.249 | 3.541 *** | ||||
| 3 | Green internal integration | 0.267 | 3.903 *** | 0.496 | 28.943 *** | 0.031 * |
| Green customer integration | 0.260 | 3.625 *** | ||||
| Green supplier integration | 0.208 | 2.798 ** | ||||
| GII × GCI interaction | 0.157 | 2.289 * | ||||
| GII × GSI interaction | −0.029 | −0.401 | ||||
| GCI × GSI interaction | 0.057 | 1.022 | ||||
| GII × GCI × GSI interaction | 0.079 | 1.090 |
*** p < 0.001; ** p < 0.01; * p < 0.01.
Table 4.
Regression results for financial performance.
| Model | Independent Variables | β | t | R2 | F | ∆R2 |
|---|---|---|---|---|---|---|
| 1 | Green internal integration | 0.403 | 6.408 *** | 0.162 | 41.065 *** | - |
| 2 | Green internal integration | 0.192 | 2.864 ** | 0.293 | 29.071 *** | 0.131 *** |
| Green customer integration | 0.226 | 2.745 ** | ||||
| Green supplier integration | 0.230 | 2.853 ** | ||||
| 3 | Green internal integration | 0.141 | 1.802 + | 0.346 | 15.541 *** | 0.052 ** |
| Green customer integration | 0.220 | 2.691 ** | ||||
| Green supplier integration | 0.276 | 3.262 ** | ||||
| GII × GCI interaction | 0.136 | 1.745 + | ||||
| GII × GSI interaction | −0.200 | −2.459 * | ||||
| GCI × GSI interaction | 0.205 | 3.200 ** | ||||
| GII × GCI × GSI interaction | 0.023 | 0.273 |
*** p < 0.001; ** p < 0.01; * p < 0.01; + p < 0.10.
Table 5.
Cluster centroids.
| Green Internal Integration | Green Customer Integration | Green Supplier Integration | n | |
|---|---|---|---|---|
| High uniform | 5.47 | 5.84 | 5.47 | 68 |
| High green internal integration | 5.16 | 4.55 | 3.69 | 44 |
| Medium uniform | 4.08 | 4.56 | 4.33 | 59 |
| Medium green internal integration | 4.09 | 3.21 | 3.30 | 43 |
| F | 102.68 *** | 181.40 *** | 178.26 *** |
*** p < 0.001.
Table 6.
Discriminant analysis.
| Function | Eigenvalue | % of Variance | Cumulative % | Canonical Correlation |
|---|---|---|---|---|
| 1 | 5.876 | 87.9% | 87.9% | 0.924 *** |
| 2 | 0.739 | 11.1% | 99.0% | 0.652 *** |
| 3 | 0.068 | 1.0% | 100.0% | 0.253 *** |
*** p < 0.001.
Table 7.
Standardized canonical discriminant function coefficients.
| Function 1 | Function 2 | |
|---|---|---|
| Green internal integration | 0.432 | 0.857 |
| Green customer integration | 0.698 | 0.048 |
| Green supplier integration | 0.578 | −0.609 |
Table 8.
Analysis of variance.
| High Uniform (Cluster 1) | High Green Internal Integration (Cluster 2) | Medium Uniform (Cluster 3) | Medium Green Internal Integration (Cluster 4) | F | |
|---|---|---|---|---|---|
| Operational performance | 5.816 (2, 3, 4) | 4.796 (1) | 4.703 (1) | 4.576 (1) | 47.703 *** |
| Financial performance | 5.703 (2, 3, 4) | 4.655 (1) | 4.664 (1) | 4.581 (1) | 28.910 *** |
Numbers in parentheses indicate the cluster(s) from which that cluster is significantly different at p < 0.05. *** p < 0.001.
© 2017 by the authors. Licensee MDPI, Basel, Switzerland. This article is an open access article distributed under the terms and conditions of the Creative Commons Attribution (CC BY) license (http://creativecommons.org/licenses/by/4.0/).
Share and Cite
MDPI and ACS Style
Song, Y.; Cai, J.; Feng, T. The Influence of Green Supply Chain Integration on Firm Performance: A Contingency and Configuration Perspective. Sustainability 2017, 9, 763. https://doi.org/10.3390/su9050763
AMA Style
Song Y, Cai J, Feng T. The Influence of Green Supply Chain Integration on Firm Performance: A Contingency and Configuration Perspective. Sustainability. 2017; 9(5):763. https://doi.org/10.3390/su9050763
Chicago/Turabian StyleSong, Yongtao, Junya Cai, and Taiwen Feng. 2017. "The Influence of Green Supply Chain Integration on Firm Performance: A Contingency and Configuration Perspective" Sustainability 9, no. 5: 763. https://doi.org/10.3390/su9050763
Note that from the first issue of 2016, this journal uses article numbers instead of page numbers. See further details here.