Article

Role of Human Knowledge and Communication on Operational Benefits Gained from Six Sigma

by
Jorge L. García-Alcaraz
1,*,
Liliana Avelar-Sosa
1,
Juan I. Latorre-Biel
2,
Emilio Jiménez-Macías
3 and
Giner Alor-Hernández
4
1
Department of Industrial Engineering and Manufacturing, Universidad Autónoma de Ciudad Juárez, Av. Del Charro 450 Norte, Col. Partido Romero, P.C. 32310 Ciudad Juárez, Mexico
2
Department of Mechanical Engineering, Energy and Materials, Universidad de Navarra, Avda. de Tarazona s/n, P.C. 31500 Tudela, Spain
3
Department of Electrical Engineering, Universidad de La Rioja, C/San José de Calasanz 31, P.C. 26004 Logroño, Spain
4
Division of Research and Postgraduate Studies, Instituto Tecnológico de Orizaba, Oriente 9, Emiliano Zapata Sur, P.C. 94320 Orizaba, Mexico
*
Author to whom correspondence should be addressed.
Sustainability 2017, 9(10), 1721; https://doi.org/10.3390/su9101721
Submission received: 9 August 2017 / Revised: 15 September 2017 / Accepted: 21 September 2017 / Published: 26 September 2017

Abstract

:
Six Sigma (SS) is a production philosophy focused on human experiences and knowledge, aimed to minimize defects of products and services. The appropriate implementation of SS requires an education process, reliable data analysis, efficient didactic material, statistical techniques and human knowledge to improve communication and operational benefits. In this article, we present a structural equation model integrating those aspects as latent variables and relating them with ten hypotheses. Data for hypothesis validation were gathered among 301 manufacturing companies, and assessed using partial least squares (PLS) to estimate direct, indirect, and total effects. As results, we found that access to reliable information, trusted analysis and knowledgeable management are crucial for SS implementation at the problem definition stage. Likewise, to execute and control SS projects, it is important to be trained in statistical techniques through clear didactic materials.

Graphical Abstract

1. Introduction

To stay afloat in this globalized context, companies must adopt and implement tools, techniques, and methods that have helped other companies to succeed. One of the most popular of these methodologies is Six Sigma (SS), which is part of Total Quality Management (TQM). SS has its origins in the 1980s, in the Motorola industry and, due to its success, years later, other companies such as Allied Signal, Bombardier, Siebe, Sony, Polaroid, Toshiba and Texas Instruments implemented it. However, its recognition as an efficient methodology for the control of variability was obtained in General Electric [1].
The application of SS evolved rapidly to other sectors, and, already in the year 2000, its applications were associated with plant distribution [2] and education [3], and it was formally established as a methodology for control of quality [4,5]. According to their use, SS can be defined as a methodology for the continuous improvement of customer satisfaction thanks to a reduction of defects in products/services to increase economic benefits [6].
Although SS can be defined in many ways, from a statistical viewpoint, it is a controlled production process methodology with a near-perfect rate of 3.3 defects per million opportunities. This is perhaps the most important definition of SS as a methodology, since it implies that processes must be appropriately standardized [7]. However, as a procedure, SS is also treated as an integrated methodology consisting of two sub-methodologies: defining, measuring, analyzing, improving, and controlling (DMAIC), used when products or processes are in existence; and defining, measuring, analyzing, designing and verifying (DMADV), used when products or processes are not in existence and the company needs to develop them [8]. In this research, SS is considered as a methodology integrating other techniques, but this research is only focused on DMAIC, due to the geographical context.
Products/services defects are areas of opportunity that can be addressed with SS. Examples of companies having successfully implemented this methodology in the 1990s include Motorola, General Electrics, and Allied Signals [9]. Investments in education and training in these companies showed remarkable cost–benefit relationships. Unfortunately, since not every organization implementing SS obtains satisfying results, it is important to identify the critical success factors (CSF) of this methodology to prevent companies from throwing SS projects away.
It is common for managers to think that SS is not a suitable methodology to be implemented because its benefits are obtained only in specific contexts. Fortunately, current studies have demonstrated that SS is not only appropriate for manufacturing systems, but also for the services sector [10].
Research has provided an overview of the critical success factors of SS for countries such as India [11], Brazil [12,13], Malaysia [14], Italy [15], and Mexico [7]. Some factors seem to be consistent across countries, whereas others greatly differ, especially in industrial contexts. For instance, authors such as Chakraborty and Chuan Tan [16] reported the 19 critical success factors of SS for the services industry in Singapore, while Jayaraman et al. [17] found 25 of these factors for Malaysian industries. As regards Australian industries, a study conducted by Kumar et al. [18] discussed 14 critical success factors for SS implementation. Finally, a study led by Lande et al. [19] managed to compare the key success factors from different countries thanks to a collection of 63 SS-related scientific articles. Thus, there are many reports from industries that have successfully implemented SS, and for a full report, please consult Kwak and Anbari [20].
Organizational learning, a culture of innovation and change, leadership, consistency, Communication, integration, understanding of the SS principles, and managerial commitment are some of the most reported critical success factors of SS [19]. However, being SS a methodology, we believe that the first implementation stages have an impact on subsequent ones. Therefore, it is important to analyze, from a quantitative perspective, how and to what extent SS implementation stages are interrelated.
The literature also reports education and training as key factors to explain the success of SS. In this sense, some companies measure the cost–benefit relationship of investments in education and training as an efficiency indicator [21]. In any case, an educated and trained workforce, which is also expert in the necessary tools for SS deployment, helps companies improve Communication and solve problems more efficiently. Consequently, the learning process and feedback are facilitated thanks to shared experiences [22]. Obviously, companies invest in a complete education and training process to obtain the best Operational benefits, which would reflect on product quality and process cycle times. However, we should bear in mind that, to obtain such benefits and a strong competitive advantage, teamwork is also crucial [23].
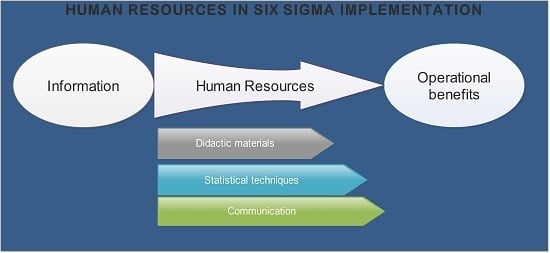
Although many studies have identified the critical success factors of SS across contexts and industrial sectors, few of them have managed to find how these factors are interrelated and to what extent, especially in Mexican maquiladora sector. Moreover, there seems to be no consensus regarding the level of importance of these critical success factors in the SS implementation process in the manufacturing industry. To address these gaps, our research quantifies the impact of education and training (access to information, Didactic material, and understanding of statistical tools) on Communication and operational performance using a structural equation model with ten hypotheses. The model is tested statistically with information from Mexican maquiladora and focused on DMAIC only, because there is a product or process in existence and the problem to solve is the quality in production lines.
The main motivation for this research is that, in Ciudad Juárez (Mexico), there are 326 maquiladora companies, which are subsidiaries that belong to foreign companies established in other countries, but that perform activities of assembly of products in other countries. Those maquiladoras are characterized by having an extensive import of raw materials, and export of finished products, since the production and assembly process is carried out in Mexico, and SS is considered an efficient methodology to ensure quality. Nevertheless, there is an special emphasis on the role of access to information, training in Statistical techniques and teaching material, as well as the administration and Communication of knowledge to achieve Operational benefits.
The remainder of this paper is structured as follows: Section 2 proposes and justifies the research hypotheses; Section 3 describes the methods used to test such hypotheses; Section 4 presents our findings; and Section 5 discusses the research conclusions and industrial implications of results.

2. Background and Hypotheses Formulation

The objective of this study is to quantify the relationships among education, training, Communication, and Operational benefits under a SS implementation scenario. In this section, we describe these four variables and explain how they can be measured.

2.1. Education in Six Sigma

Education is a pillar of SS implementation. In this research, education has been divided into three latent variables: access to Information, use of Statistical techniques and use of Didactic material.

2.1.1. Access to Information

It is important to exploit all the resources to gather information for the SS project at a planning stage before its execution. In this sense, it is common to consult data on similar SS initiatives previously taken on with success [24]. Black Belts (BBs) and Green Belts (GBs) should assist the information retrieval process, since they know best the company’s achievements. However, if it is difficult to find what information is needed for a specific project; project leaders and members must make use of all the information and communication technologies put at their disposal [25].
Access to Information is essential when implementing a SS project. If gathered data are not reliable, this might compromise the project’s ability to solve the problem that it aims at tackling [26]. However, we should bear in mind that BBs and GBs have the responsibility to control the kind of information that can be accessed and how it may be disclosed [27].
To measure Information as a latent variable, the following items, previously studied in other research works, were taken into account:
  • Easy access to information [6,14]
  • Relevant information found in the company’s databases [15,19,28]
  • Protection of information obtained from SS projects [15,29]
  • Access to other company departments when information is not available in one of them [6,15]
  • Rules for information protection and confidentiality [15,30]

2.1.2. Statistical Techniques for Six Sigma

Once the company has defined the problem to be solved, project leaders must find in which Statistical techniques project members must be trained [31]. For the basic techniques, it is important to be familiar with key concepts such as measures of central tendency and measures of dispersion [32]. By internalizing these notions, operators can more easily understand what is meant by simple regression, multiple regression, experiments design, and variance analysis, among a few concepts.
To analyze this variable, we took into account the following items:
  • Use of root cause analysis tools [14]
  • Use of the DMAIC technique [14,19]
  • Problem identification through statistical tools [6,30]
  • Use of specialized software [19,21]
  • Use of graphs and statistics [30]
The use of one or another statistical technique always depends on the type of problem to be solved. For this reason, we propose our first working hypothesis as follows:
Hypothesis 1 (H1).
Analyzing Information for SS projects has a positive direct impact on the types of Statistical techniques to be taught.

2.1.3. Didactic Material

Education and training programs are designed according to the very specific needs of each project. This means that Didactic material (DMs) greatly vary across organizations [33], yet all of them must aim at helping workers better understand the SS methodology. Likewise, all education and training resources must address both theoretical and practical aspects to allow employees to present some of the company’s success stories. Moreover, DMs should not be used for a single project; instead, information contained in a given material should be available for future projects [31]. This education and training process plays a key role in company performance [34].
To measure this latent variable, we considered the following items:
  • DMs contribute to a better understanding of how SS works and is used [6]
  • BBs appropriately explain the objective of the DM [14,21]
  • DMs help execute an SS project [6,19]
  • DMs are useful in other SS projects [30,35]
  • DMs and BBs instructions are understandable [6,36]
Since the focus of DMs varies depending on the type of problem to be solved and the kind and amount of information that is available, we propose the second working hypothesis as follows:
Hypothesis 2 (H2).
Information available for SS projects has a positive direct impact on the types of Didactic material to be used during the education and training process.
The content of DMs must deal with the Statistical techniques to be taught. Similarly, facilitators (BBs and GBs) have to master all the contents. For these reasons, we propose our third research hypothesis below:
Hypothesis 3 (H3).
The Statistical techniques of SS to be taught have a positive direct impact on the Didactic material.

2.2. Communication

Communication—both horizontal and vertical—is another critical success factor of SS. Because this methodology does not work in isolation, an appropriate flow of Information inside the organization is of vital importance [37]. As a means to reach or improve Communication, BBs and GBs can organize meetings with their group members on a regular basis to discuss the progress of projects that they have taken on and provide/receive feedback. Such reunions would allow SS teams to make the necessary changes to the projects and to appropriately allocate resources to reach the goals planned [38].
To measure the level of Communication that companies have during the SS implementation process, we took into account the following variables:
  • BBs, GBs, and project leaders organize meetings [28,29]
  • The BB and GB provide support in measuring variables and obtaining information [15,28]
  • Group members inform of their progress to their peers [28,35]
  • Group members talk about their problems with an SS project [6,19]
  • Work teams share their experience among them [21,30]
The Communication flow within an organization depends on many factors. Perhaps one of the most important is the extent to which employees receive assistance when analyzing and interpreting information and when identifying measurement and control variables [39]. Considering this fact, we propose our fourth research hypothesis as follows:
Hypothesis 4 (H4).
The amount of Information available during SS implementation has a positive direct impact on Communication inside work teams.
The types of Statistical techniques used for SS implementation are another factor contributing to an appropriate Communication flow. Techniques that are easy to understand will be quickly communicated horizontally among group members; however, more complex procedures for statistical analysis may require greater vertical Communication between team members and BBs or GBs [40]. Similarly, Communication can be compromised when team members are novice users of some specialized software. In such cases BBs and GBs, which know best how to use such software, have to assist their fellow team members during the information analysis process. This would ensure that figures and mathematical models contain accurate information and present it appropriately [41].
Considering the impact of Statistical techniques on the Communication flow in organizations implementing SS, we propose our fifth working hypothesis as follows:
Hypothesis 5 (H5).
Statistical techniques used in SS implementation have a positive direct effect on the quality of Communication.
Didactic material is a third factor contributing to effective Communication. Questions may arise among team members regarding how such materials must be interpreted and analyzed; therefore, it is important to plan regular meetings to provide training and feedback as well as allow team members to share their experiences using such materials [42]. Similarly, to avoid misunderstandings, managers must make sure that all team members are familiar with basic SS concepts [43]. Finally, research has demonstrated that clear Didactic material increases self-confidence when initiating new projects and contributes to effective Communication [44].
Thus, considering the impact of training and education resources on Communication, we propose the sixth working hypothesis below:
Hypothesis 6 (H6).
The Didactic material used during the SS implementation process has a positive direct impact on Communication.

2.3. Operational Benefits of Six Sigma

One of the main contributions of this research is that we relate the critical success factors of SS to their corresponding benefits. Operational benefits are perhaps the most commonly reported of all benefits of SS, although there is also a great amount of literature regarding Economic Benefits [20]. Among the main Operational benefits of SS, we can find:
  • Quality or service perceived by customers [45]
  • Cycle time reduction [46]
  • Increased employee performance [23,45]
  • World-class standards [20,47]
  • Waste reduction [23,47]
  • Increased teamwork [45,48]
  • Multifunctional employees [46,47]
These Operational benefits are one of the main reasons for SS implementation. However, companies must know which the most efficient ways to obtain them are. Which activities guarantee them? Which critical success factors favor them? A great number of factors may allow companies to boost their operational performance, yet Information is perhaps the most crucial of these factors. If Information is not reliable, a project may be poorly designed or the possible alternatives to a problem can be incorrectly analyzed [49]. Likewise, problems may be incorrectly defined if information is not accurate, thereby leading to a loss of money and time.
Considering the impact of having reliable and enough Information on Operational benefits, our seventh working hypothesis reads as follows:
Hypothesis 7 (H7).
Information used during SS implementation has a positive direct impact on Operational benefits.
Statistical techniques are another source of operational performance at all SS implementation stages: problem definition, project execution, and project control [21]. In addition, besides supporting the problem identification process, Statistical techniques support other tools, such as the DMAIC approach [50]. This approach is an equivalent of the scientific method applied to the industrial context. The DMAIC approach is commonly adopted by industries worldwide, since its implementation, combined with SS, has reported remarkable success stories.
Therefore, since we believe that Statistical techniques have a positive impact on Operational benefits under a SS implementation scenario, we propose our eighth research hypothesis as follows:
Hypothesis 8 (H8).
Statistical techniques used during SS implementation have a positive direct effect on Operational benefits.
The Operational benefits of SS also depend on the quality of the Didactic material employed to teach and train workers in the SS methodology. As previously mentioned, if this material lacks clarity, team members may analyze and/or interpret results incorrectly [51]. The responsibility of BBs and GBs is therefore to ensure that every team member is provided with clear and correct instructions during the training sessions [34,43]. This would contribute to minimizing waste, which is one of the objectives of SS from a statistical point of view [37]. This discussion regarding the role of Didactic material in Operational benefits under a SS implementation scenario allows us to propose our ninth research hypothesis below:
Hypothesis 9 (H9).
The Didactic material used to teach and train in SS has a positive direct impact on Operational benefits.
Communication is another critical success factor of SS with a strong impact on Operational benefits. If BBs and GBs do not organize meetings with their fellow team members, they may be missing important opportunities to supervise projects, provide feedback, and take timely decisions [52]. Similarly, training and education sessions are key moments to communicate the different notions of quality, and they would indirectly minimize conflicts and crises in the company, since products and services will be standardized as a result of Communication [53]. Finally, Communication is the means to reach collaboration [38]. Companies that do not communicate their success may cause their employees to work on their own, which contradicts the objective of SS [54]. Following this discussion, we propose our tenth and last working hypothesis as follows:
Hypothesis 10 (H10).
Communication in a SS implementation scenario has a positive direct impact on Operational benefits.
Figure 1 depicts the ten research hypotheses proposed and previously discussed into a structural equation model, integrated according to dependence established among latent variables.

3. Methodology

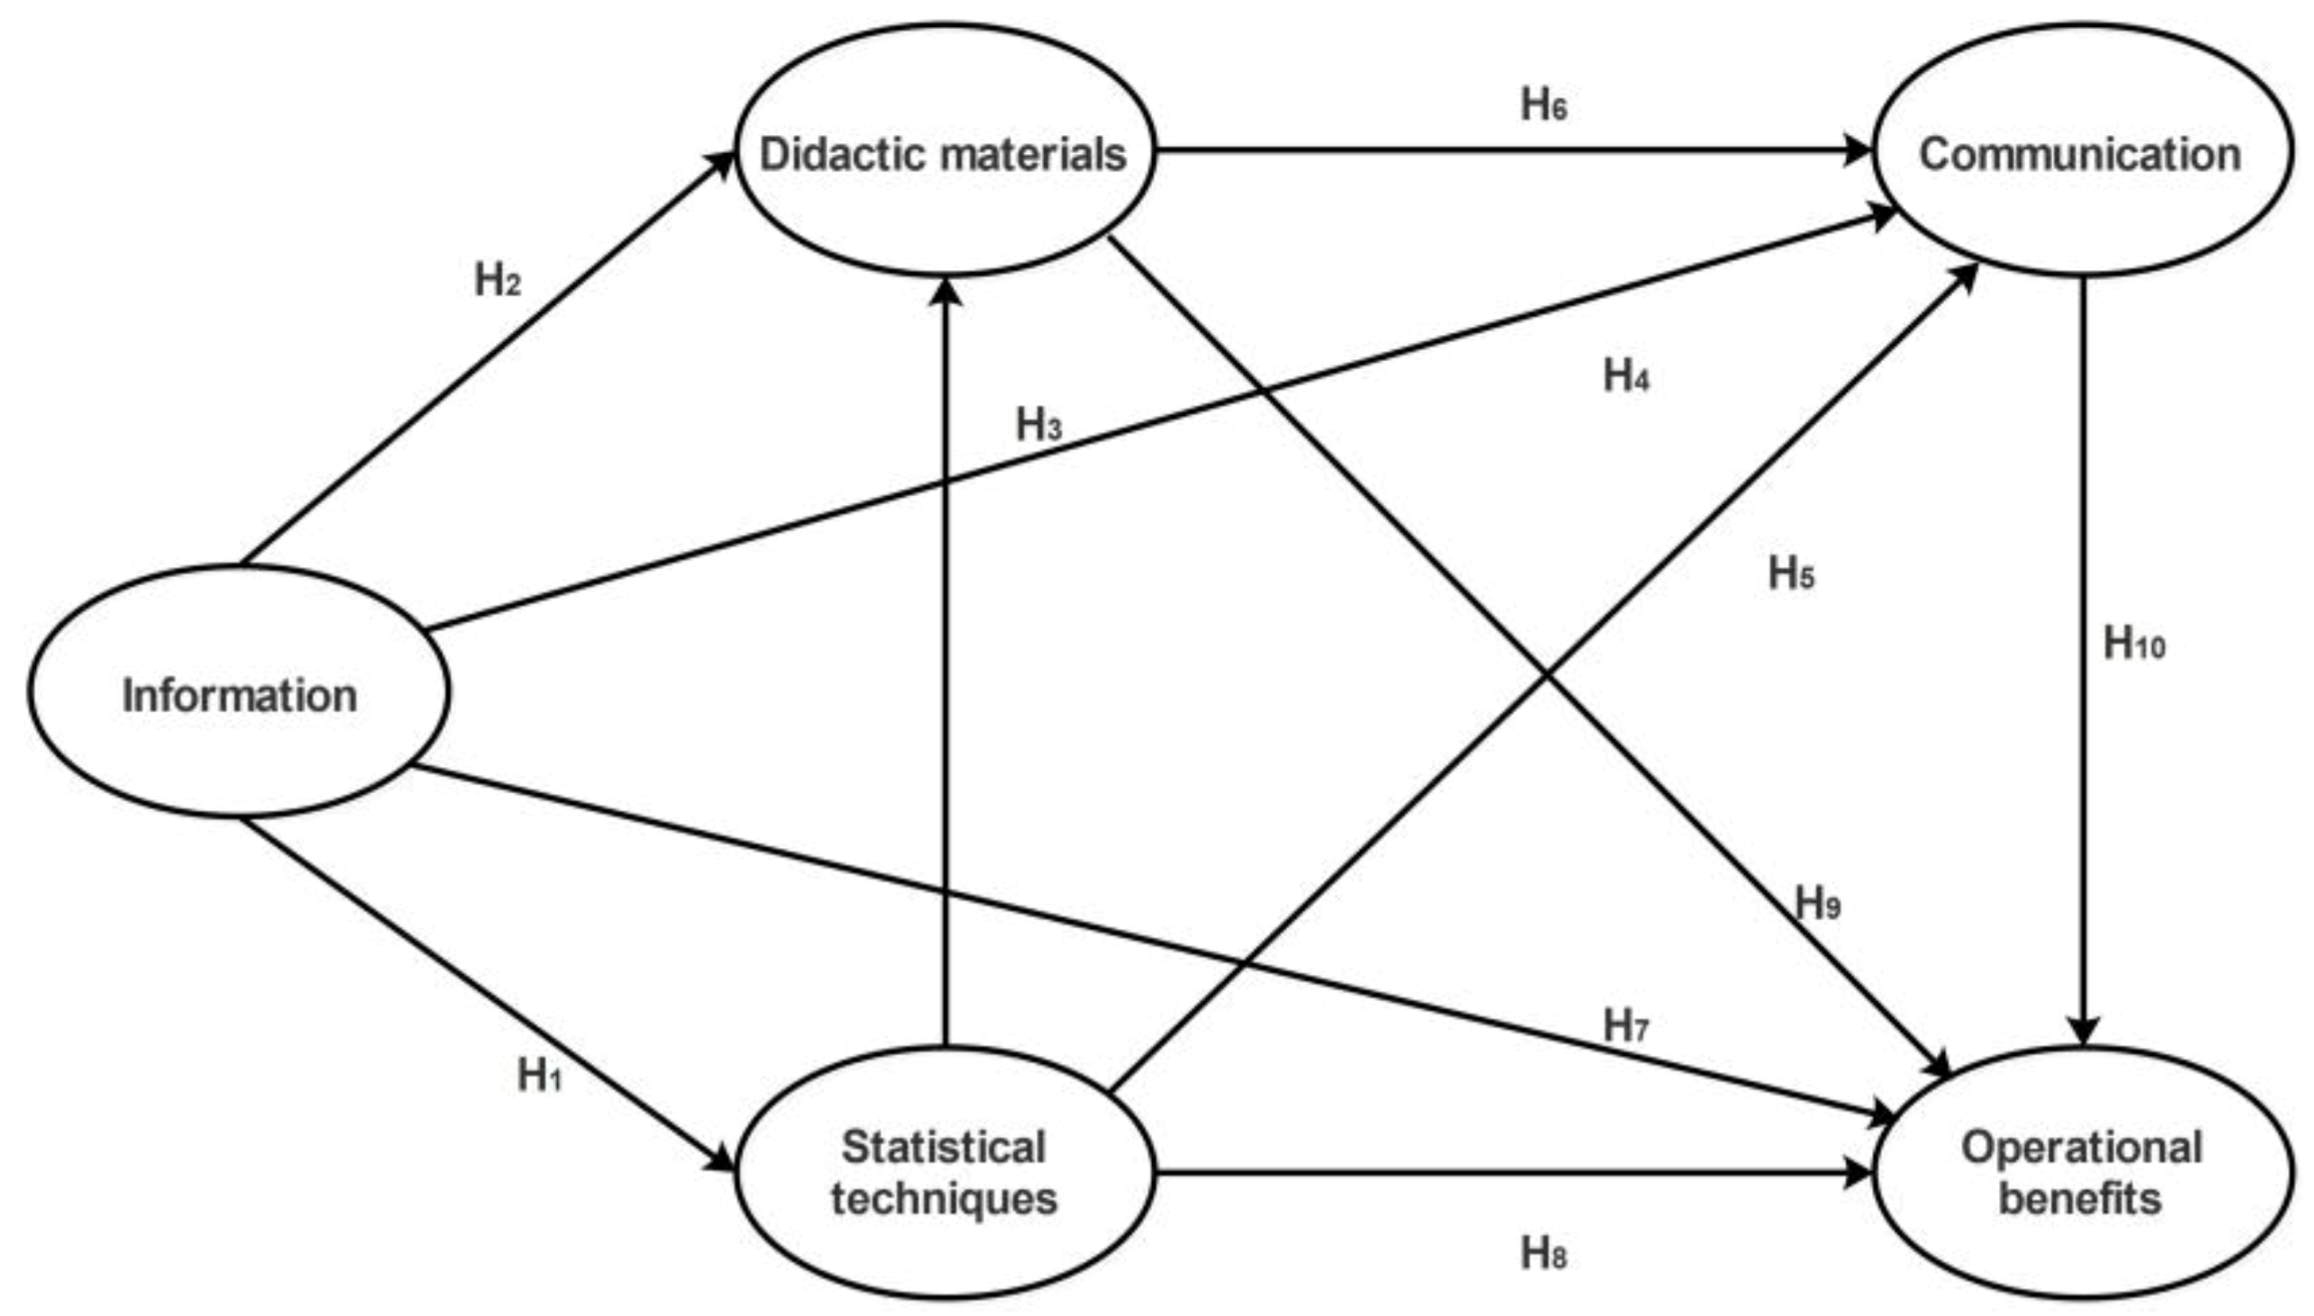
To reach our objective and validate the ten hypotheses depicted in Figure 1, we adopted the following methodology.

3.1. Defining Variables and Creating the Survey

In this research, we discuss three basic concepts related to SS: Education and Training (Information, Didactic material, and Statistical techniques), Communication, and Operational benefits. To find the observed variables of each of these concepts, we conducted a literature review on databases such as Sciencedirect, Ingenta, and Ebscohost, among others.
Once we identified the observed variables, we constructed a survey. The literature review thus represented the rational validation of this survey [55,56], which was composed of three sections. The first section was aimed at collecting sociodemographic data of the participants, and the second section assessed the critical success factors of SS. As regards the third section, it analyzed the different types of SS benefits; however, for the purpose of this study, only took into account items collecting data on Operational benefits were taken into account.
The first version of the survey was submitted to a content validation among a group of subject-matter experts. The purpose of the experts validation was to make sure that our instrument had been appropriately adapted to the context of the research [57,58], since data had been collected from previous studies conducted worldwide, not just in Mexico.
Finally, the survey had to be answered using a five-point Likert scale, where a one value indicated that an SS activity was not important or an SS benefit was never obtained. On the other hand, the highest value indicated that an SS activity was highly important or an SS benefit was always obtained. Values of two are used for activities frequently executed or benefits gained, while three for regular, and four for usually.

3.2. Survey Administration

The model and its hypotheses were validated with data collected from the Mexican maquiladora industry during May to July 2016. More specifically, we administered the survey to manufacturing company managers, GBs, BBs, Champions, and group leaders having at least two years of experience in SS or who had participated in SS initiatives at least three times. A list of maquiladoras, manager names and contact information was provided by AMAC (Maquiladoras Association AC) and then, survey administration meetings were scheduled in advance to managers having experience in SS implementation, and the questionnaire was to be answered individually. After a first interview with managers, the snowball method was used to identify other possible responders (managers, green belts, black belts and champions).
However, for participants who cancelled the meeting three times, we stopped insisting due to time restrictions.

3.3. Data Capture and Validation

We constructed an electronic database with gathered data using SPSS software. Then, we performed a screening process to identify missing values and outliers, which were replaced by the median value of items. However, cases or surveys showing more than 10% of missing values were removed.
Latent variables were validated through the following indices:
  • Cronbach’s alpha and composite reliability index: Used to measure internal validity. Acceptable values must be higher than 0.7 [57,59].
  • R-Squared (R2) and Adjusted R-Squared: Used to measure the predictive validity of dependent latent variables from a parametric perspective. Acceptable values must be higher than 0.2 [60].
  • Q-Squared (Q2): Used to measure predictive validity from a non-parametric perspective. Acceptable values of Q2 must be similar to their corresponding R2 and adjusted R2 values [60].
  • Average Variance Extracted (AVE): Used to assess convergent validity, setting 0.5 as the threshold [61].
  • Variance Inflation Factors (VIFs): Used as a measure of collinearity. Acceptable values must be below 3.3 [62].
Note that sometimes it is possible to increase the Cronbach’s alpha value in a latent variable after removing items that seem to compromise its validity. For this reason, we ran several iterations to validate each latent variable.

3.4. Descriptive Analysis of the Sample

At this stage, we created contingency tables to analyze trends in the sample characteristics. As previously mentioned, we analyzed the genre of participants, number of SS projects that they had taken on, company size, and industrial subsector, among a few.

3.5. Descriptive Analysis of Items

Since we worked with ordinal data, we used the median as a measure of central tendency and the interquartile range (IQR) as a measure of data dispersion. Both measures helped us identify which SS activities and benefits are the most important to manufacturing companies, from the sample’s viewpoint. High median values indicated that an SS activity was important to the sample or an SS benefit was always obtained, whereas low median values indicated that an SS activity was not important to the sample or an SS benefit was not obtained. As regards the IQR, high values revealed low consensus among respondents regarding the median value of an item. Low IQR values revealed high consensus among respondents with respect to the median value of an item.

3.6. Hypotheses Validation

To validate the research hypotheses, we created a structural equation model (SEM) using WarpPLS v.5. This software relies on partial least squares (PLS) and is regularly recommended for studies working with Likert scales, small samples, and non-normal data [39]. Likewise, WarpPLS v.5 has been a useful tool for validating theories in SS research. For instance, it was reportedly employed to know the impact of knowledge created in SS on organizational performance [45].
Before interpreting the model, we analyzed its efficiency by computing the model fit and quality indices in Table 1 [63]:
Once the model proved to be statistically stable, we proceeded to interpret it. For this interpretation, we analyzed three types of effects in every relationship:
  • Direct effects: They validate hypotheses presented in Figure 1. Every direct effect corresponds to a hypothesized relationship between latent variables.
  • Indirect effects: These occur between two latent variables through a mediating variable.
  • Indirect effects are always interpreted using two or more model paths.
  • Total effects: They are the sum of direct and indirect effects in a relationship.
All effects were associated with a beta (β) value—expressed in standard deviations—and a p-value for the statistical significance of effects at a 95% confidence level, thus setting 0.05 as the cutoff and testing the null hypothesis: β = 0, against the alternative hypothesis: β ≠ 0. Finally, every effect also included an effect size (ES) to represent the amount of R2 or explained variance contained in dependent latent variables [64].

4. Results and Discussion

After three months of administering the survey, from May to July 2016, we collected 323 surveys or cases, but only 301 of them were analyzed, since the remaining ones presented more than 10% missing values and were excluded. Results from the data analysis are discussed in the following subsections.

4.1. Descriptive Analysis of the Sample

Table 2 presents the sample’s characteristics regarding surveyed industries and job positions. As it can be observed, 289 participants reported information on these two aspects, and the automotive industry was the most surveyed. Similarly, men represented the majority of the sample, whereas only 83 women participated in the study. As regards job positions, 88 Champions, 69 Master Black Belts (MBs), 64 Black Belts (BBs), and 80 Green Belts (GBs) formed the sample.

4.2. Descriptive Analysis of Items

Table 3 presents the descriptive analysis of the latent variables and their corresponding items, also known as observed variables. Data are organized in descending order, according to the median value of items. In this sense, it should be noted that none of the items from the critical success factors of SS showed a median value above four, although they are all higher than three. On the other hand, two Operational benefits had a median value greater than four, meaning that they are usually obtained in Mexican manufacturing industries.
In addition, from this descriptive analysis it is important to highlight the following results:
  • Information should be highly accessible, yet in this research it holds the last position. On the other hand, it seems that such Information is highly protected, since this item holds the first place.
  • Graphs and statistics seem to be common tools when deploying SS projects in Mexican manufacturing companies, since this item was ranked first within latent variable Statistical techniques. However, the use of the DMAIC approach seems to be far less important, since it was ranked last. Unfortunately, when companies do not promote the use of this approach, operators may feel afraid of joining work and improvement teams.
  • As regards Didactic materials, the item referring to clear instructions from instructors showed the highest median. This implies that leaders responsible for training and education programs are competent professionals.
  • Support and assistance from BBs and GBs is the most important item from latent variable Communication. On the other hand, progress monitoring and supervising held the last place in this analysis. Unfortunately, if SS projects are not regularly monitored and supervised, it may be difficult to detect deviations on time.
  • As regards Operational benefits, results indicate that Mexican manufacturing companies remarkably improved their product quality as a result of SS implementation. Such results reflect the objective of SS, which is to minimize defects in products and services. However, the analysis also indicates that a multidisciplinary workforce is a much less common benefit of SS.

4.3. Validation of Latent Variables

Table 4 introduces results obtained from the data validation process. Based on such results, the following conclusions were reached:
  • All latent variables had enough predictive validity from both parametric and non-parametric perspectives, since all R2, Adjusted R2, and Q2 values were higher than 0.2. Moreover, all Q2 values were similar to their corresponding R2 values.
  • All latent variables had enough internal validity, since the Cronbach’s alpha and the composite reliability index were higher than 0.7 in all cases.
  • All latent variables reported enough convergent validity, since all AVE values were higher than 0.5.
  • All latent variables were free from collinearity problems, since the VIFs values were lower than 3.3.

4.4. SEM Evaluation

The model depicted in Figure 1 was tested using the model fit and quality indices described in the methodology. The list below shows the obtained values for these indices. In addition, the tested version of the model is presented in Figure 2:
  • Average path coefficient (APC) = 0.333, p < 0.001
  • Average R-squared (ARS) = 0.611, p < 0.001
  • Average adjusted R-squared (AARS) = 0.608, p < 0.001
  • Average block VIF (AVIF) = 2.810, ideally ≤3.3
  • Average full collinearity VIF (AFVIF) = 2.940, ideally ≤3.3
  • Tenenhaus GoF (GoF) = 0.652, large ≥0.36
  • Sympson’s paradox ratio (SPR) = 1.000, ideally = 1
  • R-squared contribution ratio (RSCR) = 1.000, ideally = 1
  • Statistical suppression ratio (SSR) = 1.000, acceptable if ≥0.7
  • Nonlinear bivariate causality direction ratio (NLBCDR) = 1.000, acceptable if ≥0.7
These results suggested the existence of no collinearity problems in the proposed model; thus, we could successfully analyze and interpret its values. In this sense, in Figure 2, we associated every relationship with a beta (β) value and a p-value. The former represents a dependency measure whereas the latter is the significance value for the hypothesis testing. In addition, each dependent latent variable included an R2 to indicate its amount of explained variance. After analyzing such values, we found nine statistically significant relationships, depicted as solid lines, and one statistically not significant relationship, illustrated as a dotted line.

4.4.1. Direct Effects: Hypotheses Evaluation

Table 5 presents the results from the hypotheses evaluation. For a hypothesis to be statistically significant at a 95% confidence level, its corresponding p-value had to be lower than 0.05. For every hypothesis, the table specifies which dependent (DLV) and independent (ILV) latent variables were involved, the beta and its p-value, and its acceptance into or rejection from the model.

4.4.2. Effect Sizes

Effect sizes indicate the contribution of an independent latent variable to the R-Squared coefficient of its corresponding dependent latent variable. Table 6 shows the effects size for every relationship. It should be noted that latent variable Statistical techniques was 55.3%, explained by a single independent latent variable: Information, whereas in the remaining relationships, the dependent latent variables were explained by two or more independent latent variables. For instance, we found that Didactic material was 65.3%, explained by Statistical techniques and Information, the former being responsible for 39.2% of the variability, and the latter explaining 26.1%. The remaining relationships were similarly interpreted.
In addition, considering the ES values, we reached the following conclusions:
  • Latent variable Statistical techniques is the most important when explaining the variability of Didactic material, being ES = 0.392.
  • Latent variable Information is key to explaining the variability of Communication (ES = 0.242), although Didactic material seems to have a similar effect on it (ES = 0.224).
  • Latent variable Communication is a crucial element for obtaining Operational benefits, since ES = 0.249.

4.4.3. Sum of Indirect Effects

Indirect effects between two latent variables occur through a mediating variable. Table 7 presents the sum of indirect effects between latent variables, the p-value for the statistical hypothesis testing, and the effect size.
After analyzing the research hypotheses (see Section 4.4.1), we found that latent variable Information did not have a statistically significant effect on Operational benefits; however, its indirect effect is statistically significant, and it explained up to 35.1% of the variability of Operational benefits. This is the largest indirect effect reported in the model, with β = 0.585. From a similar perspective, we found that Information had a statistically significant indirect effect on Communication thanks to latent variables Statistical techniques and Didactic material. In this case, although the direct effect also reported a statistically significant value (β = 0.330), the indirect effect was much larger (β = 0.399). In conclusion, latent variable Information had statistically significant indirect effects on all the remaining latent variables, and such effects were the largest ones. For this reason, it was placed in the top left-hand corner of the model.

4.4.4. Sum of Total Effects

The total effects of a relationship are the sum of its direct and indirect effects. As Table 8 demonstrates, the ten total effects that we found were statistically significant at a 95% confidence level, since all p-values were below 0.05. In addition, the analysis revealed that latent variable Information affected all the other latent variables and also caused the largest total effects. In this sense, its total effects on Statistical techniques are worth being highlighted. Information directly influenced Statistical techniques in 0.744, but it was also indirectly responsible for its variability in 53.8% because the effect size is 0.538. Such high value in that relationship indicates that Information is a pillar of SS, but also it is required a good Statistical technique for analysis.
Currently, it is not enough to have access to information to guarantee the SS success, a deep analysis is required and modern techniques must be used, such as big data. In addition, the relationship between Information and Communication is very high with a beta value of 0.729, indicating that the knowledge must be transmitted and saved an important resource.

5. Conclusions and Industrial Implications

In this study, we assessed 20 activities related to educational processes (Information, Statistical techniques, and Didactic material) and Communication as critical success factors of SS. We associated these activities with seven Operational benefits of SS. In the multivariate analysis performed on 301 surveys, all SS activities showed a median value higher than 3 but lower than 4, implying that they are regularly performed in the Mexican manufacturing sector. On the other hand, two of the seven Operational benefits reported a median value higher than 4, thereby implying that they are always obtained.
Although Mexican manufacturing companies seem to rely on effective rules to guarantee confidentiality of Information, SS team members report that access to such data as resource material to plan and start SS projects is not easily granted. Organizations should further analyze this issue, since it may affect employee engagement in SS initiatives. In other words, it is good to motivate employees to improve the production process, but it is equally important to grant them access to the necessary data and information, especially during the first implementation stages of an SS project. If companies do not work on this, SS projects are likely to be incorrectly planned, because of a lack of information related to the production process status. However, this can be a hard activity, because that production process can generate much information for different departments and data analysis requires big data techniques.
As regards Statistical techniques, graphs and figures seem to be the main statistical tool to support SS, whereas the DMAIC approach proved to have a less significant place among Mexican manufacturing companies. Such results suggest that organizations approach SS as a statistical technique rather than as a problem-solving methodology. It is important for companies to find a balance between these two conceptions [20], otherwise SS may become a significant obstacle for those who are not experts in statistics [65]. In this sense, other studies, having detected an imbalance between the different ways SS can be approached, also report that, in such cases, SS projects are more often abandoned [66,67] and that is why this is an opportunity for techniques such as big data or novel techniques to help analyze information obtained from production process, because it allows finding trends, as it is applied in education [68], and SS is a philosophy based in education and training.
In addition, our study reports that GBs and BBs usually provide clear instructions on how to work with Didactic material. However, we also found that this material is not always useful for future projects, and team members must thus be trained every time they initiate a new project with SS, which increases final costs. Concerning Communication, GBs and BBs in Mexican manufacturing companies seem to provide appropriate and sufficient assistance to team members; nevertheless, when it comes to supervising and monitoring SS projects, their performance appears to be less regular. Sadly, employees may lose their motivation when they perceive a lack of consistency when it comes to monitoring projects [69].
Finally, product quality and process cycle time reduction seem to be the main Operational benefits of SS, whereas teamwork and multifunctional skills are less common. In this case, it is important to add human attributes to SS, since human resources know the administrative procedures, the production processes, and the company’s opportunities for improvement [21,70].
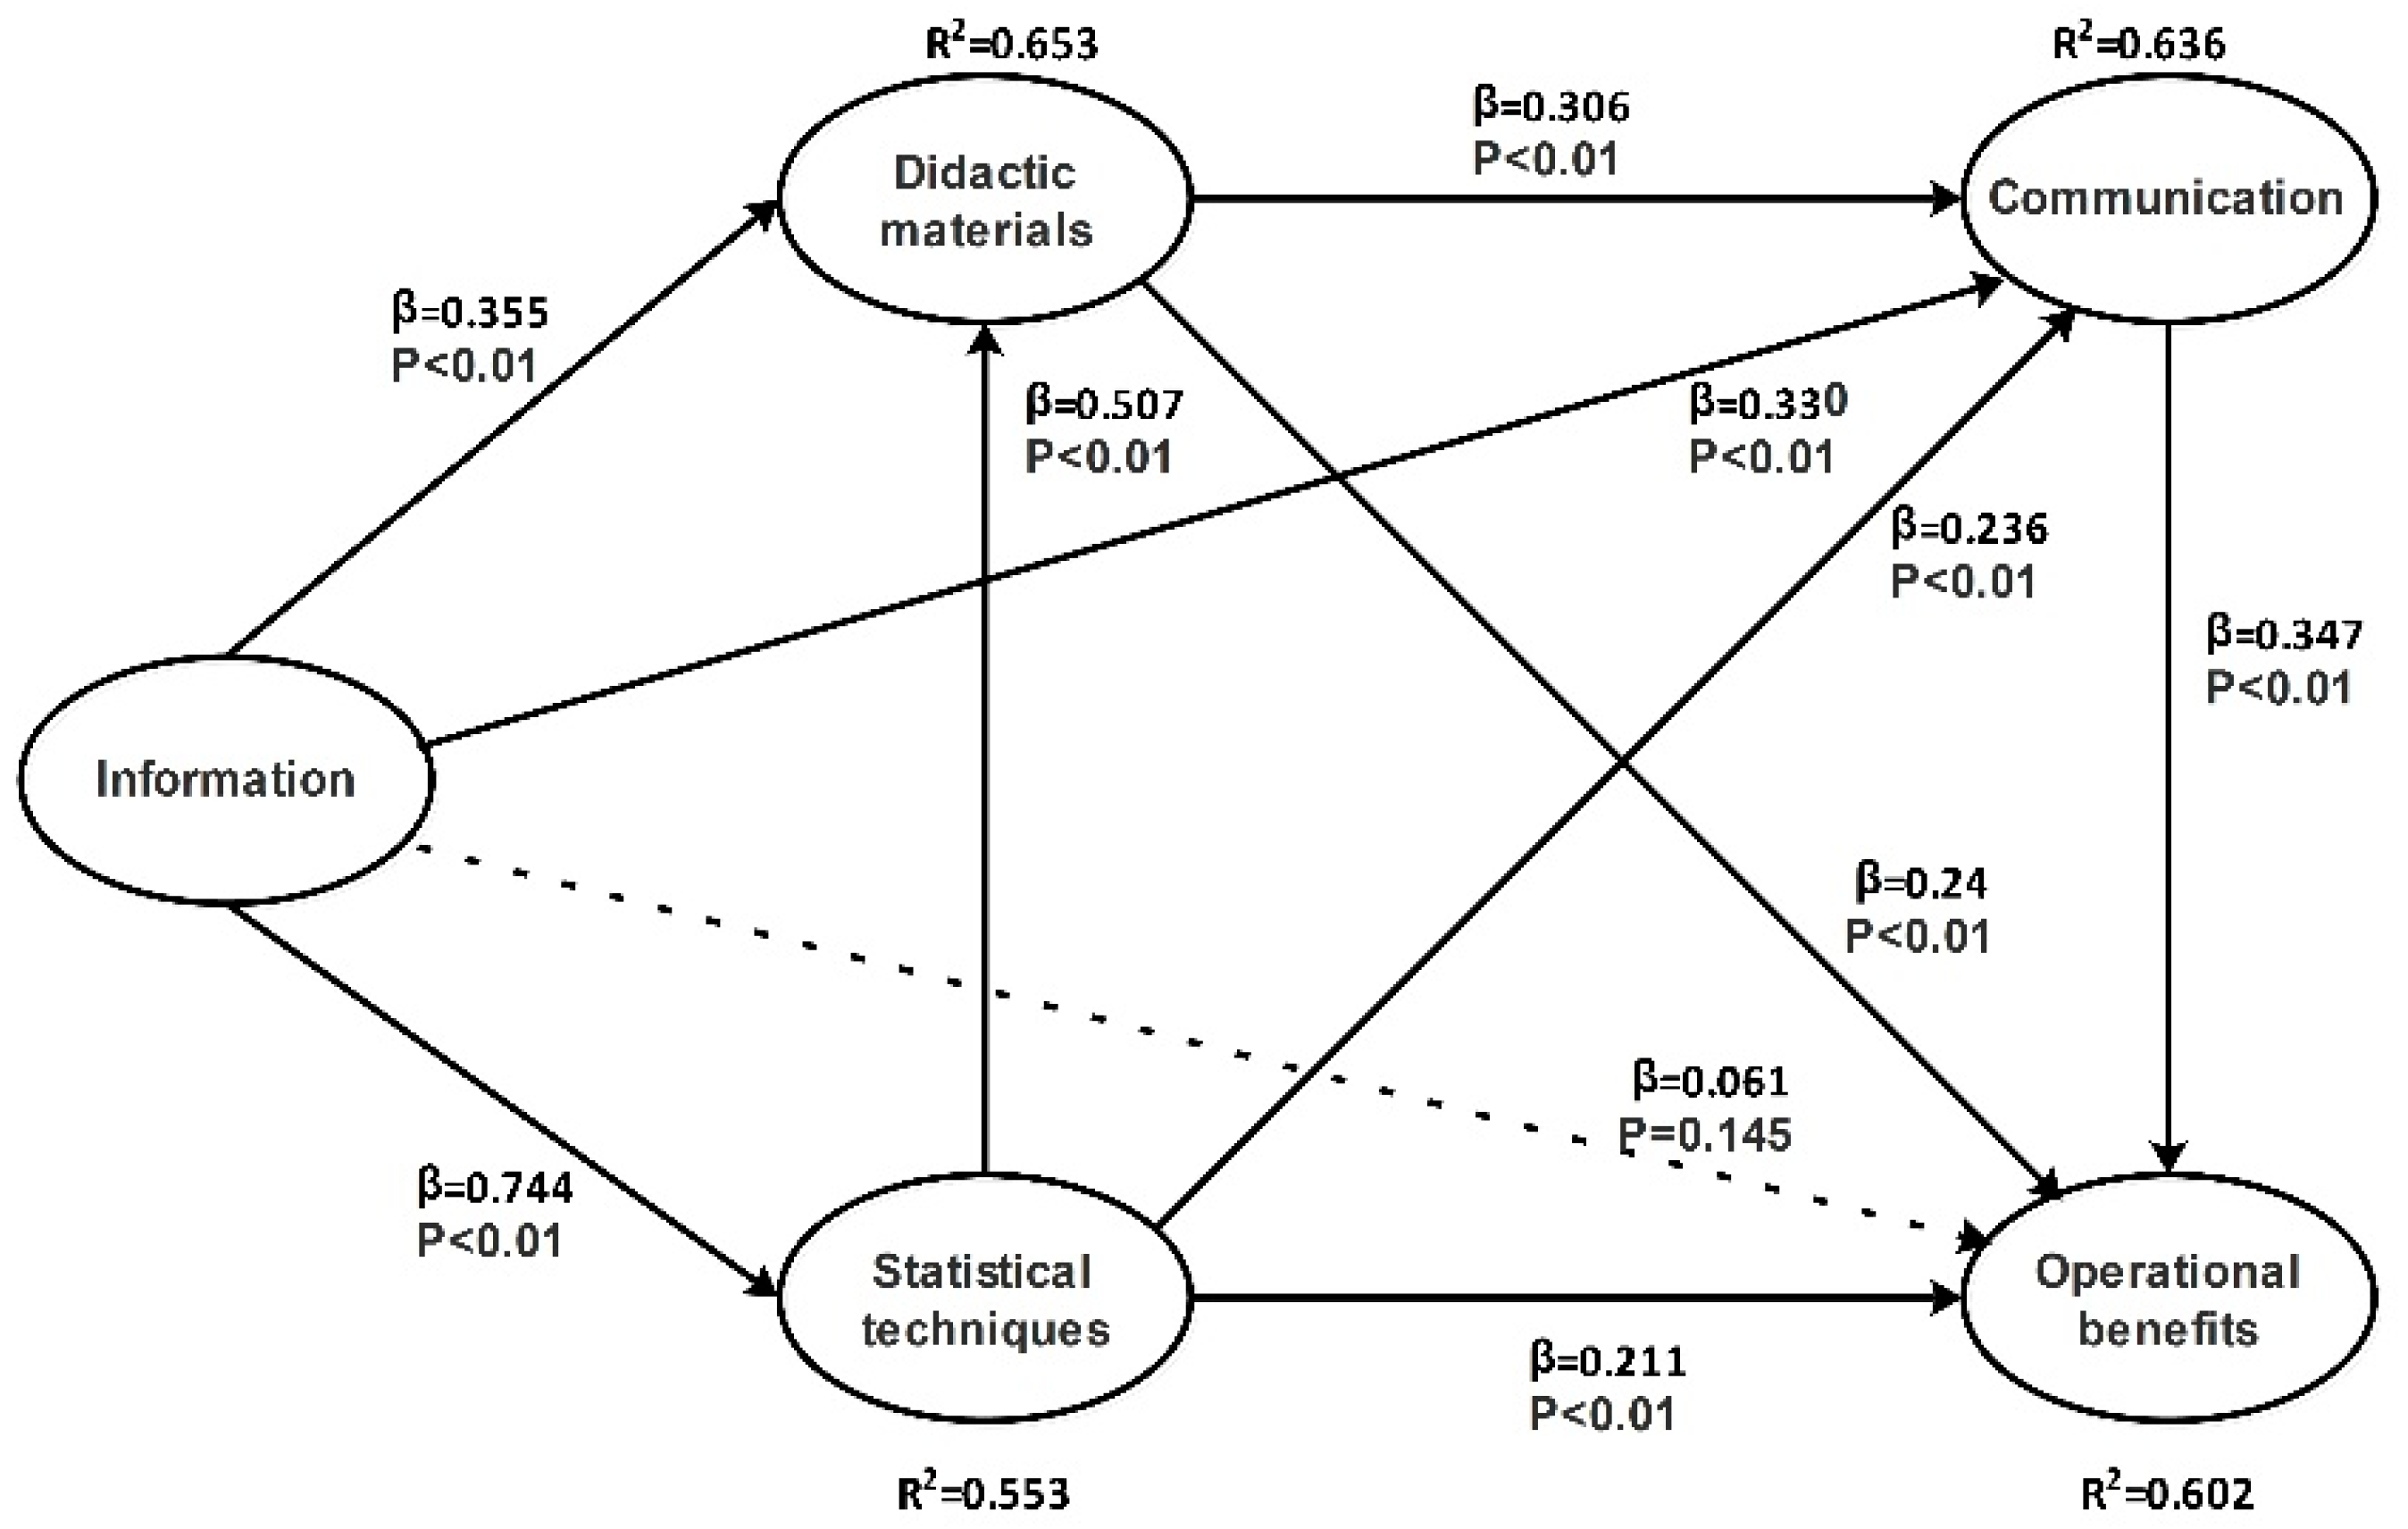
After analyzing the relationships between the latent variables, the following conclusions regarding direct effects were reached:
  • Information available to solve problems defines which Statistical techniques employees will be trained and how Didactic material must be designed, so they can be clear to all team members and reusable in future projects. However, big data can be implemented as a Statistical technique for yellow belts, green belts and champions, because it can help to find hidden patterns into Information.
  • Having available Information does not automatically guarantee Economic Benefits, because direct effect is statistically not significant. First, managers must be focused on teaching and training employees in the use of the necessary Statistical techniques through clear and meaningful Didactic material. The fact that Information does not have a direct impact on Economic benefits implies that it is not appropriately analyzed or it cannot directly become a benefit. Communication and education are therefore required, and managers should be part of appropriate Communication channels and training sessions. However, managers must also encourage that workers integrate in SS projects and share the knowledge gained among them as a way to disseminate their experiences solving problems.
  • Information has a direct effect on Statistical techniques, which denotes the importance of this variable at the first implementation stages of an SS project, where employees identify the problem and define it. In addition, Information has the largest direct effects on all subsequent latent variables, meaning that, if Information is not reliable or easily accessible, companies must have problems implementing SS and probably, they abandon this philosophy, resulting in a lack of quality in their production process.
  • Another important relationship involves Statistical techniques and Didactic material. This relationship again reflects the importance of education and training for an appropriate SS implementation. In fact, the three largest effects, considering the β values, involve the three latent variables that make up the education process.
  • Managers and SS members must strive to implement an appropriate education and training scheme in which Information is reliable but also easily accessible. Likewise, education and training must focus on the use of basic Statistical techniques through clear Didactic material, since these three variables affect Communication, both vertical and horizontal. In other words, without a suitable education and training process, Information cannot properly flow; consequently, all involved variables may diminish the indirect effects that Information has on Economic benefits through Communication as the mediating variable.

6. Limitations and Future Research

The set of hypotheses that have been proposed in the model that associates access and quality of information with Didactic material and Statistical techniques, as well as with Communication processes and Operational benefits, have been tested with information from Mexican maquiladora industry, thus, in another sector and country, it is possible to obtain different results.
In future work, we will get information from industries in other regions of the country to perform comparative analyses to identify the factors that are best associated with SS implementation process. Similarly, given that maquiladoras are a globalized phenomenon, comparisons can be made between countries in South America.

Acknowledgments

Jorge L. García-Alcaraz gratefully acknowledges financial support from the Autonomous University of Ciudad Juarez (IITCA93ET1DEc-19) and Program for Professional Teacher Development (PRODEP).

Author Contributions

In this research, Jorge L. García-Alcaraz and Liliana Avelar-Sosa conceived and designed the structural equation model and collected information for its validation; Juan I. La Torre-Biel and Emilio Jimenez-Macías reviewed the manuscript; and Giner Alor-Hernandez helped in analysis and conclusions.

Conflicts of Interest

The authors declare no conflict of interest. The founding sponsors had no role in the design of the study; in the collection, analyses, or interpretation of data; in the writing of the manuscript, and in the decision to publish the results.

References

  1. Furterer, S.L. Lean Six Sigma roadmap. In Lean Six Sigma Case Studies in the Healthcare Enterprise; Springer: London, UK, 2014; pp. 11–62. [Google Scholar]
  2. Han, C.; Lee, Y.-H. Toward intelligent integrated plant operation system for six sigma. IFAC Proc. Vol. 2001, 34, 15–28. [Google Scholar] [CrossRef]
  3. Joseph Gordon, M., Jr. Chapter 5—Six sigma education and using the existing quality methods and procedures. In Six Sigma Quality for Business and Manufacture; Elsevier Science B.V.: Amsterdam, The Netherlands, 2002; pp. 171–245. [Google Scholar]
  4. Joseph Gordon, M., Jr. Chapter 8—Six sigma keys to success are control, capability and repeatability. In Six Sigma Quality for Business and Manufacture; Elsevier Science B.V.: Amsterdam, The Netherlands, 2002; pp. 333–392. [Google Scholar]
  5. Sharon, H.N.; Miller, M.A.; Stimart, R.P. Demonstrating the value of the user interface design process using six sigma methodology. Comput. Stand. Interfaces 1999, 21, 167. [Google Scholar] [CrossRef]
  6. De Jesus, A.R.; Antony, J.; Lepikson, H.A.; Peixoto, A.L.A. Six sigma critical success factors in Brazilian industry. Int. J. Qual. Reliab. Manag. 2016, 33, 702–723. [Google Scholar] [CrossRef]
  7. Tlapa, D.; Limon, J.; García-Alcaraz, J.L.; Baez, Y.; Sánchez, C. Six sigma enablers in Mexican manufacturing companies: A proposed model. Ind. Manag. Data Syst. 2016, 116, 926–959. [Google Scholar] [CrossRef]
  8. Shaaban, S.; Darwish, A.S. Production systems: Successful applications and new challenges part one—Lean, six sigma, inventory, JIT and TOC. Prod. Plan. Control 2016, 27, 539–540. [Google Scholar] [CrossRef]
  9. Firka, D. Six sigma: An evolutionary analysis through case studies. TQM J. 2010, 22, 423–434. [Google Scholar] [CrossRef]
  10. Tsironis, L.K.; Psychogios, A.G. Road towards Lean Six Sigma in service industry: A multi-factor integrated framework. Bus. Process Manag. J. 2016, 22, 812–834. [Google Scholar] [CrossRef]
  11. Prabhushankar, G.V.; Devadasan, S.R.; Shalij, P.R. Six sigma in Indian automotive components sector: A survey. ICFAI J. Oper. Manag. 2008, 7, 19–37. [Google Scholar]
  12. De Carvalho, M.M.; Ho, L.L.; Pinto, S.H.B. The six sigma program: An empirical study of Brazilian companies. J. Manuf. Technol. Manag. 2014, 25, 602–630. [Google Scholar] [CrossRef]
  13. De Jesus, A.R.; Antony, J.; Lepikson, H.A.; Teixeira Cavalcante, C.A.M. Key observations from a survey about six sigma implementation in Brazil. Int. J. Product. Perform. Manag. 2015, 64, 94–111. [Google Scholar] [CrossRef]
  14. Habidin, N.F.; Yusof, S.M. Critical success factors of Lean Six Sigma for the Malaysian automotive industry. Int. J. Lean Six Sigma 2013, 4, 60–82. [Google Scholar] [CrossRef]
  15. Brun, A. Critical success factors of six sigma implementations in Italian companies. Int. J. Prod. Econ. 2011, 131, 158–164. [Google Scholar] [CrossRef]
  16. Chakraborty, A.; Chuan Tan, K. Case study analysis of six sigma implementation in service organisations. Bus. Process Manag. J. 2012, 18, 992–1019. [Google Scholar] [CrossRef]
  17. Jayaraman, K.; Leam Kee, T.; Lin Soh, K. The perceptions and perspectives of Lean Six Sigma (LSS) practitioners: An empirical study in Malaysia. TQM J. 2012, 24, 433–446. [Google Scholar] [CrossRef]
  18. Kumar, M.; Khurshid, K.K.; Waddell, D. Status of Quality Management practices in manufacturing SMEs: A comparative study between Australia and the UK. Int. J. Prod. Res. 2014, 52, 6482–6495. [Google Scholar] [CrossRef]
  19. Lande, M.; Shrivastava, R.L.; Seth, D. Critical success factors for Lean Six Sigma in SMEs (small and medium enterprises). TQM J. 2016, 28, 613–635. [Google Scholar] [CrossRef]
  20. Kwak, Y.H.; Anbari, F.T. Benefits, obstacles, and future of six sigma approach. Technovation 2006, 26, 708–715. [Google Scholar] [CrossRef]
  21. Marzagão, D.S.L.; Carvalho, M.M. Critical success factors for six sigma projects. Int. J. Proj. Manag. 2016, 34, 1505–1518. [Google Scholar] [CrossRef]
  22. Ismyrlis, V.; Moschidis, O. Six sigma’s critical success factors and toolbox. Int. J. Lean Six Sigma 2013, 4, 108–117. [Google Scholar] [CrossRef]
  23. Jacobs, B.W.; Swink, M.; Linderman, K. Performance effects of early and late six sigma adoptions. J. Oper. Manag. 2015, 36, 244–257. [Google Scholar] [CrossRef]
  24. Zhang, W.; Xu, X. Six sigma and information systems project management: A revised theoretical model. Proj. Manag. J. 2008, 39, 59–74. [Google Scholar] [CrossRef]
  25. Sabry, A. Factors critical to the success of six-sigma quality program and their influence on performance indicators in some of Lebanese hospitals. Arab Econ. Bus. J. 2014, 9, 93–114. [Google Scholar] [CrossRef]
  26. De Mast, J.; Lokkerbol, J. An analysis of the Six Sigma DMAIC method from the perspective of problem solving. Int. J. Prod. Econ. 2012, 139, 604–614. [Google Scholar] [CrossRef]
  27. Wojtaszak, M.; BiaŁY, W. Problem solving techniques as a part of implementation of six sigma methodology in tire production. Case study. Manag. Syst. Prod. Eng. 2015, 19, 133–137. [Google Scholar]
  28. Arumugam, V.; Antony, J.; Kumar, M. Linking learning and knowledge creation to project success in six sigma projects: An empirical investigation. Int. J. Prod. Econ. 2013, 141, 388–402. [Google Scholar] [CrossRef]
  29. Wang, F.-K.; Yeh, C.-T.; Chu, T.-P. Using the design for six sigma approach with TRIZ for new product development. Comput. Ind. Eng. 2016, 98, 522–530. [Google Scholar] [CrossRef]
  30. Atmaca, E.; Girenes, S.S. Lean Six Sigma methodology and application. Qual. Quant. 2013, 47, 2107–2127. [Google Scholar] [CrossRef]
  31. Fouweather, T.; Coleman, S.; Thomas, A. Six sigma training programmes to help SMEs improve. In Intelligent Production Machines and Systems; Elsevier Science Ltd.: Oxford, UK, 2006; pp. 39–44. [Google Scholar]
  32. Tang, L.C.; Goh, T.N.; Lam, S.W. Fortifying six sigma with OR/MS tools. In Six Sigma; John Wiley & Sons, Ltd.: Chichester, UK, 2006; pp. 49–69. [Google Scholar]
  33. Kavčič, K.; Gošnik, D. Lean Six Sigma education in manufacturing companies: The case of transitioning markets. Kybernetes 2016, 45, 1421–1436. [Google Scholar] [CrossRef]
  34. McCrie, R. 4—training and development for high performance. In Security Operations Management, 3rd ed.; Butterworth-Heinemann: Boston, MA, USA, 2016; pp. 113–143. [Google Scholar]
  35. Swink, M.; Jacobs, B.W. Six sigma adoption: Operating performance impacts and contextual drivers of success. J. Oper. Manag. 2012, 30, 437–453. [Google Scholar] [CrossRef]
  36. Ho, Y.-C.; Chang, O.-C.; Wang, W.-B. An empirical study of key success factors for Six Sigma Green Belt projects at an Asian MRO company. J. Air Trans. Manag. 2008, 14, 263–269. [Google Scholar] [CrossRef]
  37. Cherrafi, A.; Elfezazi, S.; Chiarini, A.; Mokhlis, A.; Benhida, K. The integration of lean manufacturing, six sigma and sustainability: A literature review and future research directions for developing a specific model. J. Clean. Prod. 2016, 139, 828–846. [Google Scholar] [CrossRef]
  38. Kuvvetli, Ü.; Firuzan, A.R.; Alpaykut, S.; Gerger, A. Determining six sigma success factors in turkey by using structural equation modeling. J. Appl. Stat. 2016, 43, 738–753. [Google Scholar] [CrossRef]
  39. Kock, N.; Verville, J.; Danesh-Pajou, A.; DeLuca, D. Communication flow orientation in business process modeling and its effect on redesign success: Results from a field study. Decis. Support Syst. 2009, 46, 562–575. [Google Scholar] [CrossRef]
  40. Saidi-Mehrabad, M.; Paydar, M.M.; Aalaei, A. Production planning and worker training in dynamic manufacturing systems. J. Manuf. Syst. 2013, 32, 308–314. [Google Scholar] [CrossRef]
  41. Ordaz, N.; Romero, D.; Gorecky, D.; Siller, H.R. Serious games and virtual simulator for automotive manufacturing education & training. Procedia Comput. Sci. 2015, 75, 267–274. [Google Scholar]
  42. Chauhan, R.; Ghosh, P.; Rai, A.; Shukla, D. The impact of support at the workplace on transfer of training: A study of an Indian manufacturing unit. Int. J. Train. Dev. 2016, 20, 200–213. [Google Scholar] [CrossRef]
  43. Onimole, S.O.; Zekeri, A. The impact of systematic training approach on the operational performance of manufacturing and engineering industries in southwest zone of Nigeria. IFE PsychologIA 2012, 20, 119–127. [Google Scholar]
  44. Ikegami, K.; Tahara, H.; Yamada, T.; Mafune, K.; Hiro, H.; Nagata, S. Effects of a mental health training program for manufacturing company managers. J. UOEH 2010, 32, 141–153. [Google Scholar] [CrossRef] [PubMed]
  45. Boon Sin, A.; Zailani, S.; Iranmanesh, M.; Ramayah, T. Structural equation modelling on knowledge creation in Six Sigma DMAIC project and its impact on organizational performance. Int. J. Prod. Econ. 2015, 168, 105–117. [Google Scholar] [CrossRef]
  46. Shafer, S.M.; Moeller, S.B. The effects of six sigma on corporate performance: An empirical investigation. J. Oper. Manag. 2012, 30, 521–532. [Google Scholar] [CrossRef]
  47. Ertürk, M.; Tuerdi, M.; Wujiabudula, A. The effects of six sigma approach on business performance: A study of white goods (home appliances) sector in turkey. Procedia Soc. Behav. Sci. 2016, 229, 444–452. [Google Scholar] [CrossRef]
  48. De Freitas, J.G.; Costa, H.G.; Ferraz, F.T. Impacts of Lean Six Sigma over organizational sustainability: A survey study. J. Clean. Prod. 2017, 156, 262–275. [Google Scholar] [CrossRef]
  49. Vinod, M.; Devadasan, S.R.; Sunil, D.T.; Thilak, V.M.M. Six sigma through Poka-Yoke: A navigation through literature arena. Int. J. Adv. Manuf. Technol. 2015, 81, 315–327. [Google Scholar] [CrossRef]
  50. Moosa, K.; Sajid, A. Critical analysis of six sigma implementation. Total Qual. Manag. Bus. Excell. 2010, 21, 745–759. [Google Scholar] [CrossRef]
  51. Boothby, D.; Dufour, A.; Tang, J. Technology adoption, training and productivity performance. Res. Policy 2010, 39, 650–661. [Google Scholar] [CrossRef]
  52. Luxton, S.; Reid, M.; Mavondo, F. Integrated marketing communication capability and brand performance. J. Advert. 2015, 44, 37–46. [Google Scholar] [CrossRef]
  53. Zaumane, I. The internal communication crisis and its impact on an organization’s performance. J. Bus. Manag. 2016, 24–33. [Google Scholar]
  54. Deering, S.; Johnston, L.C.; Colacchio, K. Multidisciplinary teamwork and communication training. Semin. Perinatol. 2011, 35, 89–96. [Google Scholar] [CrossRef] [PubMed]
  55. Yaşlıoğlu, M.M.; Şap, Ö.; Toplu, D. An investigation of the characteristics of learning organizations in Turkish companies: Scale validation. Procedia Soc. Behav. Sci. 2014, 150, 726–734. [Google Scholar] [CrossRef]
  56. Garcia-Alcaraz, J.L.; Maldonado-Macias, A.A.; Hernandez-Arellano, J.L.; Blanco-Fernandez, J.; Jimenez-Macias, E.; Saenz-Diez Muro, J.C. The impact of human resources on the agility, flexibility and performance of wine supply chains. Agric. Econ. 2017, 63, 175–184. [Google Scholar]
  57. Nunnally, J. Psychometric methods; McGraw-Hill: New York, NY, USA, 1978. [Google Scholar]
  58. Garcia-Alcaraz, J.L.; Maldonado-Macias, A.A.; Alor-Hernandez, G.; Sanchez-Ramirez, C. The impact of information and communication technologies (ICT) on agility, operating, and economical performance of supply chain. Adv. Prod. Eng. Manag. 2017, 12, 29–40. [Google Scholar] [CrossRef]
  59. García-Alcaraz, J.L.; Adarme-Jaimes, W.; Blanco-Fernández, J. Impact of human resources on wine supply chain flexibility, quality, and economic performance. Ing. Investig. 2016, 36, 74–81. [Google Scholar] [CrossRef]
  60. Hair, J.F.; Black, W.C.; Babin, B.J.; Anderson, R.E. Multivariate Data Analysis; Prentice Hall: Upper Saddle River, NJ, USA, 2009. [Google Scholar]
  61. Nitzl, C. The use of partial least squares structural equation modelling (PLS-SEM) in management accounting research: Directions for future theory development. J. Acc. Lit. 2016, 37, 19–35. [Google Scholar] [CrossRef]
  62. Kock, N. Using warppls in e-collaboration studies: Mediating effects, control and second order variables, and algorithm choices. Int. J. e-Collab. 2011, 7, 1–13. [Google Scholar] [CrossRef]
  63. Kock, N. Single Missing Data Imputation in PLS-SEM; ScriptWarp Systems: Laredo, TX, USA, 2014. [Google Scholar]
  64. Hayes, A.F.; Preacher, K.J. Quantifying and testing indirect effects in simple mediation models when the constituent paths are nonlinear. Multivar. Behav. Res. 2010, 45, 627–660. [Google Scholar] [CrossRef] [PubMed]
  65. Antony, J.; Krishan, N.; Cullen, D.; Kumar, M. Lean six sigma for higher education institutions (HEIS): Challenges, barriers, success factors, tools/techniques. Int. J. Product. Perform. Manag. 2012, 61, 940–948. [Google Scholar] [CrossRef]
  66. Lodgaard, E.; Ingvaldsen, J.A.; Gamme, I.; Aschehoug, S. Barriers to lean implementation: Perceptions of top managers, middle managers and workers. Procedia CIRP 2016, 57, 595–600. [Google Scholar] [CrossRef]
  67. Yamada, T.T.; Poltronieri, C.F.; Gambi, L.D.N.; Gerolamo, M.C. Why does the implementation of quality management practices fail? A qualitative study of barriers in Brazilian companies. Procedia Soc. Behav. Sci. 2013, 81, 366–370. [Google Scholar] [CrossRef] [Green Version]
  68. Laux, C.; Li, N.; Seliger, C.; Springer, J. Impacting big data analytics in higher education through six sigma techniques. Int. J. Product. Perform. Manag. 2017, 66, 662–679. [Google Scholar] [CrossRef]
  69. Coronado, R.B.; Antony, F. Critical success factors for the successful implementation of six sigma projects in organisations. TQM Mag. 2002, 14, 92–99. [Google Scholar] [CrossRef]
  70. Harrison, A. Chapter 13—An application of six sigma in human resources. In World Class Applications of Six Sigma; Butterworth-Heinemann: Oxford, UK, 2006; pp. 224–238. [Google Scholar]
Figure 1. Proposal model.
Sustainability 09 01721 g001
Figure 2. Evaluated model.
Sustainability 09 01721 g002
Table 1. Indexes for model validation.
IndexAcceptable IfDescription
Average Path Coefficient (APC)p-value < 0.05Hypotheses significance
Average R-Squared (ARS)p-value < 0.05Predictive model validity
Average Adjusted R-Squared (AARS)p-value < 0.05Predictive model validity
Average block Variance Inflation Factor (AVIF)<3.3Collinearity among latent variables
Average Full collinearity VIF (AFVIF)<3.3Collinearity among latent variables
Tenenhaus Goodness of Fit (GoF)>0.36Data fit to model
Simpson’s Paradox Ratio (SPR)>0.7Direction in relationship
R-Squared Contribution Ratio (RSCR)>0.7Direction in relationship
Statistical Suppression Ratio (SSR)>0.7Direction in relationship
Nonlinear Bivariate Causality Direction Ratio (NLBCDR)>0.7Direction in relationship
Table 2. Industrial sector and years of experience.
Industrial SectorYears or Experience on SSTotal
2–32–44–55–10>10
Automotive4948412716181
Electric13465533
Machining87103230
Electronic9371222
Medical1642316
Aeronautic202127
Total8268703930289
Table 3. Measures of central tendency and dispersion.
Latent VariableObserved Variables (Items)PercentileIR
255075
InformationRules for information protection and confidentiality2.8933.8114.6581.766
Protection of information obtained from SS projects2.7373.6594.5211.784
Access to other company departments when information is not available in one of them.2.6843.6594.5451.861
Relevant information found in the company’s data bases2.5383.5064.4261.889
Easy access to information2.3533.3114.2701.917
Statistical techniquesUse of graphs and statistics3.0223.9564.7501.728
Use of root cause analysis tools2.8383.7764.6241.786
Problem identification through statistical tools2.7743.6934.5561.782
Use of specialized software2.6023.6544.5701.968
Use of the DMAIC technique2.6703.6514.5431.874
Didactic materialDMs and BBs instructions are understandable2.9373.7174.5281.591
DMs contribute to a better understanding of how SS works and is used2.6763.6674.5261.850
DMs help execute an SS project2.7183.6594.5401.821
DMs are useful in other SS projects2.7543.6424.4971.743
BBs appropriately explain the objective of the DM2.6693.6294.5121.843
CommunicationThe BB and GB provide support in measuring variables and obtaining information2.6263.6394.5331.907
Work teams share their experience among them2.6293.6354.5401.911
Group members talk about their problems with an SS project2.6623.5924.4591.797
BBs, GBs, and project leaders organize meetings and reunions2.5643.5724.4811.917
Group members inform of their progress to their peers2.5443.5524.4871.943
Operational benefitsQuality or service perceived by customers3.1394.1124.8461.708
Cycle time reduction3.1404.0104.7631.622
Waste reduction3.0853.9884.7341.648
World-class standards3.0693.9644.7421.673
Increased employee performance3.0443.9184.7211.677
Increased teamwork3.0093.8884.7041.695
Multifunctional employees2.7973.8364.7161.918
Table 4. Validation for latent variables.
IndexLatent Variable
Didactic MaterialStatistical TechniquesCommunicationOperational BenefitsInformation
R-squared0.6520.5530.6360.603
Adjusted R-squared0.650.5520.6320.597
Composite reliability0.9130.9150.9470.9250.905
Cronbach´s alpha0.8720.8830.930.9060.869
Average variance extracted0.7230.6830.7810.6390.657
Full collinearity variance inflation factor3.2613.1092.9732.4912.868
Q-squared0.6530.5520.6350.606
Table 5. Conclusions about hypotheses.
HypothesisILVDLVβp-ValueConclusion
H1InformationStatistical techniques0.744<0.01Accepted
H2InformationDidactic material0.355<0.01Accepted
H3Statistical techniquesDidactic material0.507<0.01Accepted
H4InformationCommunication0.330<0.01Accepted
H5Statistical techniquesCommunication0.236<0.01Accepted
H6Didactic materialCommunication0.306<0.01Accepted
H7InformationOperational benefits0.0610.145Rejected
H8Statistical techniquesOperational benefits0.211<0.01Accepted
H9Didactic materialOperational benefits0.240<0.01Accepted
H10CommunicationOperational benefits0.347<0.01Accepted
Table 6. R-squared contribution to dependent latent variable.
ToFromR2
Didactic MaterialStatistical TechniquesCommunicationInformation
Didactic material 0.392 0.2610.653
Statistical techniques 0.5530.553
Communication0.2240.17 0.2420.636
Operational benefits0.1680.1460.2490.0390.602
Table 7. Sum of indirect effects.
ToFrom
Didactic MaterialStatistical TechniquesInformation
Didactic material 0.377 (p < 0.001), ES = 0.277
Communication 0.155 (p < 0.001), ES = 0.1120.399 (p < 0.001), ES = 0.293
Operational benefits0.106 (p = 004), ES = 0.0740.257 (p < 0.001), ES = 0.1780.585 (p < 0.001), ES = 0.351
Table 8. Sum of total effects.
ToFrom
Didactic MaterialStatistical TechniquesCommunicationInformation
Didactic material 0.507 (p < 0.001) ES = 0.392 0.732 (p < 0.001) ES = 0.538
Statistical techniques 0.744 (p < 0.001) ES = 0.553
Communication0.306 (p < 0.001) ES = 0.2240.391 (p < 0.001) ES = 0.282 0.729 (p < 0.001) ES = 0.535
Operational benefits0.346 (p < 0.001) ES = 0.2430.468 (p < 0.001) ES = 0.3240.347 (p < 0.001) ES = 0.2490.646 (p < 0.001) ES = 0.421

