Designing Sustainable Cold Chains for Long-Range Food Distribution: Energy-Effective Corridors on the Silk Road Belt


1
Department of Industrial Engineering, Alma Mater Studiorum, University of Bologna, Viale Risorgimento, 2, 40132 Bologna, Italy
2
Department of Management and Engineering, University of Padova, Stradella S. Nicola, 3, 36100 Vicenza, Italy
*
Author to whom correspondence should be addressed.
Sustainability 2017, 9(11), 2044; https://doi.org/10.3390/su9112044
Submission received: 1 October 2017
/
Revised: 27 October 2017
/
Accepted: 1 November 2017
/
Published: 8 November 2017
(This article belongs to the Special Issue Sustainability in Food Supply Chain and Food Industry)
Abstract
:Modern food production-distribution processes represent a critical stressor for the environment and for natural ecosystems. The rising flows of food across growing and consumption areas couple with the higher expectations of consumers for the quality of products and compel the intensive use of refrigerated rooms and transport means throughout the food supply chain. In order to aid the design of sustainable cold chains that incorporate such aspects, this paper proposes a mixed integer linear programming model to minimize the total energy consumption associated with the cold operations experienced by perishable products. This model is intended for food traders, logistics practitioners, retail managers, and importers collaboratively called to design and plan a cost and environmentally effective supply strategy, physical channels, and infrastructures for cold chains. The proposed model is validated with a case study inspired by the distribution of two example food products, namely fresh apples and ice cream, along the New Silk Road connecting Europe and China. The illustrated analysis investigates the effect of alternative routes and transport modes on the sustainability of the cold chain. It is found that the most energy-efficient route for ice cream is via rail over a northern route and, for apples, is via a southern maritime route, and, for these two routes, the ratios of the total energy consumed to the energy content of the food are 760 and 913, respectively. By incorporating the energy lost due to the food quality decay, the model identifies the optimal route to adopt in accordance with the shelf life and the conservation temperature of each product.
1. Introduction
Modern food production-distribution processes represent a critical stressor for the environment and for natural ecosystems [1]. In addition to the acknowledged environmental issues associated with the main food supply chain phases (i.e., packaging, processing, storage, transportation, waste management) [2,3], the distribution of perishable products requires further refrigeration during both storage and transportation to prevent product spoilage and losses [4]. Overall 15% of the world’s energy production is used to power cold chains and cooling systems [5], which still depend on fossil fuels. The rising flows of food across growing and consumption areas couple with the higher expectations of consumers for the quality of products and compel the intensive use of refrigerated rooms and transport means throughout the food supply chain [6]. For example, the supply of food throughout retail chains accounts for approximately one third of the UK’s total Greenhouse Gas (GHG) emissions, with transport estimated to account for 1.8% of the total emissions [7]. Since global road freight transport is expected to keep growing in the future [8], implementing a new systemic approach to designing sustainable cold chains is mandatory.
The increasing complexity of food supply chains and their attempt to match seasonal food production to a global demand has encouraged the adoption of more systemic planning [9,10]. Operations planning in food supply chains contributed undoubtedly to reducing the total costs but has neglected the associated environmental impacts. The adoption of integrated planning driven by sustainability purposes could lead to a reduction in the GHG emissions associated with cold storage and transport [11]. In the past, the availability of low-cost energy sustained the design of less efficient cold chains mostly powered by fossil fuels. For this reason, food supply chains are often built as inefficient transformation systems, which consume more energy than they provide (e.g., as nutritional value). A way to improve such efficiency is to reduce food losses and waste, which would result in reducing the unit consumption of energy per delivered product. Conversely, as a food product is wasted, it does not supply energy as nutritional value to the consumer.
In order to aid the design of sustainable cold chains that incorporate such aspects, this paper proposes a mixed integer linear programming (MILP) model to minimize the total energy consumption associated with the cold operations experienced by perishable products. The energy consumption calculation includes harvesting, production, packaging, storage, and transport activities. This model is intended for food traders, logistics practitioners, retail managers, and importers collaboratively called to design and plan a cost and environmentally effective supply strategy, physical channels, and infrastructures for cold chains [12].
The proposed model is validated with a case study inspired by the distribution of food products along the New Silk Road connecting Europe and the Far East (i.e., China). The illustrated analysis investigates the effect of alternative routes and transport modes on the sustainability of the cold chain. This is measured through a properly defined performance index of sustainability. The selected case study is intended to assess the impact of an energy-driven optimization model on the design of global trans-national cold chains that are characterized by long distances and different climatic conditions and stresses or that incur the risk of product spoilage [13] during transportation.
2. Literature Review
Nowadays, the increasing complexity of the physical connections along food supply chains boosts the adoption of holistic and quantitative methodologies and tools by the Supply Chain Management (SCM), which attracts researchers and practitioners [14,15]. These approaches aim to manage the flow of materials throughout the network via data-driven planning and optimization [16,17]. In the food sector, the recent trend in SCM focuses on reaching a global optimum that incorporates actors and stakeholders [18], as well as economic, environmental, and social sustainability goals [19].
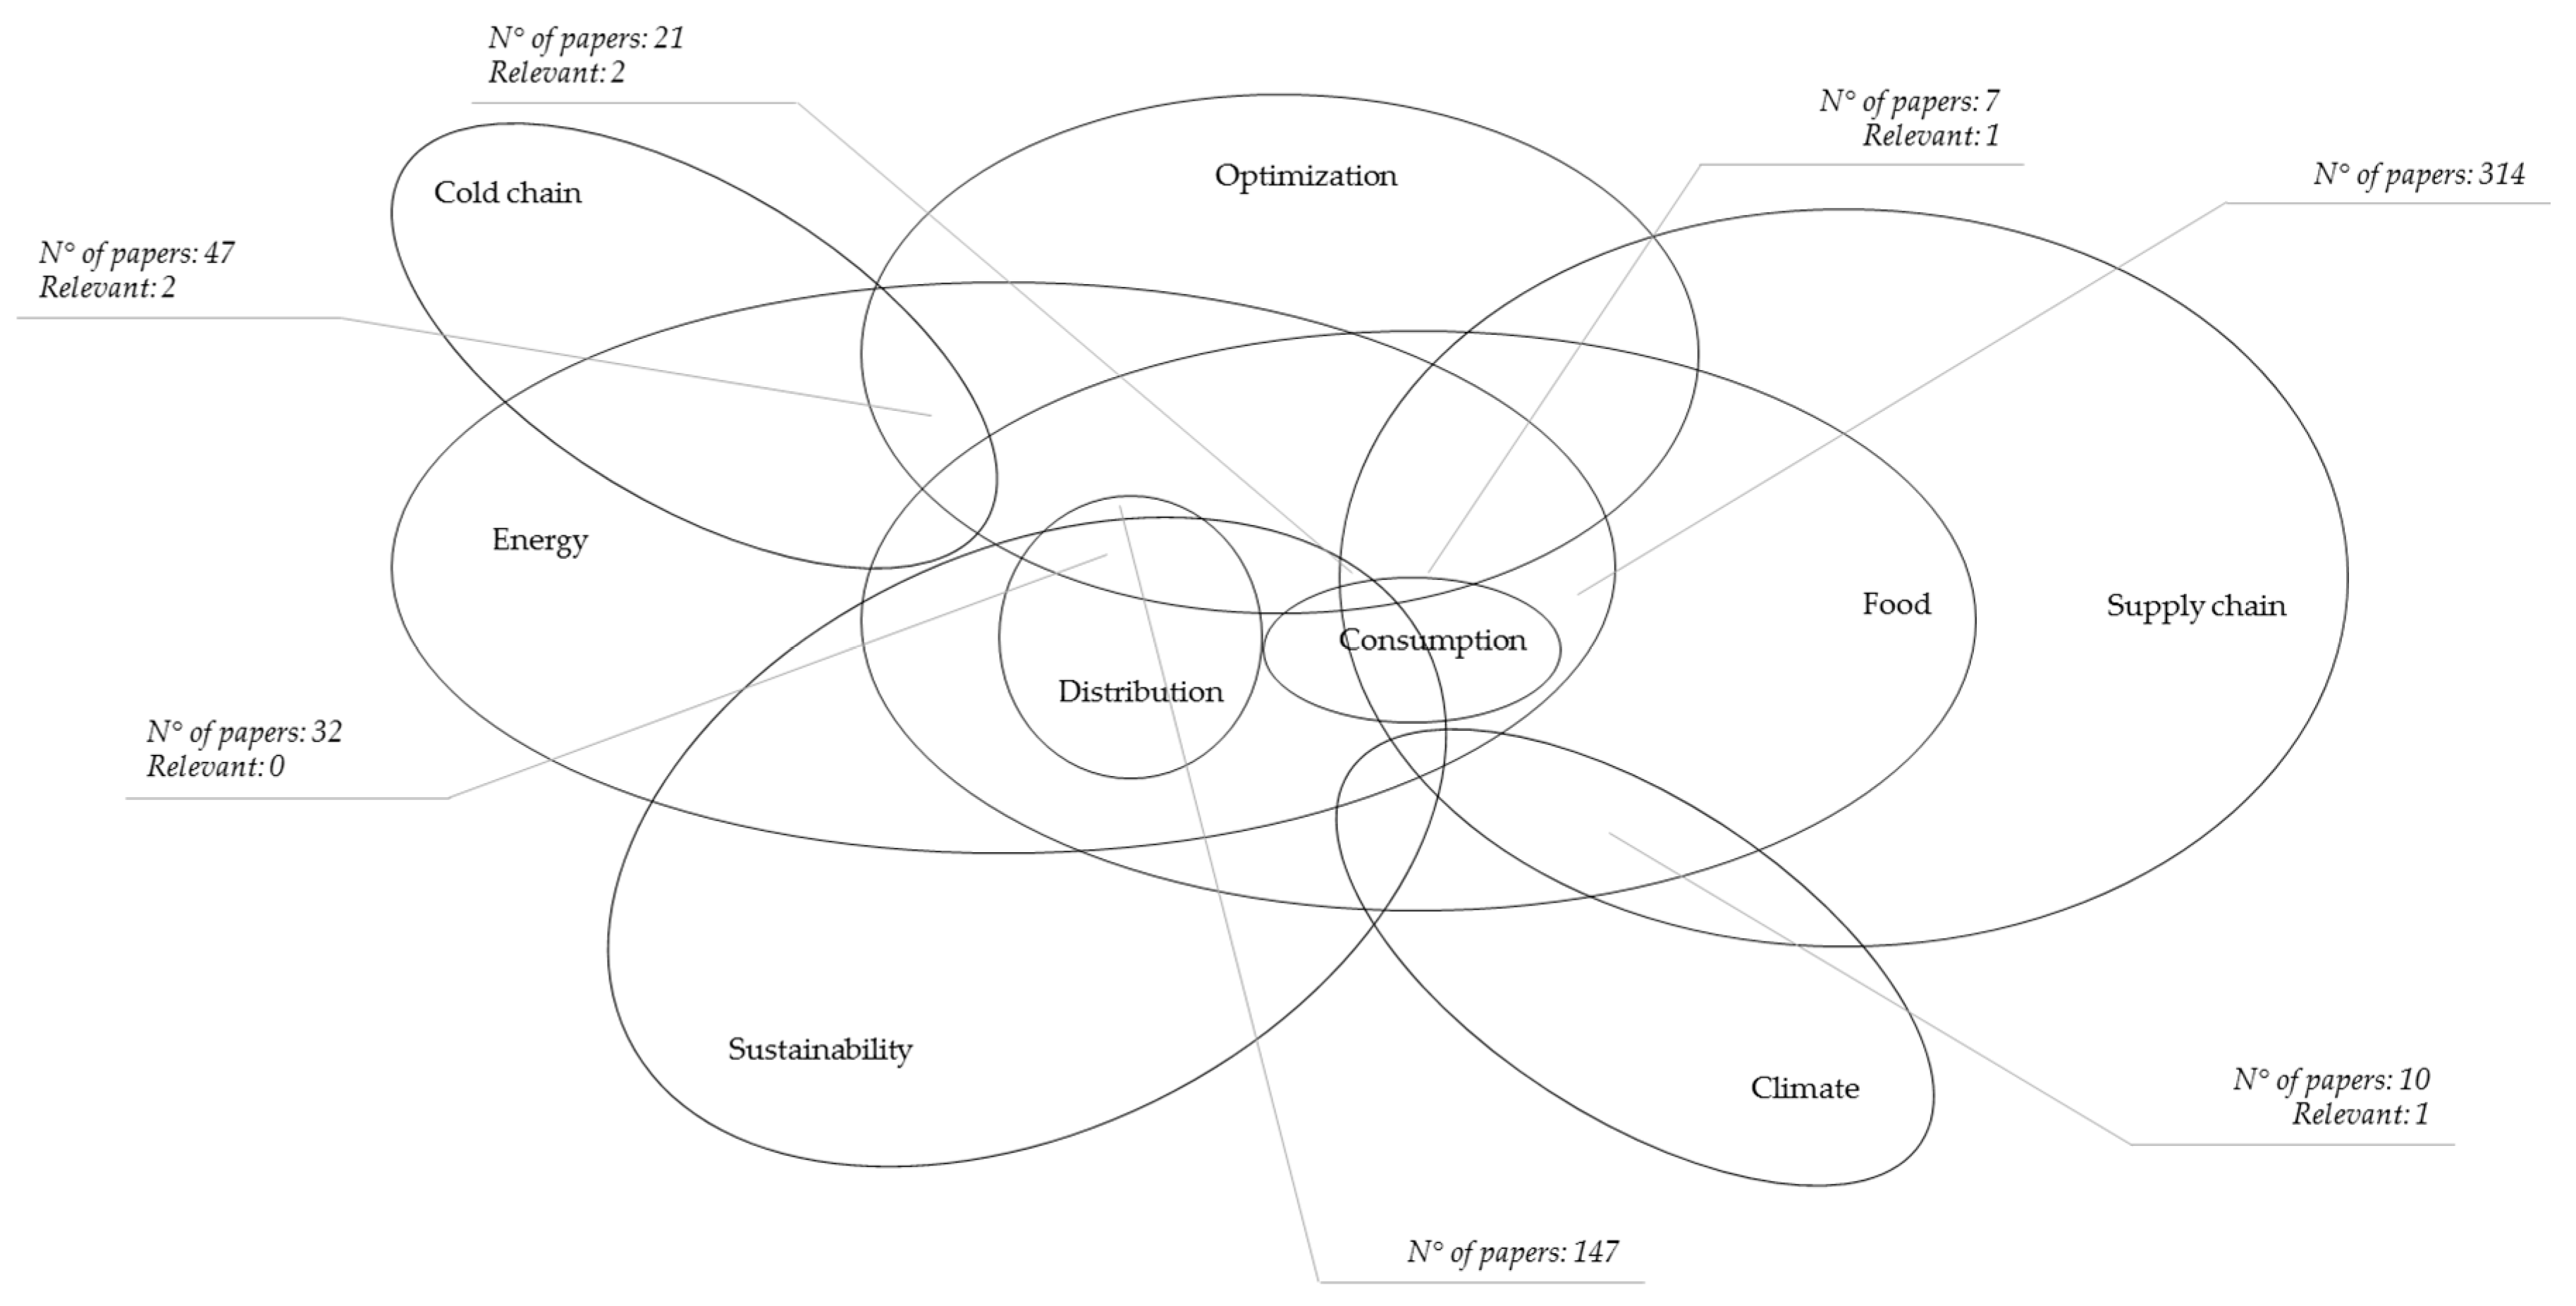
In the last years, an increasing number of papers have been provided on the optimization of food supply chain operations. In order to benchmark the proposed model, a search for keywords on Web-of-Science in the period from 2000 to 2018 has been conducted. Figure 1 illustrates the results, highlighting the intersections between the topics ‘optimization’, ‘supply chain’, ‘food’, and ‘energy’. Figure 1 reveals few relevant contributions addressing these aspects jointly. Furthermore, the systemic literature analysis outlines the lack of decision-support tools able to embrace the optimization of the whole food supply chain, rather than focusing on a specific stage and process (i.e., storage, delivery). The main relevant contributions are cited and described in the following in order to benchmark our proposal.
The adoption of mathematical models to support the design and management of the different phases of food supply chains is widely diffused in the literature [20,21]. Bosona et al. [22] provide a hybrid approach to design integrated logistic networks, creating clusters of nodes to supply local food and enhance its traceability. According to their approach, once the optimal location for each cluster is set, each cluster is allocated to a retailer’s depot. Then the optimal routes for each delivery are calculated and provided. Amorim and Almada-Lobo [23] formulate a multi-objective vehicle routing problem (VRP) with time windows to reduce the distribution costs while ensuring the highest freshness of the delivered food. Song and Ko [24] provide a nonlinear formulation of the VRP to design optimal routes for both refrigerated and standard vehicles and to preserve the freshness of the delivered food. Wang et al. [25] solve the VRP with time windows for cold chain deliveries in the presence of carbon tax constraints, which reflect the government’s efforts to control the GHG emissions associated with food distribution.
The increasing awareness of the environmental impacts associated with the food industry pushed researchers belonging to different disciplines (e.g., agriculture, economics, engineering) to study and formulate models, methods, tools, and technical pathways able to enhance the economic and environmental sustainability of the food ecosystem as a whole. The combination of environmental care strategies and the SCM practices in the food industry lead to the development of models that include the environmental issue in the planning objectives. Pipatprapa et al. [26] assess the key performances to measure the environmental sustainability of Thailand’s food supply chains through structural equation modeling and a fuzzy analytic hierarchy approach. Validi et al. [27] propose a multi objective model for the minimization of both the GHG emissions and cost associated with food distribution in an Irish supply chain. Yang et al. [28] explore quantitative green supply chain management methods and associated marketing strategies based on the temperature control of the distribution operations for perishable products. Accorsi et al. [29] develop a decision-support model to design carbon balanced agro-food supply chains through the optimal location of network nodes, carbon plantings, and renewable energy power systems. Savino et al. [30] illustrate a framework to evaluate sustainability improvements and the resulting economic impacts through a value chain approach. They validate this approach with a carbon footprint analysis of a fresh chestnut supply chain. Gwanpua et al. [31] design a tool for the optimization of the trade-off between food quality, energy use, and global warming impacts associated with a retail cold chain. This tool assesses the impact of alternative technologies, plants, and cold rooms on the overall energy costs and the quality of the supplied perishable products. Vanek and Sun [32] introduce an optimization model to explore the trade-off between the energy consumption for food distribution activities and the loss of energy in terms of nutritional values resulting from food spoilage. Their model is used to compare and assess the adoption of faster or slower transport modes from a twofold perspective, which looks at the energy efficiency and the food losses. Bortolini et al. [33] illustrate a three-objective tactical optimization problem to establish the thresholds of adoption for different transport modes in the distribution of fresh food products according to cost, carbon, and delivery time objective functions. Rong et al. [34] manage perishable food production and distribution planning through a MILP model that controls the food quality decay. De Keizer et al. [35] formulate a MILP model for the distribution of fresh food under quality and perishability constraints, which is aimed at determining the optimal positioning of stocks and the order decoupling point throughout the supply chain. Saif and Elhedhli [36] provide and solve a bi-objective inventory-location model aimed at identifying the trade-off between the distribution and inventory costs and the GHG emissions caused by the refrigerants in a cold chain. Accorsi et al. [37] give an original formulation of the scheduling-routing problem to minimize the overall operational cost of a cold chain. These include the costs for food storage, transport, and refrigeration, which are sensibly affected by the experienced environmental conditions. They demonstrate how the climate conditions influence the optimal solution, and climate-driven optimization of the food delivery process is recommended.
This paper extends the aforementioned research by providing an operational MILP model for the optimization of the energy consumption incurred during the production, storage, and distribution stages of a cold chain. The proposed model incorporates the climate conditions experienced along each route and by each transport vehicle with the purpose to increase the energy efficiency of the whole production-distribution cold chain and, consequently, its environmental sustainability. Compared to Rong et al. [34] and de Keizer et al. [35], who formulate the decrease in quality as influenced by the lead time at a certain conservation temperature, the model proposed in this paper incorporates the climate conditions experienced on each route and quantifies the product quality decay accordingly. Compared to Accorsi et al. [37], this paper (1) includes the agriculture-farming stage in the designed food value chain; (2) optimizes an energy-based function; and (3) addresses a different research question, that is, how to sustainably distribute different fresh products throughout a long-ray cold chain.
The remainder of this paper is organized as follows. Section 3 illustrates the cold-chain decision-support operational MILP model. Section 4 illustrates the application of the proposed model to a case study inspired by the long-rail cold chain developed upon the New Silk Road that connects Europe and the Far East’s countries. Lastly, Section 5 summarizes the conclusions and suggests opportunities for further research developments.
3. A Cold Chain Design-Support Model
This section introduces a MILP model for the optimization of the overall energy consumption experienced throughout all the stages of a food supply chain. The energy contributions to be minimized include those for food processing/packaging, storage and refrigeration, and transport. A preliminary approach to formulate and solve this problem has been treated by the authors in a recent working paper [38]. That formulation has been evolved by introducing new continuous and integer variables that allow intra-stage connections (necessary to consider multi-modal transportation) and by calculating the energy consumption for refrigeration at each node and arc of the network on the basis of the external climatic conditions, which vary with the season and the region. Reasonably, such variances increase with the range of the cold chain and the overall distances between the growing and the consumption areas.
3.1. Environmental Sustainability Assessment in Cold Chains
According to Conforti and Giampietro [39], in terms of energy, a food supply chain is sustainable when it does not consume more energy than it supplies as the nutritional value of the delivered food products. In view of this, we assume the ratio between the energy supplied and the energy consumed for the production and distribution of a food product throughout the cold chain as a performance indicator of its environmental sustainability. This metric is also known as the index of sustainability (IS) [40], which is defined as follows:
In Equation (1), Econsumed accounts for the overall energy consumed from the food growth to its consumption and Esupplied represents its energy content. The supplied energy is represented by the food energy value, generally expressed in kcal/gr, which is different to the energy required to power the growing and harvesting phases, processing and transformation, packaging, storage, and distribution to the consumers. While the decisions about cold chain operations do not influence the food energy value, they affect significantly the energy consumed from farm to table.
In order to aid and support the operations management in cold chains and the design of sustainable cold chain infrastructures, a MILP model, aimed to minimize the total energy consumed along the network, is thus defined. The obtained solutions identify the benchmark for a sustainable cold chain configuration and support strategic, tactical, and operational planning of the infrastructures to be established (e.g., where to locate a cold warehouse) and the routes to be chosen season by season, rather than the transport mode to be adopted for each product. This model enhances the environmental sustainability of a cold food supply chain by reducing the energy consumption and the associated GHG emissions. Nevertheless, since the objective function accounts for the total cold chain energy consumption, the cost of energy allows us to immediately turn the environmental aspects into economic concerns.
3.2. Cold Chain Network Configuration
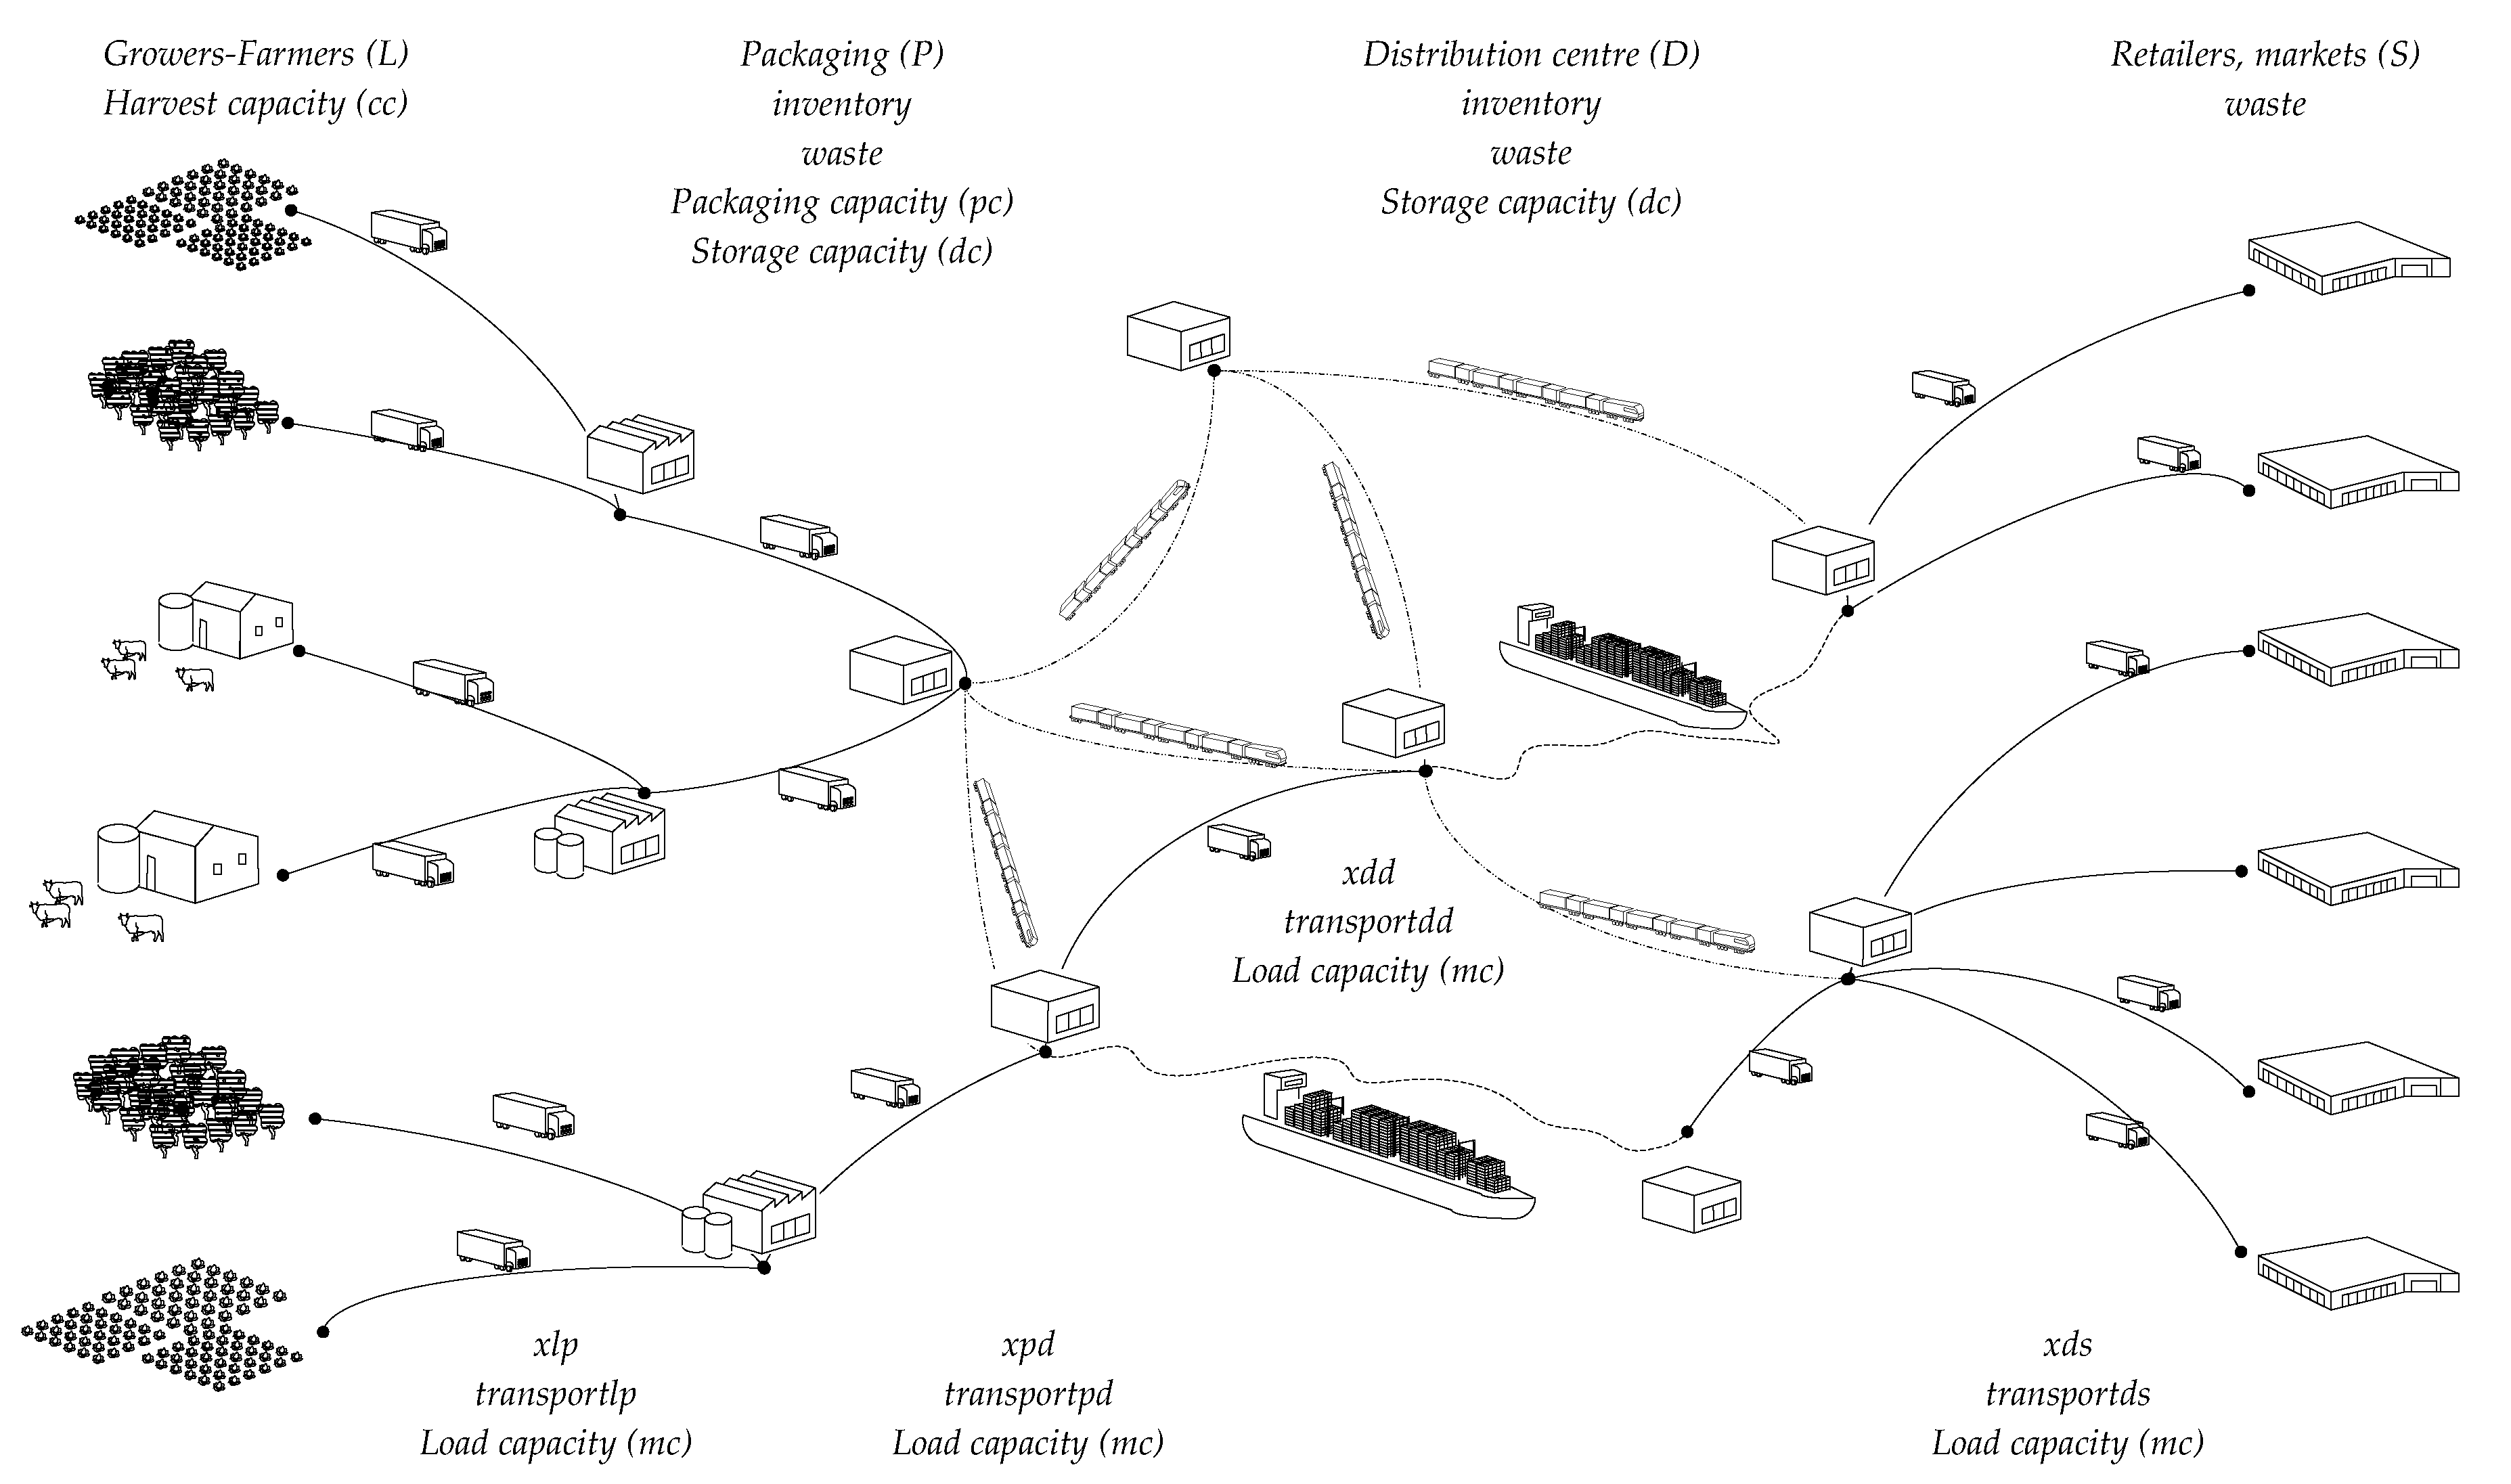
The model involves four supply chain stages:
- the Growers that supply raw food ready for transformation (i.e., crops, orchards, farms);
- the Processing/Packaging nodes, which represent the plants where the raw products are transformed and packed, making them ready for distribution;
- the Storage/Consolidation nodes are where products are conserved, stored, and consolidated before and during distribution. Given the short shelf lives of perishable products, they pause in the distribution pipeline as briefly as possible, although they it is still necessary to balance the offer and demand mismatch or to perform multi-modal transport;
- the Demand nodes, where the food products meet the consumers. These include grocery shops, retail depots, wholesalers, or canteens. These nodes are usually located within high-density populated areas.
Figure 2 shows the network configuration considered in the model formulation.
The solution obtained by the optimization of the model provides:
- The quantity of each product that must be harvested/processed/packaged/stored at each node;
- The proper transportation mode to adopt for each connection, route, and stage of the cold chain;
- The temperature set-point for each vehicle and at each storage node, given the products stored and the external expected climatic conditions;
- The production, processing, and delivery schedule for each product in order to meet the demand from the retailers.
- These results need to be interpreted in view of the planning horizon and the considered granularity of the periods (e.g., a day).
3.3. Energy Consumption Calculation
The overall energy consumption calculated in the objective function includes the following contributions:
- the energy to move products throughout the logistic network. This depends on the traveling distance, on the transportation mode, and the type of the vehicle. Transport inter-modality is allowed in the model. The considered flows are illustrated in Figure 1;
- the energy to maintain vehicles and warehouses at the chosen temperature set-point. The closer the set-point is to the external temperature, the lower the energy consumption for refrigeration will be. However, the temperature set-point should respect the safe temperature range of the food products to avoid spoilage and quality decay;
- the energy required by crops and farms to process and package the products and to handle the products at the storage nodes (which is often negligible);
- the energy associated with food losses, which occur when a product’s quality decay is below the acceptance threshold. The quality decay of a product depends on the amount of time spent in the cold chain and the experienced environmental stresses (e.g., temperature rise). The minimum level of quality accepted at each stage determines the resulting flow of losses (i.e., those products that expire and are not accepted).
3.4. Model Formulation
The definitions of the parameters, sets of indices, and decision variables included in the following objective function and constraints are given as follows:
| Index sets | |
| i = 1, …, I | Set of products |
| q = 1, …, qmax | Set of quality levels |
| k = 1, …, K | Set of temperatures |
| l = 1, …, L | Set of growers |
| p = 1, …, P | Set of packaging nodes |
| d = 1, …, D | Set of storage nodes |
| s = 1, …, S | Set of retailer nodes |
| m = 1, …, M | Set of vehicles and transportation modes |
| t = 1, …, T | Set of periods |
| Cluster of packaging, storage, and demand nodes | |
| Cluster of packaging and storage nodes | |
| Input parameters | |
| demandi,s,t | Demand of product i by the retailer s at period t, (units). |
| cci,l,t | Harvest of crop i from grower l at period t, (units). |
| pci,p,t | Packaging capacity of product i by packaging node p at period t, [units]. |
| dcpd | Storage capacity at packaging node p and storage node d, (units). |
| Transport capacity of transport mode m, (kg/vehicle). | |
| weighti | Weight of handling unit of product i, |
| cei,l | Energy needed to crop one unit of product i by grower l, |
| pei,p | Energy required by packaging node p to process one handling unit of product i, |
| storageei,pd | Energy required to store one handling unit of product i at packaging node p and storage node d, |
| Energy required by transport mode m, | |
| qmini,pds | Minimum quality level accepted for product i at packaging node p, storage node d, and retailer s. |
| wei | Energy losses for product i decay (i.e., waste), |
| coolemlpk,m,l,p | Energy requirements to set the transport mode m at temperature k to move from the grower l to the packaging node p, . |
| coolempdk,m,p,d | Energy requirements to set the transport mode m at temperature k to move from the packaging node p to the storage node d, . |
| coolemddk,m,d,d′ | Energy requirements to set the transport mode m at temperature k to move from the storage node d to the storage node d′, . |
| coolemdsk,m,d,s | Energy requirements to set the transport mode m at temperature k to move from the storage node d to the retailer s, . |
| coolepdk,pd | Energy requirements to set the facility temperature at k for both the packaging node p and the storage node d, |
| timelpm,l,p | Lead time to move products from the grower l to the packaging node p with the transportation mode m, |
| timepdm,p,d | Lead time to move products from the packaging node p to the storage node d with the transportation mode m, |
| timeddm,d,d′ | Lead time to move products from the storage node d to the storage node d′ with the transportation mode m, |
| timedsm,d,s | Lead time to move products from the storage node d to the retailer s with the transportation mode m, |
| distlpl,p | Travelling distance from the grower l to the packaging node p, . |
| distpdp,d | Routing distance from the packaging node p to the storage node d, . |
| distddd,d′ | Routing distance from the storage node d to the storage node d′, . |
| distdsd,s | Routing distance from the storage node d to the retailer s, . |
| varqpdi,k,pd | Degradation of the quality level of product i stored at packaging node p or storage node d at temperature k. |
| varqmlpi,k,m,l,p | Degradation of the quality level of product i transported by the transport mode m from the grower l to the packaging node p at temperature k. |
| varqmpdi,k,m,p,d | Degradation of the quality level of product i transported by the transport mode m from the packaging node p to the storage node d at temperature k. |
| varqmddi,k,m,d,d | Degradation of the quality level of product i transported by the transport mode m from the storage node d to the storage node d′ at temperature k |
| varqmdsi,k,m,d,s | Degradation of the quality level of product i transported by the transport mode m from the storage node d to the retailer s at temperature k. |
| Decision variables | |
| inventoryi,q,k,pd,t | Stock of product i stored within packaging node p or storage node d at temperature k and quality level q at period t, (units). |
| transportlpk,m,l,p,t | Number of transport vehicles m at temperature k used to move products from the grower l to the packaging node p at period t, (units). |
| transportpdk,m,p,d,t | Number of transport vehicles m at temperature k used to move products from the packaging node p to the storage node d at period t, (vehicles). |
| Number of transport vehicles m at temperature k used to move products from the storage node d to the storage node d′ at period t, (vehicles). | |
| transportdsk,m,d,s,t | Number of transport vehicles m at temperature k used to move products from the storage node d to the retailer s at period t, (vehicles). |
| xlpi,q,k,m,l,p,t | Flow of product i transported by vehicles m from the grower l to the packaging node p at quality q and temperature k at period t, . |
| xpdi,q,k,m,p,d,t | Flow of product i transported by vehicles m from the packaging node p to the storage node d at quality q and temperature k at period t, . |
| Flow of product i transported by vehicles m from the storage node d to the storage node d′ at quality q and temperature k at period t, . | |
| xdsi,q,k,m,d,s,t | Flow of product i transported by vehicles m from the storage node d to the retailer s at quality q and temperature k at period t, . |
| wastei,pds,t | Flow of expired/decayed product i at period t at any supply chain node, (units) |
The objective function (2) minimizes the overall energy consumed across the cold chain from the growers to the consumers. The contributions from Equations (2a)–(2d) account for the energy consumed by the transport activities as the sum of the energy required by the transport mode plus the energy required to maintain the temperature set-point k multiplied by the number of means required. The second set accounts for the energy consumptions due to agriculture in Equation (2e), packaging in Equation (2f), and storage stages in Equation (2g). The energy required to power the cold rooms at the processing and storage nodes is also considered in Equation (2h). Lastly, the energy contribution associated with the expired products is quantified in Equation (2i).
Subjected to:
Constraints (3) and (4) balance the stock of product i at quality level q stored in the packaging nodes p and in the storage nodes d with temperature k and period t. The inventory at period t equals the inventory level at period t − 1 with a quality level of q + varqpd, plus the incoming flows minus the outgoing flows. Constraint (5) enforces that the demand of product i at the retailer s must be satisfied within the due period t. Constraints (6)–(9) guarantee the observation of, respectively, the harvest capacity of growers, the packaging capacities at processing nodes, the storage capacity at packaging facilities, and the storage capacity at warehouses. Constraints (10) and (11) ensure that the flows balanced across the supply chain stages. Constraints (12) and (13) account for the waste of product i at period t due to expiration or decay across the supply chain. Constraints (14)–(17) account for the minimum integer number of means of transport mode m necessary to ship products across the supply chain stages. Constraint (18) imposes that the temperature of the inventory in packaging node p and in storage node d at period t is equal to the temperature set point defined by Constraint (19). Constraints (19) sets a single set-point temperature at packaging node p and at storage node d during period t. Lastly, Constraints (20)–(30) are a mix of non-negativity, integer, or binary restrictions on the decision variables.
4. A Case of Long-Ray Cold Chain Design: The New Silk Road Belt
In this section, the proposed MILP model is validated through a case study of a long-range cold chain inspired by the initiative of the Chinese Government to foster the creation of the New Silk Road. As claimed by the Chinese president during his speech at Nazarbayev University in 2013 [41], the Chinese project is to build a network of transport infrastructures such as railways, highways, and power and water grids that enables economic development along the ancient Silk Road. A second goal of the Chinese Government is to further develop the maritime routes that connect Far East countries with Europe [42]. Both projects aim to significantly reduce travelling distances and time for freight transportation, enabling faster and safer routes between Europe and Asia, crossing 65 countries and touching about 63% of the world’s population. In ancient times, the Silk Road was a commercial trade channel stretching along the Eurasian regions connecting China and India with the Mediterranean area. Its name origination from the trade of silk and other precious goods (e.g., spices) transported along that pathway during the Han dynasty in the Second Century BC. For centuries, the Silk Road has been the major communication link between East and West, enabling the integration of different cultures, and has played a crucial role in the development of civilization along its pathways [43].
Nowadays, the new Silk Road will be built along new railways, roadways, and maritime transport corridors. This logistics network requires the establishment of multi-modality transport infrastructures [44] and associated transit and consolidation depots for any sort of freight, which, together, would aid the development of new cities and urban areas. Furthermore, the availability of primary resources as water and energy to power and fuel this network should be guaranteed. Water scarcity already limits urban growth along the existing Eurasian distribution channels [45]. Similarly, the need for energy affects the design of new transport and storage infrastructures. Xu et al. [46] highlight how the availability of renewable energy resources such as solar and wind in the Xinjiang region could power the Silk Road’s facilities.
The proposed model might indeed be used to analyze the energy requirements of cold chains built upon alternative routes and corridors that connect Europe with China, to obtain the most effective freight route from an energy perspective, and to assess the impact of new logistics infrastructures on the overall energy consumption of the cold chain.
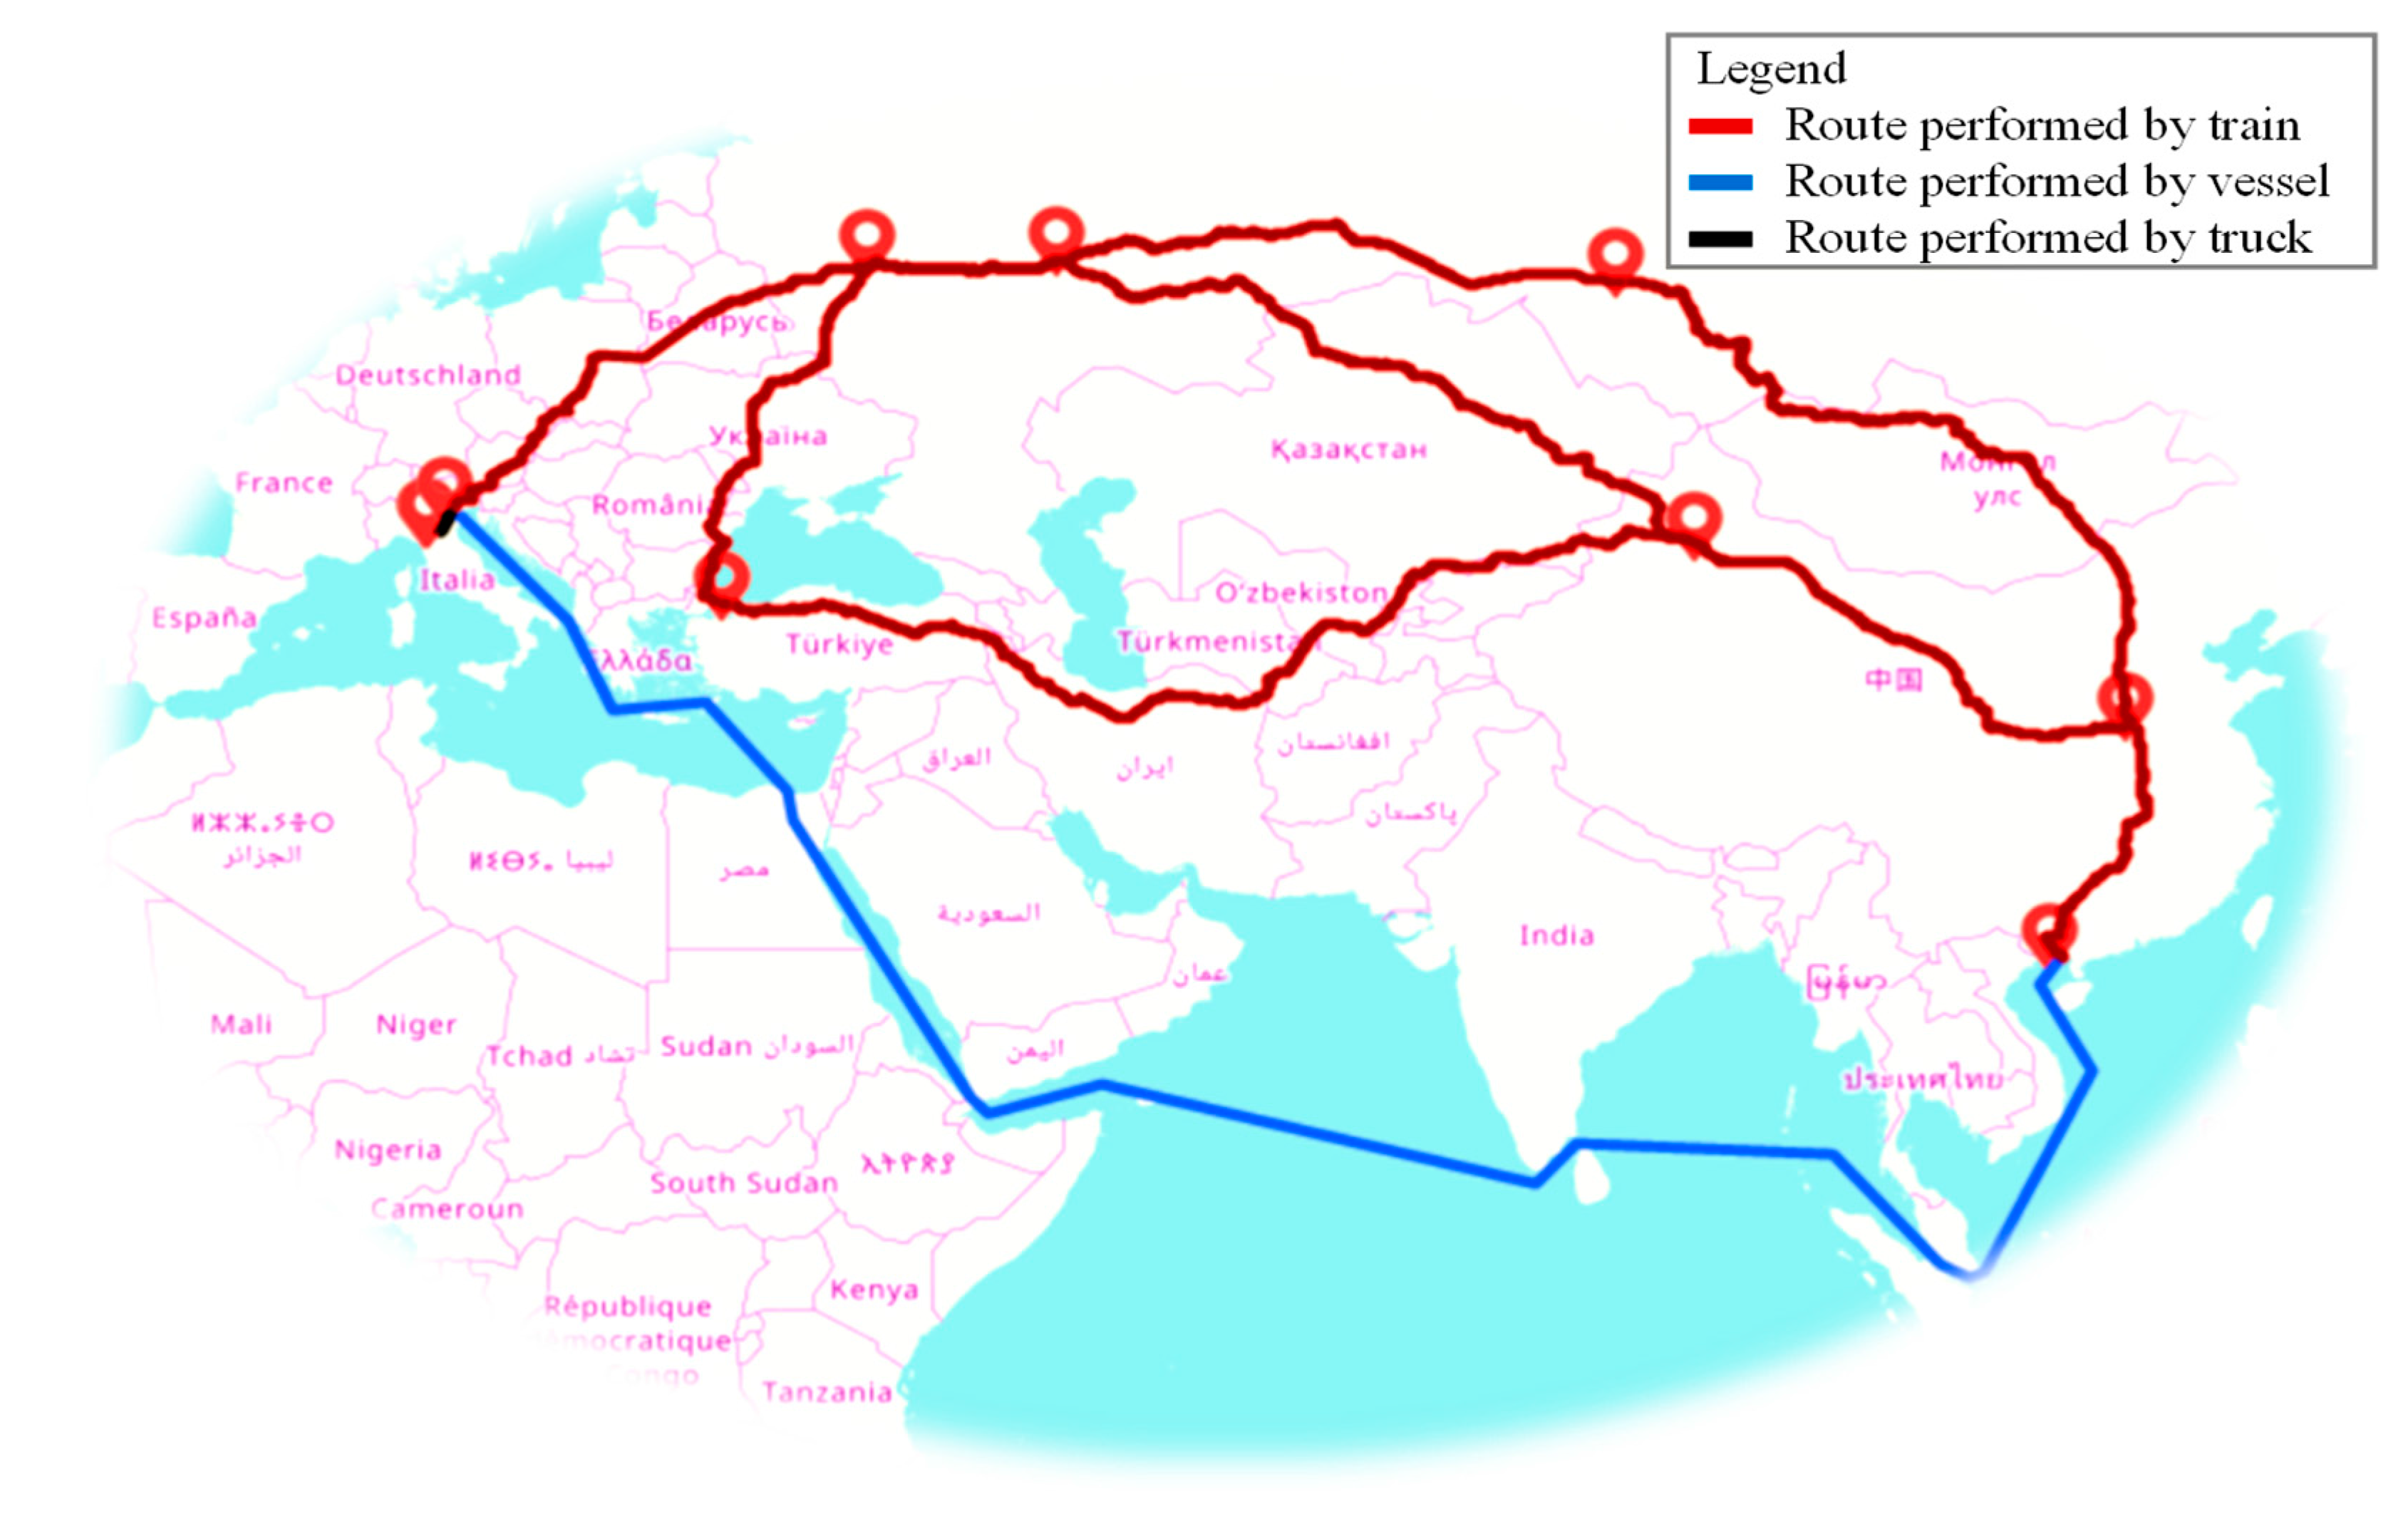
To this purpose, the illustrated case study focuses on the assessment of the energy requirements of new potential cold corridors for the trade of food and perishable products throughout the new Silk Road Belt. Among the evaluated corridors (see Figure 3), three (i.e., the northern, central, and southern corridors) are travelled by train, and the fourth is mainly maritime.
The case study is based on a cold chain built on ten logistics nodes that delivers two perishable products, apples and ice-cream, from a Northern Italian city to the Chinese market located in Zhengzhou. The selected network draws some potential routes and connections between the main cities along the Silk Road Belt. These cover not yet existing transport infrastructures that are planned to be realized within the ‘Belt and Road Initiative’. Other nodes might be considered in order to widen the set of potential connections available for the distribution planning. This might be useful to identify the optimal connections to establish a strategic perspective on an energy effective cold chain. Nevertheless, given the planning horizon and the high granularity of the time periods chosen for this case study (i.e., each period is a day), the complexity of the problem increases significantly, even with few nodes.
We selected two products with different characteristics in terms of energy value, shelf life, and optimal conservation temperature to stress how these factors together influence the selection of the energy effective route. As an example, we consider an order of 35 tons of products processed and packed in Italy to be delivered to the Chinese retail market within 40 days. The proposed model is used to identify the energy effective corridor for each product and the most sustainable transport mode and to quantify and assess its sustainability performances in terms of the IS metric. Table 1 summarizes the input dataset in terms of the network’s nodes and products’ characteristics.
The selected planning horizon, i.e., 40 days, involves the summer season, between July and August, when the external temperatures rise and the refrigeration system is stressed. Given the high perishability of ice cream, its conservation temperature and the resulting shelf life are key drivers for the identification of the specific route and transport mode to adopt.
4.1. Energy Parameters Formulation
The negative energy contribution associated with the delivered food products equals their energy content in terms of nutritional value (i.e., kcal or kwh) for the consumers. These values, reported in Table 1, also quantify the energy loss associated with a unit of food i sent to waste (wei) because they overcame the minimum acceptable quality level.
The positive contributions in the objective function (Equations (2a)–(2i)) include the energy used for power harvesting and farming equipment, the energy used for fuel processing-packaging lines, and the energy required to keep the product temperature at the safe set-point during the cold storage and along the transport activities. Specifically, the energy for refrigeration is affected by the difference between the environmental temperatures and the temperature set point k chosen at the storage facility and during transportation. This contribution can be calculated with well-known thermodynamic equations [47,48], as recently formulated in [37].
4.2. Shelf Life Formulation
The quality decay of a food product i in the period t that is conserved at temperature k (varqi,k) is quantified in terms of integer levels of quality lost. The level of quality degradation is determined by considering the differences between the temperature set-point k, chosen at a storage facility or in a reefer container during transportation, and the temperature T0 in the cold room. The integer quality decay is thus calculated through the well-known Q10 factor method [49]:
where Ea(i) is the activation energy of product i and T0 is the temperature corresponding to a known shelf life.
4.3. Results
The MILP model is written in AMPL and solved via Gurobi with a computer configured with Quad Core 2.4 GHz processors and 8 GB of RAM within 5 min. The instance of the model involved 2,107,085 continuous variables, 15,480 integer variables, of which 840 are binary, and 84,608 constraints. The obtained solution enables us to calculate the energy consumption of the long-ray cold chain from Italy to China and to quantify the IS metric for the two products. Since the goal is to assess the sustainability of alternative routes and transport modes for food distribution along the new Silk Road, some assumptions on the capacities of the nodes have been made:
- The selected grower/farmer (respectively for apples and milk) is able to satisfy completely the order from the retailer;
- The processing/packaging node is able to process all the incoming products;
- The capacity constraint at the storage nodes is relaxed.
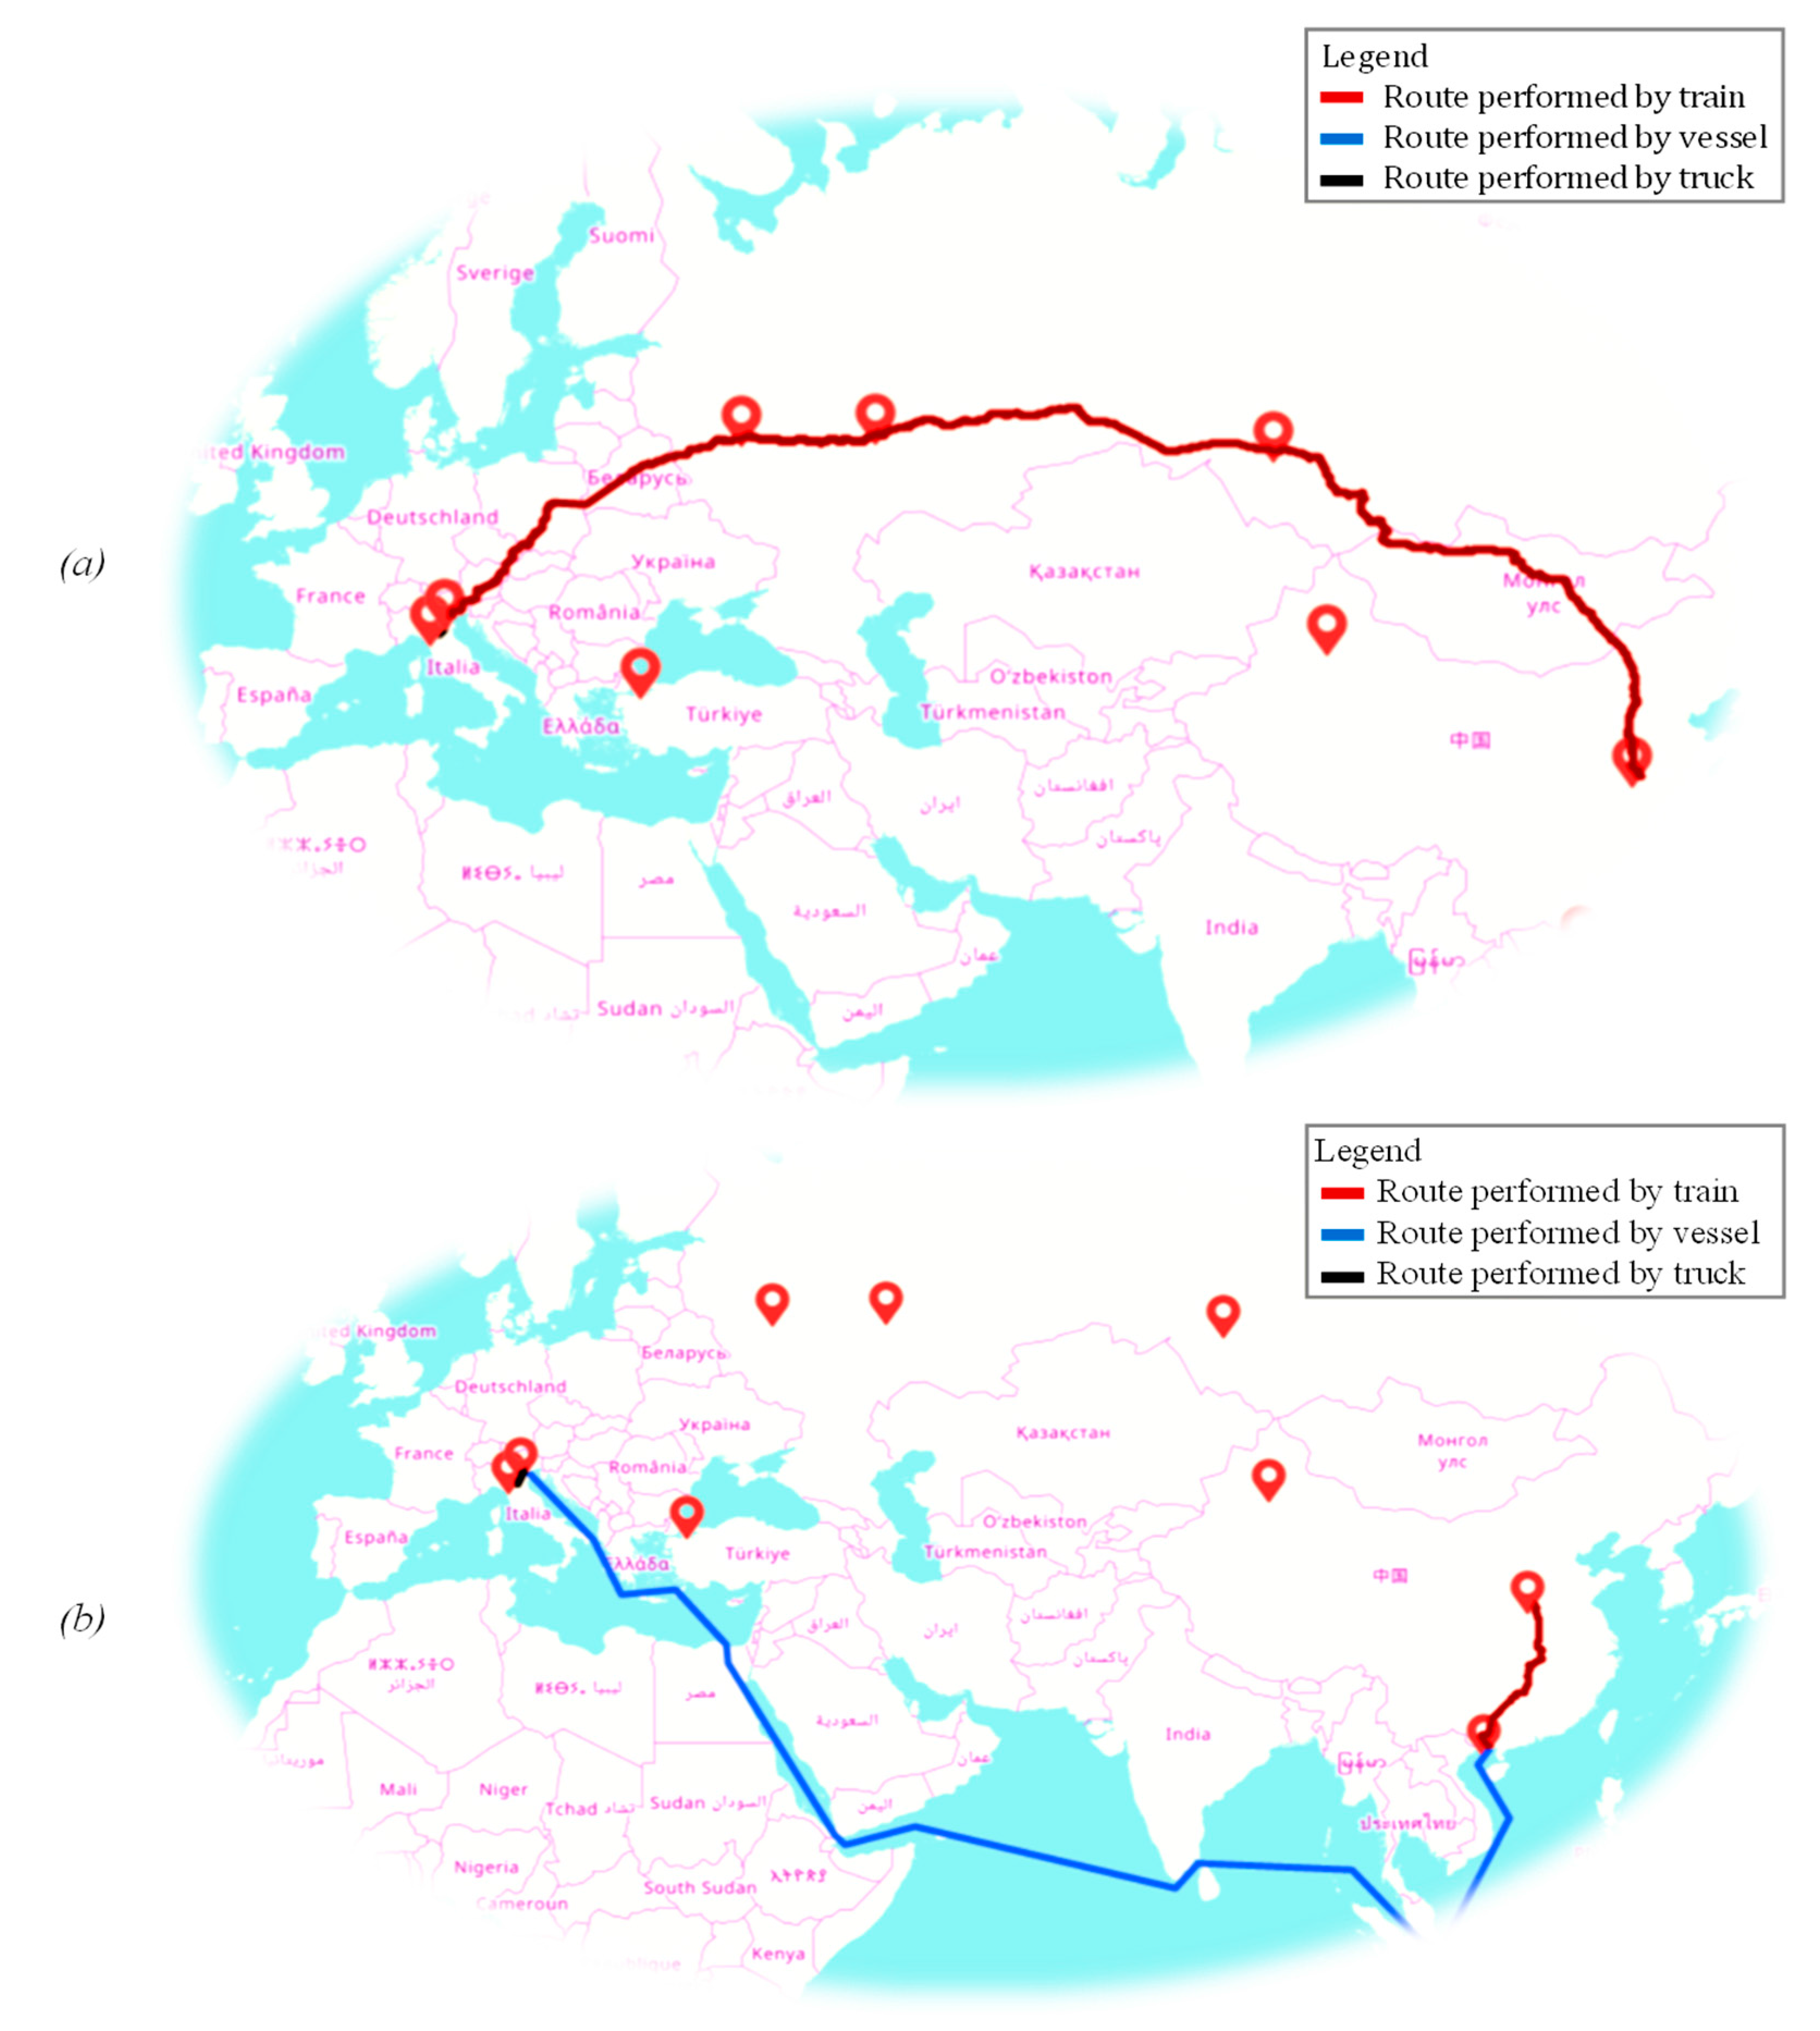
The optimal solutions in terms of route and transport mode vary with the product, as illustrated in Figure 4. The maritime route is not suitable for the ice cream, since its shelf life is shorter than the required travelling time. Ice cream should be shipped by train via the northern route, which requires less than three weeks, compared to more than five along the maritime route. It is worth noting that the optimal route for ice cream from an energy perspective passes from the Novosibirsk’s node, instead of from Kazan and Ürümqi, even though the latter would last one day less. The motivation for such behavior must be found in the different expected external temperatures experienced by the shipment across different regions. The northern route is indeed, on average, colder than the central one, and thus requires less energy for refrigeration to deliver the consumer a given product. Conversely, apples are characterized by a higher conservation temperature set-point. As a consequence, they are shipped by a vessel that needs more time to reach the Chinese markets but is less energy consuming.
According to the optimal solution, the unit (i.e., per-package) energy consumption to supply both ice cream and apples from a Northern Italian producer (i.e., Vignola) to a southern Chinese Market (i.e., Zhengzhou) is 314.86 kWh. The corresponding sustainability metric calculated for the transnational cold chain of ice cream is ISicecream = 760, while, for apples, it is is ISapple = 913. These food items consume, along their cold chain from farm to fork, seven and nine hundred times the energy they provide to the consumer. These results confirm the findings in the literature that certify the tremendous growth of the IS metric of agro-food products from values around 10 at the beginning of 1970s to values greater than 100 nowadays [40].
The exemplifying result would lead to changes in the paradigm underlying the design of sustainable supply chains for fresh food products. The energy consumption and the associated environmental impacts have to be involved at the planning and design stages, and renewable energy sources might be established for powering the food operations from farm to table toward climate-stability goals [29]. Indeed, the adoption of renewable energy sources would decrease the reliance of cold chains on conventional fossils and would reduce the associated environmental impacts and climate change effects.
4.4. Discussion
The obtained solution suggests that the maritime route allows the overall energy consumed for food transportation to be reduced. However, it requires about five weeks to reach the Chinese market, which might not be suitable for all perishable products. To meet both economic and ecological issues, avoiding food losses along the supply chain is essential. By incorporating the energy loss associated with food waste, the model identifies the optimal route in accordance with the shelf life and the conservation temperature of each product. For products with a short shelf life, the selection of the optimal route is time-driven, instead of temperature-driven, since the product is distributed as quickly as possible to avoid losses. Although reducing the time to consumer allows us to supply products of higher quality and with longer residual shelf life, on the other hand, it can enhance the overall energy requirements for storage and distribution. Conversely, a longer shelf life allows the model to choose a temperature-driven optimal route that minimizes the energy consumption affected by the external temperatures experienced during the distribution phase. Given the longer shelf life of apples in comparison with ice cream, the resulting optimal routes are, respectively, temperature-driven and time-driven, and apples account for less energy consumption than ice cream.
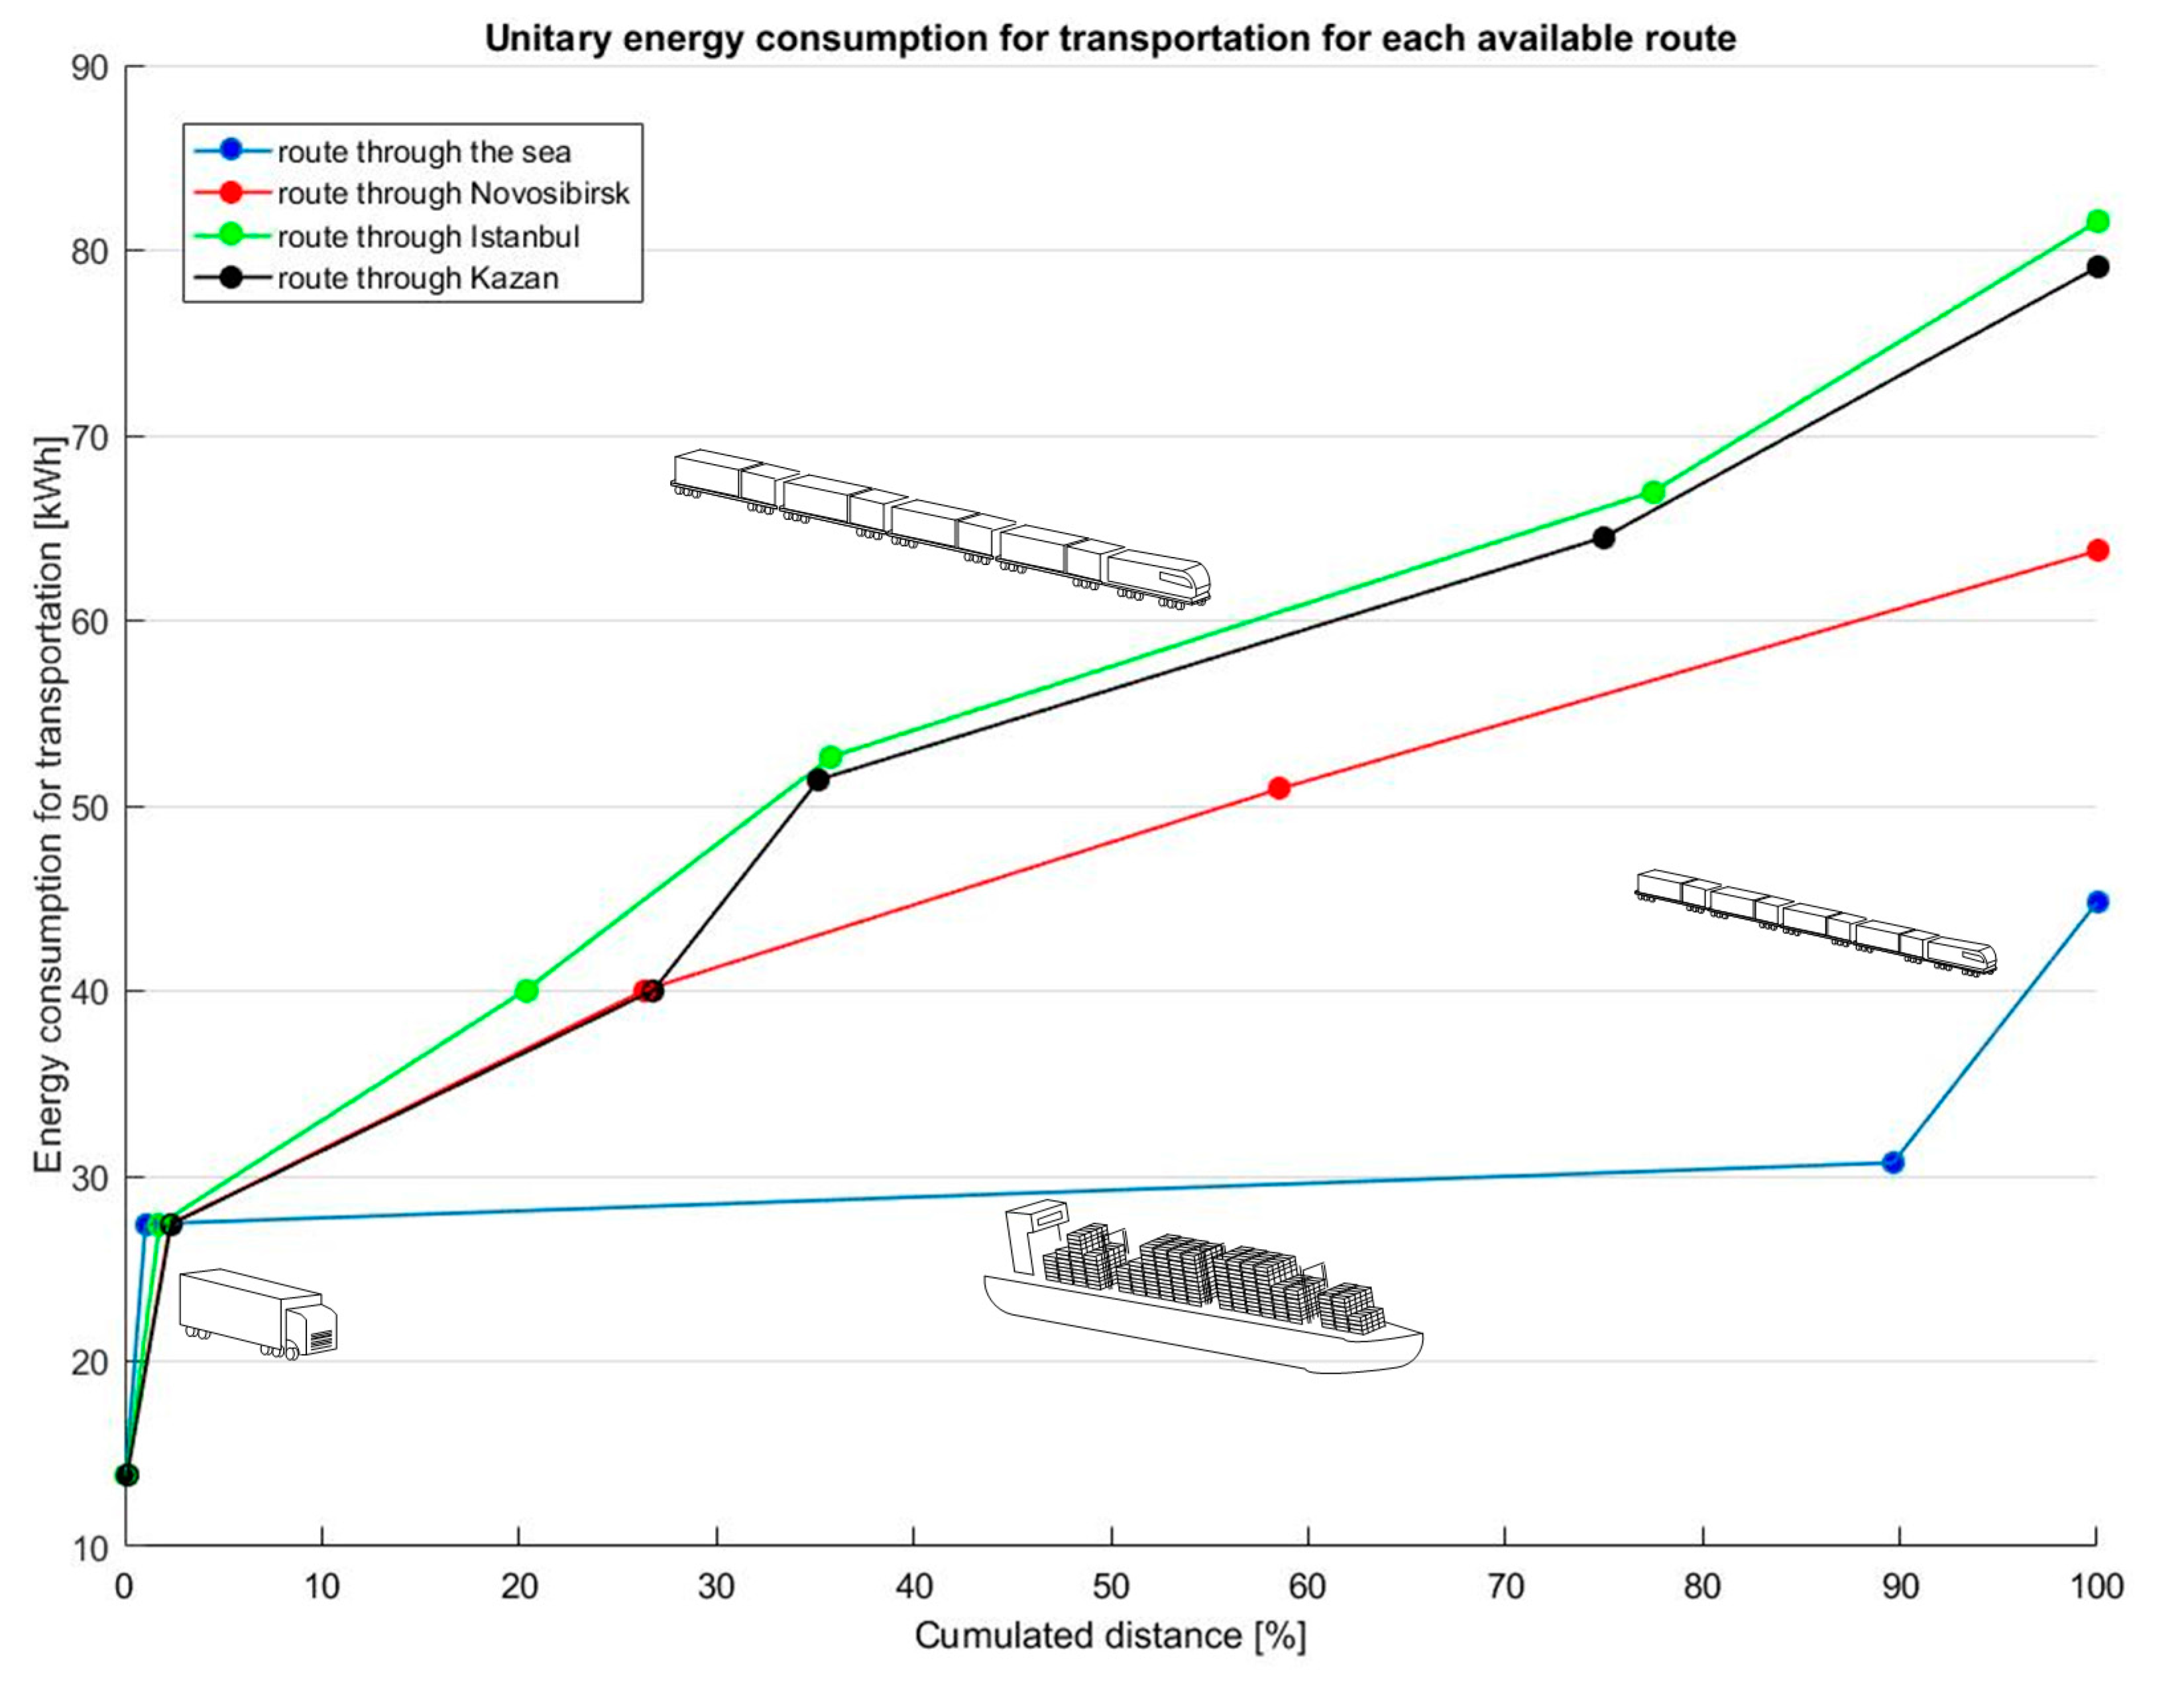
Figure 5 reports the energy consumption attributed to each alternative route in the case of the distribution of apples. The dots are the nodes touched by the route. The slope of the line connecting two nodes represents the energy consumption rate. The maritime corridor i.e., the blue line, is the most energy effective, and the adoption of the vessel between Venice and Beihai contributes to significantly contain the energy consumption of the cold chain. Figure 5 also highlights that the first arc travelled by truck has the highest energy consumption rate out of the four alternatives.
Notwithstanding with the most energy efficient distribution strategy, a trade-off between the energy consumption and the quality and freshness of the food products at the consumer’s place should be identified in future research developments. Controlling the level of the quality of delivered products would allow the exporter-importer to charge extra for a load (i.e., a pallet or a container) route by route (and season by season) in accordance with the experienced environmental conditions during the distribution operations, the resulting quality, and the higher energy costs.
According to the proposed model, the optimal solution for the cold chain results from a combination of many factors that can be summarized as follows:
- The energy consumption of the vehicles used to travel along the route;
- The total distance traveled and the travel time, including the fixed setup time of multi-modal transport;
- The need for refrigeration power along the routes.
Another consideration involving the different climate conditions experienced during mid-range and long-range cold chains comes from interpreting the results. Typically, the sea provides a thermal mitigation and keeps the temperature stationary, avoiding those peaks experienced upon roads and railways during daily sun hours [50,51]. As a consequence, despite the longer travel, the maritime path is chosen by a temperature-driven solution to minimize the energy consumption for distribution (i.e., as in the case of apples).
These consumptions are increasingly predominant along global cold chains, and their reduction is crucial to the provision of sustainable food. Therefore, the decision on the route and the transport mode to adopt is of extreme importance in designing energy effective cold chains.
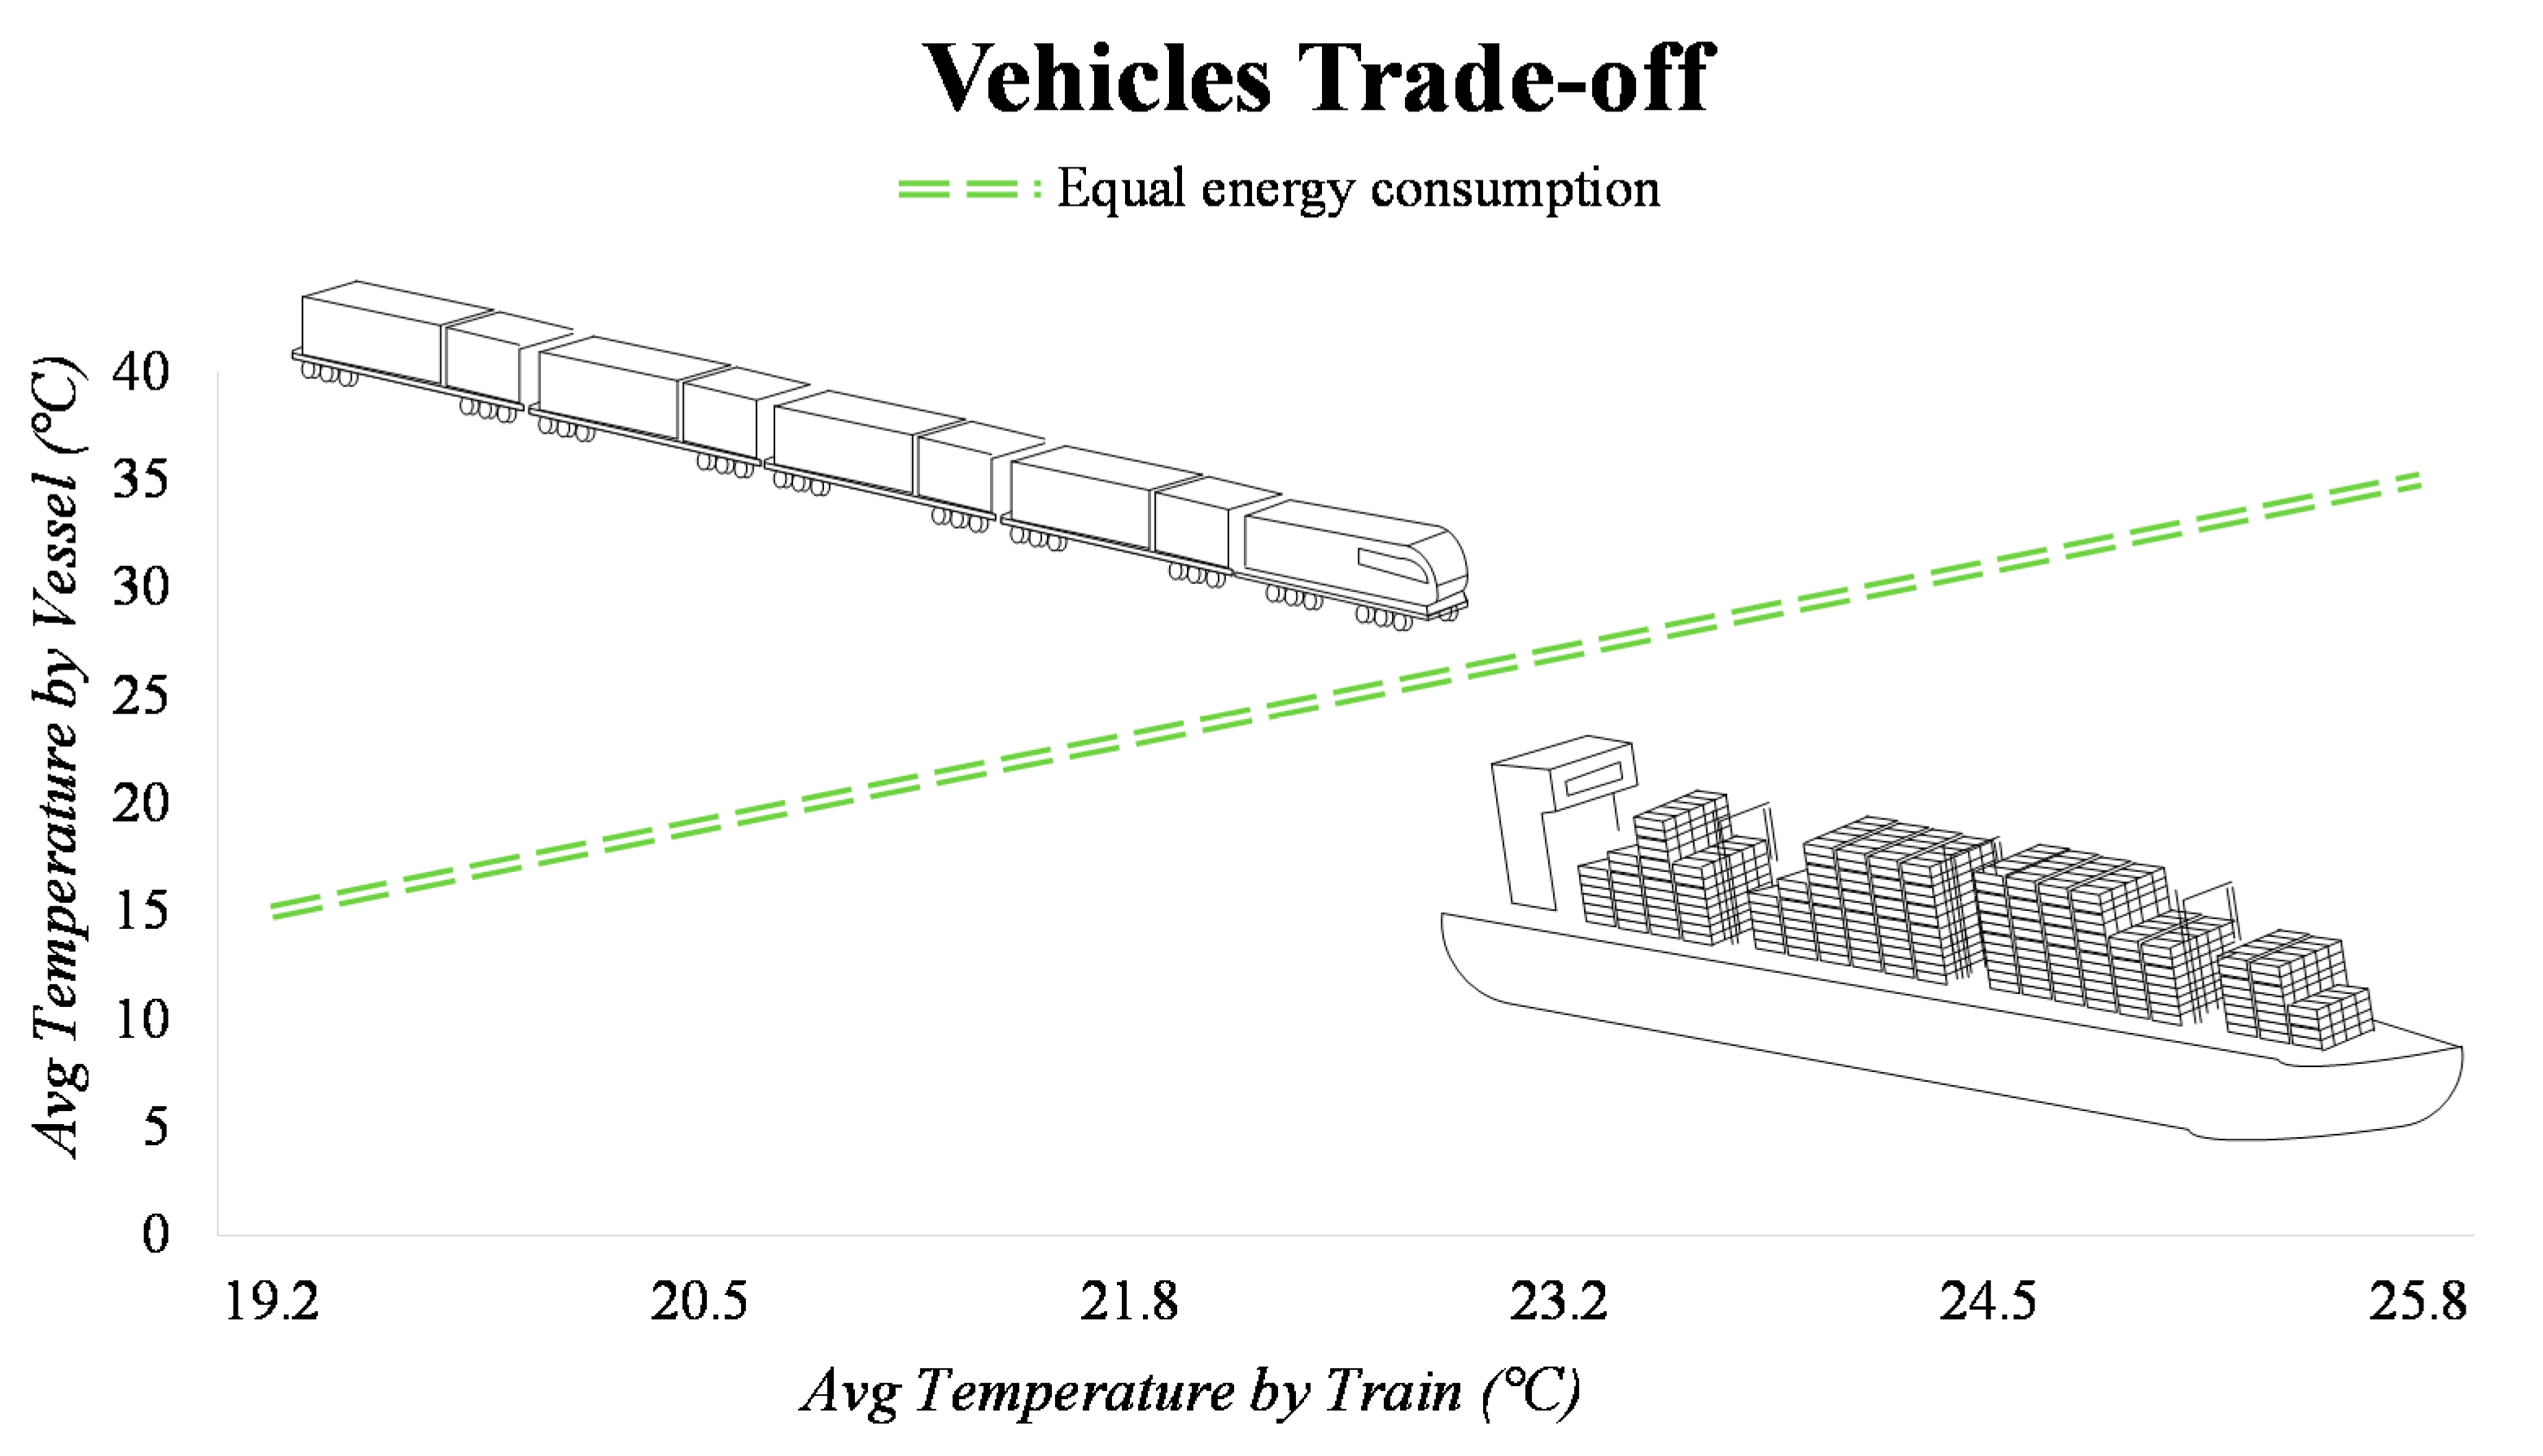
This aspect is explored in Figure 6, which shows the trade-off between the best route via railways (i.e., the route through Novosibirsk) and the maritime route (i.e., the route through Beihai). Figure 5 summarizes the results obtained by a sensitivity analysis conducted on the external temperatures experienced during the journey. By maintaining all the other parameters as fixed, the line in Figure 5 represents the points at which the two alternative routes and transport modes are equivalent, in terms of the energy consumption for refrigeration, considering the external temperature stresses they will experience. For example, when the average external temperature experienced along the railway route is around 22 °C, the maritime route is preferable for energy minimization if the average external temperature measured by the vessel is below 25 °C. This abacus can be provided for each route, food product, and season by solving the model with different datasets.
In the view of this, the proposed model can support decision-making on the operational management of the distribution activities throughout the whole cold chain, as well as, from a strategic and long-term perspective, on the strategic design of the cold network, in terms of where to locate a logistic node or a multi-modality exchange infrastructure, according to the existing connections between offer and demand [52], the climatic conditions experienced along the routes [37], and the costs and availability of energy.
The proposed model provides estimates of both the energy consumption and the refrigeration power required for the distribution of fresh food through long-range cold chains. The first estimate might contribute to the calculation of a logistic-driven selling price for each potential final market. The estimated power might support the planning and establishment of cold logistics facilities (e.g., cold hubs), as well as the required energy of plants and grid infrastructures throughout a distribution corridor.
This model might also contribute to a three-fold taxonomy of fresh food products. The first driver is of a regulatory nature. The control, planning, and optimization of the distribution flows throughout the supply chain, which results in identifying the most sustainable corridor for food transportation. As a consequence, the exporter might be interested in complying with the food safety rules in each country involved in the corridor between origin and destination, as well as strengthening commercial agreements with those authorities. The second driver is infrastructural. The identified optimal corridor can be used as a map for the establishment of new multi-modal logistics infrastructures that aid the export of a given class of fresh food. The third driver deals with the quality of food at the consumer’s place. The model allows the assessment of the maximum level of quality of the delivered product when the energy consumption for refrigeration is taken into account. Thus, the supply of food might be planned in accordance with the consumers’ expectations for different destination markets, the level of quality perceived, and the consumers’ willingness to pay for it.
At last, this paper is a preliminary attempt to aid the overall mapping, design, planning, and control of distributed hyper-connected food supply chains [53] that meet the three pillars of sustainability.
5. Conclusions
Modern food supply chains are identified as one of the main stressors of the environment, and the resulting GHG emissions, energy consumption, and waste should be minimized to make the food supply finally sustainable.
This paper illustrates a decision-support MILP model for the design and management of energy effective long-ray cold chains. It minimizes the total energy consumption of the supply chain operations (i.e., growing, processing, packaging, storage, transport, and refrigeration), involving the product’s shelf life and its optimal conservation temperature set-point. The model can support operational decisions about which route and transport mode to choose and also aids strategic considerations on where to locate a logistics node or infrastructure along a long-ray cold chain. The presented model has been applied to a case study inspired by the New Silk Road Belt project. The sustainability performance of the cold chain is evaluated through the IS metric that measures the ratio between the energy consumed and supplied by a product. The cold chains for two different food products, i.e., apples and ice cream, have been studied and optimized. The obtained solutions result from the trade-off between the conservation temperature set point, the travelling time and external temperatures of the alternative routes, and the shelf life of each product. As a consequence, different products may optimally choose different routes and transport modes to save energy. Lastly, a sensitivity analysis built on the external temperatures experienced by the railways and maritime routes shows how the climate conditions need to be incorporated in the operations management of efficient and sustainable long ray cold chains.
The obtained results pave the way for the resulting geo-policy considerations. The design and organization of sustainable trans-national distribution strategies might be a potential application of the proposed model. The specificity of a geographic area, including macro- and micro-economic metrics (e.g., transactional costs, customs fees, costs of energy, money values), may influence the identification of the optimal routes, and a trade-off between the costs and energy consumption of food distribution must be identified. An extensive data collection project to map the economic and infrastructural characteristics of the countries involved along the Silk Road corridors could reasonably enhance the applicability of the model.
Further developments of this research are expected in terms of the design of optimal approaches for the storage of perishable products along a cold chain’s warehouses, as well as in terms of the incorporation of other multidisciplinary metrics of performance (e.g., quality, pathogens growth) [54,55] as a driver for decision-making on effective, profitable, safe, and sustainable food supply chains. Other research efforts could include the minimization of the overall food distribution costs, together with the environmental impacts, through a multi-objective formulation.
Acknowledgments
The authors would like to thank the anonymous reviewers for their valuable and fruitful comments that improved the quality of this paper.
Author Contributions
Riccardo Accorsi and Andrea Gallo conceived the research idea and developed the model. Andrea Gallo implemented and solved the model, while Giulia Baruffaldi contributed to the data analysis and to the literature review. Riccardo Accorsi focused on writing and organizing the manuscript, while Riccardo Manzini revised the paper and suggested improvements.
Conflicts of Interest
The authors declare no conflicts of interest.
References
- Soussana, J.F. Research priorities for sustainable agro-food systems and life cycle assessment. J. Clean. Prod. 2014, 73, 19–23. [Google Scholar] [CrossRef]
- Manzini, R.; Accorsi, R.; Gamberi, M.; Regattieri, A.; Savino, M.M. Logistics and supply chain management: Issues and challenges for modern production systems. In Handbook of Transportation; Taylor & Francis, Routledge Book: New York, NY, USA, 2016; pp. 334–344. [Google Scholar] [CrossRef]
- Accorsi, R.; Manzini, R.; Pini, C. How logistics decisions affect the environmental sustainability of modern food supply chains. A case study from an Italian large scale-retailer. In Sustainability Challenges in the Agrofood Sector; Bhat, R., Ed.; John Wiley & Sons Ltd.: Hoboken, NJ, USA, 2017; pp. 179–200. [Google Scholar] [CrossRef]
- Fitzgerald, W.B.; Howitt, O.J. A.; Smith, I.J.; Hume, A. Energy use of integral refrigerated containers in maritime transportation. Energy Policy 2015, 39, 1885–1896. [Google Scholar] [CrossRef]
- Coulomb, D. Refrigeration and cold chain serving the global food industry and creating a better future: Two key IIR challenges for improved health and environment. Trends Food Sci. Technol. 2008, 19, 413–417. [Google Scholar] [CrossRef]
- Bagheri, F.; Fayazbakhsh, M.A.; Bahrami, M. Real-time performance evaluation and potential GHG reduction in refrigerated trailers. Int. J. Refrig. 2017, 73, 24–38. [Google Scholar] [CrossRef]
- Tassou, S.A.; Ge, Y.T. Food transport refrigeration—Approaches to reduce energy consumption and environmental impacts of road transport. Appl. Thermal Eng. 2009, 29, 1467–1477. [Google Scholar] [CrossRef]
- Glouannec, P.; Michel, B.; Delamarre, G.; Grohens, Y. Experimental and numerical study of heat transfer across insulation wall of a refrigerated integral panel van. Appl. Thermal Eng. 2014, 73, 194–202. [Google Scholar] [CrossRef] [Green Version]
- Ahumada, O.; Villalobos, R. Application of planning models in the agro-food supply chain: A review. Eur. J. Oper. Res. 2009, 195, 1–20. [Google Scholar] [CrossRef]
- Accorsi, R.; Manzini, R.; Mora, C.; Cascini, A.; Penazzi, S.; Pini, C.; Pilati, F. Life cycle modelling for sustainable food supply chain. In Proceedings of the 22nd International Conference on Production Research (ICPR 2013), Iguazù Falls, Brazil, 28 July–1 August 2013. [Google Scholar]
- James, S.J.; James, C.; Evans, J.A. Modelling of food transportation systems—A review. Int. J. Refrig. 2006, 29, 947–957. [Google Scholar] [CrossRef]
- Strotmann, C.; Göbel, C.; Friedrich, S.; Kreyenschmidt, J.; Ritter, G.; Teitscheid, P. A Participatory Approach to Minimizing Food Waste in the Food Industry—A Manual for Managers. Sustainability 2017, 9, 66. [Google Scholar] [CrossRef]
- Valli, E.; Manzini, R.; Accorsi, R.; Bortolini, M.; Gamberi, M.; Bendini, A.; Lercker, G.; Gallina Toschi, T. Quality at destination: Simulating shipment of three bottled edible oils from Italy to Taiwan. Rivista Italiana delle Sostanze Grasse 2013, 90, 163–169. [Google Scholar]
- Manzini, R. A top-down approach and a decision support system for the design and management of logistic networks. Transp. Res. Part E 2012, 48, 1185–1204. [Google Scholar] [CrossRef]
- Georgiadis, P.; Vlachos, D.; Iakovou, E. A system dynamics modeling framework for the strategic supply chain management of food chains. J. Food Eng. 2005, 70, 351–364. [Google Scholar] [CrossRef]
- Mangina, E.; Vlachos, I.P. The changing role of information technology in food and beverage logistics management: Beverage network optimisation using intelligent agent technology. J. Food Eng. 2005, 70, 403–420. [Google Scholar] [CrossRef]
- Manzini, R.; Accorsi, R.; Bortolini, M. Operational planning models for distribution networks. Int. J. Prod. Res. 2014, 52, 89–116. [Google Scholar] [CrossRef]
- Handayati, Y.; Simatupang, T.M.; Perdana, T. Agri-food supply chain coordination: The state-of-the-art and recent developments. Logist. Res. 2015, 8, 5. [Google Scholar] [CrossRef]
- Akkerman, R.; Farahani, P.; Grunow, M. Quality, safety and sustainability in food distribution: A review of quantitative operations management. OR Spectr. 2010, 32, 863–904. [Google Scholar] [CrossRef]
- Borodin, V.; Bourtembourg, J.; Hnaien, F.; Labadie, N. Handling uncertainty in agricultural supply chain management: A state of the art. Eur. J. Oper. Res. 2016, 254, 348–359. [Google Scholar] [CrossRef]
- Soysal, M.; Bloemhof-Ruwaard, J.M.; Meuwissen, M.P.M.; Van der Vorst, J.G.A.J. A Review on Quantitative Models for Sustainable Food Logistics Management. Int. J. Food Syst. Dyn. 2012, 3, 136–155. [Google Scholar] [CrossRef]
- Bosona, T.G.; Gebresenbet, G. Cluster building and logistics network integration of local food supply chain. Biosyst. Eng. 2011, 108, 293–302. [Google Scholar] [CrossRef]
- Amorim, P.; Almada-Lobo, B. The impact of food perishability issues in the vehicle routing problem. Comput. Ind. Eng. 2014, 67, 223–233. [Google Scholar] [CrossRef]
- Song, B.D.; Ko, Y.D. A vehicle routing problem of both refrigerated- and general-type vehicles for perishable food products delivery. J. Food Eng. 2016, 169, 61–71. [Google Scholar] [CrossRef]
- Wang, S.; Tao, F.; Shi, Y.; Wen, H. Optimization of Vehicle Routing Problem with Time Windows for Cold Chain Logistics Based on Carbon Tax. Sustainability 2017, 9, 694. [Google Scholar] [CrossRef]
- Pipatprapa, A.; Huang, H.-H.; Huang, C.-H. A Novel Environmental Performance Evaluation of Thailand’s Food Industry Using Structural Equation Modeling and Fuzzy Analytic Hierarchy Techniques. Sustainability 2016, 8, 246. [Google Scholar] [CrossRef]
- Validi, S.; Bhattacharya, A.; Byrne, P.J. A case analysis of a sustainable food supply chain distribution system—A multi-objective approach. Int. J. Prod. Econ. 2014, 152, 71–87. [Google Scholar] [CrossRef]
- Yang, S.; Xiao, Y.; Zheng, Y.; Liu, Y. The Green Supply Chain Design and Marketing Strategy for Perishable Food Based on Temperature Control. Sustainability 2017, 9, 1511. [Google Scholar] [CrossRef]
- Accorsi, R.; Cholette, S.; Manzini, R.; Pini, C.; Penazzi, S. The land-network problem: Ecosystem carbon balance in planning sustainable agro-food supply chains. J. Clean. Prod. 2016, 112, 158–171. [Google Scholar] [CrossRef]
- Savino, M.M.; Manzini, R.; Mazza, A. Environmental and economic assessment of fresh fruit supply chain through value chain analysis. A case study in chestnuts industry. Prod. Plan. Control 2015, 26, 1–18. [Google Scholar] [CrossRef]
- Gwanpua, S.G.; Verboven, P.; Leducq, D.; Brown, T.; Verlinden, B.E.; Bekele, E.; Aregawi, W.; Evans, J.; Foster, A.; Duret, S.; et al. The FRISBEE tool, a software for optimising the trade-off between food quality, energy use, and global warming impact of cold chains. J. Food Eng. 2015, 148, 2–12. [Google Scholar] [CrossRef]
- Vanek, F.; Sun, Y. Transportation versus perishability in life cycle energy consumption: A case study of the temperature-controlled food product supply chain. Transp. Res. Part D 2008, 13, 383–391. [Google Scholar] [CrossRef]
- Bortolini, M.; Faccio, M.; Ferrari, E.; Gamberi, M.; Pilati, F. Fresh food sustainable distribution: Cost, delivery time and carbon footprint three-objective optimization. J. Food Eng. 2016, 174, 56–67. [Google Scholar] [CrossRef]
- Rong, A.; Akkerman, R.; Grunow, M. An optimization approach for managing fresh food quality throughout the supply chain. Int. J. Prod. Econ. 2011, 131, 421–429. [Google Scholar] [CrossRef]
- De Keizer, M.; Akkerman, R.; Grunow, M.; Bloemhof, J.M.; Haijema, R.; van der Vorst, J.G. A.J. Logistics network design for perishable products with heterogeneous quality decay. Eur. J. Oper. Res. 2017, 262, 535–549. [Google Scholar] [CrossRef]
- Saif, A.; Elhedhli, S. Cold supply chain design with environmental considerations: A simulation-optimization approach. Eur. J. Oper. Res. 2016, 251, 274–287. [Google Scholar] [CrossRef]
- Accorsi, R.; Gallo, A.; Manzini, R. A climate driven decision-support model for the distribution of perishable products. J. Clean. Prod. 2017, 165, 917–929. [Google Scholar] [CrossRef]
- Accorsi, R.; Manzini, R.; Gallo, A.; Regattieri, A.; Mora, C. Energy balance in sustainable food supply chain processes. In Proceeding of the 3rd International Workshop on Food Supply Chain (IWFSC 2014), San Francisco, CA, USA, 4–7 November 2014. [Google Scholar]
- Conforti, P.; Giampietro, M. Fossil energy use in agriculture: An international comparison. Agric. Ecosyst. Environ. 1997, 65, 231–243. [Google Scholar] [CrossRef]
- Church, N. Why Our Food Is So Dependent on Oil. Energy Bulletin. 1 April 2005. Available online: http://www.energybulletin.net/5045.html (accessed on 7 December 2016).
- Xi, J. Promote Friendship between Our People and Work Together to Build a Bright Future. Speech by H.E. Xi Jinping, President of the People’s Republic of China, Nazarbayev University, Astana; 7 September 2013. Available online: http://www.fmprc.gov.cn/ce/cebel/eng/zxxx/t1078088.html (accessed on 7 April 2017).
- McBride, J. Building the New Silk Road. The New Geopolitics of China, India, and Pakistan. 2015. Available online: https://www.cfr.org/backgrounder/building-new-silk-road (accessed on 7 April 2017).
- Hansen, V. The Silk Road: A New History; Oxford University Press: Oxford, UK, 2012. [Google Scholar]
- Wang, J.-Q.; Li, Y.-B. Coordination Degree Evaluation of Multiple Transport Modes of Comprehensive Transport Corridors in the Silk Road Economic Belt. In Proceedings of the 16th COTA International Conference of Transportation Professionals, Shanghai, China, 6–9 July 2016. [Google Scholar] [CrossRef]
- Xie, Y.; Fan, S. Multi-city sustainable regional urban growth simulation—MSRUGS: A case study along the mid-section of Silk Road of China. Stoch. Environ. Res. Risk Assess. 2014, 28, 829–841. [Google Scholar] [CrossRef]
- Xu, L.-J.; Fan, X.-C.; Wang, W.Q.; Xu, L.; Duan, Y.-L.; Shi, R.-J. Renewable and sustainable energy of Xinjiang and development strategy of node areas in the “Silk Road Economic Belt”. Renew. Sustain. Energy Rev. 2017, 79, 274–285. [Google Scholar] [CrossRef]
- Bergman, T.L.; Lavine, A.S.; Incropera, F.P.; DeWitt, D. Fundamentals of Heat and Mass Transfer, 7th ed.; Wiley: Hoboken, NJ, USA, 2011; ISBN 10 0470501979. [Google Scholar]
- Stoecker, W.F. Industrial Refrigeration Handbook; McGraw-Hill Book Co.: New York, NY, USA, 1998. [Google Scholar]
- Connors, K.A.; Amidon, G.L.; Stella, J.V. Chemical Stability of Pharmaceuticals, 2nd ed.; Wiley: New York, NY, USA, 1986. [Google Scholar]
- Accorsi, R.; Manzini, R.; Ferrari, E. A comparison of shipping containers from technical, economic and environmental perspectives. Transp. Res. Part D 2014, 26, 52–59. [Google Scholar] [CrossRef]
- Accorsi, R.; Ferrari, E.; Gamberi, M.; Manzini, R.; Regattieri, A. A closed-loop traceability system to improve logistics decisions in food supply chains. A case study on dairy products. In Advances in Food Traceability Techniques and Technologies: Improving Quality throughout the Food Chain; Montserrat Espiñeira, M., Santaclara, F.J., Eds.; Woodhead Publishing, Elsevier: Cambridge, UK, 2016; pp. 337–351. [Google Scholar] [CrossRef]
- Accorsi, R.; Manzini, R.; Pini, C.; Penazzi, S. On the design of closed-loop networks for product life cycle management: Economic, environmental and geography considerations. J. Trans. Geogr. 2015, 48, 121–134. [Google Scholar] [CrossRef]
- Accorsi, R.; Bortolini, M.; Baruffaldi, G.; Pilati, F.; Ferrari, E. Internet-of-things paradigm in food supply chains control and management. Procedia Manuf. 2017, 11, 889–895. [Google Scholar] [CrossRef]
- Ayyad, Z.; Valli, E.; Bendini, A.; Accorsi, R.; Manzini, R.; Bortolini, M.; Gamberi, M.; Gallina Toschi, T. Simulating international shipments of vegetable oils: Focus on quality changes. Ital. J. Food Sci. 2017, 29, 38–49. [Google Scholar] [CrossRef]
- Manzini, R.; Accorsi, R.; Ayyad, Z.; Bendini, A.; Bortolini, M.; Gamberi, M.; Valli, E.; Gallina Toschi, T. Sustainability and quality in the food supply chain. A case study of shipment of edible oils. Br. Food J. 2014, 116, 2069–2090. [Google Scholar] [CrossRef]
Figure 1.
Search strategy for the literature review.

Figure 2.
Representation of the network configuration.

Figure 3.
Alternative cold chain corridors along the Silk Road Belt.

Figure 4.
Optimal routes for the distribution of (a) ice cream and (b) apples along the Silk Road.

Figure 5.
Cumulative energy consumption of the alternative routes of the apple cold chain.

Figure 6.
Trade-off analysis between rail and maritime routes from a temperature-driven perspective.
Figure 6.
Trade-off analysis between rail and maritime routes from a temperature-driven perspective.


Table 1.
Nodes of the supply chain’s network and demanded products.
| Logistics Network | Food Products | |||||
|---|---|---|---|---|---|---|
| Node | Country | Type | Average Temp. (°C) | Product | Weight (g/Unit) | Energy Content (kWh/Unit) |
| Vignola | Italy | Grower-Farmer | 26 | Ice cream | 125 | 0.30073 |
| Valsamoggia | Italy | Packaging node | 26 | Apple | 155 | 0.09423 |
| Beihai | China | Storage node | 25 | |||
| Ürümqi | China | Storage node | 27 | |||
| Venice | Italy | Storage node | 25 | |||
| Kazan | Russia | Storage node | 22 | |||
| Moscow | Russia | Storage node | 20 | |||
| Novosibirsk | Russia | Storage node | 20 | |||
| Istanbul | Turkey | Storage node | 27 | |||
| Zhengzhou | China | Retailer | 28 | |||
© 2017 by the authors. Licensee MDPI, Basel, Switzerland. This article is an open access article distributed under the terms and conditions of the Creative Commons Attribution (CC BY) license (http://creativecommons.org/licenses/by/4.0/).
Share and Cite
MDPI and ACS Style
Gallo, A.; Accorsi, R.; Baruffaldi, G.; Manzini, R. Designing Sustainable Cold Chains for Long-Range Food Distribution: Energy-Effective Corridors on the Silk Road Belt. Sustainability 2017, 9, 2044. https://doi.org/10.3390/su9112044
AMA Style
Gallo A, Accorsi R, Baruffaldi G, Manzini R. Designing Sustainable Cold Chains for Long-Range Food Distribution: Energy-Effective Corridors on the Silk Road Belt. Sustainability. 2017; 9(11):2044. https://doi.org/10.3390/su9112044
Chicago/Turabian StyleGallo, Andrea, Riccardo Accorsi, Giulia Baruffaldi, and Riccardo Manzini. 2017. "Designing Sustainable Cold Chains for Long-Range Food Distribution: Energy-Effective Corridors on the Silk Road Belt" Sustainability 9, no. 11: 2044. https://doi.org/10.3390/su9112044
Note that from the first issue of 2016, this journal uses article numbers instead of page numbers. See further details here.