An Extended Picture Fuzzy VIKOR Approach for Sustainable Supplier Management and Its Application in the Beef Industry

1
School of Management, Shanghai University, Shanghai 200444, China
2
College of Economics and Management, China Jiliang University, Hangzhou 310018, China
*
Author to whom correspondence should be addressed.
Symmetry 2019, 11(4), 468; https://doi.org/10.3390/sym11040468
Submission received: 30 January 2019
/
Revised: 20 March 2019
/
Accepted: 22 March 2019
/
Published: 2 April 2019
Abstract
:Nowadays, sustainable supply chain management (SSCM) has received considerable attention because of strict government requirements and increased pressure from the public. In the SSCM, selecting suitable suppliers plays a significant role in improving the overall sustainability performance of a company. Therefore, this article aims to develop a modified VIKOR (in Serbian: VlseKriterijumska Optimizacija I Kompromisno Resenje) technique for sustainable supplier evaluation and selection, that uses ordered weighted distance operators in the aggregation of picture fuzzy information. Concretely, we first propose the picture fuzzy-ordered weighted standardized distance (PFOWSD) operator and the picture fuzzy Euclidean-ordered weighted standardized distance (PFEOWSD) operator, and extended them by using the hybrid average operator. Then, we develop a sustainable supplier selection approach by combining the picture fuzzy distance operators and the VIKOR method. The new approach can manipulate attitudinal character of the classical VIKOR method, so that a decision maker can take decisions according to his or her preference. Further, by using the PFOWSD operator, one can parametrize the VIKOR method from the maximum to the minimum result. Thus, the information obtained using the new sustainable supplier selection approach is much more complete. Finally, a practical case example in the beef supply chain is given to explain the proposed picture fuzzy-ordered weighted distance (PFOWD)-VIKOR model, and the results are compared with current relevant representative approaches to verify its feasibility and superiority.
1. Introduction
In the competitive global marketplace, companies have started to look after sustainability issues throughout their supply chain activities because of strict environmental legislation, scarcity of natural resources, and growing consumer awareness of environmental issues [1,2]. Organizations are expecting their suppliers or partners to boost up sustainability in their collective work. These also lead manufacturers to practice the integration of environmental, economic, and social factors in production and supply chain activities. Sustainability refers to the ability of an enterprise to make present decisions without negatively affecting the future circumstances of the natural environment, societies and business viability [3,4]. The aim of sustainable supply chain management (SSCM) is to cut down environmental pollution caused by the supply chain activities of an organization [5]. In the SSCM, supplier selection plays a significant role and has great influence on the competitive advantage of a company. It is a process of selecting the most appropriate sustainable supplier with the right price and quality at the right time and quantity [6]. Supplier selection based on sustainability criteria represents a strategic decision and is regarded as a crucial concern in the implementation of SSCM. Unsuitable suppliers will increase the production and inventory costs, lower product quality, and ultimately decrease profitability and customer satisfaction [7,8]. Therefore, in recent years, ranking and selecting sustainable suppliers has achieved a considerable amount of attention among researchers and practitioners who are attempting to move towards sustainable production [9,10,11].
Sustainable supplier selection is generally modelled as a type of multi-criteria decision-making (MCDM) problem that includes a wide variety of alternatives and conflicting assessment criteria. Hence, researchers considered the MCDM methods as a suitable and effective methodology for selecting sustainable suppliers in the literature [12,13,14]. The VIKOR (in Serbian: VlseKriterijumska Optimizacija I Kompromisno Resenje) method [15] is a famous MCDM tool to improve the quality of decision making. It has been developed for MCDM and takes into account contradictory and non-commensurable criteria to determine a compromise solution that is acceptable for all decision makers [16]. Due to its characteristics and potential benefits in compromise ranking, the VIKOR approach has been used in many of fields in recent years [17,18,19,20]. The detailed literature reviews regarding the VIKOR approach and its applications can be found in [21,22]. Although it is popular application, one limitation with the VIKOR technique is that it is neutral regarding the attitudinal character of a decision maker. In the real world, there are many situations in which the decisions should be underestimated or overestimated in order to be more or less pessimistic against indefinite issues affecting the future [23,24]. But no or few research has been carried out focusing on this issue in the application of the VIKOR method.
On the other hand, in realistic sustainable supplier selection processes, it is common that evaluation criteria data are vague and ambiguous because of a lack of information and knowledge. Some valuable theories and methods (e.g., intuitionistic fuzzy sets (IFSs) [25]) were suggested to represent the uncertainty in applied sustainable supplier evaluation situations [20,26,27]. Picture fuzzy sets (PFSs), first proposed by Cuong [28], are a valuable extension of IFSs, which are characterized by membership degree and non-membership degree. In contrast, PFSs are described by positive membership, neutral membership, and negative membership functions [29,30]. Because of the consideration of new parameters, PFSs can represent imprecise assessments that IFSs can otherwise handle, and, moreover, they can depict more complex and uncertain information for decision makers [31]. Recently, the PFS theory has been increasingly used as an ideal method for modelling uncertainty in real MCDM problems [32,33,34].
Against the above background, this article aims to present a new sustainable supplier selection model by extending the VIKOR method with ordered weighted distance operators and PFSs. To achieve this target, we first introduce two new distance operators: the picture fuzzy-ordered weighted standardized distance (PFOWSD) operator and the picture fuzzy Euclidean-ordered weighted standardized distance (PFEOWSD) operator. Then, we suggest applying the picture fuzzy-ordered weighted distance (PFOWD) operators to calculate the separation measures in the VIKOR method. The fundamental characteristic of the PFOWD-VIKOR technique is that it calculates the separation measures from the best and the worst values with the developed distance operators, and consequently, the sustainable supplier selection problem can be addressed by the decision maker according to more complete information. In addition, an empirical case is given for illustrating the efficiency of the PFOWD-VIKOR model for choosing the optimal sustainable suppliers in the beef industry.
The remainder of this article is structured as follows. Section 2 gives a literature review on sustainable supplier selection, paying particular attention to the use of MCDM methods. Section 3 provides the basic notions and definitions of PFSs briefly. In Section 4, we introduce the PFOWSD and the PFEOWSD operators and present extensions by the hybrid average (HA) operator [35]. Section 5 develops the sustainable supplier selection model with the aid of the PFOWD operators and VIKOR technique. In Section 6, the proposed approach is applied to sustainable supplier selection in the beef supply chain. Finally, conclusions of this article and potential topics for further research are discussed in Section 7.
2. Literature Review
In past decade, a variety of sustainable supplier selection methods were proposed for purchase managers in the literature. For example, Arabsheybani et al. [6] developed a fuzzy multi-objective optimization model based on ratio analysis (MOORA) in order to select the best sustainable supplier in view of quantity discounts and supplier risk. Lu et al. [4] applied an integrated approach using rough sets and the ELECTRE (ELimination Et Choix Traduisant la REalité) method to evaluate sustainable suppliers under the vague environment. Quan et al. [8] described a hybrid MCDM framework that combined interval-valued intuitionistic uncertain linguistic sets and MULTIMOORA (MOORA plus full multiplicative form) for green supplier selection in a large group environment. In [12], the grey relational analysis (GRA) was combined with technique for order preference by similarity to ideal solution (TOPSIS), called the GRA-TOPSIS method, for determining suitable green suppliers based on interval-valued intuitionistic uncertain linguistic assessments. In [36], a big data cloud computing framework based on fuzzy analytic hierarchy process (AHP), decision making trial and evaluation laboratory (DEMATEL), and fuzzy TOPSIS was put forward to facilitate low-carbon supplier selection. Tseng et al. [5] employed an interval-valued triangular fuzzy numbers-GRA method with cost and benefit concerns to assist purchase managers in green supply supplier selection. Van et al. [7] used a hybrid approach using quality function deployment, interval neutrosophic sets, and TOPSIS method in support of green supplier selection. Zhou and Xu [9] put forward an integrated evaluation method based on hybrid information aggregation for sustainable supplier selection, and Zhu and Li [2] introduced a green supplier selection model by combing the consensus process, prioritized operator, and Choquet integral under the hesitant fuzzy linguistic environment. Sen et al. [27] reported a sustainable supplier selection approach by using three different MCDM methods (namely, TOPSIS, MOORA and GRA) in the intuitionistic fuzzy setting.
In [37], a grey-based group decision-support approach based on the best-worst method (BWM) and TODIM (an acronym in Portuguese of interactive and multicriteria decision making) was proposed for social sustainable supplier evaluation and selection. In [38], a hybrid model composed of Shannon entropy and fuzzy TOPSIS method was introduced for performance evaluation of green suppliers in the furniture industry. In [39], a hybrid multi-criteria framework integrating the Copeland method, the AHP method, and the ELECTRE-TRI method was presented for the selection of suppliers considering social, ethical, and environmental criteria. Liu et al. [40] used the BWM and alternative queuing method (AQM) to evaluate and select sustainable suppliers under the interval-valued intuitionistic uncertain linguistic environment. Liu et al. [41] combined triangular fuzzy numbers, AHP, and TOPSIS to improve the sustainable performance of an agri-food value chain. Liu et al. [11] developed an ordered weighted hesitant fuzzy group decision-making model for green supplier selection, and Wang et al. [14] proposed a MCDM method with q-rung interval-valued orthopair fuzzy information to solve the green supplier selection problem. Lu et al. [42] proposed the use of cloud model and possibility degree for green supplier selection in the straw biomass industry, and Xu et al. [43] applied the sorting method, AHPSort II, and interval type-2 fuzzy sets for sustainable material supplier selection. In addition, detailed literature reviews on the current sustainable supplier selection methods can be seen in [44,45,46].
3. Preliminaries
3.1. Picture Fuzzy Sets
On the basis of IFSs [25], the concept of PFSs was proposed by Cuong [28] to model complex and uncertain assessments of experts in real decision-making problems.
Definition 1.
A PFS P on the universe X is expressed by
where is the “positive membership degree of x in P”, is the “neutral membership degree of x in P”, and is the “negative membership degree of x in P”; , and satisfy the conditions that and .
For each PFS P in X, the parameter is called the refusal membership degree of x in P. For convenience, the three-tuple is referred to as a picture fuzzy number (PFN), where and .
Definition 2.
- (1)
- (2)
- (3)
- (4)
Definition 3.
Using the score function S and the accuracy function H, the comparison laws of PFNs are defined as given below.
Definition 4.
Supposing there are two PFNs and , then
- (1)
- if , then ;
- (2)
- if , then ;
- (3)
- if , then .
Motivated by the distance measure between intuitionistic fuzzy sets [48], Dutta [33] proposed a distance formula for PFSs taking into account the parameters of positive membership, neutral membership, and negative membership.
Definition 5.
[33] Let and be any two PFNs. The distance of and is calculated by
Based on the basic operational rules of PFNs, Wei [49] developed the picture fuzzy-weighted averaging (PFWA) operator for decision making.
Definition 6.
[49] Suppose is a collection of PFNs in Φ. The PFWA operator can be computed by using the following formula:
where is the associated weights of , satisfying and .
3.2. The OWAD Operator
The ordered weighted averaging distance (OWAD) operator [23,24] is an extension of the traditional Hamming distance by using the ordered weighted average (OWA) operator [50]. An important feature of the OWAD operator is the reordering of the arguments of the individual distances according to their values. It can be defined as follows for two sets of and .
Definition 7.
An OWAD operator of dimension n is a mapping that has an associated weighting vector , with and , such that:
where denotes the jth largest of the individual distance and and represent the ith elements of the sets X and Y.
Similarly, the Euclidean ordered weighted averaging distance (EOWAD) operator, an extension of the traditional Euclidean distance, was defined in [51].
4. Picture Fuzzy Distance Operators
4.1. The Picture Fuzzy-Ordered Weighted Standardized Distance (PFOWSD) Operator
This section gives the definition of the PFOWSD operator for sustainable supplier selection using the VIKOR method. Suppose that the three PFSs , and denote, respectively, the ideal solution, the nadir (negative ideal) solution, and the ith considered alternative in a sustainable supplier selection problem with n evaluation criteria. Then, the PFOWSD operator can be explained as follows.
Definition 8.
For the related weighting vector , with and , we define the PFOWSD operator as follows:
where represents the kth largest of the individual picture fuzzy standardized distance and and represent the ideal value and the nadir value of the jth criterion, respectively. is the picture fuzzy value of ith alternative regarding Cj,
Example 1.
Let , three PFS, and the associated weighting vector .
Then, we can obtain the PFOWSD operator as:
Note that the PFOWSD operator is commutative, monotonic, idempotent, and bounded. The proofs of these properties are straightforward and, thus, omitted here. Like the OWAD operator, the PFOWSD operator includes a parameterized family of picture fuzzy distance operators by changing the weights, such as the descending PFOWSD operator, the picture fuzzy maximum, the picture fuzzy minimum, the picture fuzzy normalized Hamming standardized distance (PFNHSD) operator, and the picture fuzzy-weighted Hamming standardized distance (PFWHSD).
Bedsides, we can obtain other families of PFOWSD operators referring to the OWAD operator, (e.g., the step-PFOWASD operator, the window-PFOWASD, the olympic-PFOWASD, the PFOWASD-median, the centered-PFOWASD, the S-PFOWASD, or the non-monotonic-PFOWASD). The formulation of these families is straightforward, as indicated in [23,24,52,53].
4.2. The Picture Fuzzy Euclidean-Ordered Weighted Standardized Distance (PFEOWSD) Operator
Suppose that the three PFSs , and denote, respectively, the ideal solution, the nadir solution, and the ith considered alternative in a sustainable supplier selection problem with n evaluation criteria. Then, the definition of the PFEOWSD operator is given as follows.
Definition 9.
For the related weighting vector satisfying and , we define the PFEOWSD operator by the formula:
where represents the kth largest of the individual picture fuzzy standardized distance and and denote the idea value and the nadir value of the jth criterion, respectively. is the picture fuzzy value of ith alternative regarding Cj,
Example 2.
For the three PFSs , and , and the weighting vector ω given in Example 1, the PFEOWSD operator is determined by
It should be noted that the PFEOWSD operator is commutative, monotonic, idempotent, and bounded. By using different weighting vectors, we can determine different types of picture fuzzy distance operators, which include the picture fuzzy maximum, the picture fuzzy minimum, the picture fuzzy-normalized Euclidean standardized distance (PFNESD), and the picture fuzzy-weighted Euclidean standardized distance (PFWESD).
Like the EOWAD operator, we can determine other families of PFEOWSD operators (e.g., the step-PFEOWSD operator, the window-PFEOWSD, the olympic-PFEOWSD, the PFEOWSD-median, the centered-PFEOWSD, the S-PFEOWSD, and the non-monotonic-PFEOWSD.
4.3. The Hybrid Picture Fuzzy-Ordered Weighted Standardized Distance (HPFOWSD) Operator
Motivated by the HA operator [35], the hybrid PFOWSD (HPFOWSD) operator is introduced in this part. Suppose that the three PFSs , and denote, respectively, the ideal solution, the nadir solution, and the ith considered alternative in a sustainable supplier selection problem with n evaluation criteria. Then, the HPFOWSD operator is explained as below.
Definition 10.
For the related weighting vector , with and , we define the HPFOWSD operator as:
where represents the kth largest of the is the weighting vector of the Cj with and , n is the balancing coefficient, and and denote the idea value and the nadir value of the jth criterion, respectively. is the picture fuzzy value of ith alternative regarding Cj,
Example 3.
Let , and be three PFSs and the weighting vector ω is the same as Example 1. According to Equation (9), we have
Then, we have
Finally, the HPFOWSD operator can be calculated as follows:
It can be observed that if , for all k, the PFWHSD operator is derived and if , for all k, the PFOWSD operator is determined. If and , for all k and j, we get the PFNHSD operator. The HPFOWSD operator has similar properties than the PFOWSD operator. But it is not idempotent nor commutative. Besides, a wide range of families of the HPFOWSD operator can be obtained following the method given in the PFOWSD operator.
4.4. The Hybrid Picture Fuzzy Euclidean-Ordered Weighted Standardized Distance (HPFEOWSD) Operator
Similarly, the hybrid PFEOWSD (HPFEOWSD) operator is a generalization of the PFEOWSD operator. Suppose that the three PFSs , and denote, respectively, the ideal solution, the nadir solution, and the ith considered alternative in a sustainable supplier selection problem with n evaluation criteria. Then, the definition of the HPFEOWSD operator is given as below.
Definition 11.
For an associated weighting vector , with and , we define the HPFEOWSD operator as:
where represents the kth largest of the is the weight of the Cj with and , n is the balancing coefficient, and and are the ideal value and the nadir value of the jth criterion, respectively. is the picture fuzzy value of ith alternative regarding Cj,
Example 4.
Let , and be three PFSs, the weighting vector ω is the same as Example 1, and the weighting vector .
Similar to Example 3, we have
Thus, the HPFEOWSD operator is determined as below:
In this case, when , for all k, we get the PFWESD operator, and when , for all k, we get the PFEOWSD operator. When and , for all k and j, the PFNESD operator is obtained. It can be seen that the HPFEOWSD operator accomplishes similar properties than the HPFOWSD operator.
5. The Proposed Approach for Sustainable Supplier Selection
In what follows, we present an ordered weighted distance-based VIKOR method for solving sustainable supplier selection problems with conflicting criteria and picture fuzzy information. The proposed sustainable supplier selection approach, called PFOWD-VIKOR, can be useful in many of situations such as in those where a decision maker wants to underestimate the results so as to take a more prudent selection than in normal cases.
The process to follow in evaluating sustainable suppliers with the PFOWD-VIKOR approach is based on the procedure developed in [15,51], with the differences that the criteria values are given in the form of PFNs and the separation measures are calculated with the PFOWSD operator. Let us consider a sustainable supplier selection problem, which contains m alternatives (potential suppliers) and n evaluation criteria . Each alternative is evaluated against the n criteria. The decision makers utilize linguistic terms to score the ratings of alternatives with respect to each criterion. Thus, the performance ratings of decision makers assigned for each alternative form a linguistic evaluation matrix denoted by . The importance weights of the l decision makers are denoted by with and . Then, by using the PFOWD-VIKOR algorithm, the multi-criteria sustainable supplier selection problem can be approached with the following steps:
Step 1. Obtain the picture fuzzy evaluation matrix of each decision-maker.
The first step is to convert the decision makers’ linguistic expressions for the alternatives into PFNs to establish the picture fuzzy evaluation matrixes where for and . For example, the linguistic terms illustrated in Table 1 can be used by decision makers for sustainability evaluation of alternative suppliers.
Step 2. Determine the collective picture fuzzy evaluation matrix by using the PFWA operator.
The picture fuzzy evaluation matrixes are aggregated with the PFWA operator, as the formula in Equation (12) to obtain the matrix .
Step 3. Find the best and the worst values of all criteria ratings using Equations (14) and (15), for j = 1, 2, …, n.
Step 4. Obtain the values Si and Ri, i = 1, 2, …, m, by employing the below equations:
where is the ordered weights of criteria. It may be mentioned here that we can use the picture fuzzy distance operators presented in the last section in the above equations.
Step 5. Obtain the values Qi, i = 1, 2, …, m, by the following equation:
where . In addition, v means the weight for the strategy of maximum group utility, and 1 − v is the weight of the individual regret. In the real application, we can take the value of v as 0.5.
Step 6. Based on the ascending orders of the values S, R, and Q, all the alternatives can be acquired. As a result, three ranking lists can be yielded.
Step 7. This step is to determine a compromise solution (A(1)), which is best ranked by the measure Q (minimum) and, at the same time, the following two conditions should be satisfied:
- C1.
- Acceptable advantage: where ranks the second according to the values of Q.
- C2.
- Acceptable stability in decision making: The alternative A(1) should be the first alternative by S or/and R. The compromise solution is stable in a sustainable supplier selection process, which could be “voting by majority rule” (v > 0.5), or “by consensus” , or “with veto” (v < 0.5).
If one of the conditions is not fulfilled, then we can obtain a set of compromise solutions in line with the following rules:
- Alternatives A(1) and A(2) if only C2 is not fulfilled or
- Alternatives A(1), A(2), …, A(M) if C1 is not fulfilled; A(M) is determined by the relation for maximum M.
6. Case Study
In this section, we applied the PFOWD-VIKOR methodology to an empirical sustainable supplier selection case in the beef supply chain [36] to demonstrate its applicability and effectiveness. In what follows, the background information and the implementation process are discussed in detail.
6.1. Background Description
In recent years, carbon footprint reduction has received great attention from researchers and practitioners around the world. Apart from the manufacturing and transportation industries, the agriculture sector is one of the main contributors to global carbon emission. Compared to other agri-food products, beef has the uppermost carbon footprint, and the majority of its emissions takes place at beef farms [36]. The is particularly true in developing countries where the majority of global cattle are raised, but farmers in these areas are often not aware of modern technology to curtail carbon emissions from their farms. Furthermore, there is an increasing pressure on the beef industry from the government and clients to reduce carbon emissions in its supply chain. Therefore, it is of vital importance to increase consciousness of beef farmers and, thus, incorporate sustainable criteria in selecting the best cattle supplier by abattoir and processor.
To mitigate carbon emission, the proposed approach was applied for the selection of a supplier for a beef abattoir and processor company. After premilitary screening, ten potential alternatives (beef farmers) of this company were considered, which are denoted as . The green performance of these suppliers was evaluated according to the following seven criteria: quality of meat (C1), age of cattle (C2), diet fed to cattle (C3), average weight (C4), traceability (C5), carbon footprint (C6), and price (C7). An expert group consisting of three decision makers (DM1, DM2, and DM3) was established to conduct the performance rating of each supplier. The decision makers’ weights were assumed as and since they had different levels of technical knowledge and expertise. According to the linguistic terms defined in Table 1, the evaluation result of the three decision makers for the ten suppliers is listed in Table 2.
6.2. Implementation Results
To identify the supplier that performed the best on sustainability requirements, the proposed PFOWD-VIKOR framework was implemented. The obtained results are given as follows:
Step 1. The linguistic evaluation data of the decision makers are transformed into PFNs according to Table 1. For example, for DM1, the obtained picture fuzzy evaluation matrix is demonstrated as in Table 3.
Step 2. The collective picture fuzzy evaluation matrix of the suppliers is obtained by Equation (11). Table 4 displays the aggregated picture fuzzy evaluations of the alternatives.
Step 3. Based on the matrix and Equations (12) and (13), the best and the worst values for the seven criteria are determined as listed in Table 4.
Steps 4 and 5. Now we need to determine the values Si, Ri, and Qi for the ten alternative suppliers with Equations (14)–(16).
Note that it is possible to employ different picture fuzzy distance operators to calculate the Si index. In the case study, we considered the PFNHSD, the PFWHSD, the PFOWSD, the PFHOWSD, the PFNESD, the PFWESD, the PFEOWSD, and the HPFEOWSD operators. The following weighting vectors were selected: and . The results of these calculations are shown in Table 5 and Table 6.
Steps 6 and 7. All the alternative suppliers are ranked in ascending order based on the values of Si, Ri, and Qi. The lowest value of Qi in each method is the optimal result. As a result, the ranking results are displayed in Table 7.
As one can note, depending on the particular type of picture fuzzy distance operators, the priority of the alternative suppliers was dissimilar. For some situations, the most suitable supplier was A10 because it had the lowest distance to the ideal alternative. For other circumstances, we observed that the optimal choice was A6. However, according to the related rules in Section 5, both A10 and A6 were compromise solutions since only the acceptability condition C1 was valid. Besides, by using the dominance theory [54], an aggregated ranking of the alternatives can be acquired based on the considered picture fuzzy distance operators (i.e., ). Therefore, in the given application, the focal abattoir and processor company can select A10 or A6 as the best beef cattle supplier for procurement.
6.3. Comparative Analysis
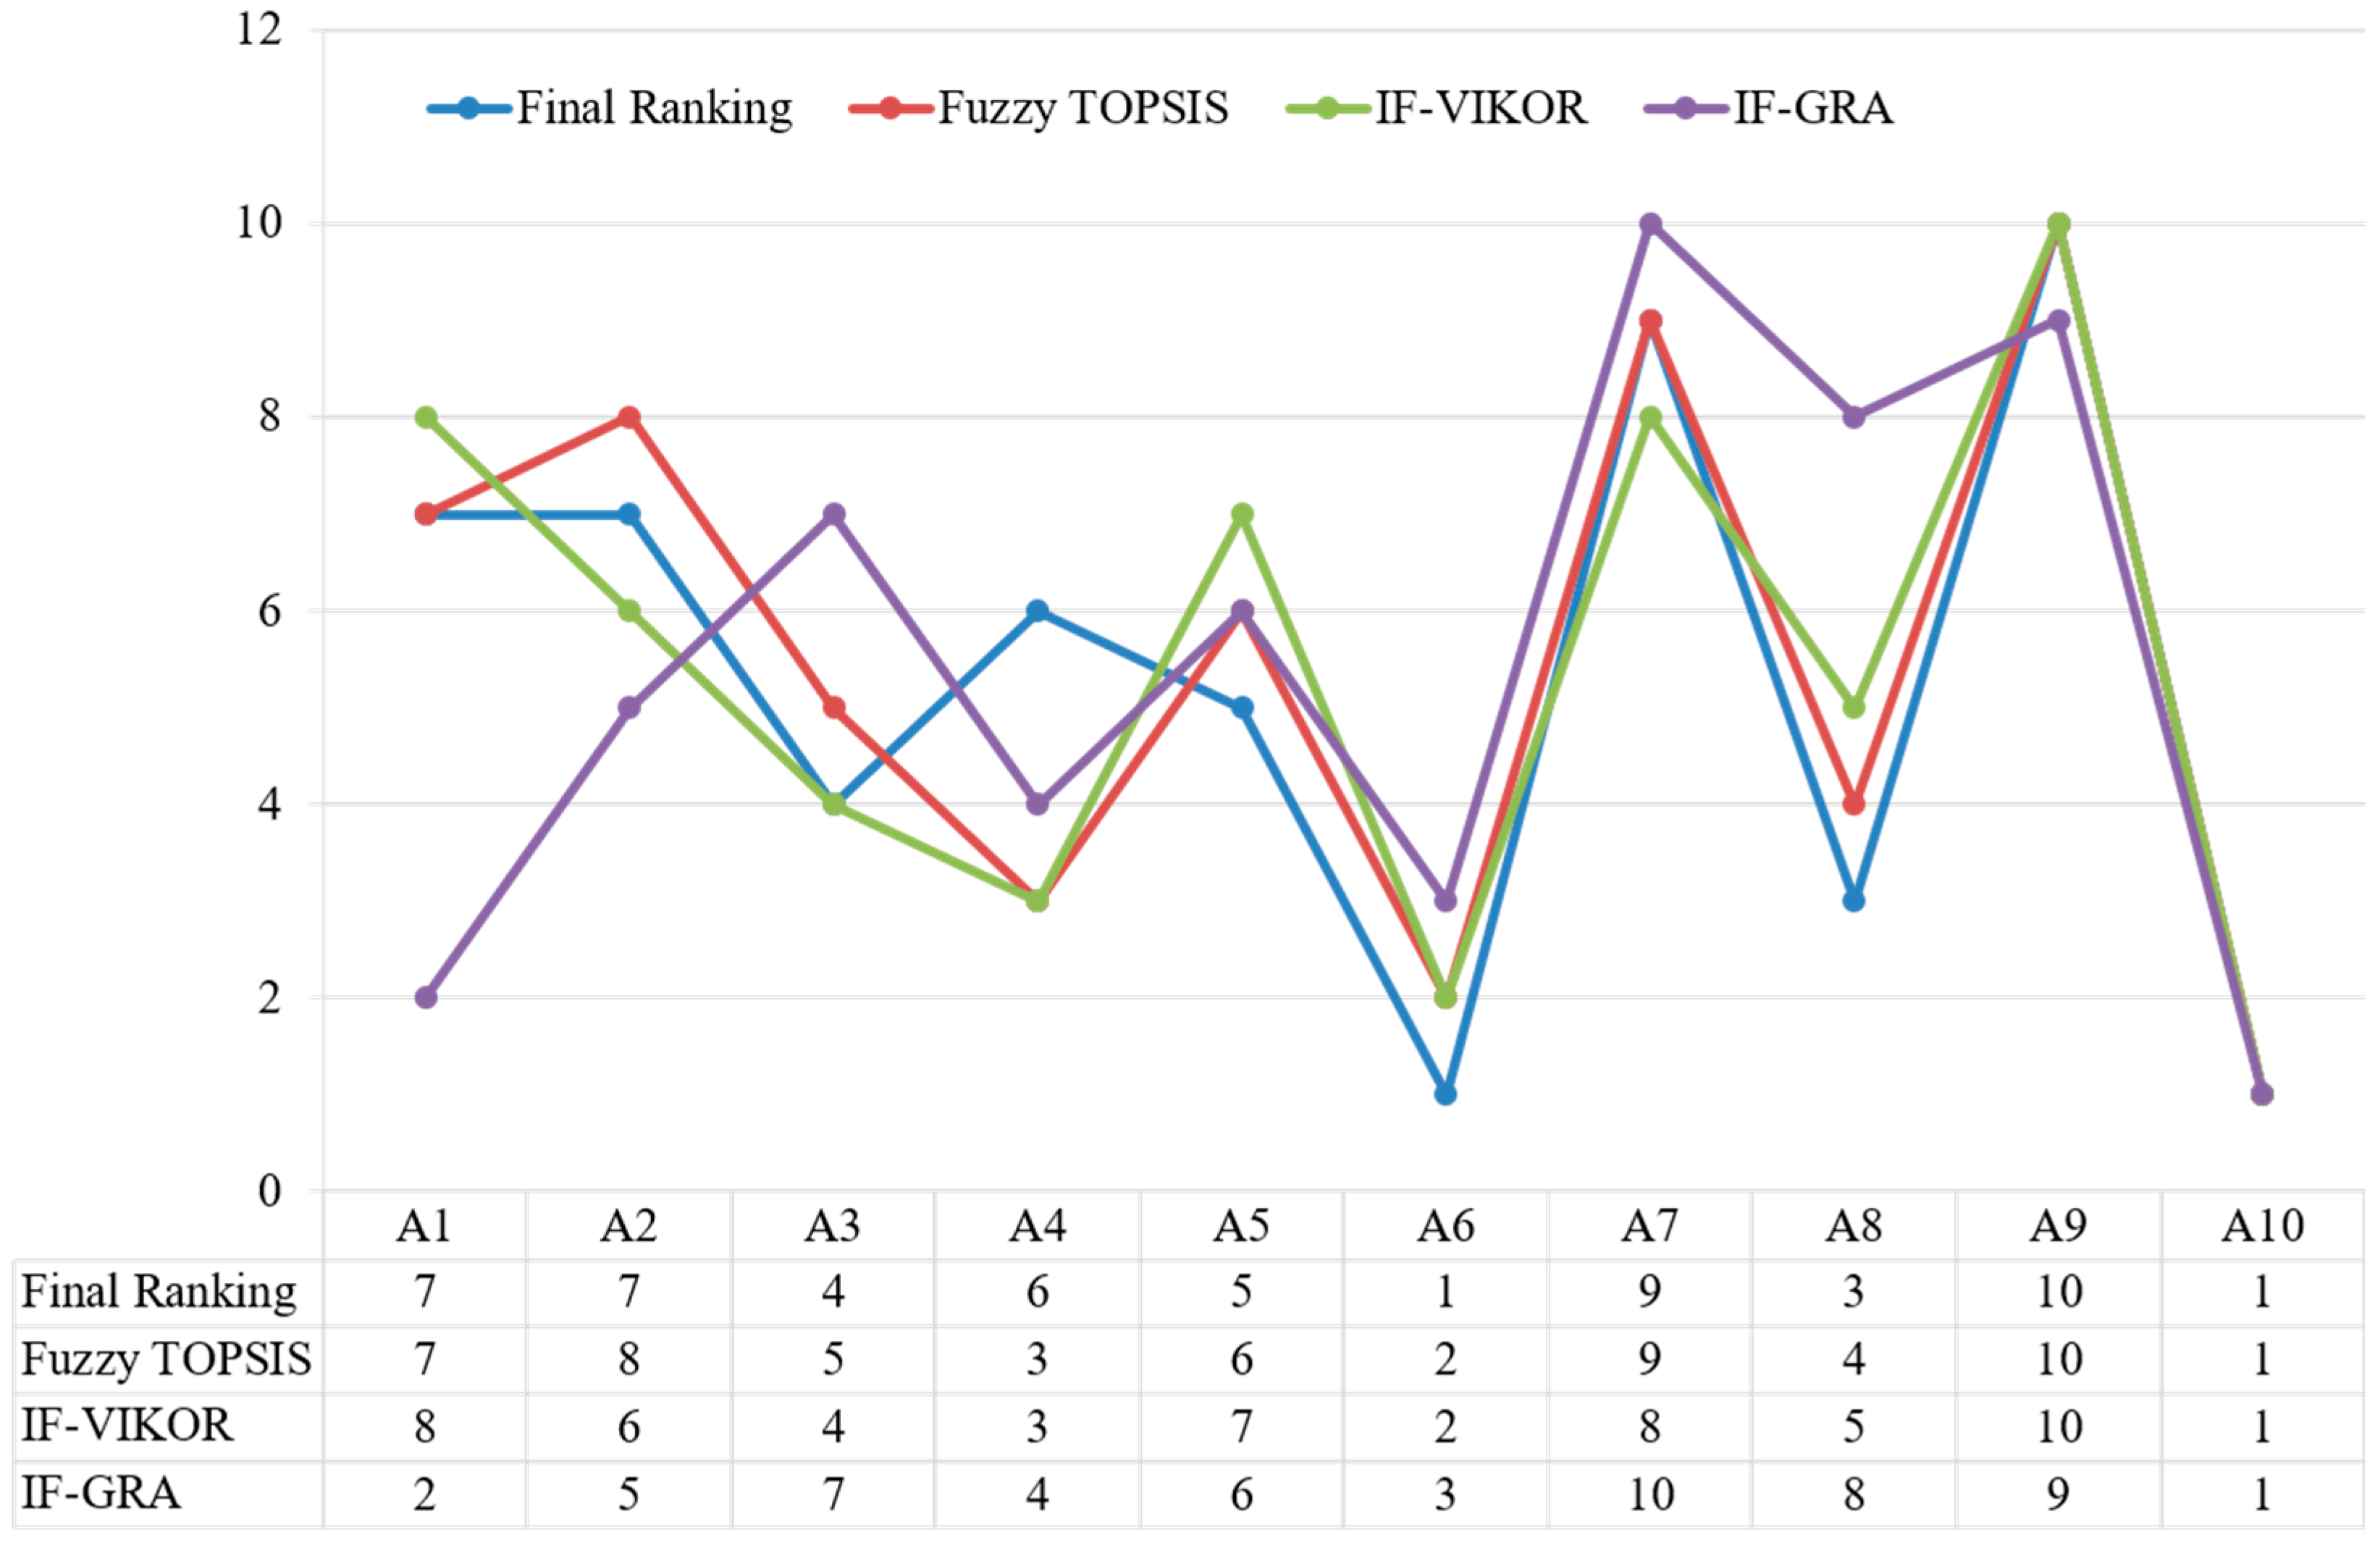
In this section, to show the effectiveness of the proposed model, we made a comparison analysis using the same case study in the beef supply chain, with the fuzzy TOPSIS [36], the IF-VIKOR [20], and the IF-GRA [27] methods. Figure 1 shows the order results of the suppliers that were produced by using the listed methods. It can be seen that A10 was rated first among the four methods. Especially, the top two and the last two suppliers determined by the proposed model agreed with the ones using the fuzzy TOPSIS and the IF-VIKOR methods. This confirms the efficiency of the proposed PFOWD-VIKOR method.
On the other hand, there was a difference in the ranking orders of other suppliers derived with the four methods. For example, A8 ranked third and was better than A4 when using the proposed approach. However, the third highest ranking supplier was A4 and A8 had a lower priority when the fuzzy TOPSIS and the IF-VIKOR methods were used. According to the IF-GRA method, A3 was ranked behind A5. In reality, the former was more important, and, thus, the result of the proposed approach suggested that A3 had a higher priority in comparison with A5. This was also validated by the fuzzy TOPSIS and the IF-VIKOR methods. Besides, when balancing all the criteria the two suppliers A1 and A2 should be given the same priority for selection, as derived by the proposed approach. But the other three methods produced the opposite results: A1 was better than A2 by the fuzzy TOPSIS and the IF-GRS, and A2 ranked higher than A1 using the IF-VIKOR method. Thus, a more reasonable ranking can be achieved by the use of the PFOWD-VIKOR algorithm.
In addition, the inconsistency in the rankings of suppliers can be explained by different features of the compared methods. The proposed approach employed PFSs to handle the inherent lack of precision of the data gathered in the sustainable supplier evaluation and selection problem, unlike the fuzzy TOPSIS approach on the basis of fuzzy sets and the IF-VIKOR and the IF-GRA methods using IFSs. Moreover, another reason for the different ranking results from the presented approach and the fuzzy TOPSIS method is that the VIKOR method ranked the sustainable alternatives based on the closeness to the ideal solution. The TOPSIS method selected the optimum alternative, which should have the “shortest distance” from the idea solution and the “farthest distance” from the “negative-idea” solution. The proposed approach and the IF-GRA method produced vastly different priority results for the suppliers. This is, in part, due to the fact that the GRA method used only one “reference” point in determining the ranking of the alternative suppliers.
6.4. Managerial Implications
This study presented a new decision-making approach for purchase managers to select the best sustainable supplier to increase the competitiveness and economic level of an enterprise. The literature review suggested that the proposed sustainable supplier selection approach was unique in its integration of ordered weighted distance operators and the VIKOR approach in a picture fuzzy environment. The case example showed that the proposed approach led to superior results, compared to other methods. In summary, the new approach proposed for sustainable supplier selection has several implications for practitioners and academicians in the sustainable supplier management field. First, by using PFSs, the proposed approach is more appropriate to address the challenge of decision makers in assessing the green performance of suppliers. It incorporates a complete degree of confidence in the experts’ opinions and can easily represent the uncertainty of evaluation information in solving sustainable supplier selection approach problems. Second, by using picture fuzzy distance operators in the sustainable supplier selection process, various methods can be provided for managers. In real-word cases, we often do not know which scenario is the correct one by reason of uncertainty. Hence, representing different specific cases that might occur is valuable for gaining the whole picture of a different, future status quo. Finally, the proposed approach determines the ranking of alternative suppliers following the basic procedure of the VIKOR method. The ranking result or compromise solution obtained is more accurate and reliable and can be easily accepted by decision makers since it offers a maximum “group utility” of the “majority” and a minimum individual regret of the “opponent”. Therefore, our study provides practical and theoretical guidance for the organizations that are implementing or will implement SSCM.
7. Conclusions
Sustainable supplier selection is a key part of SSCM, which has attracted the increasing attention of academics in recent years. In the article, a PFOWD-VIKOR framework was established to solve sustainable supplier selection problems under a picture fuzzy environment. We first introduced the PFOWSD and the PFEOWSD operators as new types of picture fuzzy distance operators. Then, the normal VIKOR technique was modified using the developed distance operators to obtain the performance ranking of sustainable suppliers. The key benefit of the proposed approach is that we can manipulate the neutrality of the results according to the optimism degree of a decision maker. Therefore, the decision maker is able to choose the optimal supplier according to his or her attitudinal character and thus, obtain a more comprehensive view of a sustainable supplier selection problem. Finally, the PFOWD-VIKOR approach was applied in beef supply chain management concerning the selection of eco-friendly cattle suppliers. Further, through comparison with existing methods, the advantages and practicalities of the presented approach were illustrated.
In our future research, it is a meaningful topic to further extend the proposed approach by including new characteristics in the sustainable supplier selection, such as the incorporation of a consensus level and the bounded rationality behavior of decision makers. Considering that suppliers may change their sustainability performances with time, it is interesting to study a dynamic evaluation and selection model to determine the best supplier in future research. In addition, the integrated decision-making approach presented in this paper can be utilized for selecting green suppliers in other industries, such as healthcare and retail, to further validate the approach being presented in this paper.
Author Contributions
The individual contribution and responsibilities of the authors were as follows: P.M. and S.-M.L. together designed research; H.S. and H.-C.L. provided extensive advices throughout the study regarding to abstract, introduction, research design, research methodology, findings and revise the manuscript. The discussion was a team task. All authors have read and approved the final manuscript.
Funding
This work was supported by the National Natural Science Foundation of China (Nos. 61773250, 71671125 and 71432007) and the Shanghai Youth Top-Notch Talent Development Program.
Acknowledgments
The authors are very grateful to the editor and reviewers for their insightful and constructive comments and suggestions, which are very helpful in improving the quality of the paper.
Conflicts of Interest
The authors declare no conflict of interest.
References
- Gören, H.G. A decision framework for sustainable supplier selection and order allocation with lost sales. J. Clean. Prod. 2018, 183, 1156–1169. [Google Scholar] [CrossRef]
- Zhu, J.; Li, Y. Green supplier selection based on consensus process and integrating prioritized operator and choquet integral. Sustainability 2018, 10, 2744. [Google Scholar] [CrossRef]
- Giannakis, M.; Papadopoulos, T. Supply chain sustainability: A risk management approach. Int. J. Prod. Econ. 2016, 171, 455–470. [Google Scholar] [CrossRef]
- Lu, H.; Jiang, S.; Song, W.; Ming, X. A rough multi-criteria decision-making approach for sustainable supplier selection under vague environment. Sustainability 2018, 10, 2622. [Google Scholar] [CrossRef]
- Tseng, M.L.; Lim, M.; Wu, K.J.; Zhou, L.; Bui, D.T.D. A novel approach for enhancing green supply chain management using converged interval-valued triangular fuzzy numbers-grey relation analysis. Resour. Conserv. Recycl. 2018, 128, 122–133. [Google Scholar] [CrossRef]
- Arabsheybani, A.; Paydar, M.M.; Safaei, A.S. An integrated fuzzy MOORA method and FMEA technique for sustainable supplier selection considering quantity discounts and supplier’s risk. J. Clean. Prod. 2018, 190, 577–591. [Google Scholar] [CrossRef]
- Van, L.H.; Yu, V.F.; Dat, L.Q.; Dung, C.C.; Chou, S.Y.; Loc, N.V. New integrated quality function deployment approach based on interval neutrosophic set for green supplier evaluation and selection. Sustainability 2018, 10, 833. [Google Scholar] [CrossRef]
- Quan, M.; Wang, Z.; Liu, H.; Shi, H. A hybrid MCDM approach for large group green supplier selection with uncertain linguistic information. IEEE Access 2018, 6, 50372–50383. [Google Scholar] [CrossRef]
- Zhou, X.; Xu, Z. An integrated sustainable supplier selection approach based on hybrid information aggregation. Sustainability 2018, 10, 2543. [Google Scholar] [CrossRef]
- Zarbakhshnia, N.; Jaghdani, T.J. Sustainable supplier evaluation and selection with a novel two-stage DEA model in the presence of uncontrollable inputs and undesirable outputs: A plastic case study. Int. J. Adv. Manuf. Tech 2018, 97, 2933–2945. [Google Scholar] [CrossRef]
- Liu, Y.; Jin, L.; Zhu, F. A multi-criteria group decision making model for green supplier selection under the ordered weighted hesitant fuzzy environment. Symmetry 2019, 11, 17. [Google Scholar] [CrossRef]
- Shi, H.; Quan, M.-Y.; Liu, H.-C.; Duan, C.-Y. A novel integrated approach for green supplier selection with interval-valued intuitionistic uncertain linguistic information: A case study in the agri-food industry. Sustainability 2018, 10, 733. [Google Scholar] [CrossRef]
- Sinha, A.K.; Anand, A. Development of sustainable supplier selection index for new product development using multi criteria decision making. J. Clean. Prod. 2018, 197, 1587–1596. [Google Scholar] [CrossRef]
- Wang, J.; Gao, H.; Wei, G.; Wei, Y. Methods for multiple-attribute group decision making with q-rung interval-valued orthopair fuzzy information and their applications to the selection of green suppliers. Symmetry 2019, 11, 56. [Google Scholar] [CrossRef]
- Opricovic, S. Multi-Criteria Optimization of Civil Engineering Systems; Faculty of Civil Engineering: Belgrade, Serbia, 1998. [Google Scholar]
- Opricovic, S.; Tzeng, G.H. Extended VIKOR method in comparison with outranking methods. Eur. J. Oper. Res. 2007, 178, 514–529. [Google Scholar] [CrossRef]
- Gupta, H. Evaluating service quality of airline industry using hybrid best worst method and VIKOR. J. Air Transp. Manag. 2018, 68, 35–47. [Google Scholar] [CrossRef]
- Büyüközkan, G.; Karabulut, Y. Energy project performance evaluation with sustainability perspective. Energy 2017, 119, 549–560. [Google Scholar] [CrossRef]
- Hafezalkotob, A.; Hafezalkotob, A. Interval target-based VIKOR method supported on interval distance and preference degree for machine selection. Eng. Appl. Artif. Intell. 2017, 57, 184–196. [Google Scholar] [CrossRef]
- Zhao, J.; You, X.-Y.; Liu, H.-C.; Wu, S.-M. An extended VIKOR method using intuitionistic fuzzy sets and combination weights for supplier selection. Symmetry 2017, 9, 169. [Google Scholar] [CrossRef]
- Mardani, A.; Zavadskas, E.; Govindan, K.; Amat Senin, A.; Jusoh, A. VIKOR technique: A systematic review of the state of the art literature on methodologies and applications. Sustainability 2016, 8, 37. [Google Scholar] [CrossRef]
- Gul, M.; Celik, E.; Aydin, N.; Taskin Gumus, A.; Guneri, A.F. A state of the art literature review of VIKOR and its fuzzy extensions on applications. Appl. Soft Comput. 2016, 46, 60–89. [Google Scholar] [CrossRef]
- Merigó, J.M.; Gil-Lafuente, A.M. Decision-making in sport management based on the OWA operator. Expert Syst. Appl. 2011, 38, 10408–10413. [Google Scholar] [CrossRef]
- Merigó, J.M.; Gil-Lafuente, A.M. New decision-making techniques and their application in the selection of financial products. Inf. Sci. 2010, 180, 2085–2094. [Google Scholar] [CrossRef]
- Atanassov, K. Intuitionistic fuzzy sets. Fuzzy Sets Syst. 1986, 20, 87–96. [Google Scholar] [CrossRef]
- Büyüközkan, G. An integrated fuzzy multi-criteria group decision-making approach for green supplier evaluation. Int. J. Prod. Res. 2011, 50, 2892–2909. [Google Scholar] [CrossRef]
- Sen, D.K.; Datta, S.; Mahapatra, S.S. Sustainable supplier selection in intuitionistic fuzzy environment: A decision-making perspective. Benchmarking 2018, 25, 545–574. [Google Scholar] [CrossRef]
- Cuong, B.C. Picture fuzzy sets. J. Comput. Sci. Cybern. 2014, 30, 409–420. [Google Scholar]
- Wei, G. Picture fuzzy Hamacher aggregation operators and their application to multiple attribute decision making. Fund. Inform. 2018, 157, 271–320. [Google Scholar] [CrossRef]
- Jana, C.; Pal, M. Assessment of enterprise performance based on picture fuzzy hamacher aggregation operators. Symmetry 2019, 11, 75. [Google Scholar] [CrossRef]
- Liu, P.; Zhang, X. A novel picture fuzzy linguistic aggregation operator and its application to group decision-making. Cogn. Comput. 2018, 10, 242–259. [Google Scholar] [CrossRef]
- Wang, R.; Wang, J.; Gao, H.; Wei, G. Methods for MADM with picture fuzzy Muirhead mean operators and their application for evaluating the financial investment risk. Symmetry 2019, 11, 6. [Google Scholar] [CrossRef]
- Dutta, P. Medical diagnosis based on distance measures between picture fuzzy sets. Int. J. Fuzzy Syst. Appl. 2018, 7, 15–36. [Google Scholar] [CrossRef]
- Wang, L.; Peng, J.J.; Wang, J.Q. A multi-criteria decision-making framework for risk ranking of energy performance contracting project under picture fuzzy environment. J. Clean. Prod. 2018, 191, 105–118. [Google Scholar] [CrossRef]
- Xu, Z.S.; Da, Q.L. An overview of operators for aggregating information. Int. J. Intell. Syst. 2003, 18, 953–969. [Google Scholar] [CrossRef]
- Singh, A.; Kumari, S.; Malekpoor, H.; Mishra, N. Big data cloud computing framework for low carbon supplier selection in the beef supply chain. J. Clean. Prod. 2018, 202, 139–149. [Google Scholar] [CrossRef]
- Bai, C.; Kusi-Sarpong, S.; Badri Ahmadi, H.; Sarkis, J. Social sustainable supplier evaluation and selection: A group decision-support approach. Int. J. Prod. Res. 2019. [Google Scholar] [CrossRef]
- Dos Santos, B.M.; Godoy, L.P.; Campos, L.M.S. Performance evaluation of green suppliers using entropy-TOPSIS-F. J. Clean. Prod. 2019, 207, 498–509. [Google Scholar] [CrossRef]
- Guarnieri, P.; Trojan, F. Decision making on supplier selection based on social, ethical, and environmental criteria: A study in the textile industry. Resour. Conserv. Recycl. 2019, 141, 347–361. [Google Scholar] [CrossRef]
- Liu, H.C.; Quan, M.Y.; Li, Z.; Wang, Z.L. A new integrated MCDM model for sustainable supplier selection under interval-valued intuitionistic uncertain linguistic environment. Inf. Sci. 2019, 486, 254–270. [Google Scholar] [CrossRef]
- Liu, Y.; Eckert, C.; Yannou-Le Bris, G.; Petit, G. A fuzzy decision tool to evaluate the sustainable performance of suppliers in an agrifood value chain. Comput. Ind. Eng. 2019, 127, 196–212. [Google Scholar] [CrossRef]
- Lu, Z.; Sun, X.; Wang, Y.; Xu, C. Green supplier selection in straw biomass industry based on cloud model and possibility degree. J. Clean. Prod. 2019, 209, 995–1005. [Google Scholar] [CrossRef]
- Xu, Z.; Qin, J.; Liu, J.; Martínez, L. Sustainable supplier selection based on AHPSort II in interval type-2 fuzzy environment. Inf. Sci. 2019, 483, 273–293. [Google Scholar] [CrossRef]
- Fahimnia, B.; Sarkis, J.; Davarzani, H. Green supply chain management: A review and bibliometric analysis. Int. J. Prod. Econ. 2015, 162, 101–114. [Google Scholar] [CrossRef]
- Govindan, K.; Rajendran, S.; Sarkis, J.; Murugesan, P. Multi criteria decision making approaches for green supplier evaluation and selection: A literature review. J. Clean. Prod. 2015, 98, 66–83. [Google Scholar] [CrossRef]
- Malviya, R.K.; Kant, R. Green supply chain management (GSCM): A structured literature review and research implications. Benchmarking 2015, 22, 1360–1394. [Google Scholar] [CrossRef]
- Li, D.X.; Dong, H.; Jin, X. Model for evaluating the enterprise marketing capability with picture fuzzy information. J. Intell. Fuzzy Syst. 2017, 33, 3255–3263. [Google Scholar] [CrossRef]
- Wang, W.; Xin, X. Distance measure between intuitionistic fuzzy sets. Pattern. Recogn. Lett. 2005, 26, 2063–2069. [Google Scholar] [CrossRef]
- Wei, G. Picture fuzzy aggregation operators and their application to multiple attribute decision making. J. Intell. Fuzzy Syst. 2017, 33, 713–724. [Google Scholar] [CrossRef]
- Yager, R.R. On ordered weighted averaging aggregation operators in multicriteria decisionmaking. IEEE Trans. Syst. Man Cybern. 1988, 18, 183–190. [Google Scholar] [CrossRef]
- Merigó, J.M.; Gil-Lafuente, A.M. On the use of the OWA operator in the Euclidean distance. Int. J. Comput. Sci. Eng. 2008, 2, 170–176. [Google Scholar]
- Liu, P.; Liu, X. Multi-attribute group decision-making method based on cloud distance operators with linguistic information. Int. J. Fuzzy Syst. 2017, 19, 1011–1024. [Google Scholar] [CrossRef]
- Merigó, J.M.; Palacios-Marqués, D.; Soto-Acosta, P. Distance measures, weighted averages, OWA operators and Bonferroni means. Appl. Soft Comput. 2017, 50, 356–366. [Google Scholar] [CrossRef]
- Brauers, W.K.M.; Zavadskas, E.K. Project management by MULTIMOORA as an instrument for transition economies. Tech. Econ. Dev. 2010, 16, 5–24. [Google Scholar] [CrossRef]
Figure 1.
Rankings of suppliers by the compared methods.


Table 1.
Linguistic terms for assessing the alternatives.
| Linguistic Terms | Picture Fuzzy Numbers (PFNs) |
|---|---|
| Very Poor (VP) | <0.10, 0.00, 0.85> |
| Poor (P) | <0.25, 0.05, 0.60> |
| Moderately Poor (MP) | <0.30, 0.00, 0.60> |
| Fair (F) | <0.50, 0.10, 0.40> |
| Moderately Good (MG) | <0.60, 0.00, 0.30> |
| Good (G) | <0.75, 0.05, 0.10> |
| Very good (VG) | <0.90, 0.00, 0.05> |
Table 2.
Linguistic evaluation matrixes of the decision makers.
| Criteria | Decision Makers | Alternatives | |||||||||
|---|---|---|---|---|---|---|---|---|---|---|---|
| A1 | A2 | A3 | A4 | A5 | A6 | A7 | A8 | A9 | A10 | ||
| C1 | DM1 | VG | F | P | MG | F | G | MP | P | P | MG |
| DM2 | VG | MG | MG | MG | MG | G | F | VG | MG | MG | |
| DM3 | VG | F | G | MG | VG | G | G | VG | F | G | |
| C2 | DM1 | MP | G | P | F | VG | F | MP | G | F | MP |
| DM2 | MP | G | MP | F | VG | MP | MP | MG | MP | F | |
| DM3 | MP | G | F | F | VG | P | MP | F | P | MG | |
| C3 | DM1 | VG | F | MG | VG | VG | G | MP | F | MP | MG |
| DM2 | VG | F | G | G | G | G | F | MG | F | MG | |
| DM3 | VG | F | VG | MG | G | G | MG | G | MG | MG | |
| C4 | DM1 | G | MG | MG | P | P | G | P | P | MG | VG |
| DM2 | G | G | MG | P | P | G | MP | MP | G | VG | |
| DM3 | G | VG | MG | P | MP | G | F | F | VG | VG | |
| C5 | DM1 | G | VG | G | VG | VP | VG | P | P | MG | VG |
| DM2 | VG | VG | MG | G | P | VG | P | P | MG | VG | |
| DM3 | VG | VG | F | VG | MP | VG | MP | P | MG | VG | |
| C6 | DM1 | MP | G | MG | VG | G | F | MP | VG | F | VG |
| DM2 | F | MG | MG | G | G | MG | F | G | F | VG | |
| DM3 | MG | F | MG | VG | G | G | MG | MG | F | VG | |
| C7 | DM1 | F | F | P | MP | F | F | F | F | F | P |
| DM2 | F | F | MP | F | F | MP | MP | MP | F | F | |
| DM3 | F | MP | F | MP | P | F | F | F | F | F | |
Table 3.
Picture fuzzy evaluation matrix of DM1.
| Alternatives | Criteria | ||||||
|---|---|---|---|---|---|---|---|
| C1 | C2 | C3 | C4 | C5 | C6 | C7 | |
| A1 | <0.90,0.00,0.05> | <0.30,0.00,0.60> | <0.90,0.00,0.05> | <0.75,0.05,0.10> | <0.75,0.05,0.10> | <0.30,0.00,0.60> | <0.50,0.10,0.40> |
| A2 | <0.25,0.05,0.60> | <0.75,0.05,0.10> | <0.50,0.10,0.40> | <0.25,0.05,0.60> | <0.25,0.05,0.60> | <0.90,0.00,0.05> | <0.50,0.10,0.40> |
| A3 | <0.25,0.05,0.60> | <0.25,0.05,0.60> | <0.60,0.00,0.30> | <0.60,0.00,0.30> | <0.75,0.05,0.10> | <0.60,0.00,0.30> | <0.25,0.05,0.60> |
| A4 | <0.50,0.10,0.40> | <0.75,0.05,0.10> | <0.50,0.10,0.40> | <0.60,0.00,0.30> | <0.90,0.00,0.05> | <0.75,0.05,0.10> | <0.50,0.10,0.40> |
| A5 | <0.50,0.10,0.40> | <0.90,0.00,0.05> | <0.90,0.00,0.05> | <0.25,0.05,0.60> | <0.10,0.00,0.85> | <0.75,0.05,0.10> | <0.50,0.10,0.40> |
| A6 | <0.75,0.05,0.10> | <0.50,0.10,0.40> | <0.75,0.05,0.10> | <0.75,0.05,0.10> | <0.90,0.00,0.05> | <0.50,0.10,0.40> | <0.50,0.10,0.40> |
| A7 | <0.25,0.05,0.60> | <0.50,0.10,0.40> | <0.30,0.00,0.60> | <0.60,0.00,0.30> | <0.60,0.00,0.30> | <0.50,0.10,0.40> | <0.50,0.10,0.40> |
| A8 | <0.90,0.00,0.05> | <0.50,0.10,0.40> | <0.90,0.00,0.05> | <0.25,0.05,0.60> | <0.90,0.00,0.05> | <0.90,0.00,0.05> | <0.30,0.00,0.60> |
| A9 | <0.30,0.00,0.60> | <0.30,0.00,0.60> | <0.30,0.00,0.60> | <0.25,0.05,0.60> | <0.25,0.05,0.60> | <0.30,0.00,0.60> | <0.50,0.10,0.40> |
| A10 | <0.60,0.00,0.30> | <0.30,0.00,0.60> | <0.60,0.00,0.30> | <0.90,0.00,0.05> | <0.90,0.00,0.05> | <0.90,0.00,0.05> | <0.25,0.05,0.60> |
Table 4.
Collective picture fuzzy evaluation matrix .
| Alternatives | Criteria | ||||||
|---|---|---|---|---|---|---|---|
| C1 | C2 | C3 | C4 | C5 | C6 | C7 | |
| A1 | <0.9,0,0.05> | <0.3,0,0.6> | <0.9,0,0.05> | <0.75,0.05,0.1> | <0.868,0,0.062> | <0.483,0,0.414> | <0.5,0.1,0.4> |
| A2 | <0.543,0,0.357> | <0.75,0.05,0.1> | <0.5,0.1,0.4> | <0.781,0,0.113> | <0.9,0,0.05> | <0.629,0,0.235> | <0.447,0,0.452> |
| A3 | <0.581,0,0.266> | <0.354,0,0.531> | <0.781,0,0.113> | <0.6,0,0.3> | <0.629,0,0.235> | <0.6,0,0.3> | <0.354,0,0.531> |
| A4 | <0.6,0,0.3> | <0.5,0.1,0.4> | <0.781,0,0.113> | <0.25,0.05,0.6> | <0.9,0,0.05> | <0.9,0,0.05> | <0.388,0,0.51> |
| A5 | <0.718,0,0.191> | <0.9,0,0.05> | <0.81,0,0.081> | <0.265,0,0.6> | <0.224,0,0.666> | <0.75,0.05,0.1> | <0.435,0.081,0.452> |
| A6 | <0.75,0.05,0.1> | <0.354,0,0.531> | <0.75,0.05,0.1> | <0.75,0.05,0.1> | <0.9,0,0.05> | <0.629,0,0.235> | <0.428,0,0.47> |
| A7 | <0.551,0,0.298> | <0.3,0,0.6> | <0.483,0,0.414> | <0.354,0,0.531> | <0.265,0,0.6> | <0.483,0,0.414> | <0.428,0,0.47> |
| A8 | <0.817,0,0.105> | <0.629,0,0.235> | <0.629,0,0.235> | <0.354,0,0.531> | <0.25,0.05,0.6> | <0.781,0,0.113> | <0.428,0,0.47> |
| A9 | <0.484,0,0.403> | <0.354,0,0.531> | <0.483,0,0.414> | <0.781,0,0.113> | <0.6,0,0.3> | <0.5,0.1,0.4> | <0.5,0.1,0.4> |
| A10 | <0.653,0,0.216> | <0.483,0,0.414> | <0.6,0,0.3> | <0.9,0,0.05> | <0.9,0,0.05> | <0.9,0,0.05> | <0.435,0.081,0.452> |
| <0.9,0,0.05> | <0.9,0,0.05> | <0.9,0,0.05> | <0.9,0,0.05> | <0.9,0,0.05> | <0.781,0,0.113> | <0.354,0,0.531> | |
| <0.551,0,0.298> | <0.354,0,0.531> | <0.483,0,0.414> | <0.354,0,0.531> | <0.224,0,0.666> | <0.483,0,0.414> | <0.5,0.1,0.4> | |
Table 5.
Results with picture fuzzy Hamming operators.
| Distance Operators | Ranking Indexes | Alternatives | |||||||||
|---|---|---|---|---|---|---|---|---|---|---|---|
| A1 | A2 | A3 | A4 | A5 | A6 | A7 | A8 | A9 | A10 | ||
| Picture fuzzy normalized Hamming standardized distance (PFNHSD) | S | 0.489 | 0.497 | 0.539 | 0.527 | 0.532 | 0.41 | 0.905 | 0.521 | 0.877 | 0.464 |
| R | 0.157 | 0.154 | 0.143 | 0.170 | 0.166 | 0.143 | 0.157 | 0.143 | 0.183 | 0.109 | |
| Q | 0.401 | 0.390 | 0.357 | 0.528 | 0.506 | 0.227 | 0.822 | 0.339 | 0.971 | 0.054 | |
| Picture fuzzy-weighted Hamming standardized distance (PFWHSD) | S | 0.494 | 0.518 | 0.521 | 0.497 | 0.533 | 0.392 | 0.882 | 0.478 | 0.913 | 0.472 |
| R | 0.171 | 0.174 | 0.156 | 0.146 | 0.140 | 0.103 | 0.171 | 0.135 | 0.220 | 0.120 | |
| Q | 0.389 | 0.425 | 0.349 | 0.285 | 0.294 | 0.000 | 0.762 | 0.218 | 1.000 | 0.151 | |
| Picture fuzzy-ordered weighted standardized distance (PFOWSD) | S | 0.449 | 0.477 | 0.507 | 0.493 | 0.50 | 0.391 | 0.866 | 0.490 | 0.832 | 0.418 |
| R | 0.165 | 0.162 | 0.150 | 0.179 | 0.174 | 0.15 | 0.165 | 0.150 | 0.193 | 0.115 | |
| Q | 0.383 | 0.393 | 0.349 | 0.517 | 0.497 | 0.227 | 0.822 | 0.331 | 0.964 | 0.029 | |
| Hybrid Picture Fuzzy-Ordered Weighted Standardized Distance (HPFOWSD) | S | 0.468 | 0.491 | 0.489 | 0.468 | 0.489 | 0.368 | 0.853 | 0.454 | 0.862 | 0.436 |
| R | 0.180 | 0.183 | 0.163 | 0.153 | 0.147 | 0.108 | 0.180 | 0.141 | 0.231 | 0.126 | |
| Q | 0.392 | 0.428 | 0.347 | 0.286 | 0.281 | 0.000 | 0.782 | 0.222 | 1.000 | 0.143 | |
Table 6.
Results with picture fuzzy Euclidean operators.
| Distance Operators | Ranking Indexes | Alternatives | |||||||||
|---|---|---|---|---|---|---|---|---|---|---|---|
| A1 | A2 | A3 | A4 | A5 | A6 | A7 | A8 | A9 | A10 | ||
| Picture fuzzy-normalized Euclidean standardized distance (PFNESD) | S | 0.685 | 0.625 | 0.629 | 0.664 | 0.669 | 0.498 | 0.940 | 0.626 | 0.95 | 0.560 |
| R | 0.415 | 0.408 | 0.378 | 0.450 | 0.439 | 0.378 | 0.415 | 0.378 | 0.485 | 0.307 | |
| Q | 0.510 | 0.422 | 0.343 | 0.585 | 0.560 | 0.199 | 0.792 | 0.340 | 1.000 | 0.068 | |
| Picture fuzzy-weighted Euclidean standardized distance (PFWESD) | S | 0.69 | 0.640 | 0.616 | 0.632 | 0.654 | 0.468 | 0.922 | 0.592 | 0.98 | 0.560 |
| R | 0.414 | 0.422 | 0.377 | 0.405 | 0.396 | 0.321 | 0.414 | 0.360 | 0.531 | 0.292 | |
| Q | 0.471 | 0.439 | 0.322 | 0.398 | 0.399 | 0.060 | 0.697 | 0.263 | 1.000 | 0.090 | |
| picture fuzzy Euclidean-ordered weighted standardized distance (PFEOWSD) | S | 0.663 | 0.624 | 0.617 | 0.649 | 0.659 | 0.495 | 0.912 | 0.615 | 0.922 | 0.531 |
| R | 0.426 | 0.418 | 0.387 | 0.461 | 0.45 | 0.387 | 0.426 | 0.387 | 0.497 | 0.296 | |
| Q | 0.518 | 0.454 | 0.370 | 0.591 | 0.576 | 0.227 | 0.810 | 0.367 | 1.000 | 0.043 | |
| Hybrid Picture Fuzzy Euclidean-Ordered Weighted Standardized Distance (HPFEOWSD) | S | 0.706 | 0.658 | 0.605 | 0.607 | 0.625 | 0.442 | 0.901 | 0.558 | 0.997 | 0.553 |
| R | 0.464 | 0.471 | 0.422 | 0.396 | 0.380 | 0.279 | 0.464 | 0.365 | 0.595 | 0.326 | |
| Q | 0.529 | 0.498 | 0.372 | 0.333 | 0.323 | 0.000 | 0.706 | 0.240 | 1.000 | 0.175 | |
Table 7.
Ranking results with the PFOWD-VIKOR model.
| Distance Operators | Ranking | Distance Operators | Ranking |
|---|---|---|---|
| PFNHSD | PFNESD | ||
| PFWHSD | PFWESD | ||
| PFOWSD | PFEOWSD | ||
| HPFOWSD | HPFEOWSD |
© 2019 by the authors. Licensee MDPI, Basel, Switzerland. This article is an open access article distributed under the terms and conditions of the Creative Commons Attribution (CC BY) license (http://creativecommons.org/licenses/by/4.0/).
Share and Cite
MDPI and ACS Style
Meksavang, P.; Shi, H.; Lin, S.-M.; Liu, H.-C. An Extended Picture Fuzzy VIKOR Approach for Sustainable Supplier Management and Its Application in the Beef Industry. Symmetry 2019, 11, 468. https://doi.org/10.3390/sym11040468
AMA Style
Meksavang P, Shi H, Lin S-M, Liu H-C. An Extended Picture Fuzzy VIKOR Approach for Sustainable Supplier Management and Its Application in the Beef Industry. Symmetry. 2019; 11(4):468. https://doi.org/10.3390/sym11040468
Chicago/Turabian StyleMeksavang, Phommaly, Hua Shi, Shu-Min Lin, and Hu-Chen Liu. 2019. "An Extended Picture Fuzzy VIKOR Approach for Sustainable Supplier Management and Its Application in the Beef Industry" Symmetry 11, no. 4: 468. https://doi.org/10.3390/sym11040468
Note that from the first issue of 2016, this journal uses article numbers instead of page numbers. See further details here.