Basketball Action Data Processing Method Based on Mode Symmetric Algorithm

1
Physical Education School, Beijing Sport University, Beijing 100084, China
2
School of Physical Education, Hainan Normal University, Haikou 571158, China
*
Author to whom correspondence should be addressed.
Symmetry 2019, 11(4), 560; https://doi.org/10.3390/sym11040560
Submission received: 15 January 2019
/
Revised: 27 March 2019
/
Accepted: 28 March 2019
/
Published: 18 April 2019
(This article belongs to the Special Issue New Trends in Dynamics)
Abstract
:In the course of basketball training, a large number of basketball action data are generated according to the athletes’ body movements. Due to the low precision of the basketball action data processed by the traditional method in basketball technical training, basketball action processing is not in place. The basketball motion data processing method, based on the mode symmetric algorithm was studied. The basketball motion detection algorithm based on symmetric difference and background reduction was used to remove the background influence of basketball movement and obtain the binary basketball action target image containing the data. On this basis, the pole symmetric mode decomposition (ESMD) method was used to modally decompose the binary basketball action target image containing the data, and the least squares method was used to optimize the elliptic (AGM) curve to realize the screening of basketball action modal data. Through the cleaning and integration of basketball action modal data, integration and data reduction basketball action modal data, the data was processed efficiently. The experimental results showed that the proposed method was a high precision and high efficiency basketball action data processing method.
1. Introduction
Along the path of wisdom, a high body, being strong and fierce, proactive, fast, witty, and comprehensive and accurate, the evolution of contemporary basketball is developed in the direction of high acceleration, skill, and wisdom. On the one hand, in a basketball game, due to fierce competition in the arena, coaches and athletes often fail to complete technical and tactics scheduled before a game. Therefore, through the statistics of the game field, various rules can be found to reduce mistakes and win the game. On the other hand, in basketball teaching, training, and competition, circumstances of when technology should be used normally relies on coaches and athletes’ past experiences. In technical basketball training, basic knowledge of technical action is emphasized and the application ability of the athlete to perform the technical action training cannot be ignored. Nowadays, with the information technology revolution changing people’s lifestyles, computer technology is gradually being applied to basketball analysis. In the analysis of basketball technology, the overall data of basketball technical movements is also developing rapidly, and within these basketball databases, only part of the data is worthy of use and reasoning.
Moving target detection extracts the target from the video image stream in real time. As a key technology in video image processing, it not only plays a very important role in basketball, pattern recognition, and video coding, but is also the basis for various follow-up treatments such as basketball action data statistics, target classification, behavior understanding, etc. [1,2].
With a fixed camera, there are two methods for moving target detection: Background subtraction method and time difference method. The background subtraction method separates the foreground from the background according to the motion information to obtain relatively complete information such as the position, size, and shape of the moving target, but when the grayscale difference between the moving target portion and background is not large, the corresponding location may be missed by the detecting method. The results of the time difference and the background subtraction are combined (that is, both the time difference method and the background subtraction method are considered to be the moving targets), to detect the change target, and the moving target is obtained through complicated subsequent processing. However, the premise of using these two methods to detect moving targets is to obtain relatively complete and accurate motion information, which is often difficult to meet in practical situations [3,4]. In order to realize the integration of basketball action mode data and improve the efficiency of basketball action data processing, it is necessary to extract the action image effectively. This paper analyzes basketball action data, detects the basketball action data to be processed, reduces the background influence of basketball, decomposes the basketball movement data mode, and realizes the integration of basketball action pattern data. The basketball motion data processing method based on pattern symmetry algorithm is proposed.
2. Algorithm Definitions
The basketball motion detection algorithm based on symmetrical difference and background reduction was used to detect basketball action data in order to reduce the background influence of basketball. The binary basketball action target image with basketball action data was decomposed by the empirical mode decomposition (EMD) method. The basketball action data that needed to be processed are filtered effectively to realize the selection of basketball action modal data. Through the cleaning and integration of basketball action pattern data, the basketball action data were effectively handled.
2.1. Basketball Action Data Detection Algorithm Based on Symmetric Difference and Background Reduction
2.1.1. Calculation of Symmetric Difference
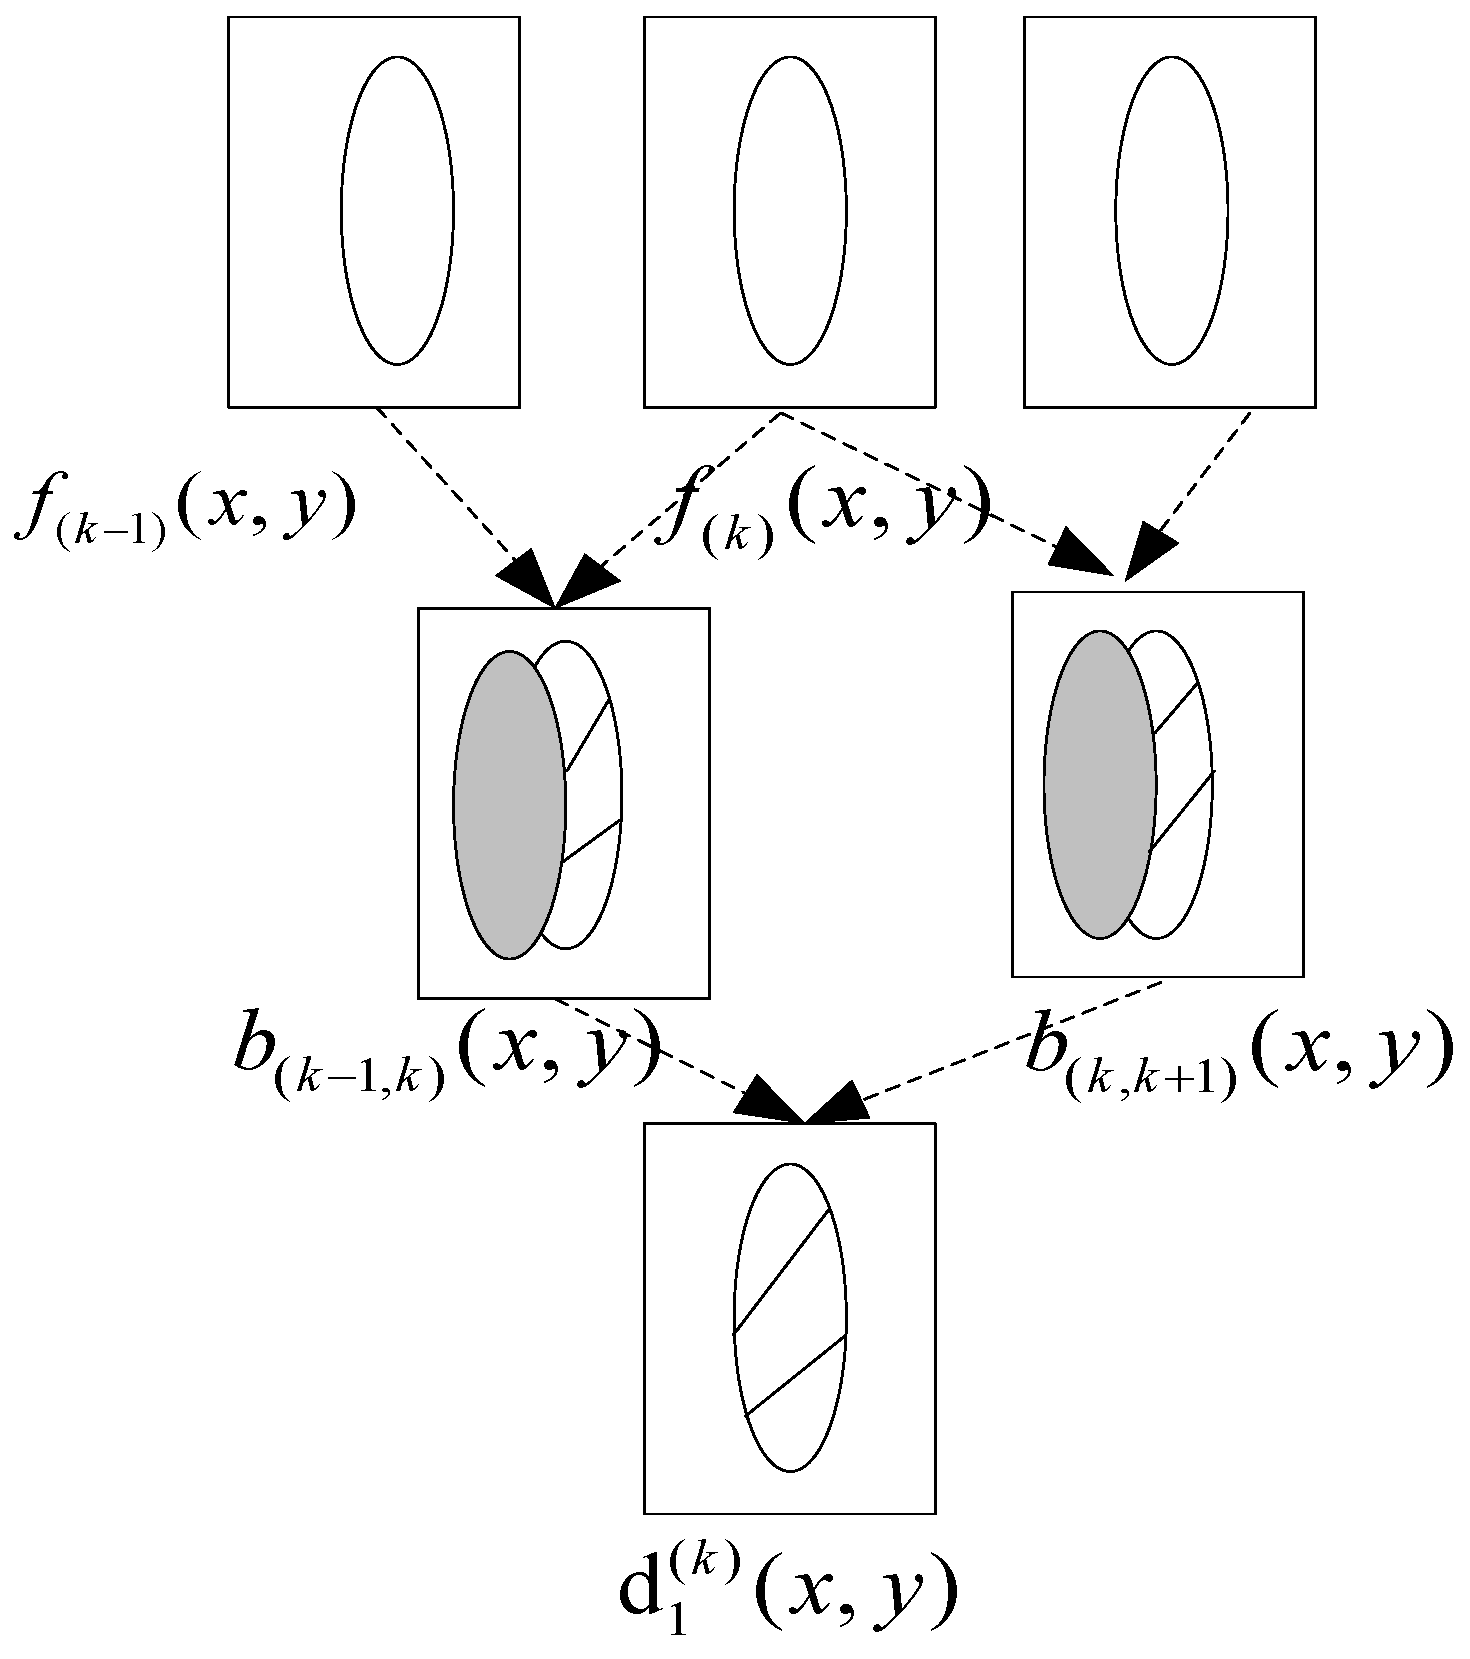
The symmetric differential algorithm removed the effects of the background revealed by basketball and accurately captured the outline of the basketball goal. , , and represents three-frame continuous source basketball action images [5], with the symmetric difference diagram shown in Figure 1, and are a schematic diagram of the binary image obtained by a time difference between every two adjacent frames, wherein the shaded portion indicates the moving human body, and the dotted portion indicates the background revealed by the human basketball movement [6,7,8]. Obviously and contain the background area revealed by the human basketball action, which cannot detect the basketball action in the source image very well. is the result image of the symmetric difference, as is seen from the figure that the symmetric difference can detect the outline of the basketball action. The basic algorithm is embodied in the schematic diagram of symmetric difference, as shown in Figure 1.
In the above figure, the symmetry difference between the two sets belongs to only one set, not to the set of elements of the other set.
(1) The video serial number of the three consecutive basketball action source images are , , and . Calculate absolute difference grayscale images adjacent to the basketball action source image:
where is a window function that suppresses noise. Since the mean filtering will blur the basketball action image [9,10,11] to lose the edge information, the median filter function with window 3*3 is employed to suppress the noise.
(2) Take a threshold for and , respectively, to binarize and obtain two binarized images, and . The logical and operation of and at each pixel position is performed to obtain a binary image of symmetric difference results. The calculation formula is as follows:
In the upper expression, is the pixel value, is the operating frequency.
2.1.2. Background Subtraction Calculation
The basic idea of background reduction is to subtract the current basketball action image from the background image stored in advance or in real time. The pixel with a greater difference than a certain threshold is considered to be the point on the basketball action target [12,13,14,15], otherwise considered to be a background point, which is suitable for detecting a moving target in the case where the background image does not change much with time. By comparing the gray value difference between the current basketball action image and the background image , the foreground image can be obtained. The calculation formula is as follows:
In the upper formula, is the filter value, is the threshold, is the window function for suppressing noise, and median filtering was still used.
2.1.3. Basketball Action Detection
From the symmetric difference to the binarized image , a more accurate outline of the basketball action can be detected, but only some information is included. Since the gray level of the basketball action target is similar to the background gray level [16,17,18], the foreground image obtained by the background subtraction fails to detect the complete motion of the basketball action information, and the missed part of the background subtraction method is in the symmetric difference method. It is just detected, so logically ‘or’ operation of and will result in a complete foreground image at each pixel location:
Due to the influence of noise, some of the residual isolated noise front spots still exists in the image obtained by formula (4), and some parts of the target area may be missed.
In addition, background disturbance, such as the slight shaking of the branches, will also cause this part to be misjudged as a basketball action. The basketball action image can be post-processed through basketball action detection and morphological operations. Firstly, the foreground image is morphologically filtered. In this paper, a circular structural element was used, which is first expanded and then etched (i.e., closed operation) to get the complete area of the basketball action target image, then formula (4) was used to connect the connected areas in order to calculate the current foreground image so as to summarize the size of each independent foreground area. In general, a pixel with less than 8 connected areas can be considered as noise-caused areas with less than 8 pixels, and finally the area filling algorithm is used to fill the small holes in the target area [19]. Only the binary basketball action target image containing the basketball action target data is left.
2.2. Pole Symmetric Mode Decomposition (ESMD) and Basketball Action Modal Data Generation
The EMD method decomposes a nonlinear non-stationary signal into a number of Intrinsic Mode Functions (IMFs), where each intrinsic mode function is a time-scale local feature signal containing the original signal.
The EMD decomposition method is based on the following assumptions: (1) The basketball action data has at least two extreme values, a maximum value and a minimum value; (2) the local time domain characteristics of the data are determined by the time scale between the extreme points; and (3) if there is no extreme point in the basketball action data but there is an inflection point, the extreme value can be obtained by deriving the data one or more times [20], and then the decomposition result is obtained by integration. The essence of the EMD method is to decompose the data by the time scale feature of the data itself in order to obtain the basketball action mode data. This decomposition process is called data sifting.
The ESMD method is an improvement based on the EMD method and is expressed in the following aspects:
- The maximum and minimum values of the original basketball action data are separated because in the ESMD algorithm, adjacent equal extremes are treated as one point;
- The ESMD method proposes decomposition methods for optimal data screening times and determines the suspension criteria;
- The ESMD method can obtain a better adaptive global mean (AGM) curve and optimize the AGM curve by least squares to optimize the number of data screenings.
The specific algorithm flow is as follows:
- Find the midpoint of all adjacent extreme points of the original basketball action data [21], and add the boundary midpoints of the left and right sides;
- Using the midpoints of the above extreme points, construct p difference curves and calculate the mean curves ;
- Subtract the mean envelope from the original basketball action sequence to obtain a new sequence , as shown in Equation (5):
- Verify if the new sequence satisfies the following two conditions: (allowed to be an error); the number of data screenings reaches the expected maximum , and if the above two conditions are met, it is treated as a mode, otherwise, is set as the original data to iterate the above three steps until the above two conditions are met;
- With , as the maximum fixed number, repeat the above four steps until the last residual amount has no more than a fixed number of extremes;
- Change the value of the expected maximum value of the number of screenings, repeat the above five steps, calculate the variance of , and plot the relationship between and , where is the standard deviation of ;
- According to the minimum value of , find and then repeat the previous six steps through to output the entire mode. Then, the last residual is an optimized AGM curve.
The following two sets of basketball action data are representative of the two sets of representative basketball action data after a large number of ESMD method decomposition experiments and a large number of statistical analysis of the mode frequency and amplitude data obtained by the decomposition [22]. It is separately performed ESMD decomposition for these two sets of data.
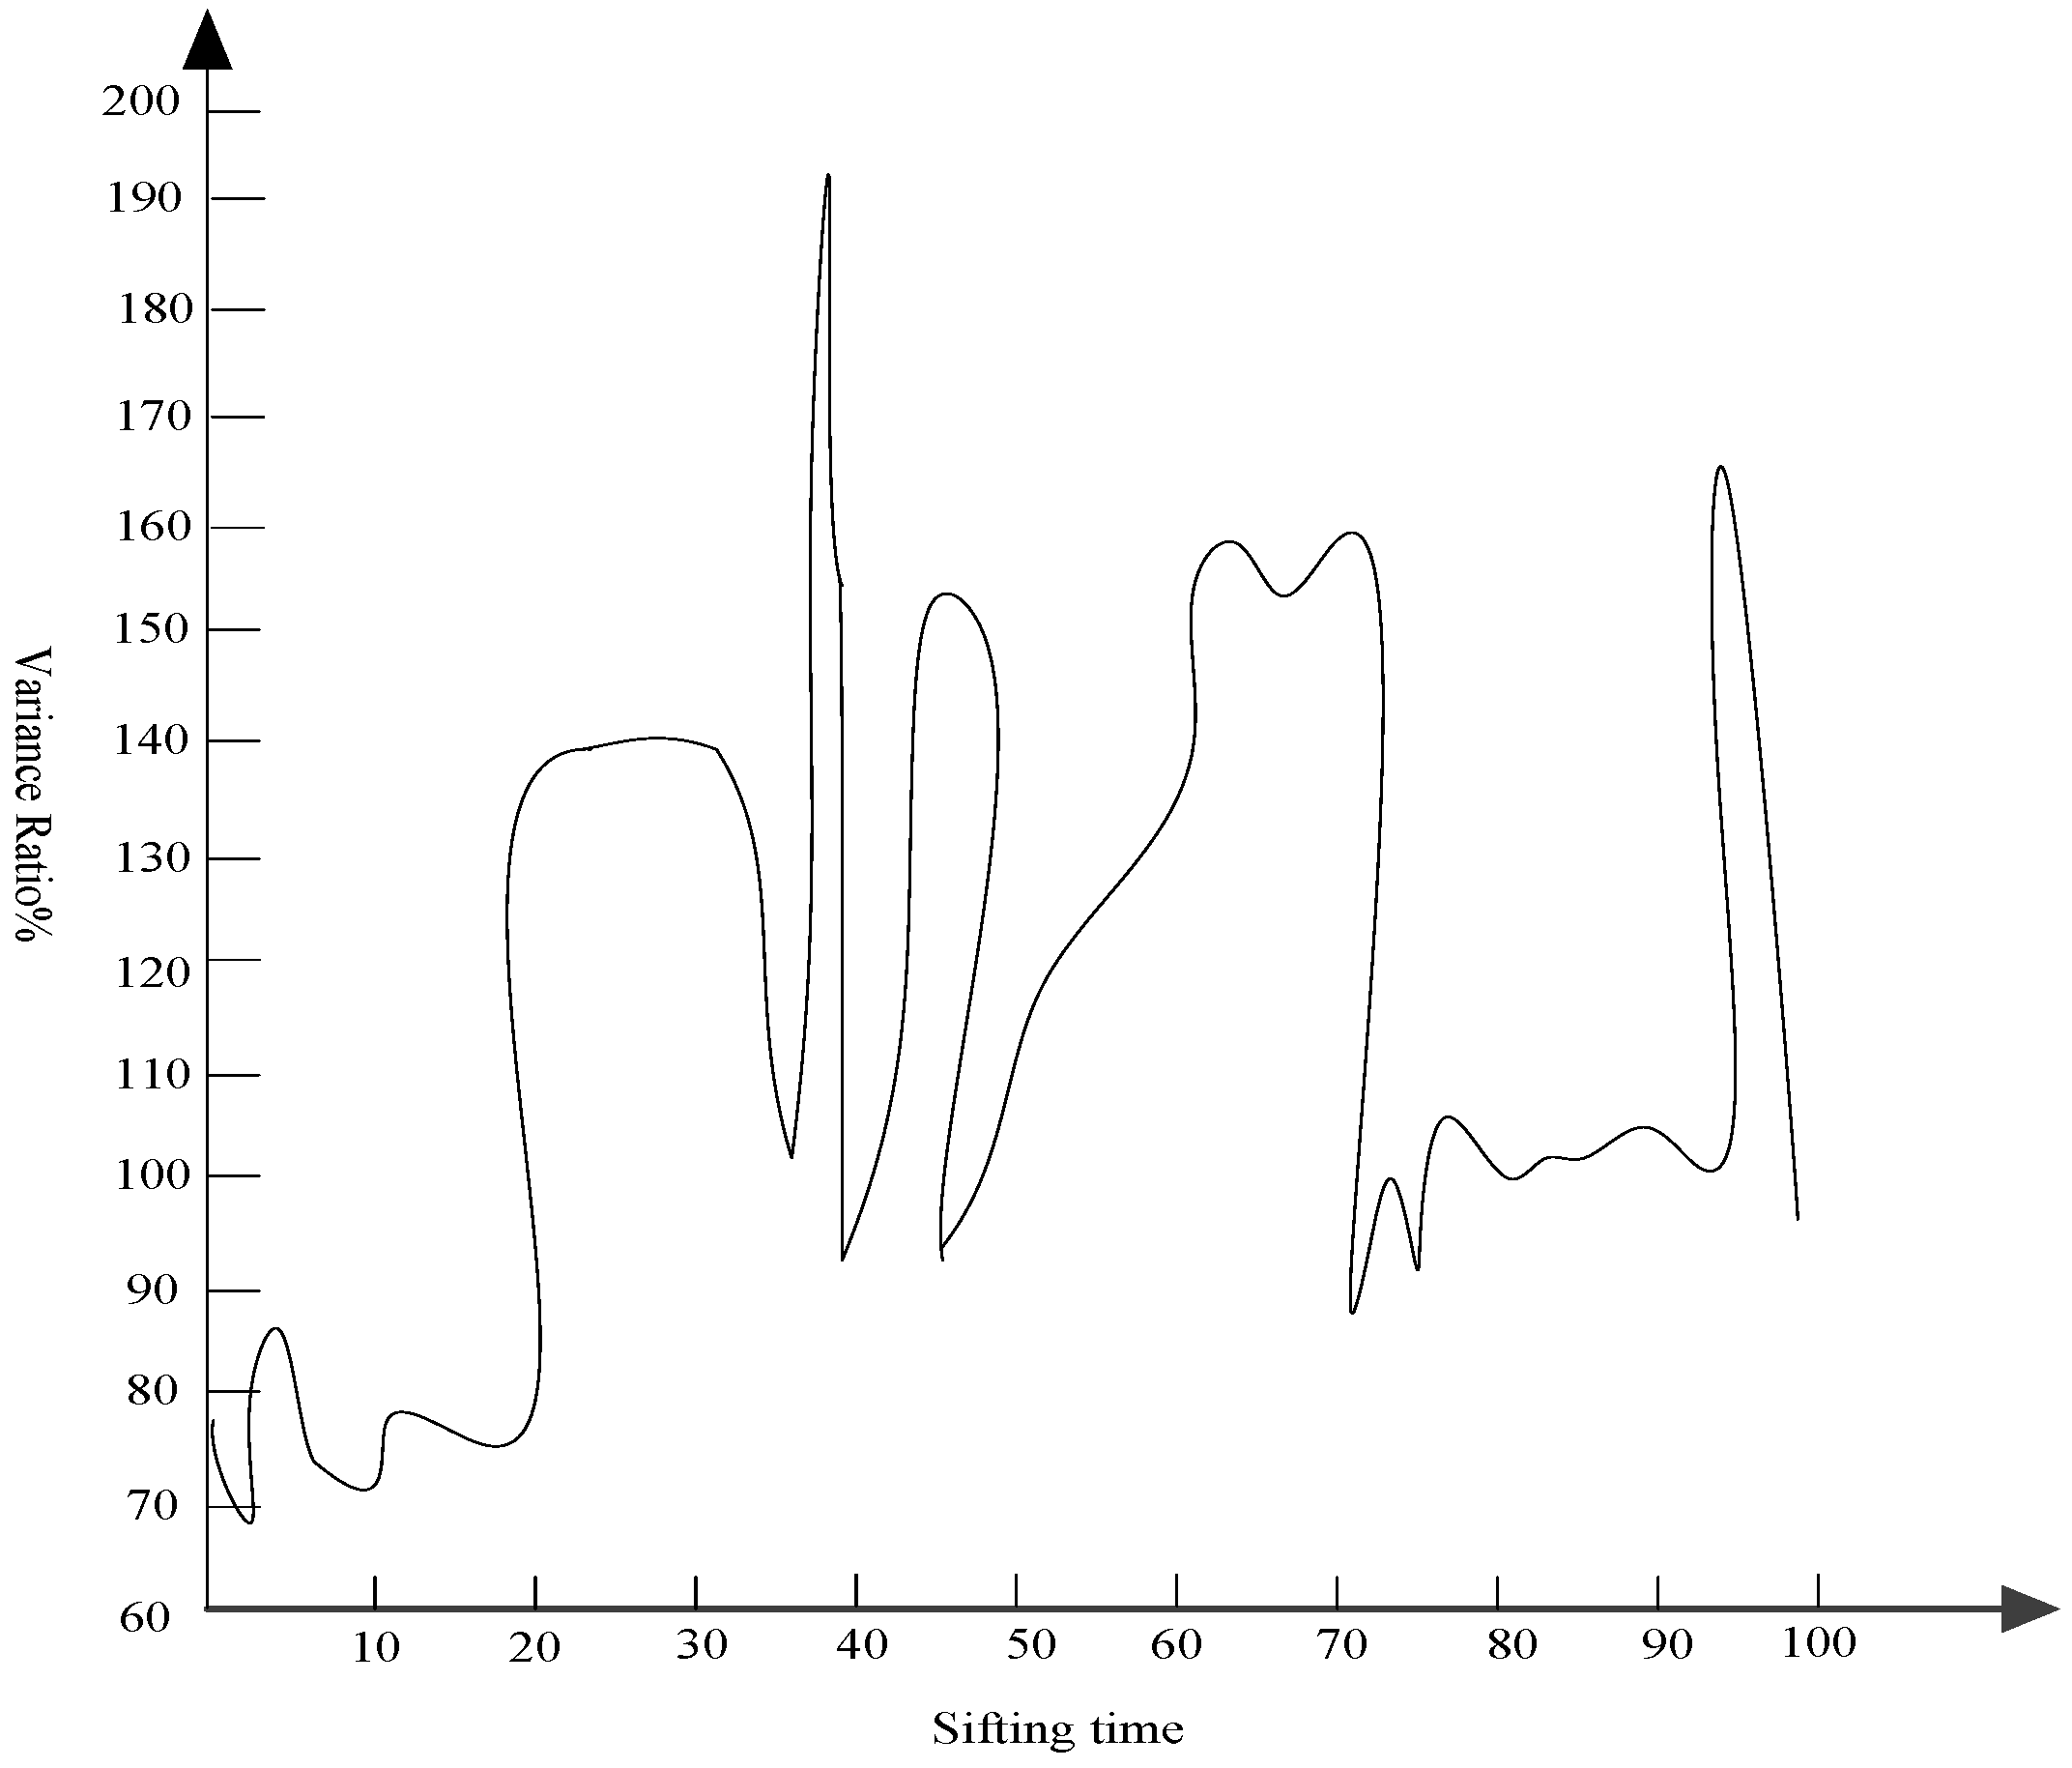
The ESMD method is used to perform the modal decomposition experiment on the basketball action data (the basketball action data observed on a fixed platform with a sampling frequency of 20 Hz). The specific modal decomposition variance ratio varies with the maximum number of data screening times as shown in Figure 2:
It can be seen from Figure 2 that the optimal number of screenings is three, which corresponds to the minimum variance ratio. Similarly, the mode decomposition is optimal at this time, and then the basketball action modal data is processed in detail.
2.3. Basketball Action Mode Data Processing
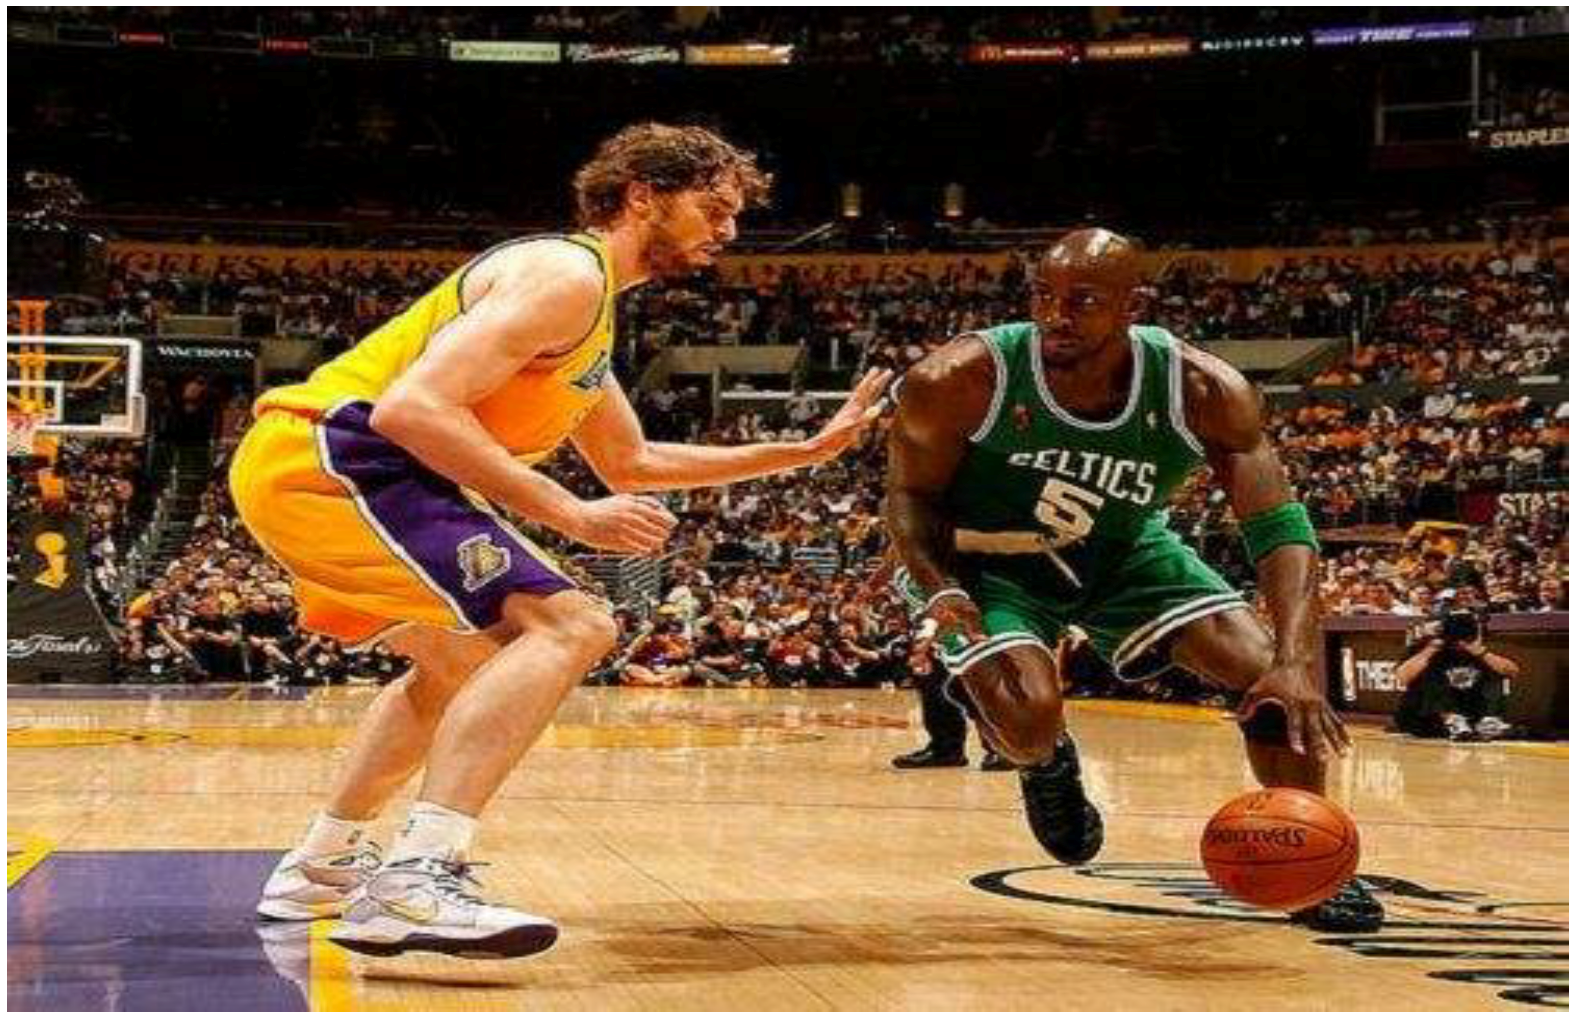
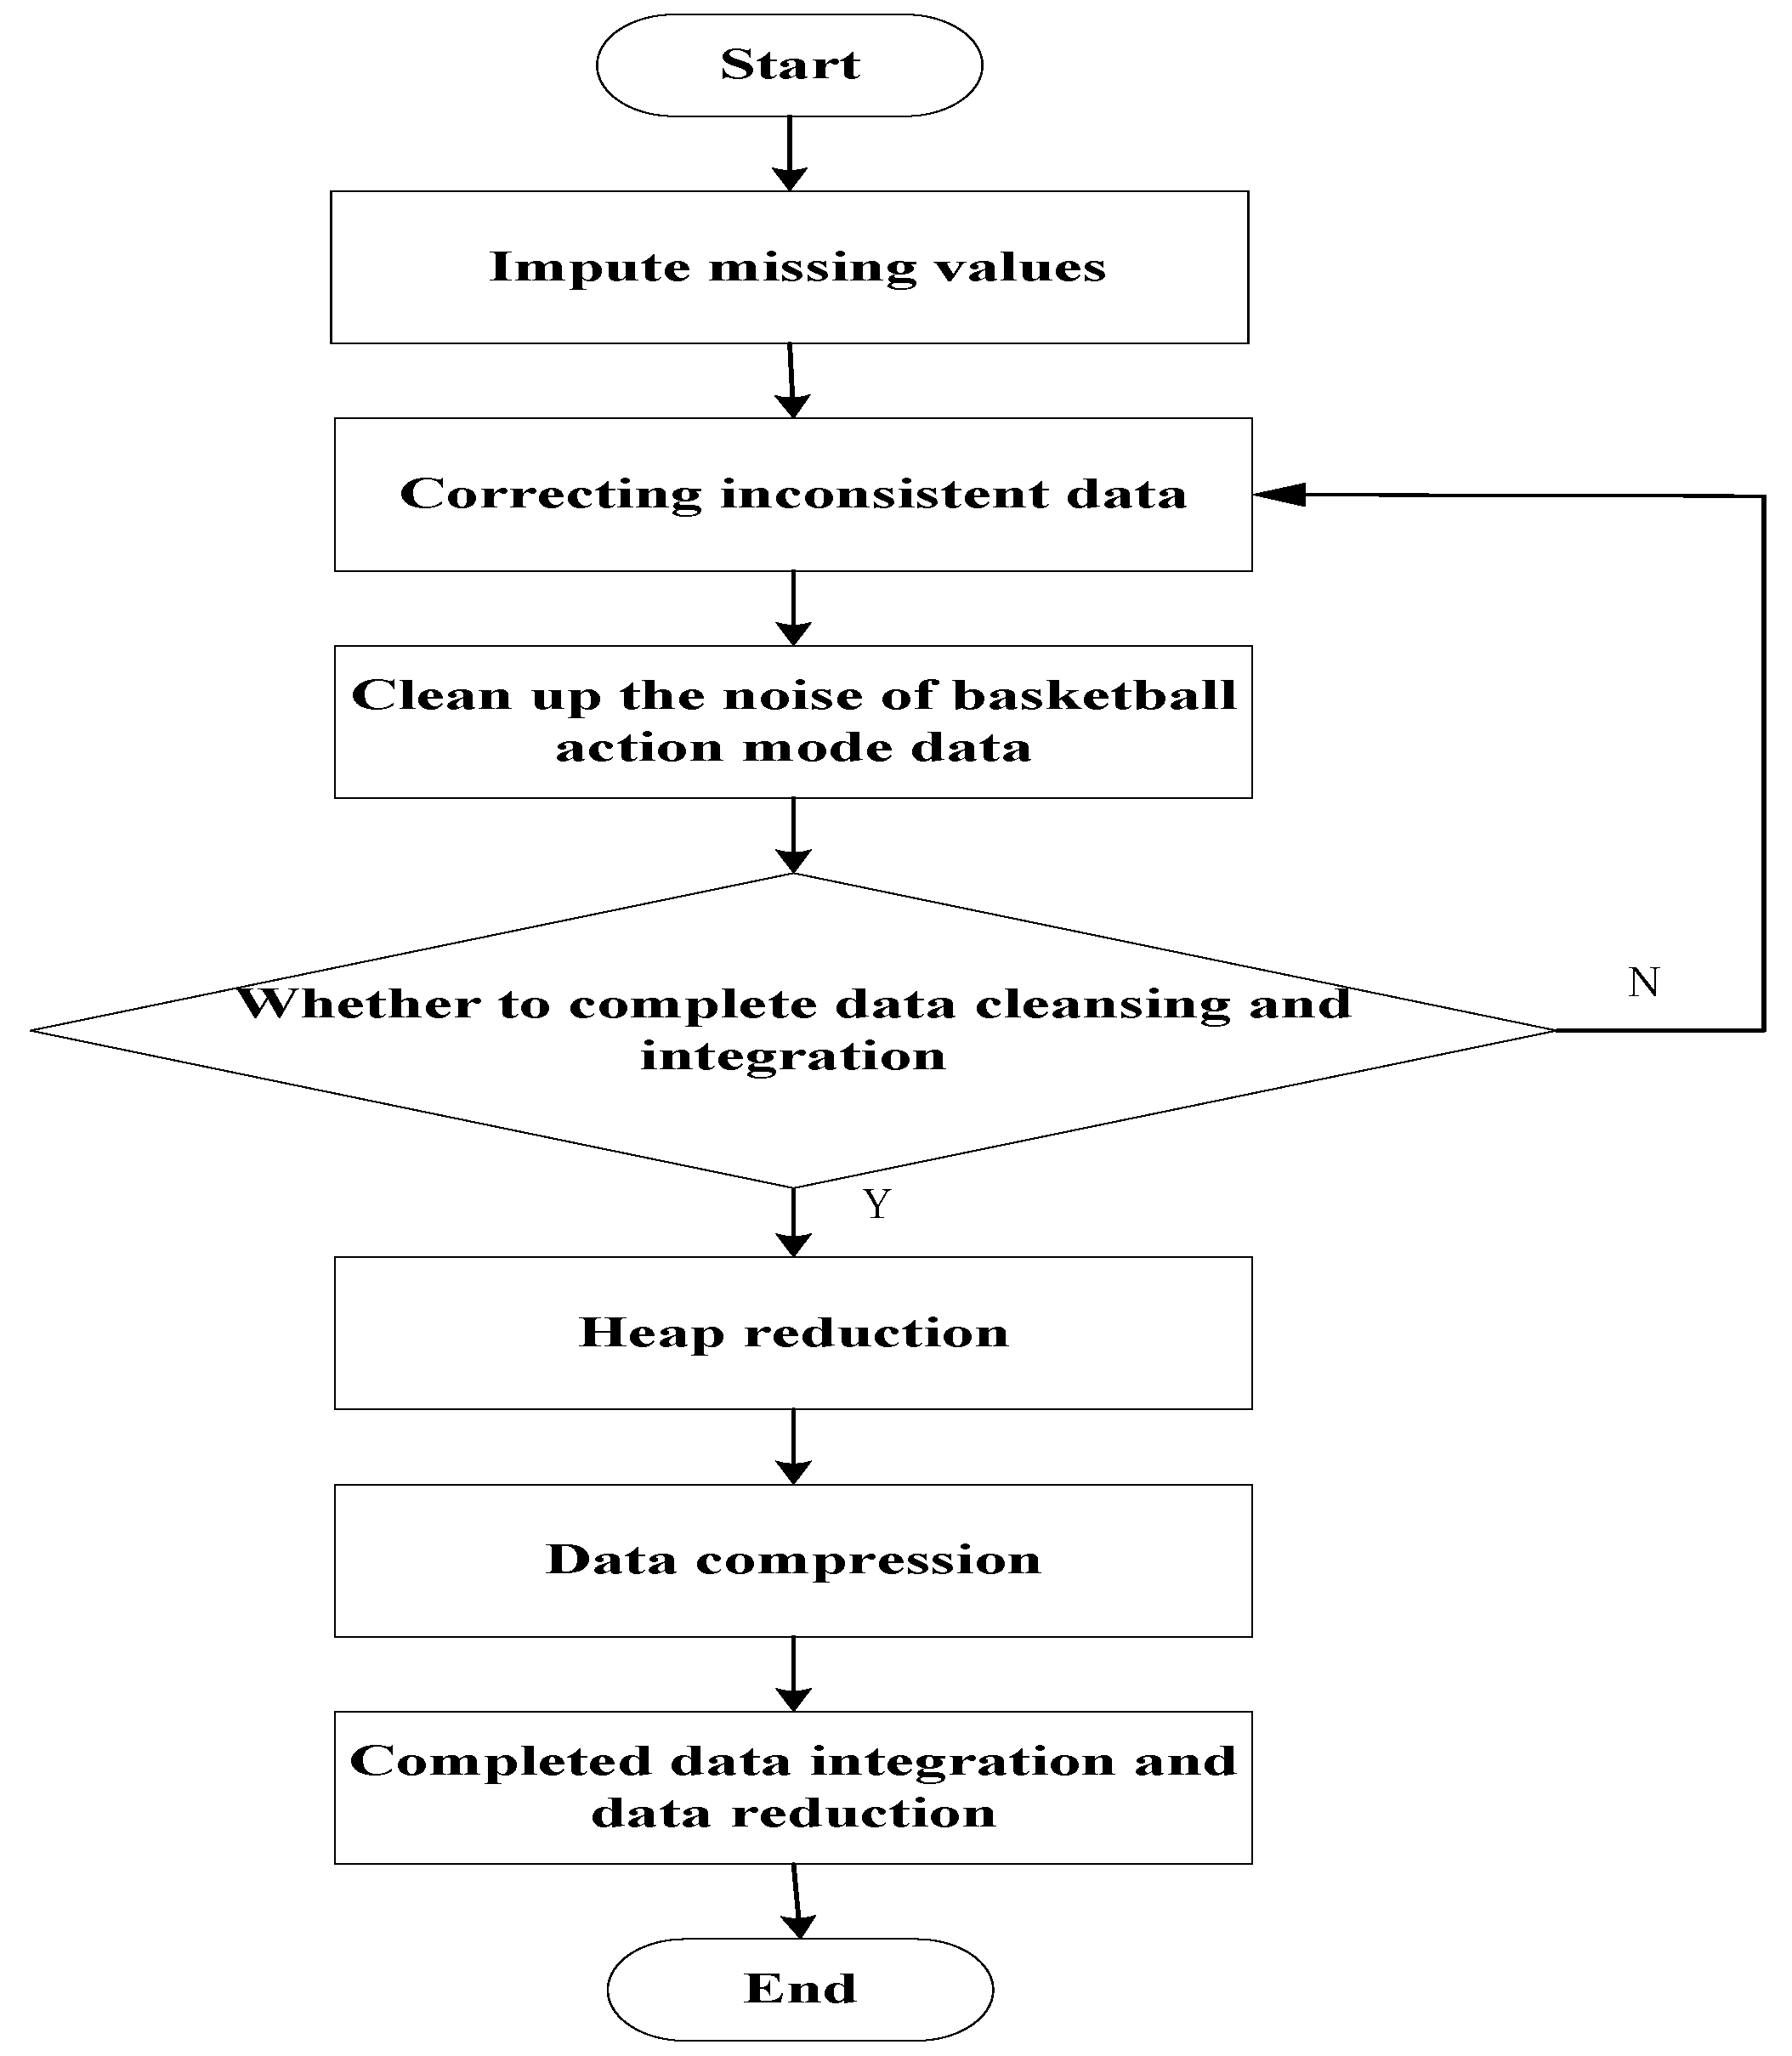
The data processing of basketball action mode was divided into two steps. Firstly, the data of basketball action mode was cleaned and integrated. After the data of basketball action mode was cleaned and integrated, the data of basketball action mode was integrated and reduced. Figure 3 shows a picture of basketball action. Figure 4 is a data processing flow chart of basketball action mode.
2.3.1. Cleaning and Integration of Basketball Action Mode Data
There are incomplete and inconsistent problems in the basketball action modal data collected by the above method [23]. It needs to correct these problems and fill in the vacancy values. The essence of a basketball game is a round game in which the ball is exchanged after each attack with 24 s of mandatory offensive and defensive conversion rules, which is called a round. Therefore, basketball data analysis needs to be standardized based on the round. Table 1 is a basketball action statistics table.
(1) Impute missing values
According to the meaning of a basketball action modal data item, a default value is defined for the missing data item to replace the missing vacancy value. If the offensive round lacks 3 points, blocks, etc., use ‘?’ instead.
(2) Correcting inconsistent data
The collected basketball action modal data sometimes appears inconsistent, such as ‘dribbling’ is the same technical action as ‘balling’, dribble and ball have the same technical action but their meaning is not related, and have an independent existence of two individuals [24]. It can be determined which one is appropriate to change by analyzing the correlation between certain data. ‘Dribbling’ and ‘balling’ can be represented as Aand B respectively, the correlation between the two can be expressed as:
In the upper form, represents the same as the two. represents the degree of correlation, represents the average of A, B, respectively, , represents the capacity parameters for A and B, when , A and B are independent and irrelevant; , A is negatively related to B; , A is positively correlated with B. Then the ‘dribbling’ and ‘balling’ are corrected to be consistent with the dribble. The correction method is shown in Table 2.
(3) Clean up the noise of basketball action mode data
Actions such as technical fouls, interference balls, etc. are meaningless data, so it can be cleaned up directly without dealing with data. Another example is that it is unreasonable to score 2 points and 3 points for each offensive contract, so it needs to clear one and usually clear 3 points.
2.3.2. Basketball Action Mode Data Integration and Data Reduction
Data integration is to store lots of relevant data in the same technical action database, thus avoiding the scattered distribution of various data, which is not conducive to research. For example, multiple recurring data are combined (such as pick-and-roll, dribble, etc.).
Data reduction can reduce the amount of data on the basis of maintaining the integrity of the original data, thereby reducing the processing time of basketball action data [25], including:
(1) Heap reduction
Technical actions such as dribbling and passing are deleted, and only the technical actions with great significance are studied. For example, nine basketball technical moves of only steals, assists, free throws, pick-and-rolls, blocks, rebounds, 2 points, 3 points, and breakthrough are retained in this study.
(2) Data compression
The nine English letters (a, b, c, d, e, f, g, h, i) are used to represent the above nine technical actions, and one-to-one correspondence is used to compress the data set.
3. Results
Experiments are carried out to verify the application effect of the basketball motion data processing method based on mode symmetric algorithm. In the basketball training of Sports University, the performance of the proposed method was analyzed. The experiment selected the basketball action data processing method based on data mining, the data processing method based on the big data processing platform, and the proposed method in this paper. The experiments tested three methods to deal with the time-consuming situation of different basketball action data. Basketball actions include in-situ shooting, three-step layup, ball break, personal defense, and basket throwing. Experiments analyzed different methods to deal with different numbers of basketball action data. The results are shown in Table 3, Table 4, and Table 5:
It can be seen from the data results in Table 3 that the basketball action data processing method based on data mining consumes less than 0.89 s of basketball action data when processing data volume is different. The average processing in-situ shooting, three-step layup, ball break, personal defense, and basket throwing action data are 0.61 s, 0.71 s, 0.69 s, 0.68 s, and 0.68 s, respectively, and the processing time is shorter.
The data results in Table 4 conclude that the big data processing platform took longer to process when using the big data processing platform to process basketball action data. The average processing in-situ shooting, three-step layup, ball break, personal defense, and basket throwing action data are 2.37 s, 2.84 s, 4.64 s, 3.61 s and 3.40 s, respectively, and the platform initialization process took a long time. No significant effect on efficient handling of basketball action data.
The data in Table 5 concludes that the basketball action data processing method based on the mode symmetric algorithm took less time to process basketball data of different data volumes. Average processing, in-situ shooting, three-step layup, ball break, personal defense, and basket-fighting action data are 0.09 s, 0.06 s, 0.12 s, 0.10 s, and 0.15 s, respectively, both lower than data mining and big data. The processing platform processing time was consuming, and the comparison results showed that the method had strong processing efficiency in processing basketball action data, and the practical application effect was good.
In order to further verify the accuracy of the method for processing basketball action data, it also took the basketball action data of the above-mentioned experiment as the research object, and simulated the accuracy of this method to deal with different basketball action data. The experiment selected a total of 300 basketball action data, including in-place shooting (34), three-step layup (52), ball break (74), personal defense (95), and basket throw (45). The correct number and ratio of three methods for handling different basketball action data are described in Table 6, Table 7, Table 8, and Table 9, respectively:
Table 6 data shows that the use of data mining technology to analyze basketball action data results in lower accuracy. The results of detailed analysis of the data show that the experiment processed a total of 52 three-step basket action data, with lower accuracy using data mining processing to get the correct number of processing, the average number of correct processing, and with ratios of 27 and 0.52 respectively. This method resulted in the highest ratio of the three-step basket action data. The method handled the in-situ shooting, ball-breaking, personal defense, and basket-scoring action data with correct numbers of 17, 29, 34, and 16, respectively, accounting for 0.49, 0.39, 0.35, and 0.34, respectively. The correct ratio of basketball action data was only 0.52, which indicated that the method was less reliable in dealing with basketball action data.
Table 7 data shows that the processing accuracy of processing data of different types of basketball action using the big data processing platform was at an intermediate level. The average correct rate of the method for in-place shooting, three-step layup, ball break, personal defense, and basket-shot data is 0.65, 0.64, 0.58, 0.67, and 0.58, respectively, which is better than the data mining method.
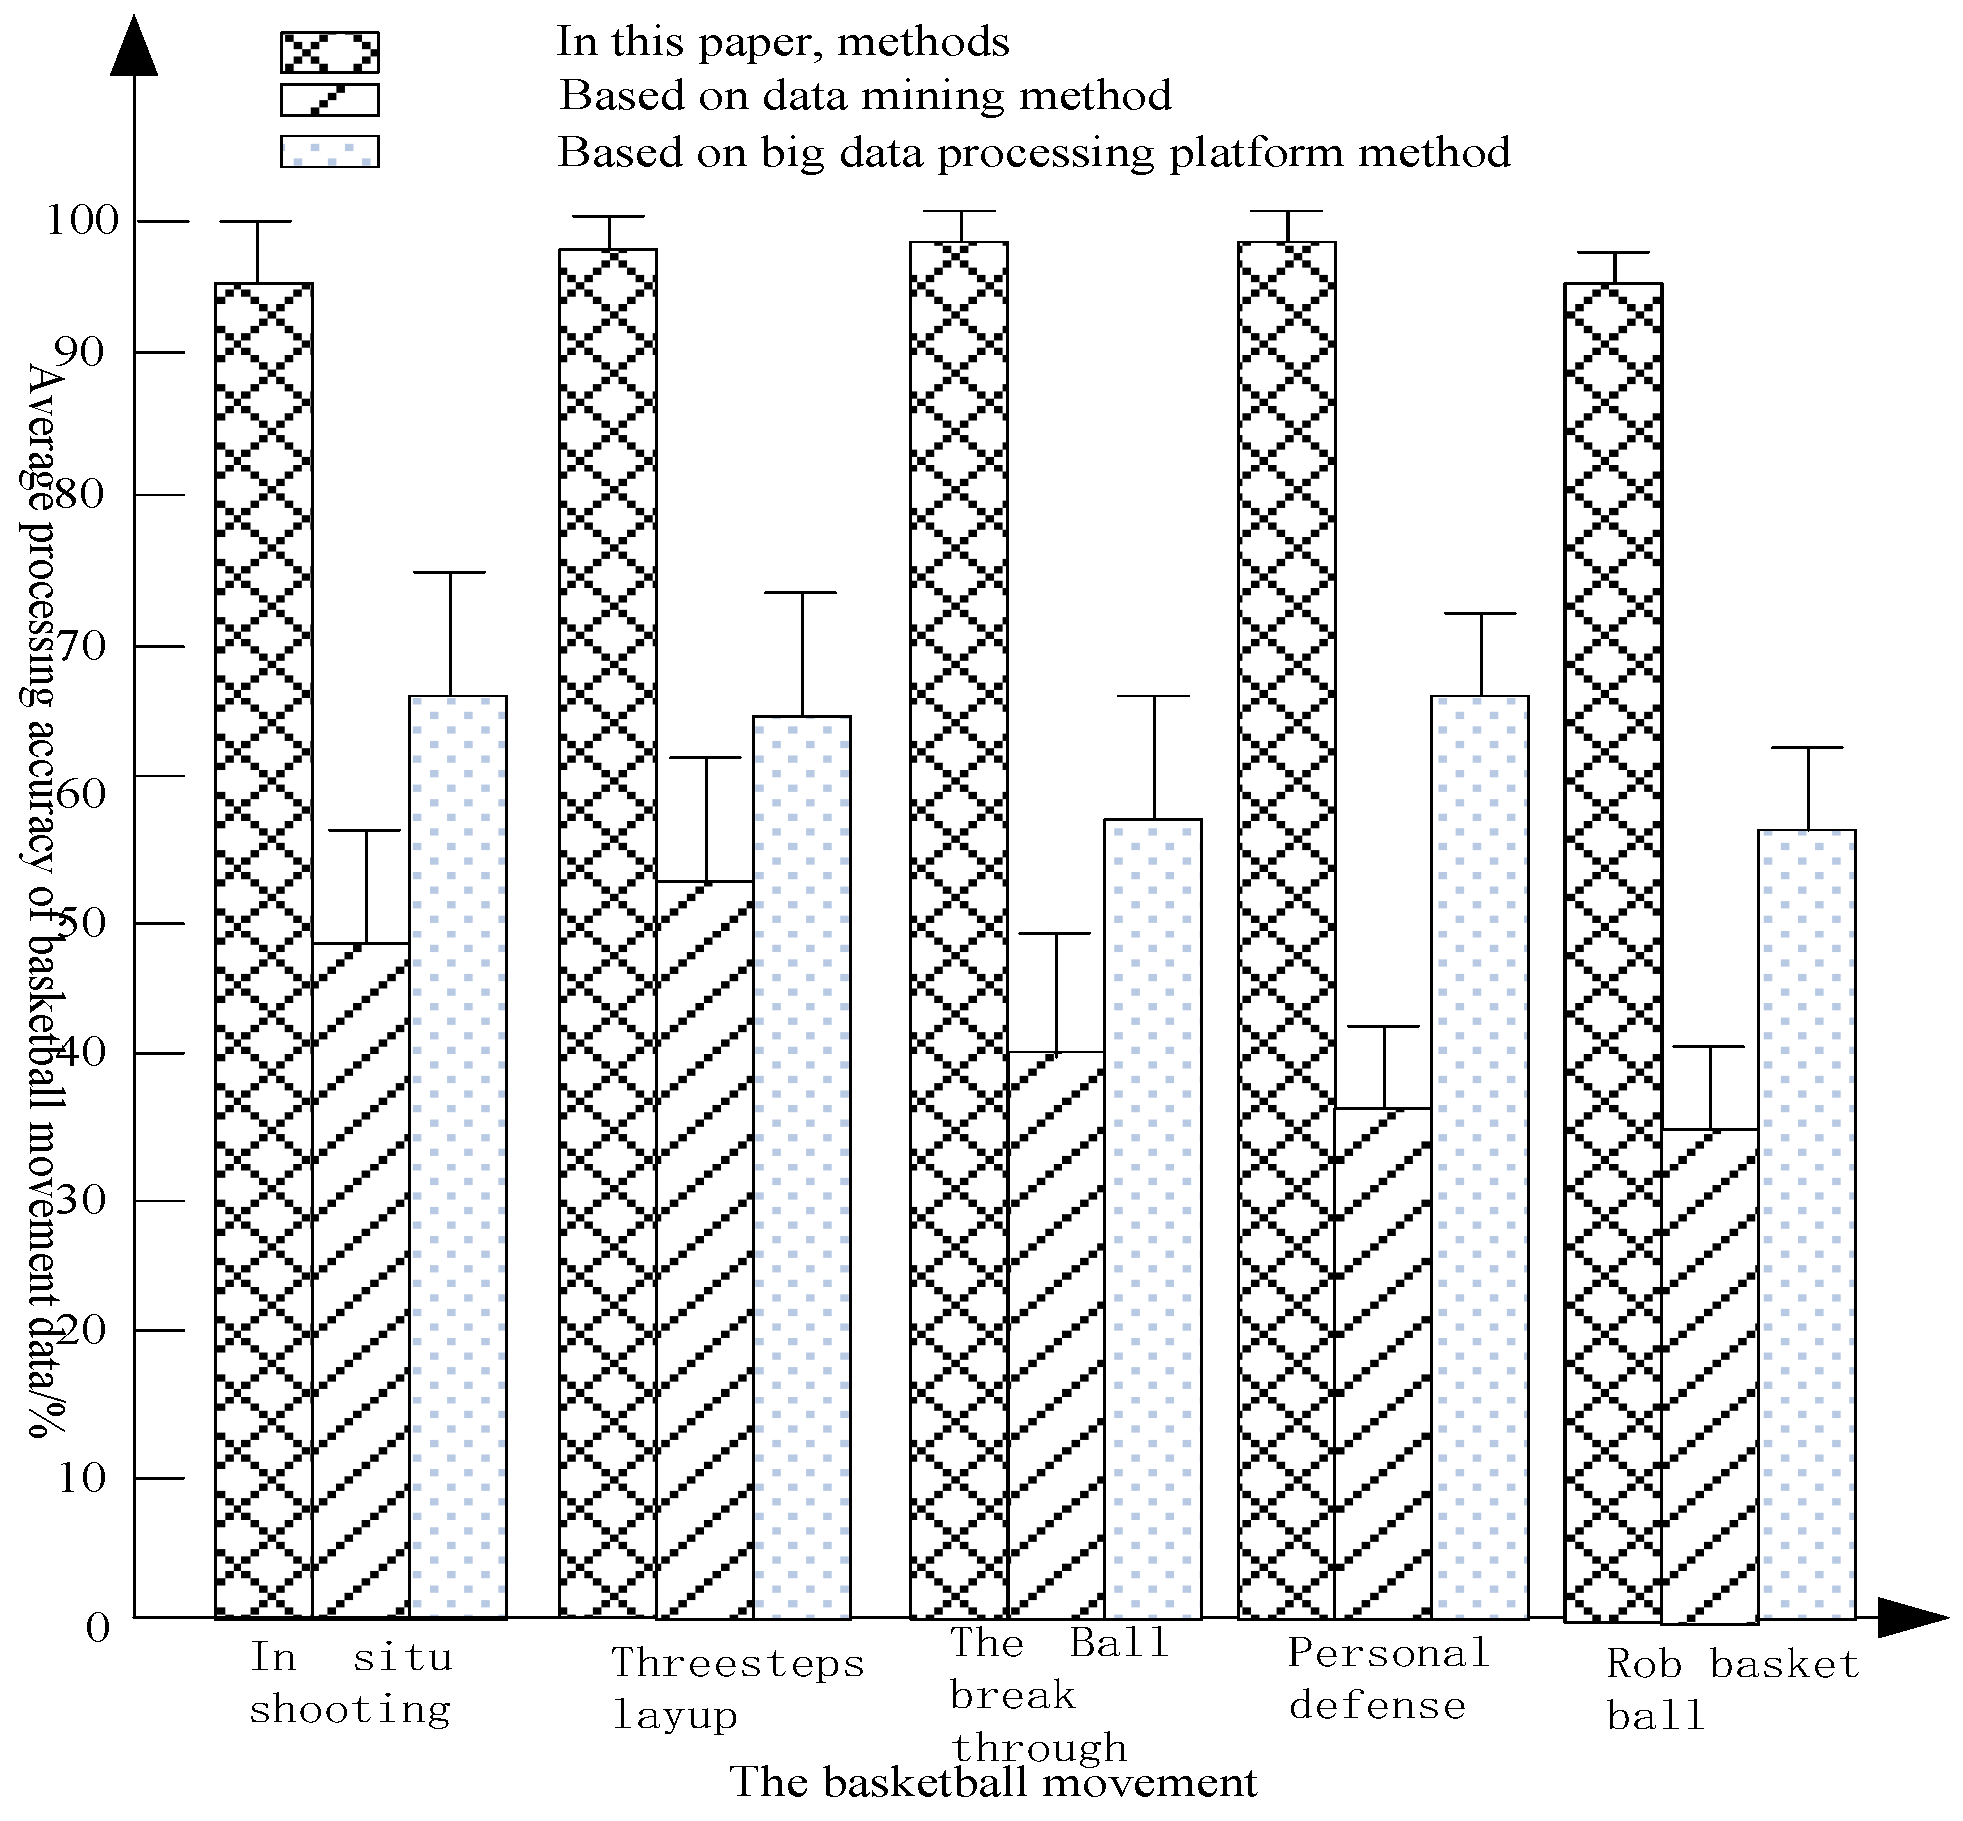
From the results of Table 8 of basketball action data, it can be concluded that the method has a higher correct rate of processing basketball action data. In the process of handling three-step layup, ball break, and personal defensive basketball action data, the average correct rate is 0.99, which can basically handle basketball action data correctly. The correct rate of handling in-field shooting and basketball shooting data was as high as 0.96. The overall comparison data showed that the number and correctness of the correct processing of various types of basketball action data were far superior to the other two methods, indicating that the method has an excellent basketball action data processing performance. The experiment highlights the high performance of the method for processing various types of basketball action data, and the data results of Table 7, Table 8, and Table 9 are depicted by the bar graph shown in Figure 5:
From Figure 5, it can be seen that the average correct rate of different types of basketball action data using big data’s treatment platform method is between 58% and 67%, and the accuracy rate of three-point basket scoring action data is 65%. The average correct rate of different types of basketball action data using the data mining method is between 34% and 52%, and the accuracy rate of the three-point basket scoring action data is 52%. The average correct rate of the different types of basketball action data by this method is between 95% and 100%, and the accuracy rate of the three-point basket scoring action data is 99.9%. The accuracy of this method is 34% higher than that of the other two methods, 9% and 47.9%, respectively. By combining the different actions, the average processing accuracy of basketball data in this paper is 96.8%. The average processing accuracy of basketball game data based on the data mining method is 43.8%. The average processing accuracy of basketball sports data based on the big data’s platform processing method is 62%, which shows that the method of dealing with basketball action data has high reliability.
Through statistical analysis, this method was compared with the method based on data mining and the method based on the big data’s processing platform to test students’ average difference. The formulas for calculating the average error of students’ basketball action are as follows:
In the formula, is the student’s mean difference; is the basketball score; is the standard deviation; is basketball action average error; and the value determines whether there is a significant difference in , is used for decision, indicating the student’s average difference test output, value depends on 0.05, when , there is no difference; when , the average difference is significant, as shown in Table 9.
In this paper, the number of samples was less, and the average error in the experiment can be compared by the t-test method. As can be seen from Table 9, it is not difficult to see the t-test value of the method and the two methods, the T-value is in a stable phase and is close to the normal distribution, so that the data processing of the basketball action of the method is good.
According to Table 9, the P values of the method in this paper are all less than 0.05, indicating that the method of this paper has a higher significant difference than the original method. The results show that the method in this paper is significantly different from the traditional method, and is an efficient method to deal with basketball movements.
4. Discussion
In this paper, the basketball action data processing method is effectively studied. There are lots of motion information in the basketball action image. How to extract the detailed basketball action from the basketball action image, and how to analyze the modality of the basketball action data to improve the accuracy and efficiency of basketball action data processing are difficult aims in the study of basketball action data processing. In order to improve the accuracy and speed of basketball action data processing, the article makes the following improvements:
1. Separating basketball movement target action and background by symmetric difference algorithm
When the basketball target moves faster, the displacement between the basketball action images is larger, and the time difference method results in a larger background area in the difference image due to the basketball goal. Therefore, it has greatly affected the accurate extraction of basketball goals and their characteristic parameters. The continuous three-frame sequence image can better extract the basketball moving contour of the intermediate frame basketball target through symmetric difference. This paper effectively improves the extraction accuracy of the basketball target motion by combining the symmetric difference algorithm and the organic set of background subtraction, which plays a better role in the post-processing of basketball action data.
2. Using ESMD to generate basketball action mode data
The Extremes Symmetric Mode Decomposition (ESMD) method is a development of the Hilbert–Huang transform. The method makes up for the inherent defects that the original algorithm screening time is difficult to determine, the decomposition trend function is too rough and so on. Not only can it intuitively reflect the time-varying amplitude and frequency, but it also clearly reflects the change of total energy. The time-frequency distribution map is more intuitive and reasonable, and it has unique advantages in the analysis of time-frequency changes. Based on a large number of statistical studies on the modalities obtained by the ESMD method, the advantages of the ESMD method are as follows:
The statistical normal distribution of mode frequencies and amplitudes is obvious when the amount of data is appropriate. From a statistical point of view, the skewness analysis and skewness analysis of its statistical samples also prove that its statistical distribution of samples can be treated as a normal distribution curve. From the perspective of analysis of variance, the trend of the change curve with variance also conforms to the characteristics of normal distribution. Estimates of the average frequency and amplitude are within the allowable range, so the average frequency and amplitude of the modal can be estimated by the number of extreme points. Mathematically, the estimated average frequency and amplitude can be used mathematically to estimate the change in mode. t can also be seen that the modality obtained by the decomposition of the ESMD method is considerable, and ESMD is more feasible in the analysis of basketball action data.
5. Conclusions
This paper studied the basketball motion data processing method based on mode symmetric algorithm. It firstly reduced the noise interference in basketball action images through symmetric difference and background subtraction, and effectively separated the basketball action from the background, which is helpful for the decomposition of negative basketball action images in the ESMD method. The method effectively filtered out the basketball action data needed to be processed, reduced the influence of some interference data, and improved the processing accuracy of the basketball action data. After that, through the cleanup and integration of basketball action modal data, it also solved the problem of incomplete and inconsistent basketball modal data; data integration and data reduction reduce the scattered distribution of various basketball action data and improve the efficiency of basketball action data processing. The experimental results showed that the proposed method can efficiently process various types of basketball action data, and the processing accuracy was also high, which demonstrated an efficient basketball action processing method.
Author Contributions
All the authors contributed equally to the conception of the idea, implementing and analyzing the experimental results, and writing the manuscript.
Funding
This research was funded by China’s National Basketball Team’s System and Mechanism (No. 16BTY086).
Conflicts of Interest
The authors declare no conflict of interest.
References
- Vien, V.V.; Long, H.N. Neutrino Mixing with Nonzero Θ13 and CP Violation in the 3-3-1 Model Based on A4 Flavor Symmetry. Int. J. Mod. Phys. A 2015, 30, 1–13. [Google Scholar] [CrossRef]
- Gu, X.M.; Clemens, M.; Huang, T.Z. The SCBiCG Class of Algorithms for Complex Symmetric Linear Systems with Applications in Several Electromagnetic Model Problems. Comput. Phys. Commun. 2015, 191, 52–64. [Google Scholar] [CrossRef]
- Hernández, A.E.C.; Long, H.N.; Vien, V.V. A 3-3-1 Model with Right-Handed Neutrinos Based on the Δ(27) Family Symmetry. Eur. Phys. J. C 2016, 76, 1–17. [Google Scholar] [CrossRef]
- Dehrouyeh-Semnani, A.M.; Dehrouyeh, M.; Torabi-Kafshgari, M. A Damped Sandwich Beam Model Based on Symmetric–Deviatoric Couple Stress Theory. Int. J. Eng. Sci. 2015, 92, 83–94. [Google Scholar] [CrossRef]
- Colalongo, L. SQM-OTFT: A Compact Model of Organic Thin-Film Transistors Based on The Symmetric Quadrature of the Accumulation Charge Considering both Deep and Tail States. Organ. Electron. 2016, 32, 70–77. [Google Scholar] [CrossRef]
- Vien, V.V. Retraction Note to: Lepton Mixing and CP Violation Phase in the 3-3-1 Model with Neutral Leptons Based on T 13 Flavor Symmetry. Braz. J. Phys. 2015, 45, 807. [Google Scholar] [CrossRef]
- Vien, V.V.; Long, H.N. Quark Masses and Mixings in the 3-3-1 Model with Neutral Leptons Based on D 4 Flavor Symmetry. J. Korean Phys. Soc. 2015, 66, 1809–1815. [Google Scholar] [CrossRef]
- Colalongo, L. Charge-Based Model of Symmetric Double-Gate Organic Thin-Film Transistors. IEEE Trans. Electron Dev. 2018, 65, 1510–1515. [Google Scholar] [CrossRef]
- Ahmed, F.; Neacsu, A.; Horoi, M. Interference between Light and Heavy Neutrinos for 0 νββ Decay in the Left–Right Symmetric Model. Phys. Lett. B 2017, 769, 299–304. [Google Scholar] [CrossRef]
- Meng, W.; Kaur, H.; Chen, C. Thermodynamic Modeling of HNO3-H2SO4-H2O Ternary System with Symmetric Electrolyte NRTL Model. Aiche J. 2017, 63, 3110–3117. [Google Scholar]
- Ortiz, L.; Martindelgado, M.A. A Bilayer Double Semion Model with Symmetry-Enriched Topological Order. Ann. Phys. 2016, 375, 193–226. [Google Scholar] [CrossRef]
- Roitgrund, A.; Eilam, G.; Barshalom, S. Implementation of the Left-Right Symmetric Model in Feynrules. Comput. Phys. Commun. 2016, 203, 18–44. [Google Scholar] [CrossRef]
- Chatterjee, S. Absence of Replica Symmetry Breaking in the Random Field Ising Model. Commun. Math. Phys. 2015, 337, 93–102. [Google Scholar] [CrossRef] [Green Version]
- Borges, J.S.; Ramos, R.O. Symmetry Breaking Patterns of the 3-3-1 Model at Finite Temperature. Eur. Phys. J. C 2016, 76, 1–13. [Google Scholar] [CrossRef]
- Magné, J.; Huneau, J.F.; Borderie, D. Plasma Asymmetric and Symmetric Dimethylarginine in A Rat Model of Endothelial Dysfunction Induced by Acute Hyperhomocysteinemia. Amino Acids 2015, 47, 1–8. [Google Scholar] [CrossRef] [PubMed]
- Kim, M.; Lee, I. A Computationally Efficient Algorithm for the Solution of Eigenproblems for Large Structures with Non-Proportional Damping Using Lanczos Method. Earthq. Eng. Struct. Dyn. 2015, 28, 157–172. [Google Scholar] [CrossRef]
- Li, C.C.; Lu, J.N.; Ding, G.J. A 4 and CP Symmetry and a Model with Maximal CP Violation. Nuclear Phys. B 2016, 913, 110–131. [Google Scholar] [CrossRef]
- Samuelsson, J.; Tammisola, O.; Juniper, M.P. Breaking Axi-Symmetry in Stenotic Flow Lowers the Critical Transition Reynolds Number. Phys. Fluids 2015, 27, 434–436. [Google Scholar] [CrossRef]
- Yamazaki, T. Reduction of Transmitted Power on a Plane by Using Mode Pair Cancellation. J. Acoust. Soc. Am. 2016, 140, 3159. [Google Scholar] [CrossRef]
- Osterkryger, A.D.; Lasson, J.R.D.; Heuck, M. Spectral Symmetry of Fano Resonances in A Waveguide Coupled to A Microcavity. Opt. Lett. 2016, 41, 2065–2068. [Google Scholar] [CrossRef]
- Li, K.; Li, X.M.; Liu, D. Survey of Multi-source Heterogeneous Equipment Data Integration. J. China Acad. Electron. Inf. Technol. 2015, 10, 162–168. [Google Scholar]
- Jing, F.; Zhou, L.W.; Lu, W.G. Design of Power Quality Monitoring Terminal Based on ADALINE Neural. J. Power Supply 2017, 15, 118–125. [Google Scholar]
- He, H.Y. Key Technology of Smart Grid Based on Big Data. Chin. J. Power Sources 2016, 40, 1713–1714. [Google Scholar]
- Shu, Z.; Zhang, X.R. Research on Query Optimization for Heterogeneous Types of Big Data. Autom. Instrum. 2016, 4, 199–200. [Google Scholar]
- Wang, H.; Zhang, C.Y. Differences between Network Data Mining Algorithm Based on Improved Genetic Algorithm. Comput. Simul. 2015, 32, 311–314. [Google Scholar]
Figure 1.
Schematic diagram of symmetric difference.

Figure 2.
The variance ratio varies with the maximum number of filters.

Figure 3.
Abasketball action picture.

Figure 4.
Data processing flow chart of basketball action mode.

Figure 5.
The accuracy rate (%) of the three methods to process different types of basketball movement data.
Figure 5.
The accuracy rate (%) of the three methods to process different types of basketball movement data.


Table 1.
Basketball action statistics table.
| Round | Technical Action in Basketball Court |
|---|---|
| 5 | Rebound, block, dribble, dribble, pass, block, 2 points |
| 20 | Block, dribble, dribble, assists, block, 3 goals |
| 100 | Fast break, long pass, technical foul, steal, free throw |
Table 2.
Revised basketball action statistics table.
| Round | Technical Action in Basketball Court |
|---|---|
| 5 | Backboard, Removal, Dribble, Pass the Ball, Removal, 2 Points In |
| 20 | Removal, Dribble, Dribble, Assists, Removal, 3 Points In |
| 100 | Fast Break, Long Pass, Technical Foul, Steals, Penalty Shot |
Table 3.
Processing time of basketball action data based on data mining (s).
| Data Volume/Piece | The Basketball Movement | ||||
|---|---|---|---|---|---|
| In Situ Shooting | Three-Step Layup | The Ball Breakthrough | Personal Defense | Rob Basket Ball | |
| 20 | 0.42 | 0.76 | 0.55 | 0.54 | 0.78 |
| 40 | 0.43 | 0.85 | 0.70 | 0.72 | 0.56 |
| 60 | 0.41 | 0.63 | 0.64 | 0.66 | 0.65 |
| 80 | 0.43 | 0.87 | 0.88 | 0.45 | 0.64 |
| 100 | 0.54 | 0.76 | 0.79 | 0.54 | 0.86 |
| 120 | 0.80 | 0.65 | 0.50 | 0.86 | 0.40 |
| 140 | 0.73 | 0.58 | 0.84 | 0.75 | 0.87 |
| 160 | 0.61 | 0.86 | 0.73 | 0.61 | 0.46 |
| 180 | 0.75 | 0.64 | 0.85 | 0.83 | 0.84 |
| 200 | 0.53 | 0.84 | 0.64 | 0.97 | 0.57 |
| 220 | 0.84 | 0.76 | 0.44 | 0.45 | 0.76 |
| 240 | 0.45 | 0.88 | 0.56 | 0.51 | 0.84 |
| 260 | 0.64 | 0.43 | 0.85 | 0.66 | 0.68 |
| 280 | 0.75 | 0.54 | 0.75 | 0.89 | 0.67 |
| 300 | 0.85 | 0.67 | 0.65 | 0.70 | 0.56 |
| Average | 0.61 | 0.71 | 0.69 | 0.68 | 0.68 |
Table 4.
Processing time of basketball action data based on the big data processing platform (s).
| Data Volume/Piece | The Basketball Movement | ||||
|---|---|---|---|---|---|
| In Situ Shooting | Three-Step Layup | The Ball Breakthrough | Personal Defense | Rob Basket Ball | |
| 20 | 2.12 | 3.21 | 4.25 | 2.27 | 4.14 |
| 40 | 2.29 | 2.32 | 4.45 | 3.22 | 5.25 |
| 60 | 2.51 | 1.68 | 4.36 | 1.25 | 2.35 |
| 80 | 2.24 | 2.57 | 4.27 | 2.55 | 3.25 |
| 100 | 2.24 | 2.87 | 4.84 | 5.54 | 4.27 |
| 120 | 2.28 | 1.67 | 5.57 | 4.26 | 5.34 |
| 140 | 2.53 | 3.57 | 5.35 | 3.65 | 2.29 |
| 160 | 2.21 | 4.46 | 4.54 | 5.21 | 3.46 |
| 180 | 2.45 | 2.28 | 5.65 | 2.23 | 2.74 |
| 200 | 2.53 | 3.57 | 4.24 | 3.28 | 4.67 |
| 220 | 2.24 | 2.64 | 3.74 | 5.28 | 2.36 |
| 240 | 2.25 | 2.55 | 5.14 | 4.28 | 2.54 |
| 260 | 2.64 | 3.58 | 5.12 | 5.26 | 1.98 |
| 280 | 2.75 | 3.35 | 4.54 | 2.57 | 3.77 |
| 300 | 2.24 | 2.24 | 3.59 | 3.25 | 2.56 |
| Average | 2.37 | 2.84 | 4.64 | 3.61 | 3.40 |
Table 5.
Basketball action data processing time (s) of the method in this paper.
| Data Volume/Piece | The Basketball Movement | ||||
|---|---|---|---|---|---|
| In Situ Shooting | Three-Step Layup | The Ball Breakthrough | Personal Defense | Rob Basket Ball | |
| 20 | 0.05 | 0.03 | 0.08 | 0.06 | 0.12 |
| 40 | 0.06 | 0.03 | 0.10 | 0.06 | 0.13 |
| 60 | 0.08 | 0.02 | 0.09 | 0.06 | 0.13 |
| 80 | 0.09 | 0.03 | 0.11 | 0.06 | 0.14 |
| 100 | 0.07 | 0.04 | 0.11 | 0.08 | 0.15 |
| 120 | 0.07 | 0.05 | 0.12 | 0.08 | 0.16 |
| 140 | 0.08 | 0.06 | 0.12 | 0.08 | 0.15 |
| 160 | 0.08 | 0.06 | 0.13 | 0.09 | 0.14 |
| 180 | 0.09 | 0.07 | 0.13 | 0.10 | 0.16 |
| 200 | 0.10 | 0.07 | 0.14 | 0.11 | 0.13 |
| 220 | 0.12 | 0.07 | 0.13 | 0.13 | 0.15 |
| 240 | 0.13 | 0.08 | 0.12 | 0.14 | 0.14 |
| 260 | 0.12 | 0.08 | 0.15 | 0.13 | 0.17 |
| 280 | 0.11 | 0.09 | 0.14 | 0.14 | 0.16 |
| 300 | 0.09 | 0.09 | 0.13 | 0.15 | 0.15 |
| Average | 0.09 | 0.06 | 0.12 | 0.10 | 0.15 |
Table 6.
Basketball action data processing results based on data mining (%).
| The Serial Number | In Situ Shooting | Three-Step Layup | The Ball Breakthrough | Personal Defense | Rob Basket Ball | |||||
|---|---|---|---|---|---|---|---|---|---|---|
| Times | Ratio/% | Times | Ratio/% | Times | Ratio/% | Times | Ratio/% | Times | Ratio/% | |
| 1 | 11 | 0.32 | 25 | 0.48 | 32 | 0.43 | 35 | 0.37 | 14 | 0.31 |
| 2 | 15 | 0.44 | 26 | 0.50 | 24 | 0.32 | 24 | 0.25 | 16 | 0.36 |
| 3 | 16 | 0.47 | 18 | 0.35 | 35 | 0.47 | 32 | 0.34 | 20 | 0.44 |
| 4 | 13 | 0.38 | 24 | 0.46 | 40 | 0.54 | 45 | 0.47 | 24 | 0.53 |
| 5 | 17 | 0.50 | 26 | 0.50 | 26 | 0.35 | 42 | 0.44 | 11 | 0.24 |
| 6 | 22 | 0.65 | 31 | 0.60 | 35 | 0.47 | 40 | 0.42 | 11 | 0.24 |
| 7 | 20 | 0.59 | 35 | 0.67 | 30 | 0.41 | 26 | 0.27 | 13 | 0.29 |
| 8 | 20 | 0.59 | 27 | 0.52 | 26 | 0.35 | 36 | 0.38 | 14 | 0.31 |
| 9 | 19 | 0.56 | 29 | 0.56 | 24 | 0.32 | 27 | 0.28 | 15 | 0.33 |
| 10 | 16 | 0.47 | 30 | 0.58 | 20 | 0.27 | 30 | 0.32 | 18 | 0.40 |
| average | 17 | 0.49 | 27 | 0.52 | 29 | 0.39 | 34 | 0.35 | 16 | 0.34 |
Table 7.
Basketball action data processing results based on big data processing platform (%).
| The Serial Number | In Situ Shooting | Three Steps Layup | The Ball Breakthrough | Personal Defense | Rob Basket Ball | |||||
|---|---|---|---|---|---|---|---|---|---|---|
| Times | Ratio/% | Times | Ratio/% | Times | Ratio/% | Times | Ratio/% | Times | Ratio/% | |
| 1 | 20 | 0.59 | 30 | 0.58 | 42 | 0.57 | 63 | 0.66 | 26 | 0.58 |
| 2 | 19 | 0.56 | 34 | 0.65 | 40 | 0.54 | 65 | 0.68 | 25 | 0.56 |
| 3 | 21 | 0.62 | 33 | 0.63 | 43 | 0.58 | 63 | 0.66 | 24 | 0.53 |
| 4 | 23 | 0.68 | 32 | 0.62 | 45 | 0.61 | 64 | 0.67 | 26 | 0.58 |
| 5 | 21 | 0.62 | 35 | 0.67 | 41 | 0.55 | 65 | 0.68 | 26 | 0.58 |
| 6 | 20 | 0.59 | 36 | 0.69 | 46 | 0.62 | 66 | 0.69 | 25 | 0.56 |
| 7 | 24 | 0.71 | 33 | 0.63 | 42 | 0.57 | 62 | 0.65 | 28 | 0.62 |
| 8 | 25 | 0.74 | 35 | 0.67 | 43 | 0.58 | 64 | 0.67 | 27 | 0.60 |
| 9 | 21 | 0.62 | 34 | 0.65 | 41 | 0.55 | 63 | 0.66 | 26 | 0.58 |
| 10 | 26 | 0.76 | 32 | 0.62 | 45 | 0.61 | 64 | 0.67 | 26 | 0.58 |
| Average | 22 | 0.65 | 33 | 0.64 | 43 | 0.58 | 64 | 0.67 | 26 | 0.58 |
Table 8.
Basketball action data processing results of the method in this paper (%).
| The Serial Number | In Situ Shooting | Three-Step Layup | The Ball Breakthrough | Personal Defense | Rob Basket Ball | |||||
|---|---|---|---|---|---|---|---|---|---|---|
| Times | Ratio/% | Times | Ratio/% | Times | Ratio/% | Times | Ratio/% | Times | Ratio/% | |
| 1 | 30 | 0.88 | 50 | 0.96 | 74 | 1.00 | 95 | 1.00 | 44 | 0.98 |
| 2 | 31 | 0.91 | 52 | 1.00 | 73 | 0.99 | 94 | 0.99 | 44 | 0.98 |
| 3 | 32 | 0.94 | 51 | 0.98 | 74 | 1.00 | 94 | 0.99 | 44 | 0.98 |
| 4 | 34 | 1.00 | 50 | 0.96 | 74 | 1.00 | 94 | 0.99 | 44 | 0.98 |
| 5 | 34 | 1.00 | 52 | 1.00 | 71 | 0.96 | 94 | 0.99 | 43 | 0.96 |
| 6 | 34 | 1.00 | 53 | 1.02 | 72 | 0.97 | 95 | 1.00 | 41 | 0.91 |
| 7 | 33 | 0.97 | 52 | 1.00 | 73 | 0.99 | 93 | 0.98 | 42 | 0.93 |
| 8 | 33 | 0.97 | 53 | 1.02 | 74 | 1.00 | 93 | 0.98 | 42 | 0.93 |
| 9 | 33 | 0.97 | 51 | 0.98 | 73 | 0.99 | 92 | 0.97 | 43 | 0.96 |
| 10 | 31 | 0.91 | 53 | 1.02 | 72 | 0.97 | 94 | 0.99 | 43 | 0.96 |
| Average | 33 | 0.96 | 52 | 0.99 | 73 | 0.99 | 94 | 0.99 | 43 | 0.96 |
Table 9.
Student’s t-test for different methods.
| Different Action | Average Error | T Test Value | Average Error | T Test Value | ||
|---|---|---|---|---|---|---|
| In This Paper Methods | Based on Data Mining Method | In This Paper Methods | Based on Big Data Processing Platform Method | |||
| In situ shooting | 0.04 | 0.07 | −2.132~2.132 | 0.03 | 0.06 | −1.372~1.372 |
| Three-step layup | 0.03 | 0.08 | −2.356~2.356 | 0.02 | 0.07 | −2.112~2.112 |
| The ball break through | 0.02 | 0.09 | −2.149~2.149 | 0.02 | 0.08 | −1.932~1.932 |
| Personal defense | 0.02 | 0.07 | −1.132~1.132 | 0.04 | 0.05 | −0.132~0.132 |
| Rob basket ball | 0.24 | 0.09 | −1.956~1.956 | 0.04 | 0.06 | −1.031~1.031 |
© 2019 by the authors. Licensee MDPI, Basel, Switzerland. This article is an open access article distributed under the terms and conditions of the Creative Commons Attribution (CC BY) license (http://creativecommons.org/licenses/by/4.0/).
Share and Cite
MDPI and ACS Style
Zhang, F.; Jiang, Y. Basketball Action Data Processing Method Based on Mode Symmetric Algorithm. Symmetry 2019, 11, 560. https://doi.org/10.3390/sym11040560
AMA Style
Zhang F, Jiang Y. Basketball Action Data Processing Method Based on Mode Symmetric Algorithm. Symmetry. 2019; 11(4):560. https://doi.org/10.3390/sym11040560
Chicago/Turabian StyleZhang, Fei, and Yi Jiang. 2019. "Basketball Action Data Processing Method Based on Mode Symmetric Algorithm" Symmetry 11, no. 4: 560. https://doi.org/10.3390/sym11040560
Note that from the first issue of 2016, this journal uses article numbers instead of page numbers. See further details here.