1. Introduction
As the key component of smart transportation systems, VANET is the mobile network that consists of vehicles and infrastructures. VANETs are used for communications either between infrastructure and vehicle (V2I) or between two vehicles (V2V). With the growth of connected vehicles and the emergence of advanced vehicular applications, security is one of the most important requirements in VANET.
In this network, vehicles might misbehave due to selfish reasons and might not send correct information all the time. Attackers may tamper the vehicles by changing the content of messages. Attackers may also create bogus traffic warning messages to flood communication channels for causing collisions. Moreover, obstacles such as trucks and buildings are one of the main factors that affect the performance of V2V and V2I communications. Obstacles by restricting direct communication between two nodes and blocking a line-of-sight (LoS) condition prevent vehicles from exchanging proper data [
1].
Motivated by this observation, trust, as a key element of security systems, can be an efficient solution in VANET. Trust means the belief that an entity has about another entity, given past experiences, knowledge about the entity’s nature and recommendations from trusted entities [
2]; a trust model ensures the security of vehicular ad hoc networks. Marmol and Perez in [
3] stated that the trust model is an accurate alternative to dealing with security threats in highly distributed and dynamic scenarios such as VANETs.
In a vehicular network, the most important challenge is the exchange of reliable and correct data among nodes. The exchanged data have a great impact on the safety and comfort of passengers. Hence, the need to detect the trustworthiness or untrustworthiness of data and vehicles is essential. This paper seeks to develop a proper trust model to deal with the security threats by malicious and selfish nodes, as well as security challenges by obstacles under both LoS and non-line-of-sight (NLoS) conditions. In the proposed trust model, fuzzy logic is used as the main approach to deal with uncertainty and incomplete data generated by obstacles or malicious nodes.
One of the important issues of security models in the vehicular environment is detecting the existing obstacles such as buildings and trucks in the network. It is obvious that the existing trust models use different methods in the face of obstacles that block an LoS. To do this, we developed a model using the kNN classification algorithm. This algorithm—a supervised machine learning algorithm—is based on feature similarity. In this regard, radio signal strength indicator (RSSI), packet reception rate (PDR), and the distance between two nodes are used as k-nearest neighbor (kNN) features. In this study, edge nodes, instead of road-side units (RSUs), are also distributed along the roadside. This is mainly because the edge nodes contain much better processing power than RSUs to reduce latency, increase throughput and enhance security.
The key contributions of this article are summarized as follows:
We propose a fuzzy trust model based on plausibility, experience and type of node to deal with inaccurate, incomplete and uncertain data, as well as malicious nodes who change behavior over time. To this end, when the vehicle receives an event message from a neighboring node, it computes the trust score using a decision-making module, and finally, makes a decision on the trustworthiness of the received event message.
We analyze the proposed trust model under both LoS and NLoS conditions in VANET. In this regard, identifying LoS and NLoS status is necessary. Therefore, we develop a model using the kNN algorithm to detect NLoS conditions. We analyze the accuracy of this model with different numbers of nearest neighbors.
We evaluate the proposed trust model under different types of malicious attacks, specifically, simple attack, opinion-tampering attack, and cunning attack. Additionally, state-of-the-art evaluation measures are used to evaluate the performance of the proposed models, including accuracy, precision, and recall.
The structure of the other parts of the article is as follows. The related work on the trust model is illustrated in the subsequent section. Then, the suggested model is provided technically. The observations and results validating the effectiveness of the suggested model are drawn next. Ultimately, the conclusion is represented.
2. Related Work
Recently, many studies have paid more attention to improving passenger’s safety in VANET. Trust models, as a security mechanism, try to prepare the network for protection against different types of attacks by increasing the trustworthiness and reliability of data and vehicles.
Shaikh and Alzahrani [
4] proposed an intrusion-aware trust model to detect malicious nodes that send fake location and timing values. In this model, a confidence value is measured for messages from a single sender of messages. Furthermore, utilizing the confidence value of all messages related to the same event, a trust value is determined. Finally, an event message is accepted or rejected based on the trust value. Although the model’s accuracy is high, because of the high delay, it is not appropriate for safety-related usage in VANET.
Authors in [
5] proposed a self-organized trust model containing recommendation-based trust and trust certificate-based evaluations. A certificate-based trust model is to cope with the collusion attack, making more accurate evaluations as a consequence. In order to evaluate trust based on recommendations, a maximum local trust (MLT) algorithm is presented to recognize dependable recommenders.
Hu et al. [
6] presented a suggested structure for used vehicles for selecting a platoon head vehicle prior to joining a platoon, namely, REPLACE. Given the uncertainties of human behaviors, the scheme is reputation-based, utilizing the weighted majority technique by summing up all the historical reactions from the user vehicles. It is well-perceived that the user vehicles’ feedback could be untrusted. For concreting, a trust system is established to assess the user vehicles’ reliability to deal with the uncertainties in the user vehicles’ feedback, and subsequently to approximate their upcoming behaviors.
Li and Song [
7] proposed a trust model based on both data and entity to handle malicious attacks called “ART”. In this model, data trust is centered on data gathered from multiple vehicles, and entity trust is evaluated using functional and recommendation trust values. In the ART model, the VANETs traffic data is collected for analysis. Then, the results of the data analysis are summarized as evidence for trust controlling schemes for trustworthiness evaluations. Evidence combination is very important for the proposed ART scheme. In this work, the Dempster–Shafer method is used as the evidence combining method, to appropriately combine various pieces of evidence that comprise of both untrustworthy and trustworthy information.
In [
8], a model is proposed for establishing both in-node trust and data, and to protect the data attainment. In this work, a data-based trust model is proposed via discovering the traffic knowledge and utility theory for synthesizing the associations within data, its location, reporter, and time, which is simple enough for the rapid realization or timely evaluation of the trust. Additionally, a dynamic entity-based trust model centered on node weight and data is offered by connecting data types to node kinds and introducing a dynamical coefficient for balancing the recommended trust and straight trust. In this work, a data-based trust model is also proposed employing the utility theory, for coordinating the effectiveness of the main factors in data trust formation, rather than utilizing the present complicated trust assessment methods. In the data trust model, the data trustworthiness is calculated by four factors which include: the trustworthiness of the data reporter, the event and its reporter’s correlative trustworthiness, the distance between the position of the reporter and the event area, and the time interval between the generated report and the event incidence. Kerrache et al. [
9] proposed the trust-centered framework for reliable data delivery (TFDD), constructed on three components: (1) a collaborative and distributed component for detecting the dishonest nodes, (2) a data-based verifying component for the filter of malicious data, and (3) a component for detecting and preventing against DDoS and DoS attacks. In this model, some parameters are utilized to improve data trust using chosen trusted vehicles. However, there is no consideration on the impact of obstacles on the proposed scheme.
Boeira et al. [
10] mentioned that inappropriately positioned data can result in problems including incremented fuel consumption, decreased passenger comfort, and in some instances, even accidents. Therefore, they designed a secure proof-of-location outline tailored for VANETs called Vouch. The scheme controls the node positioning ability of 5G wireless network roadside units. The main idea in Vouch is to distribute the location periodic proofs, combined with plausibility, proving the movement between proofs. In [
11] a trust model is proposed with the support of blockchain to prevent broadcasting fake and tempered messages in 5G-VANET. In this model, the information will be scored by vehicles near the sending vehicle. As a node of the blockchain, RSU also measures the trust value of data based on distance between scoring vehicles and sending vehicles. The trusted information will then be stored in the blocks.
Based on available knowledge, it can be observed that very few models of trust have focused on the impact of obstacles on the trustworthiness of data. Both static and moving obstacles are an inseparable part of the urban vehicular network. Since these obstacles have interference with radio signals, it causes avoidance in desirable communication. These restrictions can influence the integrity, reliability, and availability of the event message. Despite the existing trust models in the literature, there is a lack of a proper trust model that works correctly in both LoS and NLoS cases. Furthermore, distinguishing LoS and NLoS statuses is a lack of the existing models that analyzed under both conditions.
Moreover, because of the incomplete, inaccurate and imprecise data known by vehicles, as well as uncertainty due to conflicting information in the vehicular environment, evaluation of data and entity trust cannot be completely precise and accurate. There is a lack of a proper trust model that can not only evaluate the trustworthiness of data and entity correctly, but can also overcome uncertainty and imprecision of data.
3. Proposed Trust Model (F-TRUST)
F-TRUST is a trust model used to assess the accuracy and integrity of both the message and the sender of an event message by performing fuzzy logic. Upon receiving an event message from surrounding vehicles,
F-TRUST evaluates the trust level of the message based on plausibility, experience, and type of vehicle. On the basis of this trust level, it makes a decision on the event message. The event message is then forwarded to the surrounding vehicles if it is acceptable, or is discarded otherwise.
Figure 1 illustrates the modular design of the proposed trust framework composed of several major components. As shown in this figure, three main modules exist to evaluate the level of trust of an event message. The plausibility module is used to deal with inaccurate information, whereas the experience module is used to tackle selfish nodes. In order to cope with untrustworthy nodes, a decision-making module is designed by performing fuzzy logic. The decision-making module completely depends on two previous modules as well as the type of vehicle. These modules are described in detail below.
3.1. Plausibility Measurement Module
One of the main problems in vehicular networks is the presence of inaccurate information that is exchanged among nodes. Plausibility is an important factor to ensure the reliability of data [
12]. According to [
13], a plausibility check system can be used to correctly compute the trust level. Since location is one of the important factors in vehicular networks, this parameter can be used to evaluate the plausibility level of data. In this paper, two submodules based on distance and time are proposed to verify the location.
Location verification is one of the most important factors to check the plausibility of the received data. It determines whether or not the sender has provided its true location through the checking of plausibility. Verification of measured distance between the sender and receiver is a way to verify a claimed position. In this paper, to verify location using distance, we used geographical coordinates included in both event messages and beacons. An event message is created by a vehicle when it observes an event, and a beacon is a message that is periodically transmitted by each vehicle. A beacon message carries information such as a vehicle’s geographical coordinates, velocity, and acceleration.
Let be an event message created by a vehicle node when observing an event within its transmission range. In this message, is the type of event, is the event’s geographical position, is the time of event observing, is the type of reporter, is the reporter’s geographical coordinate, is a description of the event, is a secure hash function to generate pseudo-IDs for privacy-preserving, and is the reporter’s signature on the message for authentication. Also, consider as a beacon message where is the vehicle’s geographical position, is the vehicle’s speed and is the vehicle’s acceleration. Due to the obstacles in the VANET environment that lead to LoS and NLoS conditions, to evaluate the plausibility level of data, we proposed two different methods as follows:
Under the LoS condition, the proposed scheme firstly calculates the distance between two vehicles in a two-dimensional plane using both coordinates mentioned in the event message and latest beacon. Consider and be the measured distance between nodes V and W using mentioned coordinates in the and, respectively. To evaluate the plausibility level (Plaus), it then compares these two measured distances.
Under the NLoS condition, due to the movable and immovable obstacles, node V sends a request to node N to verify the location of W with its proclaimed position (
) and mobility vector. Node N is able to prove the location of W by determining its distance via measures
and
followed by a comparison of the measured values. If both values are a match, N will send a reply to V comprising of the new coordinate of node W, and thus proving the location of W. Then, based on the new coordinate of W, node V measures the distance (
) to W using Equation (1):
where (
) is the location of W caused by mobility. Due to mobility, the actual position has changed since the information was received.
and
. Finally, it compares the announced and measured distances by Equation (2). Node V verifies node W if both values are a match.
3.2. Experience Measurement Module
Minhas et al. [
14] stated that the direct interactions within nodes can be an element for determining the trust level. On the other hand, the history of previous interaction within nodes is effective in updating a belief of one node in another’s trustworthiness. It is clear that nodes with optimal history of previous interactions influence positively on the trust score. Therefore, for creating trust in VANETs via experience, each node is required to store the history of previous interactions with other nodes.
Building on this, a module is proposed to calculate the experience score (Exp) of the vehicle. In this module, Exp is measured individually by each vehicle. This score is based on past direct interaction and the number of direct interactions. Consider that node V has received an event message from node W. Based on this model, node V extracts all direct interactions along with the relevant trust score with node W, if they exist. Otherwise, the previous trust score (PTS) will be set to 0.5 and the number of interactions (n) set to 1. In this module,
is measured using the following equation:
Therefore, only trust values and the number of interactions between nodes are required to be stored in the local database that exists in each vehicle to make the system scalable.
3.3. Type of Node Detection
According to [
15,
16], authentication, as an element of security systems, is a way to ensure the integrity and accuracy of event messages exchanged among nodes. Of course, authorized vehicles are more trustworthy than other ones. Based on the node’s authentication level, we categorize vehicles into three groups: high, medium and low level. The high-level nodes are chiefly denoted by police wagons. The medium level nodes denote public services vehicles like buses, road upkeep vehicles, ambulances, sanitation trucks, and engineering vehicles, which are regularly controlled by particular departments. The low-level nodes denote private cars, freight vehicles, and taxis, which are managed principally by people, and which are able to move at liberty to some extent.
Based on the type of vehicle and authentication level, we consider a type score (ToV) for each vehicle. This value is randomly assigned to each registered vehicle by a root trusted authority (TA) in the system initialization phase. It is assumed that the type score of high authorized nodes is between 0.67 and 1 ; nodes with a medium level of authority have a type score between 0.34 and 0.66 and the type score of low-level nodes is between 0 and 0.33 . It is worth noting that to reach the desired results, we found these values through trial and error in the simulation.
In order to extract the ToV of a vehicle, it needs to send a query to a trusted authority (TA). However, a large number of vehicles lead to the increase in computation and communication time. As shown in
Figure 2, we proposed a 2-layers system that consists of TA and cloud server (CS) in the upper layer, and edge and vehicle nodes in the lower layer. Edge nodes substitute RSUs, as they contain much better processing power to reduce latency, increase throughput and enhance security. According to [
17], due to the inherent problem of cloud computing such as unreliable latency, lack of mobility support, and location-awareness, edge computing can address these problems by providing elastic resources and services to end-users at the edge of the network. Edge nodes have emerged as a promising technology that can bring cloud applications closer to the vehicle nodes. In this system, TA generates required parameters and issues to the edge nodes and vehicles using CS. The edge nodes that are distributed along the roadside have a list of registered vehicles within the defined communication range as well as the type score of the vehicles. Therefore, to assess the authentication of a vehicle and extract the type score, a query from the relevant edge node is sufficient.
The large amount of data being generated in the edge nodes due to the growth of connected vehicles renders the use of traditional data structures unsuitable. This is because of the large amount of memory and high latency of processing queries in traditional data structures. Hence, it is assumed that the probabilistic data structure, as a group of data structures, is used in the proposed model. This kind of data structure is extremely useful for big data, because it reduces latency and the analytical process [
18]. The bloom filter (BF), cuckoo filter (CF) and quotient filter (QF) are three different types of space-efficient probabilistic data structures that are used to check whether an element is a member of a massive dataset or not. According to [
19], QFs have faster and efficient querying of the elements than BFs, even in secondary memory. Authors in [
20] stated that CFs have better practically performance than BFs and QFs. CFs are easier to implement than BFs and QFs. In terms of space efficiency, CFs also use less space than BFs in different applications by the false-positive rate of less than 3%. They also outperform QFs and BFs in lookup performance. Compared to BFs and QFs, cuckoo filters have better throughput, and as such a cuckoo filter was used to query the edge node’s dataset in the proposed authentication model.
Consider a set of authorized vehicle nodes that have been registered in the network . In addition, there is a set of edge nodes with a defined communication range in the network that is . Each edge node () has a subset of authorized vehicle nodes that are under its communication range. When a vehicle entered the range of the edge node, the last existing list will be upgraded by the edge node. Each vehicle, such as , can receive data from another vehicle,, as long as it is within the sender’s transmission range. In order to check the authentication of , a query is performed by on the relevant edge node that is under it at that time. Returning the edge node in “true” means the sender is authorized. It also returns the ToV of that is stored in the CF’s edge node. Otherwise, if the edge node returns “false”, is highlighted as an intruder within the network and an alert is sent stating the presence of an unauthorized vehicle node.
3.4. Fuzzy Decision-Making Module (FDM)
In this section, a fuzzy decision-making module (FDM) is proposed to evaluate the trust score of a node that sends an event message. As mentioned above, the trust score is based on the plausibility score, experience score, and type score. To do this, the trust score (
) of node W given by node V is calculated as follows:
where
is the plausibility,
is the experience,
is the type of vehicle, weights
are associated to the attribute values and
.
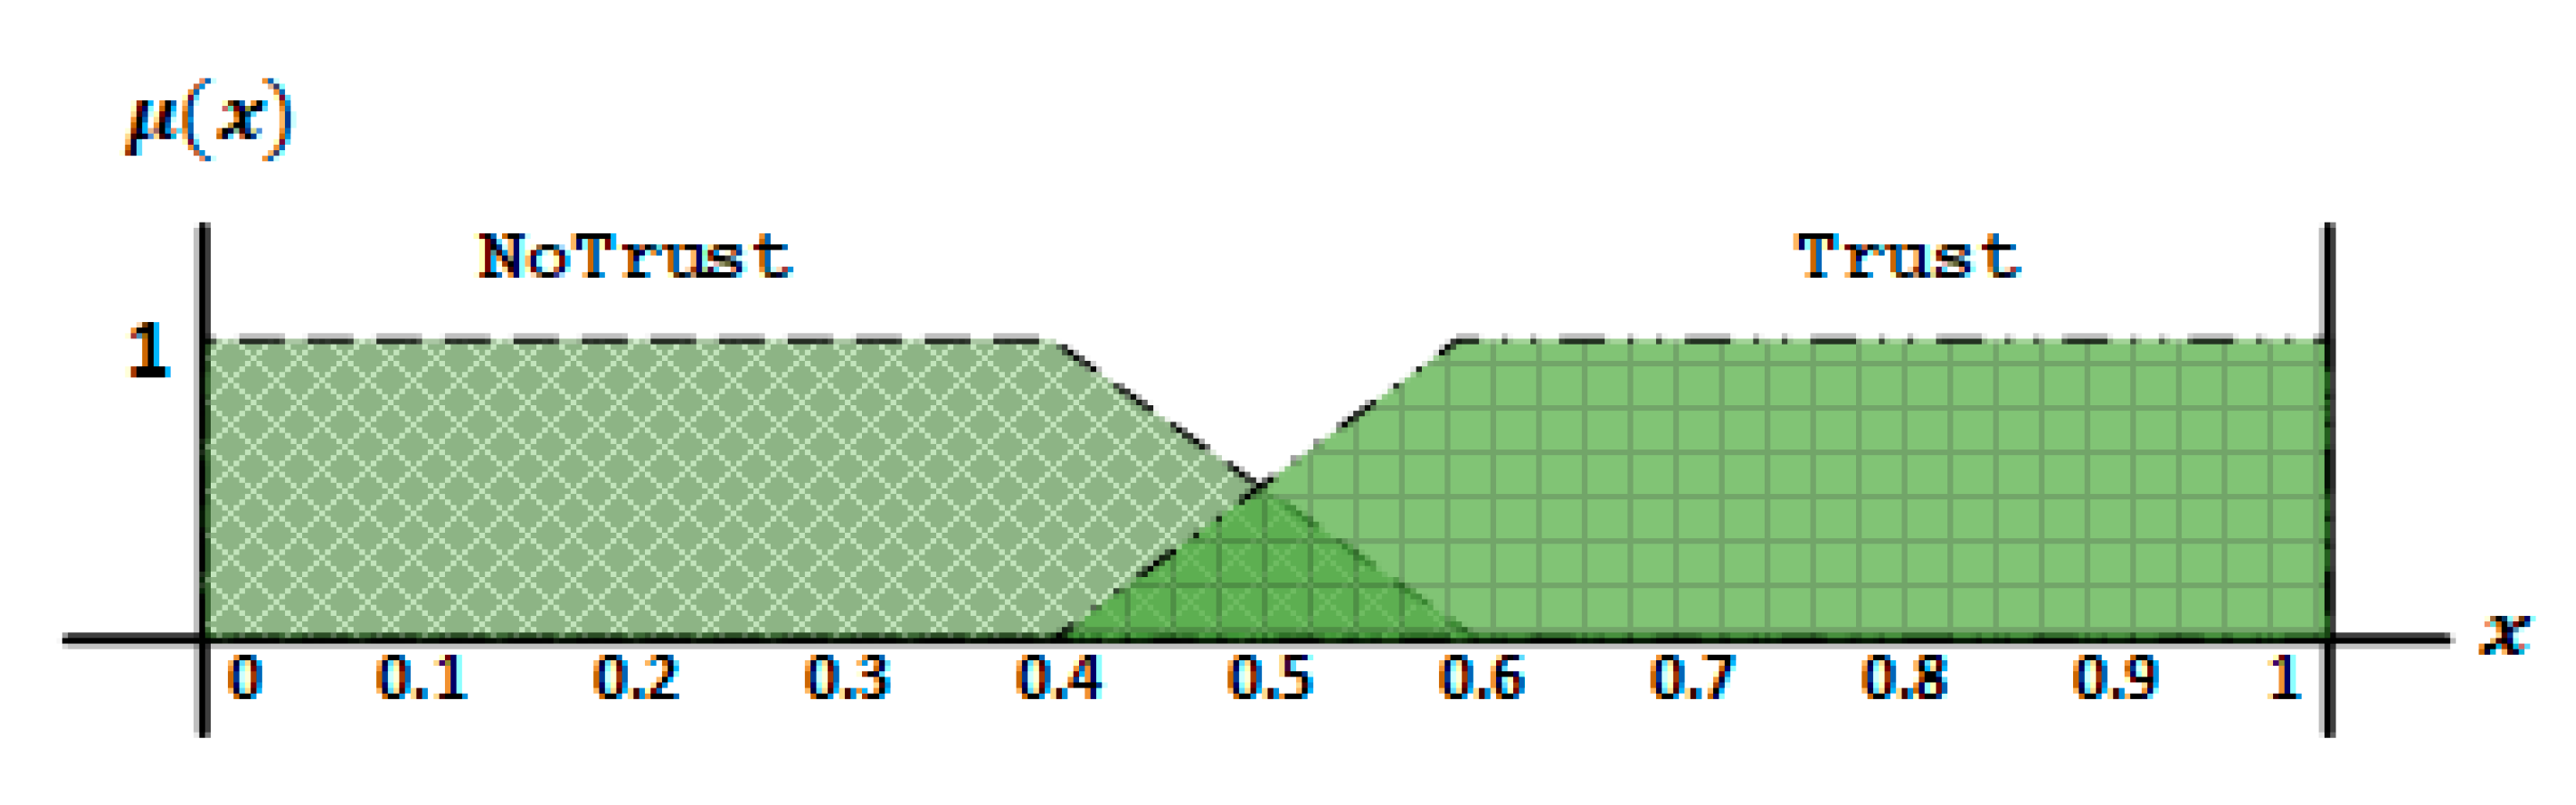
As shown in
Figure 3, based on the
, the target node (sender of event message) will be placed in either “Trust” or “NoTrust”. If the node is placed in “Trust”, its message will be accepted, whereas if the target node is placed in “NoTrust”, its message will be discarded.
4. NLoS Detection
Obstacles, such as buildings and trucks, are one of the key factors to reduce the performance of V2V links in the vehicular environment. According to [
1], obstacles occurring due to the reduction of the RSSI and PDR have undesirable impacts on VANET’s applications. Due to the presence of obstacles in the realistic VANET environment, the safety and non-safety applications should be analyzed under both LoS and NLoS conditions. To this end, obstacles that block the LoS condition must be detected.
For this purpose, we used kNN as a supervised machine-learning algorithm. It is simple and easy to implement an algorithm that is utilized to solve classification issues. In this algorithm, classification is based on similarity (or distance) and a majority vote of nearest neighbors. Algorithm 1 illustrates the kNN classification method.
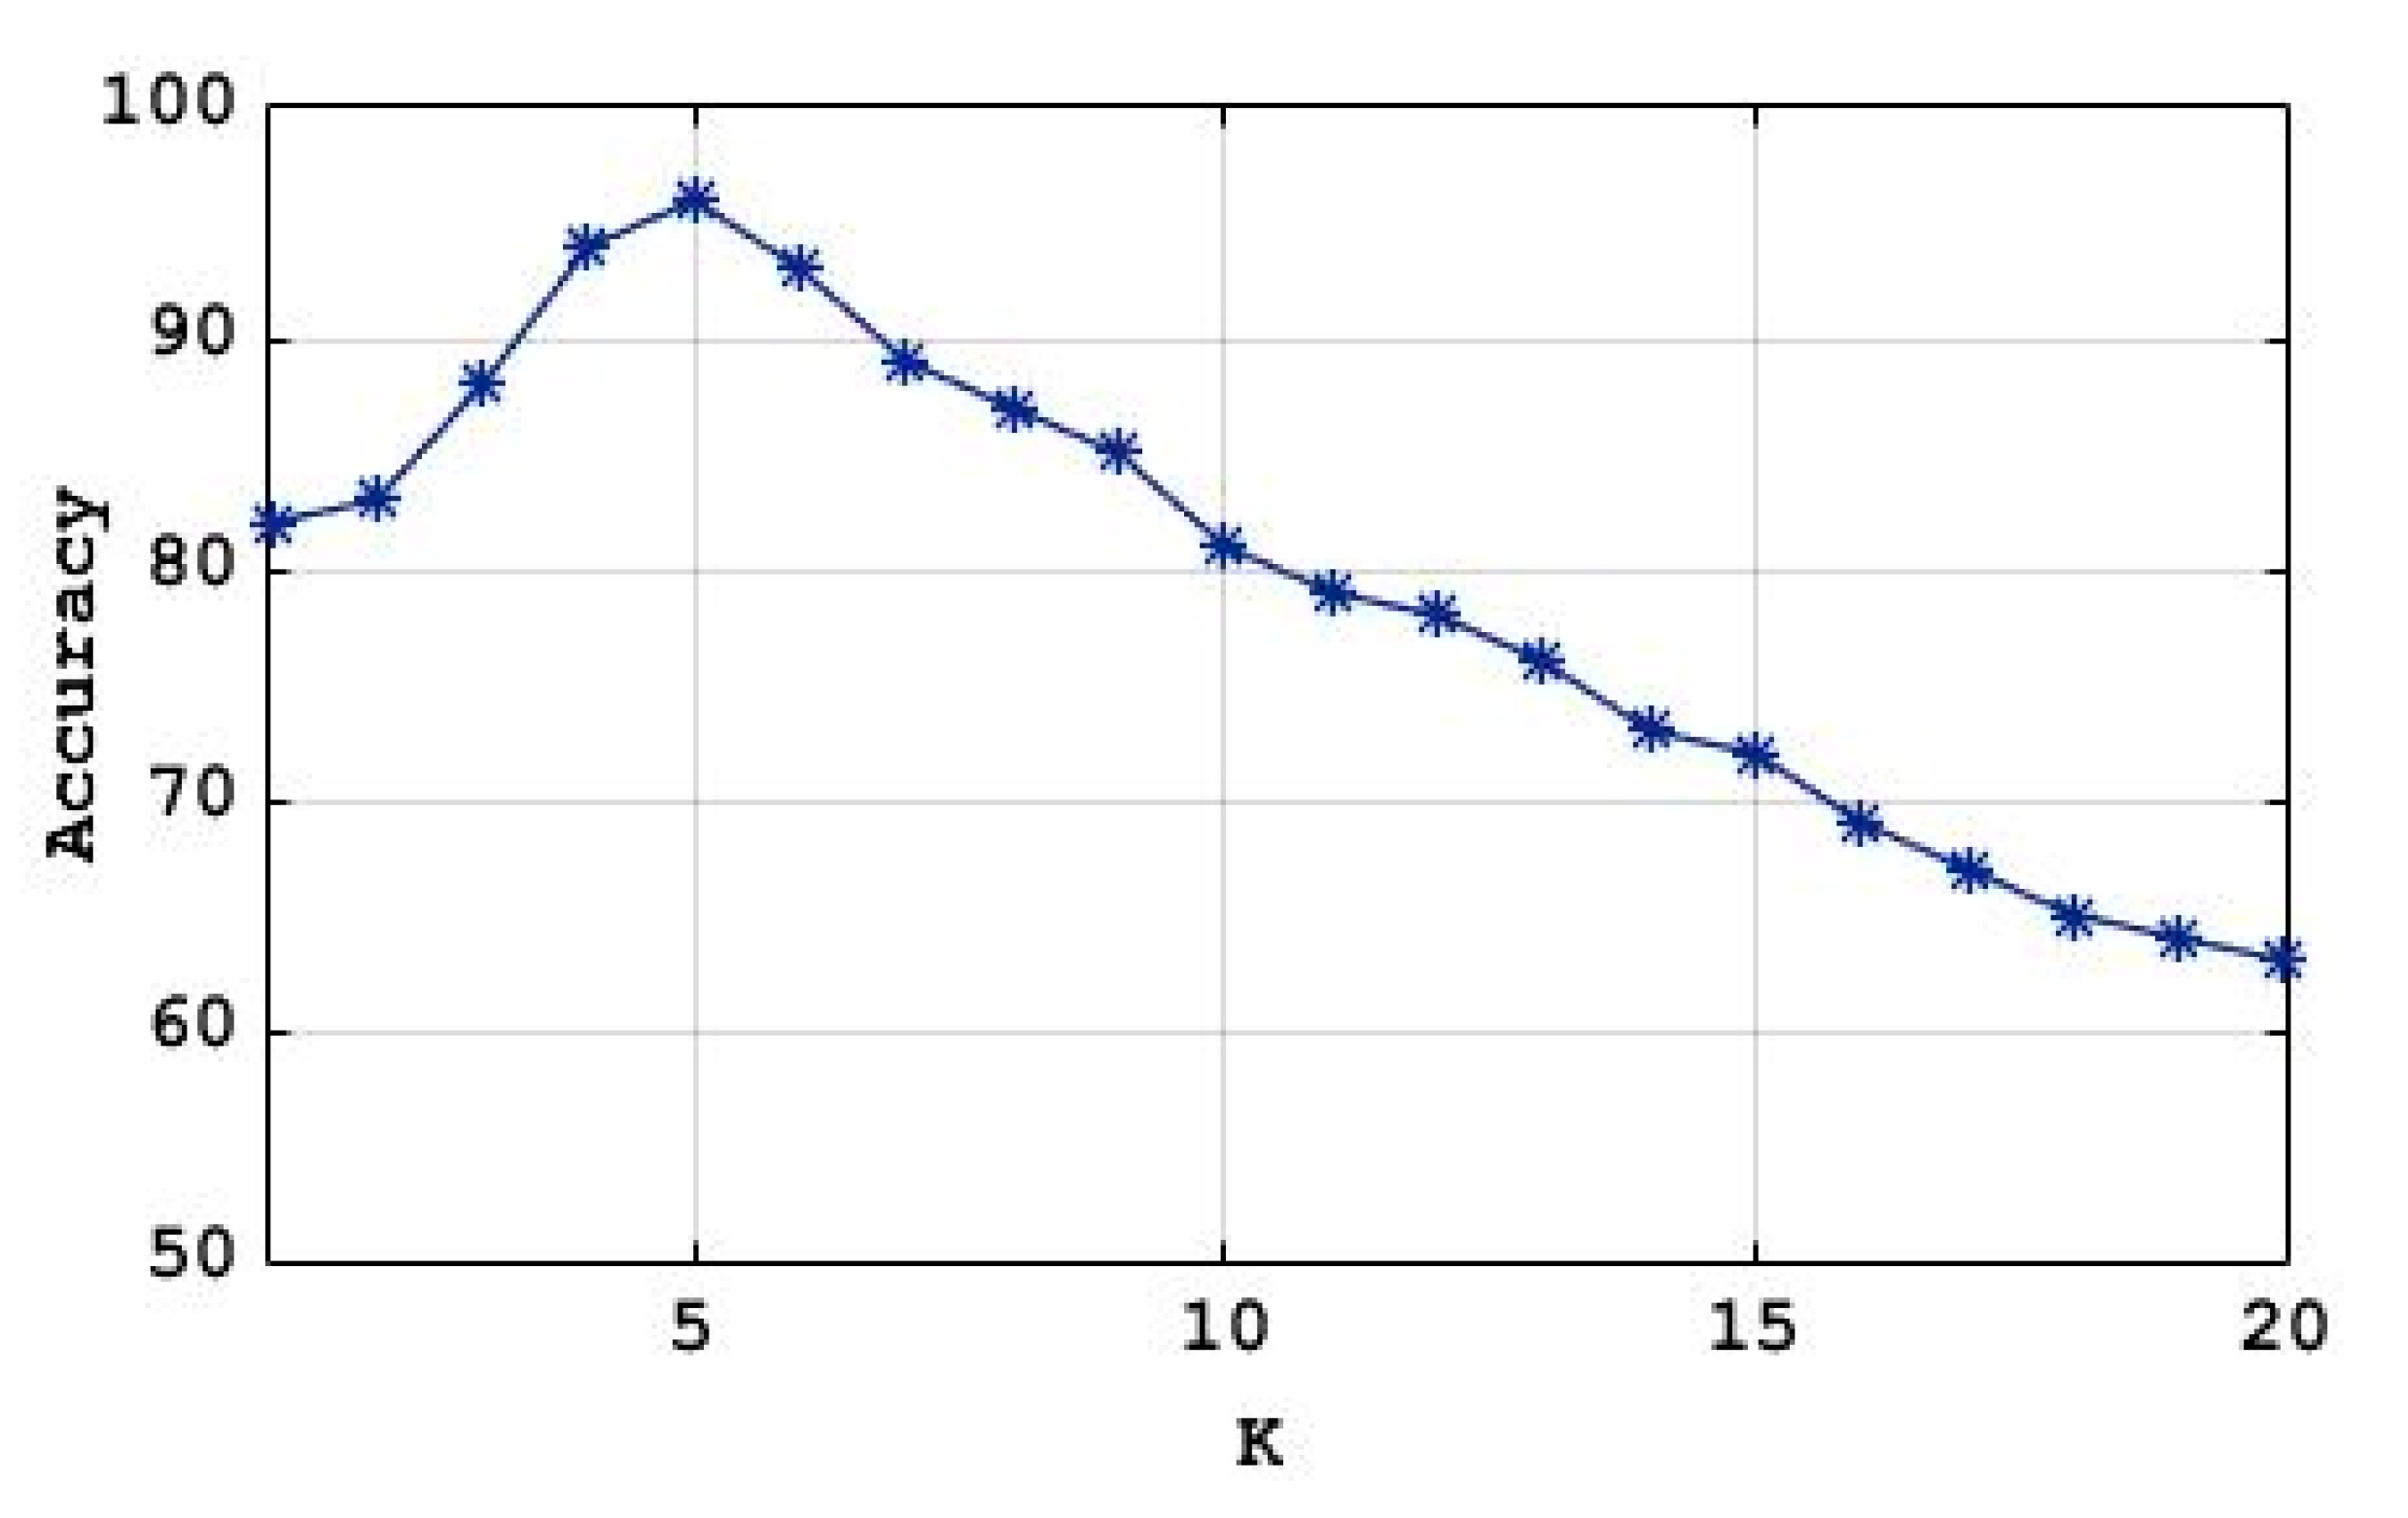
Let
be the features of sample and
be the two classes that defined for the proposed kNN algorithm. In this paper, through trial and error, the value of
(number of nearest neighbors) was set to 5. As shown in
Figure 4, the accuracy of kNN classification for our dataset with
was 96% higher than other k-values. In order to measure the similarity between the test sample and training samples, we also use the Euclidean distance (ED) function. To do this, consider
as an input sample with features
and
as the total number of input samples. The Euclidean distance between sample
and
is defined as
In this study, we used the experimental results obtained in [
1] as input training samples for the proposed kNN algorithm.
Table 1,
Table 2, and
Table 3 illustrate some of the selected samples for both LoS and NLoS classes.
| Algorithm 1. K-nearest neighbor (kNN) classification method |
Given:
● training examples
where is a feature-value representation of examples and is the class label.
● testing point that is to be classified |
Algorithm:
1. compute distance 1 (or similarity) to every training example
2. select nearest instances and relevant labels
3. the output is the class which is most frequent in |
| 1 Distance functions such as Euclidean distance, Minkowski distance, Jaccard distance and so on. |
5. Performance Evaluation
In this section, the network model, simulation tools, adversary models and evaluation metrics are described in detail.
5.1. Simulation Environment
The proposed research is simulated and evaluated using the network simulator (NS-2) with a simulation of Urban MObility (SUMO) and MObility model generator for VEhicular networks (MOVE) tools for the urban environment. The SUMO is a free implementable simulator that supports the car-following model. The MOVE tool is created over an open-source microtraffic simulator SUMO. The output of MOVE is a mobility trace file containing information on real-world vehicle movements that can be utilized by NS-2.
The OpenStreetMap (OSM) file of Kuala Lumpur, from the OSM database is also used. The vehicles’ maximum speed is defined at 100 . The simulation area is located at 2 × 2 . In this area (4 ), based on the size of the vehicle (about 3 m) as well as the required distance between two vehicles (about 3 m), the maximum node density is 500 nodes. Also, 10% of nodes are selected as malicious nodes that always provide false or bogus messages. The type of vehicle is also set before the beginning of the simulation. To this end, 10%, 20% and 70% of nodes are set as members of the high, medium and low level of authority, respectively. This is mainly because the number of private cars, in reality, is more than in the other classes. On the optimal data rate, to avoid message congestion, the channel bandwidth is adjusted at 10 Mbps for this simulation. The two-ray ground reflection model is utilized in the physical layer as the radio spread model. Furthermore, the vehicles’ transmission range is adjusted to 500 m, and all vehicles participating in the network have the same fixed transmission range. AODV is also used as a routing protocol. The simulation traffic source is Constant Bit Rate (CBR) with a value of 36 kbps concentrated on UDP packet generation traffic. An interface queue between MAC and Logical Link Control layer (LLC) with a maximum of 25 packets is utilized to store packets coming up for channel access. The overall simulation time is around 360 s. All configurations are simulated with 30 various random seeds to obtain a rational statistical significance.
5.2. Adversary Models
The aims of the proposed trust model are to deal with nodes who change behavior every time, nodes who send wrong data, and in addition faulty nodes. Based on these objectives, three different attacks, namely simple attack, opinion-tampering attack, and cunning attack are considered to assess the proposed trust model’s performance.
Simple Attack: A simple attacker prevents nodes from offering necessary services to other nodes, such as spreading the route discovery demands or forwarding data packets [
13].
Opinion-Tampering Attack: An attacker can propagate fake trust opinions and attempt to frame the benign nodes to keep the accurately malicious nodes unnoticed. The aim of this attack is to interrupt the accurate trust assessment, making it harder for the successful identification of malicious attackers [
21].
Cunning Attack: Sometimes cunning attackers can change their malicious behavior patterns to make it even more difficult for the trust controlling scheme to find them. For example, they can carry out malicious behaviors for some occasions and then stop for a moment (so the malicious behaviors are performed in an on-and-off mode). Furthermore, various behaviors can also be exhibited by the sly attackers to various audiences, resulting in the buildup of unreliable trust opinions for that node within different audiences. As a result of inadequate evidence to accuse the malicious attackers, identifying such sly attackers is normally very difficult [
8].
5.3. Performance Evaluation Metrics
In this work, state-of-the-art evaluation measures are utilized for assessing the proposed model’s performance, such as precision, recall, overall accuracy, and communication overhead. These metrics are well-known evaluation measures to validate the obtained results [
22].
Accuracy is the most intuitive performance action and simply a ratio of appropriately foreseen observations to the overall observations. Precision denotes the fraction of properly anticipated positive observations with the overall foreseen positive observations. Recall represents the ratio of appropriately predicted positive observations with all observations in an actual class. Davis and Goadrich in [
23] mentioned that these metrics are measured using the confusion matrix which is composed of four parameters, including, false-positive (
FP), true-positive (
TP), false-negative (
FN), and true-negative (
TN).
5.3.1. Precision
Precision is a fraction of the relative examples within the retrieved instances. In this study, relevant instances are the number of nodes correctly found as malicious nodes, and the retrieved instances are the total number of nodes correctly and incorrectly discovered as malicious nodes. The equation for this is given below:
where
TP is the number of nodes correctly found as malicious nodes and FP is the number of nodes incorrectly detected as malicious nodes.
5.3.2. Recall
Recall represents the fraction of the related cases retrieved over the overall quantity of the related instances, where the relevant instances are the number of nodes appropriately discovered as malicious nodes, and the total amount of relevant instances are the total number of malicious nodes. It is measured using Equation (7) as shown below:
where
TP is the number of nodes correctly found as malicious nodes and FN is the number of nodes incorrectly detected as nonmalicious nodes.
5.3.3. Overall Accuracy
A trust model is understandably permanently anticipated to be correct. Indeed, it is supposed to positively differentiate between malicious and benevolent nodes in a community, in a high percentage. Shaikh and Alzahrani in [
4] mentioned that overall accuracy characterizes the proportion of the overall number of correct results. It is calculated via Equation (8):
where
TP is the number of nodes properly found as malicious nodes,
TN is the number of nodes correctly detected as nonmalicious nodes,
FP is the number of nodes incorrectly found as malicious nodes and
FN is the number of nodes incorrectly detected as nonmalicious nodes.
5.3.4. Communication Overhead
Due to the huge size of vehicular ad hoc networks that lead to large message dissemination as well as frequent message exchange of nodes, communication overhead is a suitable metric for comparative evaluation of the proposed trust model. Garcia et al. [
24] stated that communication overhead is the total number of packets to be transferred from one node to another. In this study, additional messages exchanged in the network, except the event messages, is defined as communication overhead.
In this study, both the ART scheme and the WV approach is used to evaluate and compare the performance of the proposed model.
ART is a trust model based on data and entity to handle malicious attacks. In this model, data trust is centered on data gathered from multiple vehicles, and entity trust is evaluated using functional and recommendation trust values. In the ART model, the results of analyzed traffic data are summarized as evidence for trust controlling schemes for trustworthiness evaluations. ART utilized the Dempster–Shafer method to combine various pieces of evidence that comprise both untrustworthy and trustworthy information [
7].
WV has been widely used as the baseline method in different studies for detecting misbehaviors in wireless networks [
7,
25,
26,
27]. According to [
27], WV provides better results when compared with other techniques such as Bayesian theorem (BT), even when the evidence is less substantial, and the average trust of nodes is low. The WV method summarizes all the votes associated with an event with each vote weighted by the corresponding trust level of the entity supporting the event. To this end, it is assumed that each vehicle has a different weighted vote. It is based on trust level, type of node (role) and authentication level. For example, the weight of a police car is more than that of a private car. For mathematical modeling, suppose a node
deciding among various basic events
, in terms of
pieces of evidence
(reports from K distinct nodes). The combined trust level
is measured by assessing evidence equivalent to an event
using Equation (9):
where
, if node
reports the event
and
, otherwise. The values of
are the weight of the respective event reported by a particular node taking a real value within [0,1].
6. Simulation Results and Discussion
In this section, the simulation results show the comparison of the precision and recall of F-TRUST with ART and WV approaches over different density, velocity and different percentages of malicious nodes under both LoS and NLoS states. Additionally, the overall accuracy and communication overhead of F-TRUST, ART, and WV under LoS and NLoS conditions are represented. Next, the comparison of performance evaluation of F-TRUST, ART, and WV under different patterns of attack is illustrated. Finally, in order to prove the validity of the proposed model, we compare the performance of F-TRUST with ART, and WV, using Monte Carlo simulations.
In order to get some confidence in the outcomes of the simulation, it is good practice to launch several runs for each simulated scenario. In this study, each simulation scenario has 30 runs. At the beginning of each simulation, the initial node placement is reassigned on a random basis, with a different random seed, so that all initial conditions are necessarily different from one another. It ensures a unique node placement for each run. In addition, each experimental result is the average of the 30 runs for each simulation scenario. The 95% of Confidence Interval (CI) has been calculated for the collected performance metrics unless they (CI) are profoundly small. In the following sections, the performance evaluation of the proposed model is presented.
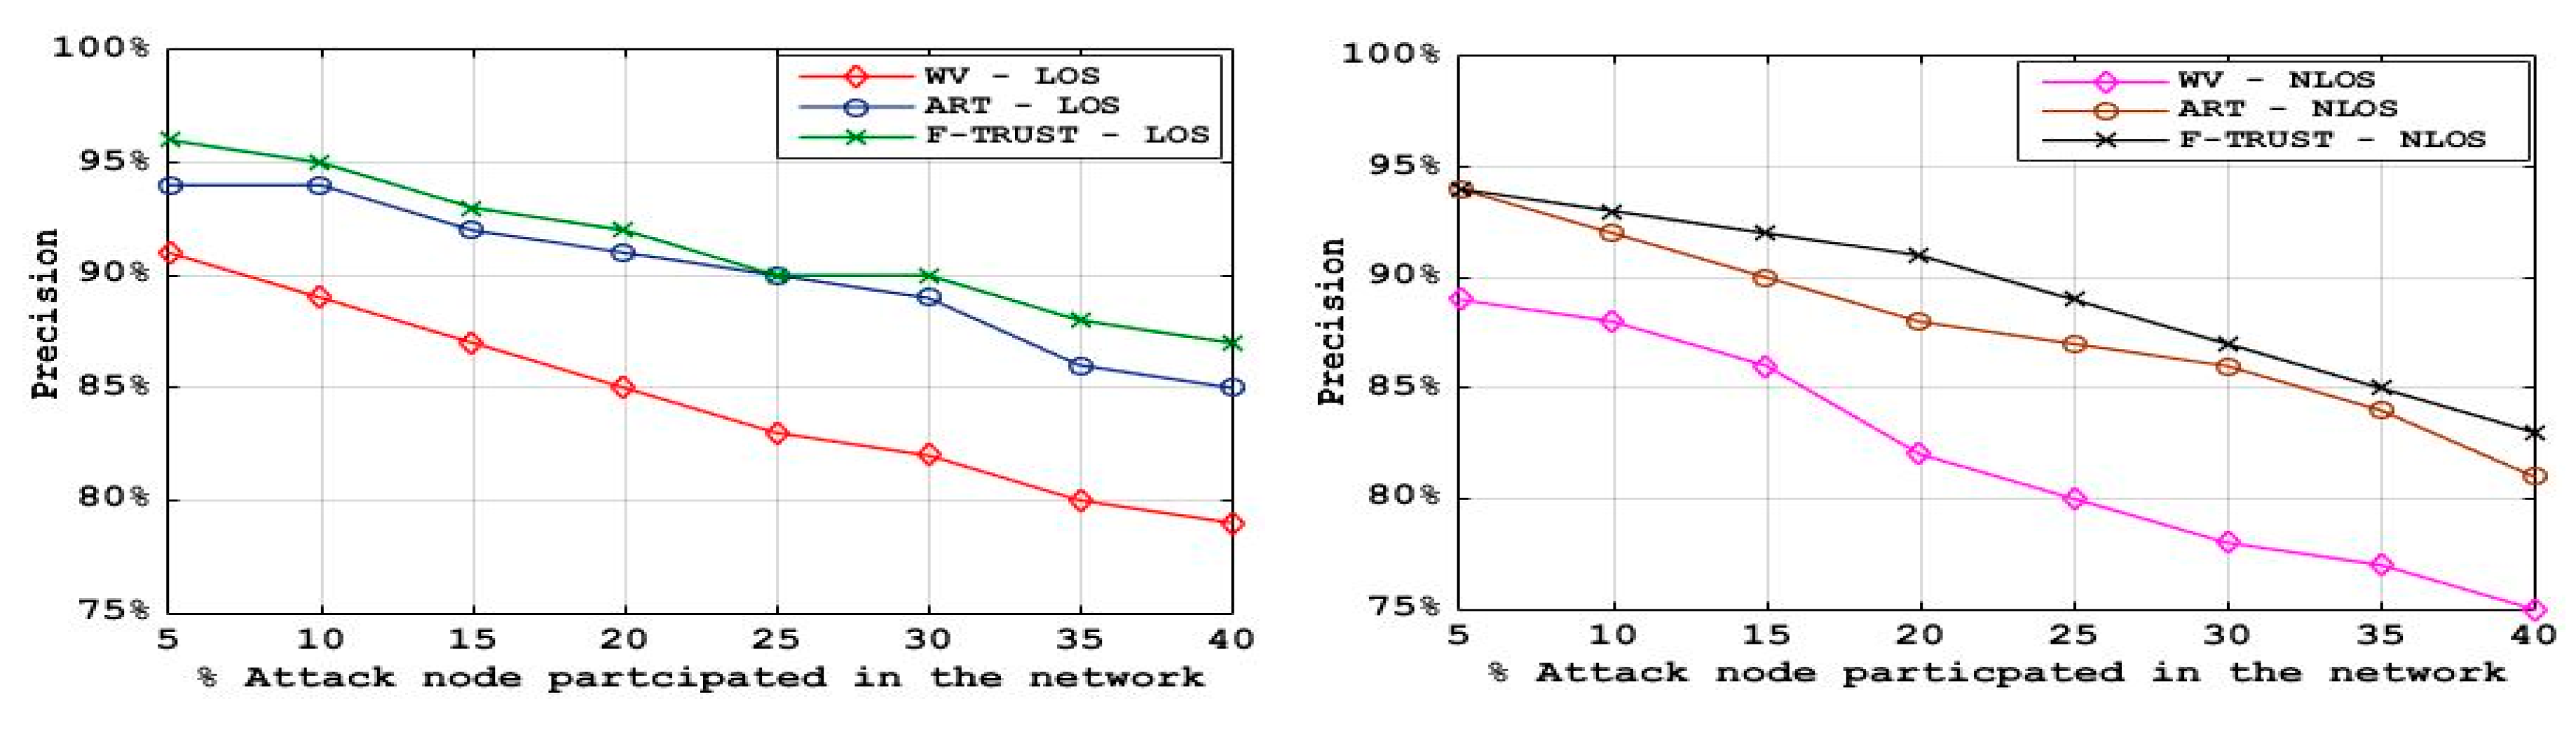
6.1. Precision
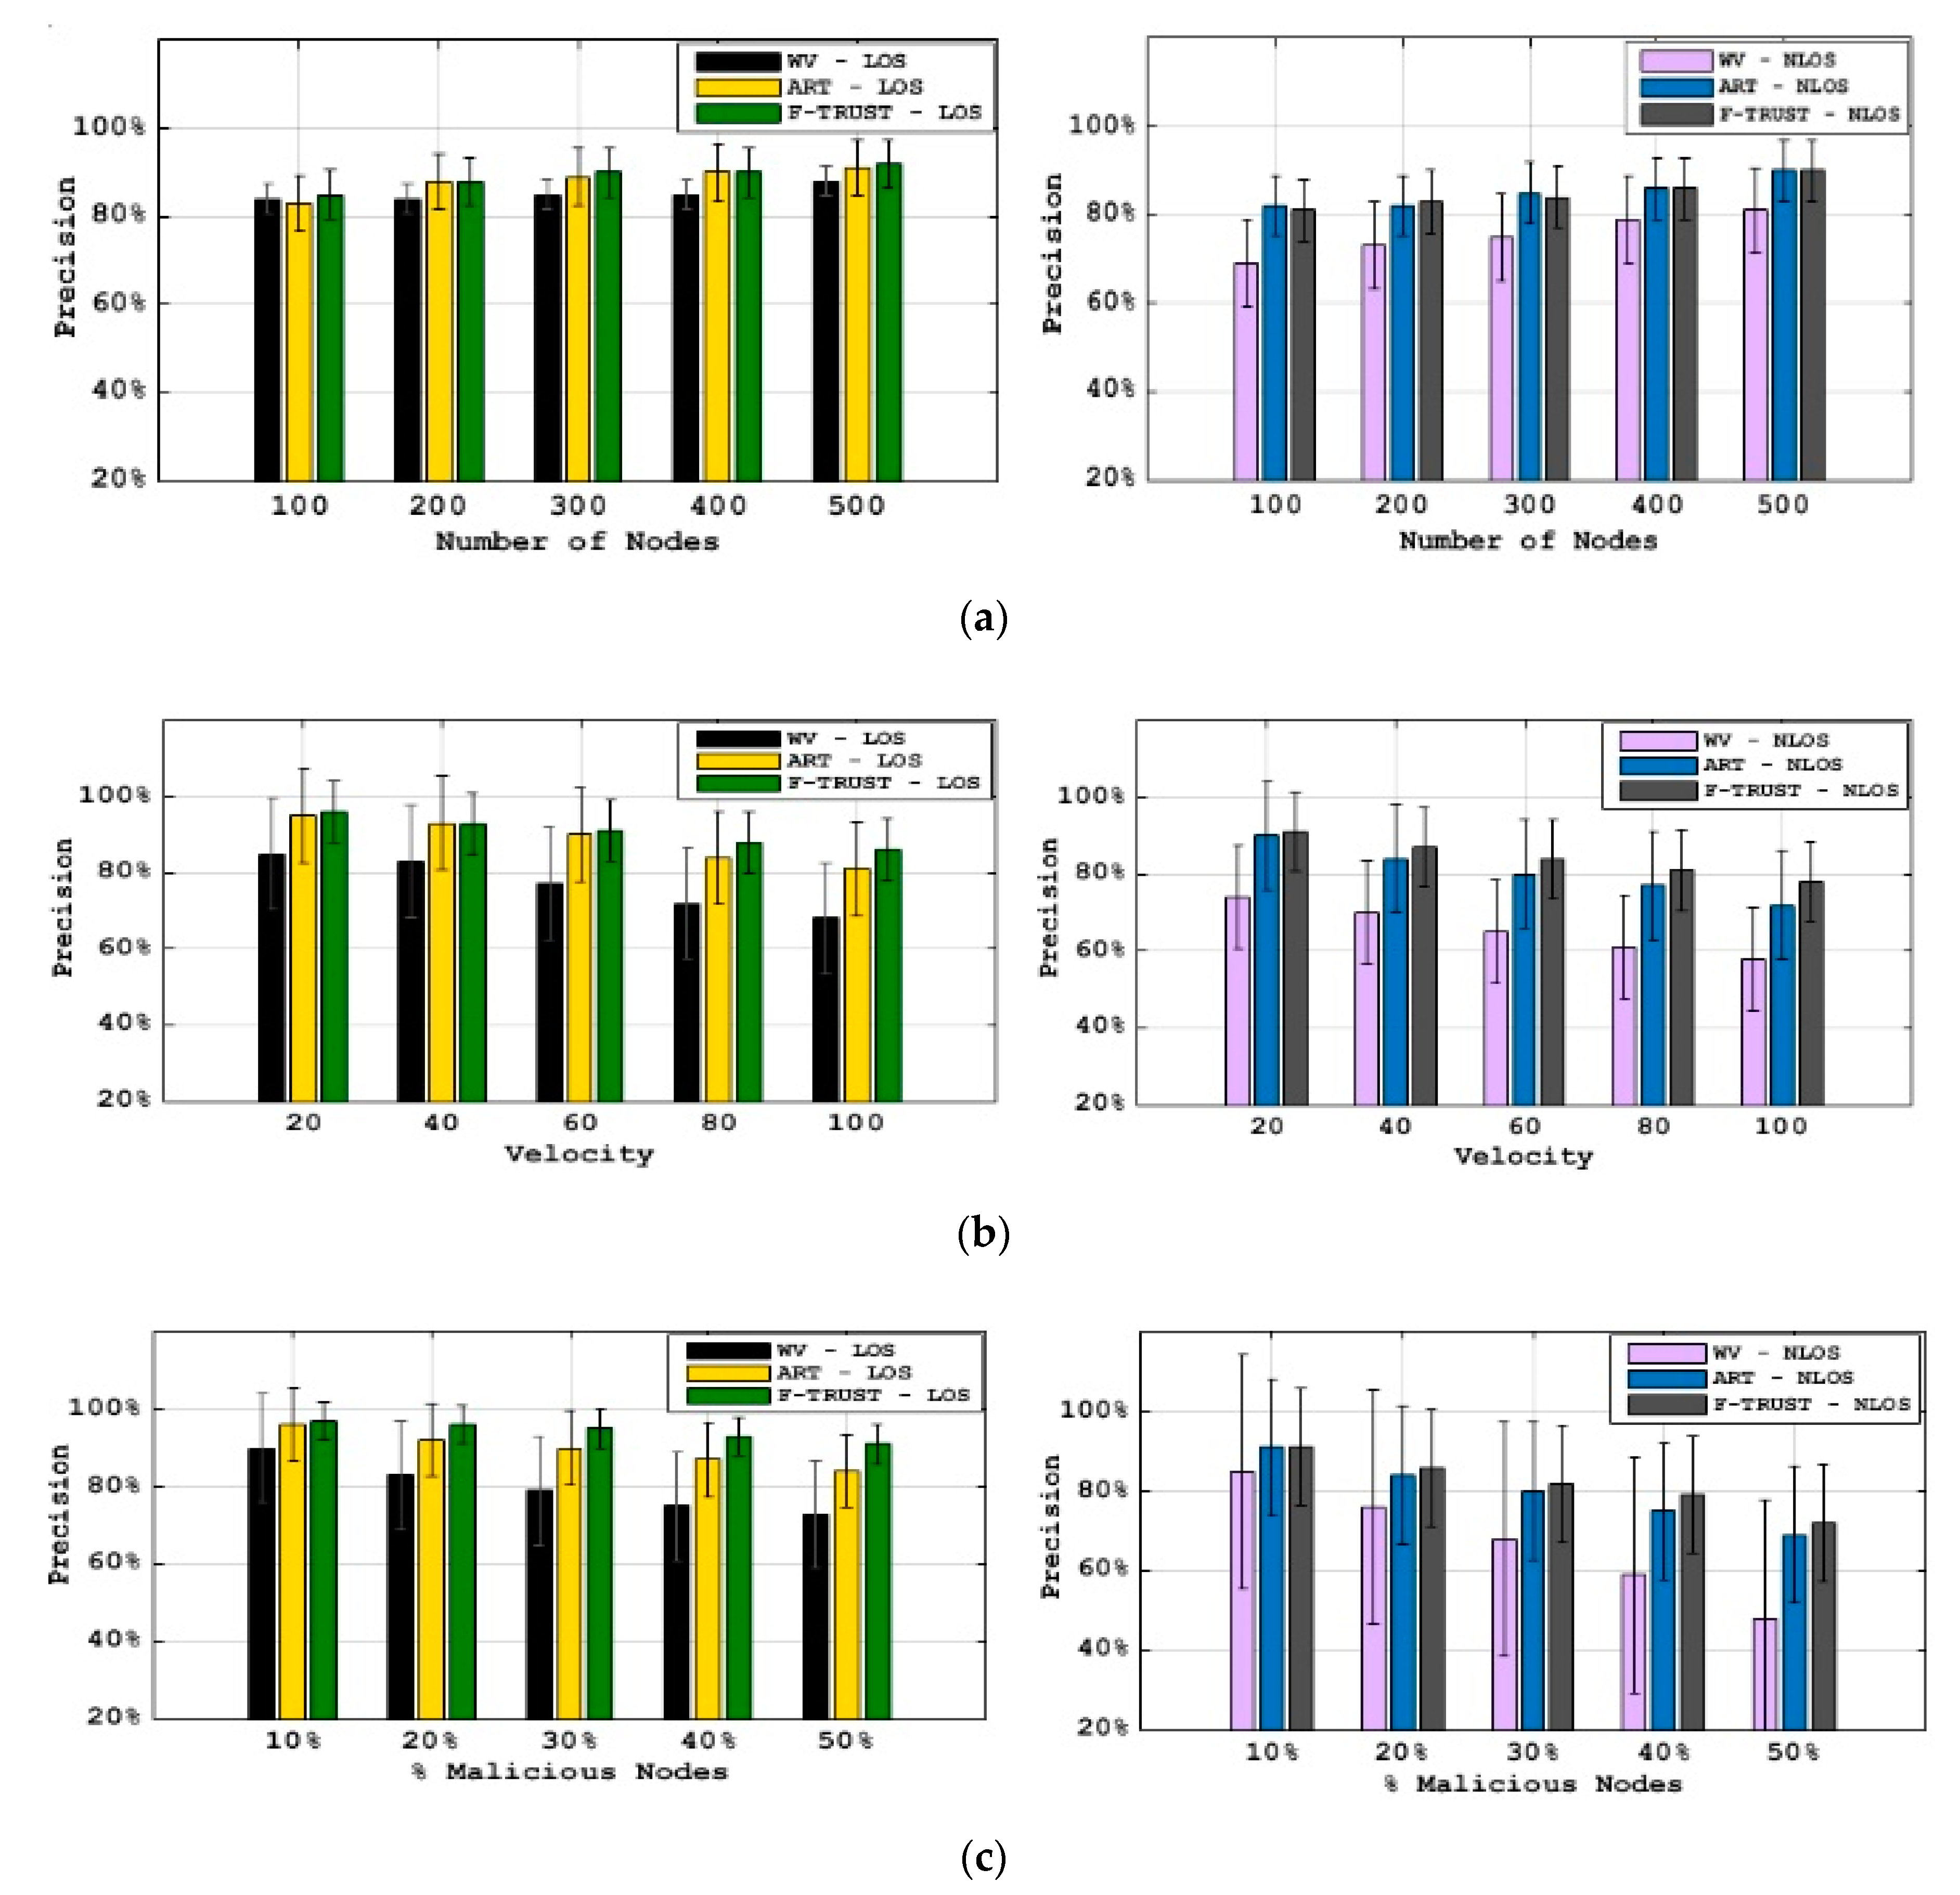
Figure 5a shows the effect of node density on
F-TRUST, ART, and WV. As shown in this figure, the
F-TRUST has a higher precision score than both ART and WV methods when the density of nodes varies. Moreover, when the node density is higher, these three methods yield a better precision. This is true because it is more likely to receive true data from others when there are a higher number of well-behaved nodes. Since movable and immovable obstacles prevent nodes to exchange true data, it is no surprise that
F-TRUST under LoS is more precise than when under NLoS. As demonstrated by the simulation results, the impact of obstacles on WV is more than that on ART and the proposed model. This means that precision in the NloS condition reduces by approximately 5% for
F-TRUST, and approximately 10% for the WV approach.
Figure 5b illustrates the comparison of the precision of the
F-TRUST, ART, and WV when the nodes move at different velocities. In both LoS and NloS conditions, these figures show that the precision values are lower when the vehicles are moving faster. This is true because when the vehicles are moving faster, it is generally more difficult for the information regarding the untrustworthy vehicles to propagate.
Figure 5c depicts the precision value for the
F-TRUST, ART and WV methods with different percentages of malicious nodes. It is obvious that precision decreases when a high percentage of malicious nodes participate in the network. This value decreases more in the NloS condition. This is mainly because the obstacles and malicious nodes prevent nodes from exchanging proper data.
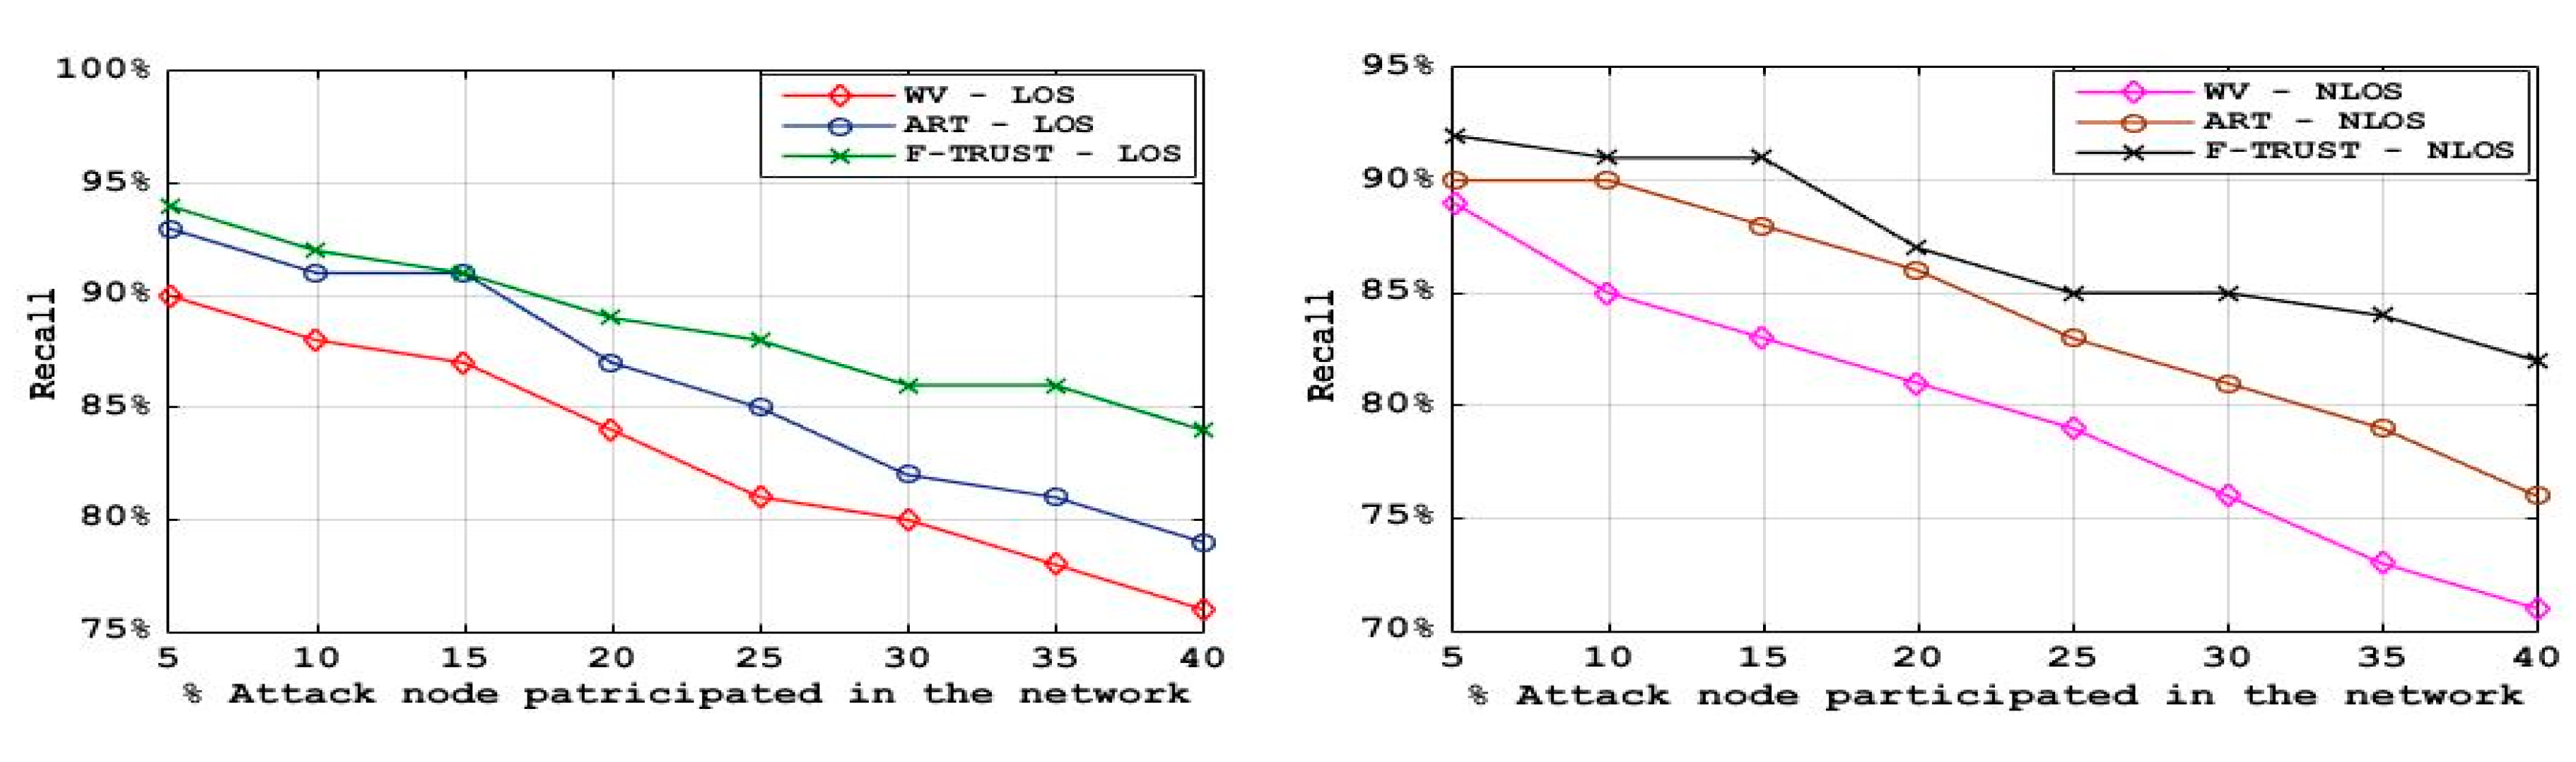
6.2. Recall
In this subsection, the simulation results show the recall of F-TRUST in comparison with ART and WV approaches in both LoS and NLoS conditions. As stated above, the high value of recall indicates that the proposed model is more sensitive to malicious nodes. In the following, the effect of velocity, density, and number of malicious nodes on recall are described.
Figure 6a shows the impact of node density on the recall of
F-TRUST, ART and WV. As shown in this figure,
F-TRUST, ART, and WV have a higher recall score when the density of nodes is increased. Additionally, the sensitivity of the proposed model to malicious nodes is higher than that of the WV method. This figure shows that
F-TRUST’s recall score in the different density of nodes is higher than that of both ART and WV. As shown in this figure, obstacles have a negative impact on schemes, but they do not substantially affect
F-TRUST. This is because
F-TRUST uses a cooperative multi-hop approach to validate the node and recover from NLoS by trying to reach it through other nodes. In contrast, the recall of WV has a dramatic reduction of about 20% under NLoS conditions, but this is less for ART.
Figure 6b demonstrates the comparison of the recall of
F-TRUST, ART, and WV when the nodes move at different velocities. As shown in this figure, the recall score of these schemes is reduced when the nodes are moving faster. In the LoS condition, the recall value of
F-TRUST, ART, and WV is 83%, 81% and 65% at the highest velocity of vehicles (100 km/h), respectively. This figure shows that the impact of obstacles on
F-TRUST and ART is not substantial, whereas it is much higher on WV. This is to say that the
F-TRUST scheme outperforms the ART and WV schemes at different velocities of nodes.
Figure 6c depicts the recall value for the
F-TRUST scheme and the WV method with different percentages of malicious nodes. It is obvious that the recall value is decreased when there is a high percentage of malicious nodes. In addition, the
F-TRUST scheme is able to produce a better performance than the baseline method in terms of recall value.
Based on the obtained results from the evaluation of F-TRUST, ART, and WV over density, velocity and different percentage of malicious nodes participating in the network, the overall comparison shows that the proposed scheme outperforms ART and WV approaches. It always achieves a higher precision score than both ART and WV when the node density varies. Moreover, when the node density is higher, both methods yield a better precision. This is true because there is a higher likeliness of receiving true data from others when there are a higher number of well-behaved nodes. Similarly, the F-TRUST scheme also outperforms the ART and WV method in terms of recall. Furthermore, the recall value is higher when the node density is higher.
The results also illustrate that F-TRUST always outperforms both ART and WV methods when the nodes move at different speeds. The precision and recall values are lower when the vehicles are moving faster. This is true because when the vehicles are moving faster, it is generally more difficult for the information regarding the untrustworthy vehicles to propagate. Thus, it is expected to take more rounds of communication to disseminate the information.
The obtained results show that both the precision and recall values decrease when there are a higher percentage of malicious nodes. In addition, F-TRUST is able to produce a better performance than ART and WV in terms of both precision and recall values.
6.3. Overall Accuracy
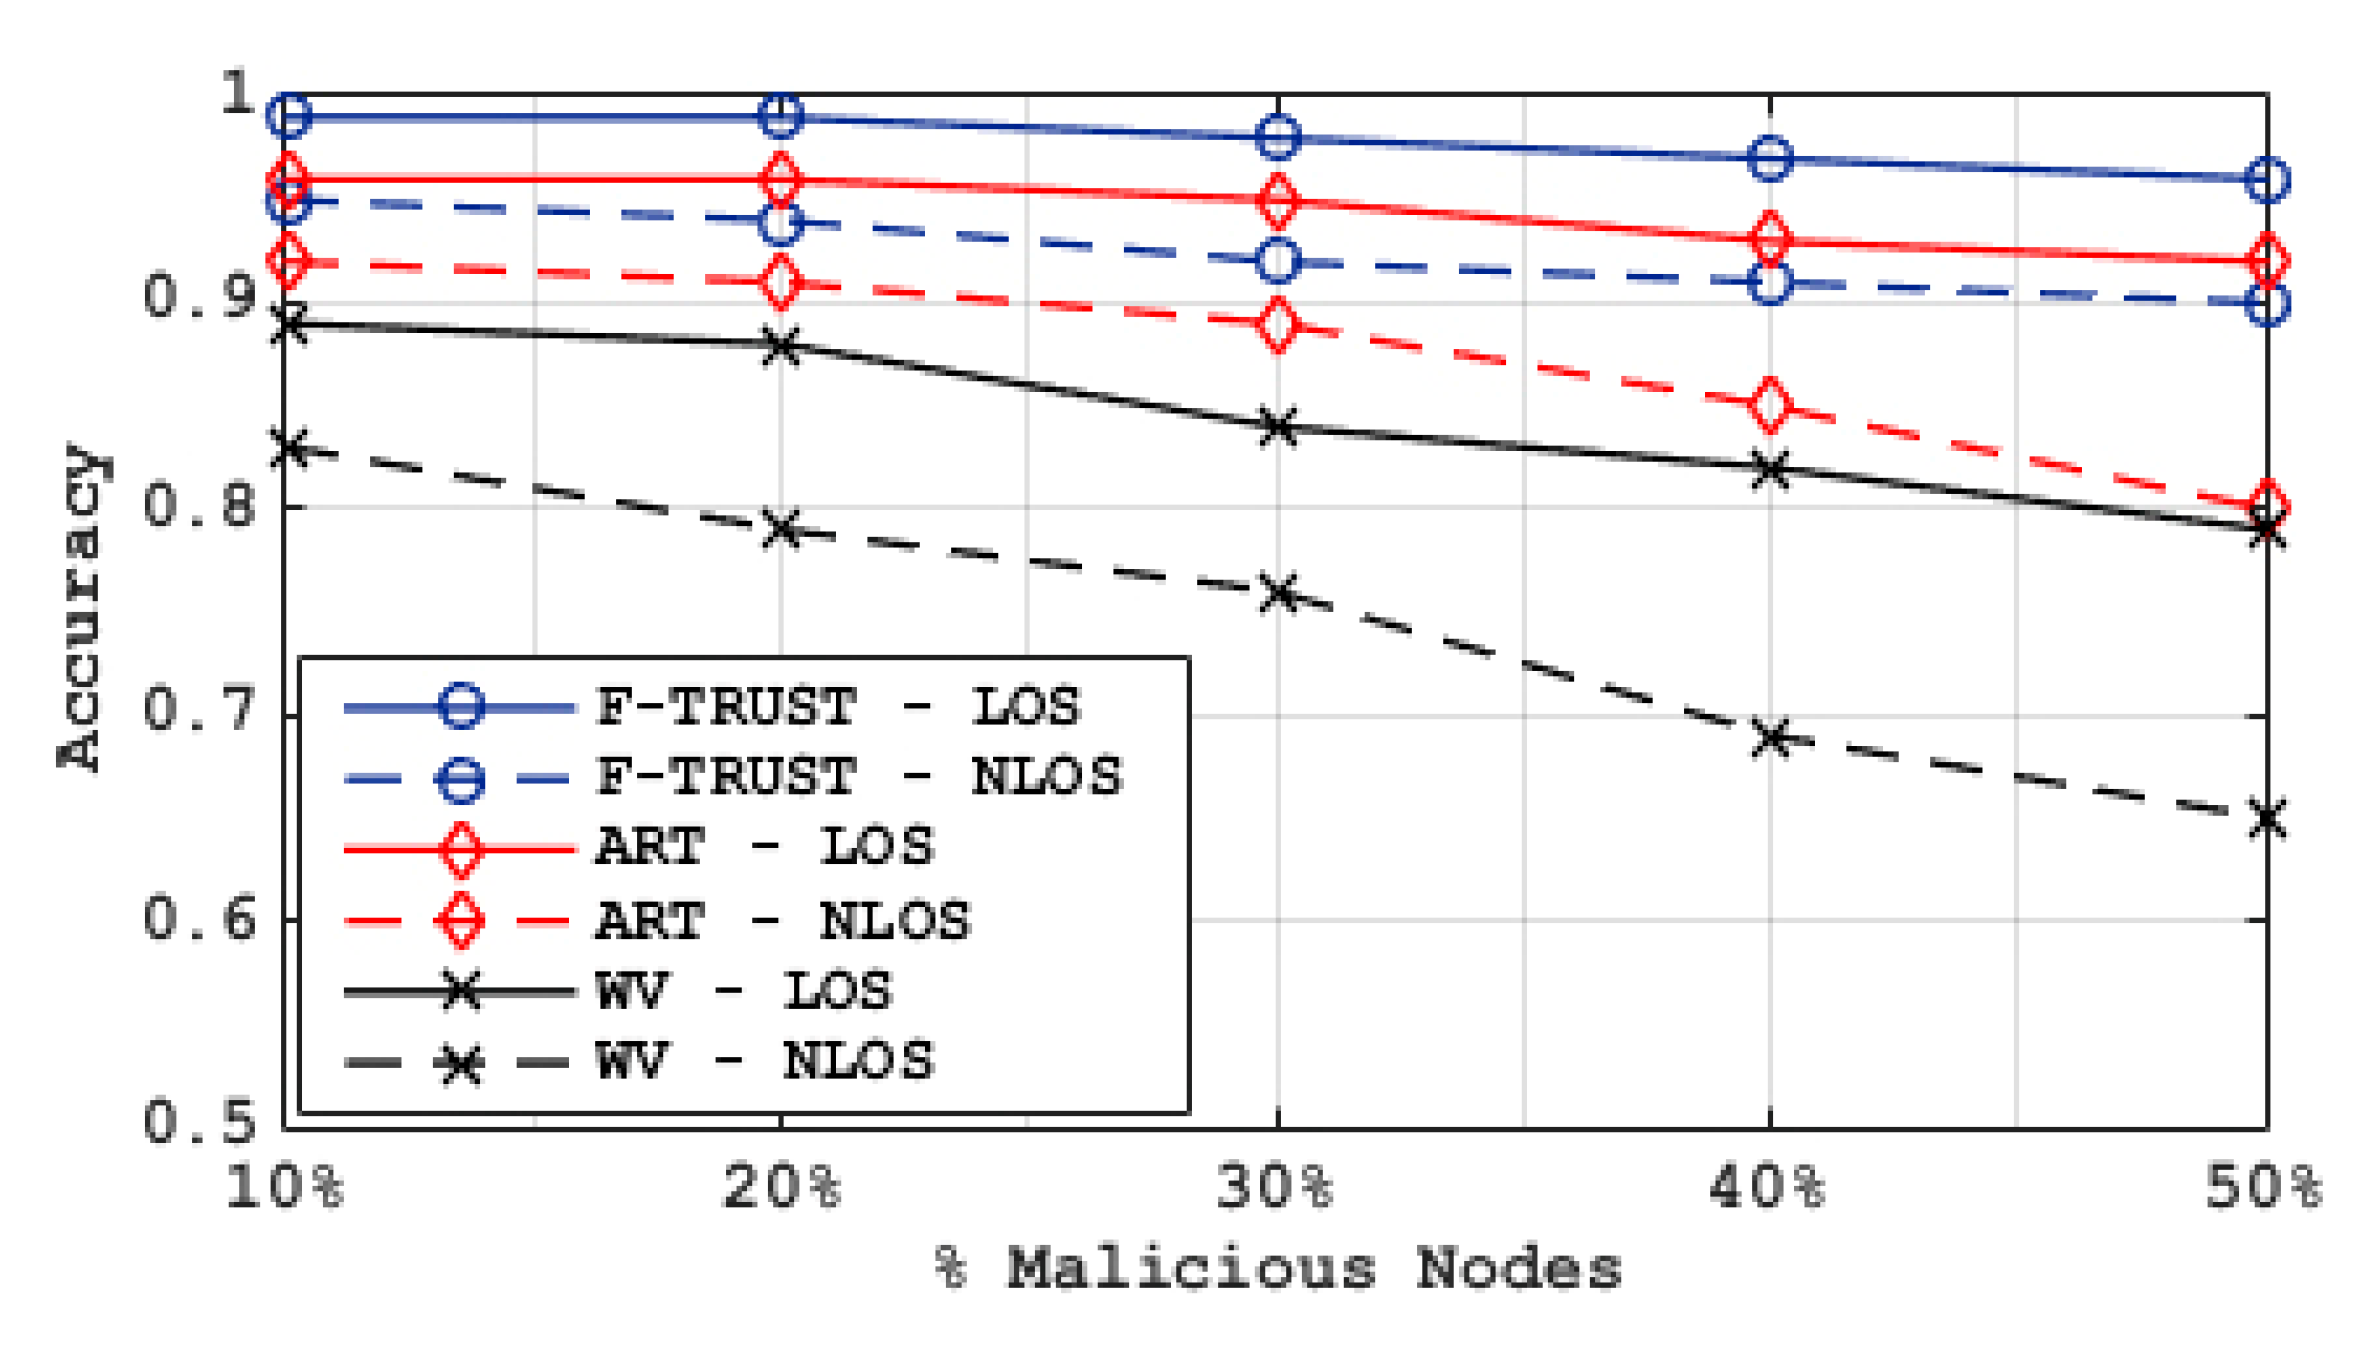
This subsection presents the comparison of overall accuracy between the
F-TRUST, ART and WV approaches. Here, accuracy represents the proportion of the total number of results that were correct.
Figure 7 shows that the proposed trust model under both LoS and NLoS conditions is more accurate than WV. Of course, with the increasing number of malicious nodes, the accuracy of the proposed trust model, ART scheme, and WV approach would decrease. Note that when 10% of the nodes in the network behave improperly, the accuracy of
F-TRUST is approximately 0.99, whereas it is about 0.96 and 0.89 for ART and WV, respectively. In the worst case, where 50% of vehicles in the VANET spread bogus or false traffic warnings as well as being under NLoS condition, the accuracy of
F-TRUST is about 0.9; whereas it is 0.8 and 0.65 for ART and WV, respectively. It is absolutely clear that the overall accuracy when under LoS is more than when under NLoS. A worsening in the accuracy of the model can be observed when the percentage of malicious users increases. It is less for
F-TRUST and ART than WV because WV is based on recommendations and neighbor nodes’ opinions. This means that by colluding, malicious users are able to more easily subvert the trust mechanism since the recommendations they provide are always false.
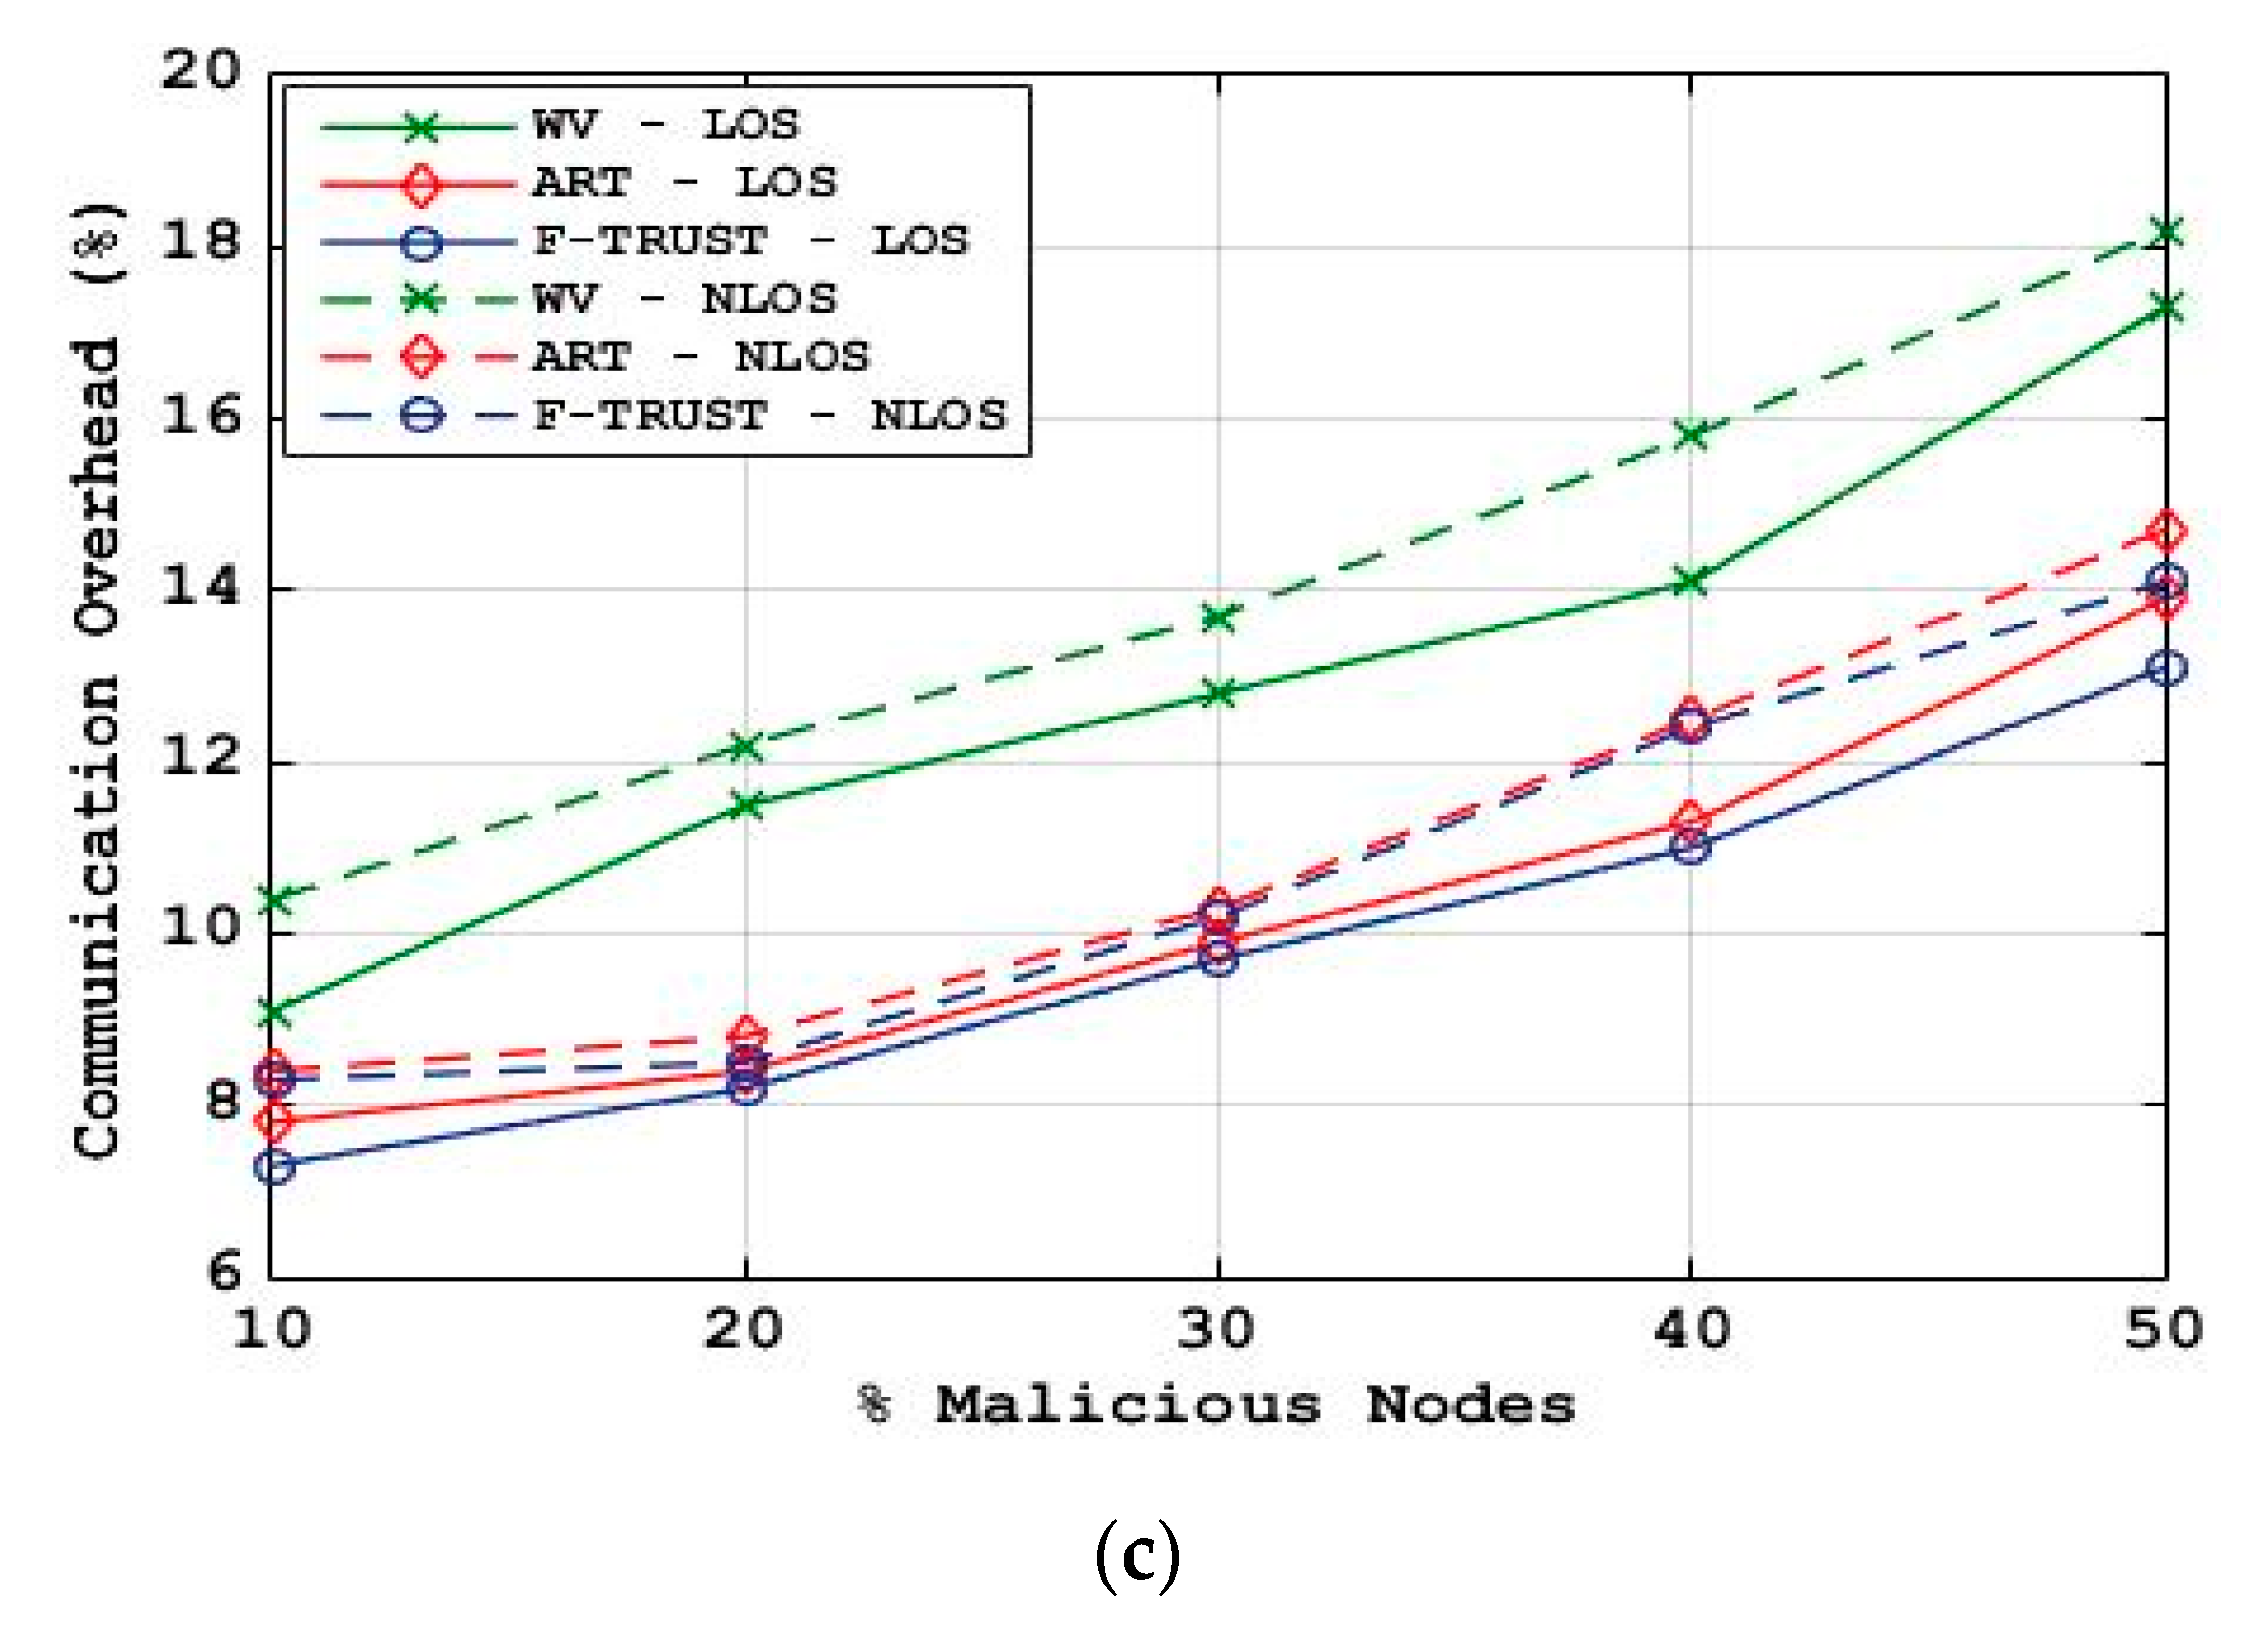
6.4. Communication Overhead
According to [
28], communication overhead is the total number of packets to be transferred or transmitted from one node to another. In this paper, the messages exchanged between sender and third-party node, as well as the receiver and third-party node is known as communication overhead. Of course, the communication overhead will be increased under the NLoS state. In the following, the communication overhead of F-TRUST, ART, and WV are evaluated over density, velocity and the different number of malicious nodes. As shown in
Figure 8, overhead communication is increased when the node density, velocity, and number of malicious nodes are ascending.
Figure 8a demonstrates the impact of density on communication overhead of
F-TRUST, ART, and WV under LoS and NLoS. Naturally, this metric in the LoS condition is lower than in the NLoS condition. This is true because the obstacles cause the vehicles to use third-party nodes for evaluation. On the other hand, the high density of nodes in the network increases the communication overhead.
Figure 8a shows that
F-TRUST is more cost-effective than ART and WV in terms of the communication overhead.
Figure 8b shows the impact of velocity on communication overhead. As shown in this figure, velocity also increases the communication overhead. This is because the vehicles exit each other’s transmission range due to the high speed, hence, nodes need to send requests to third-party nodes. This is more so in the case of LoS obstruction. This figure shows that
F-TRUST introduces communication overhead lower than the ART and WV methods. As shown in this figure, the communication overhead of
F-TRUST in the case of NLoS is also lower than that of both ART and WV. Therefore,
F-TRUST is more cost-effective than other comparable models in different velocity.
Figure 8c shows the performance of
F-TRUST when there are different percentages of malicious nodes in the network. As shown in this figure, malicious nodes are more effective than velocity and density on increasing communication overhead. As shown in this figure, the communication overhead of ART and WV are more than that of
F-TRUST in both LoS and NLoS states.
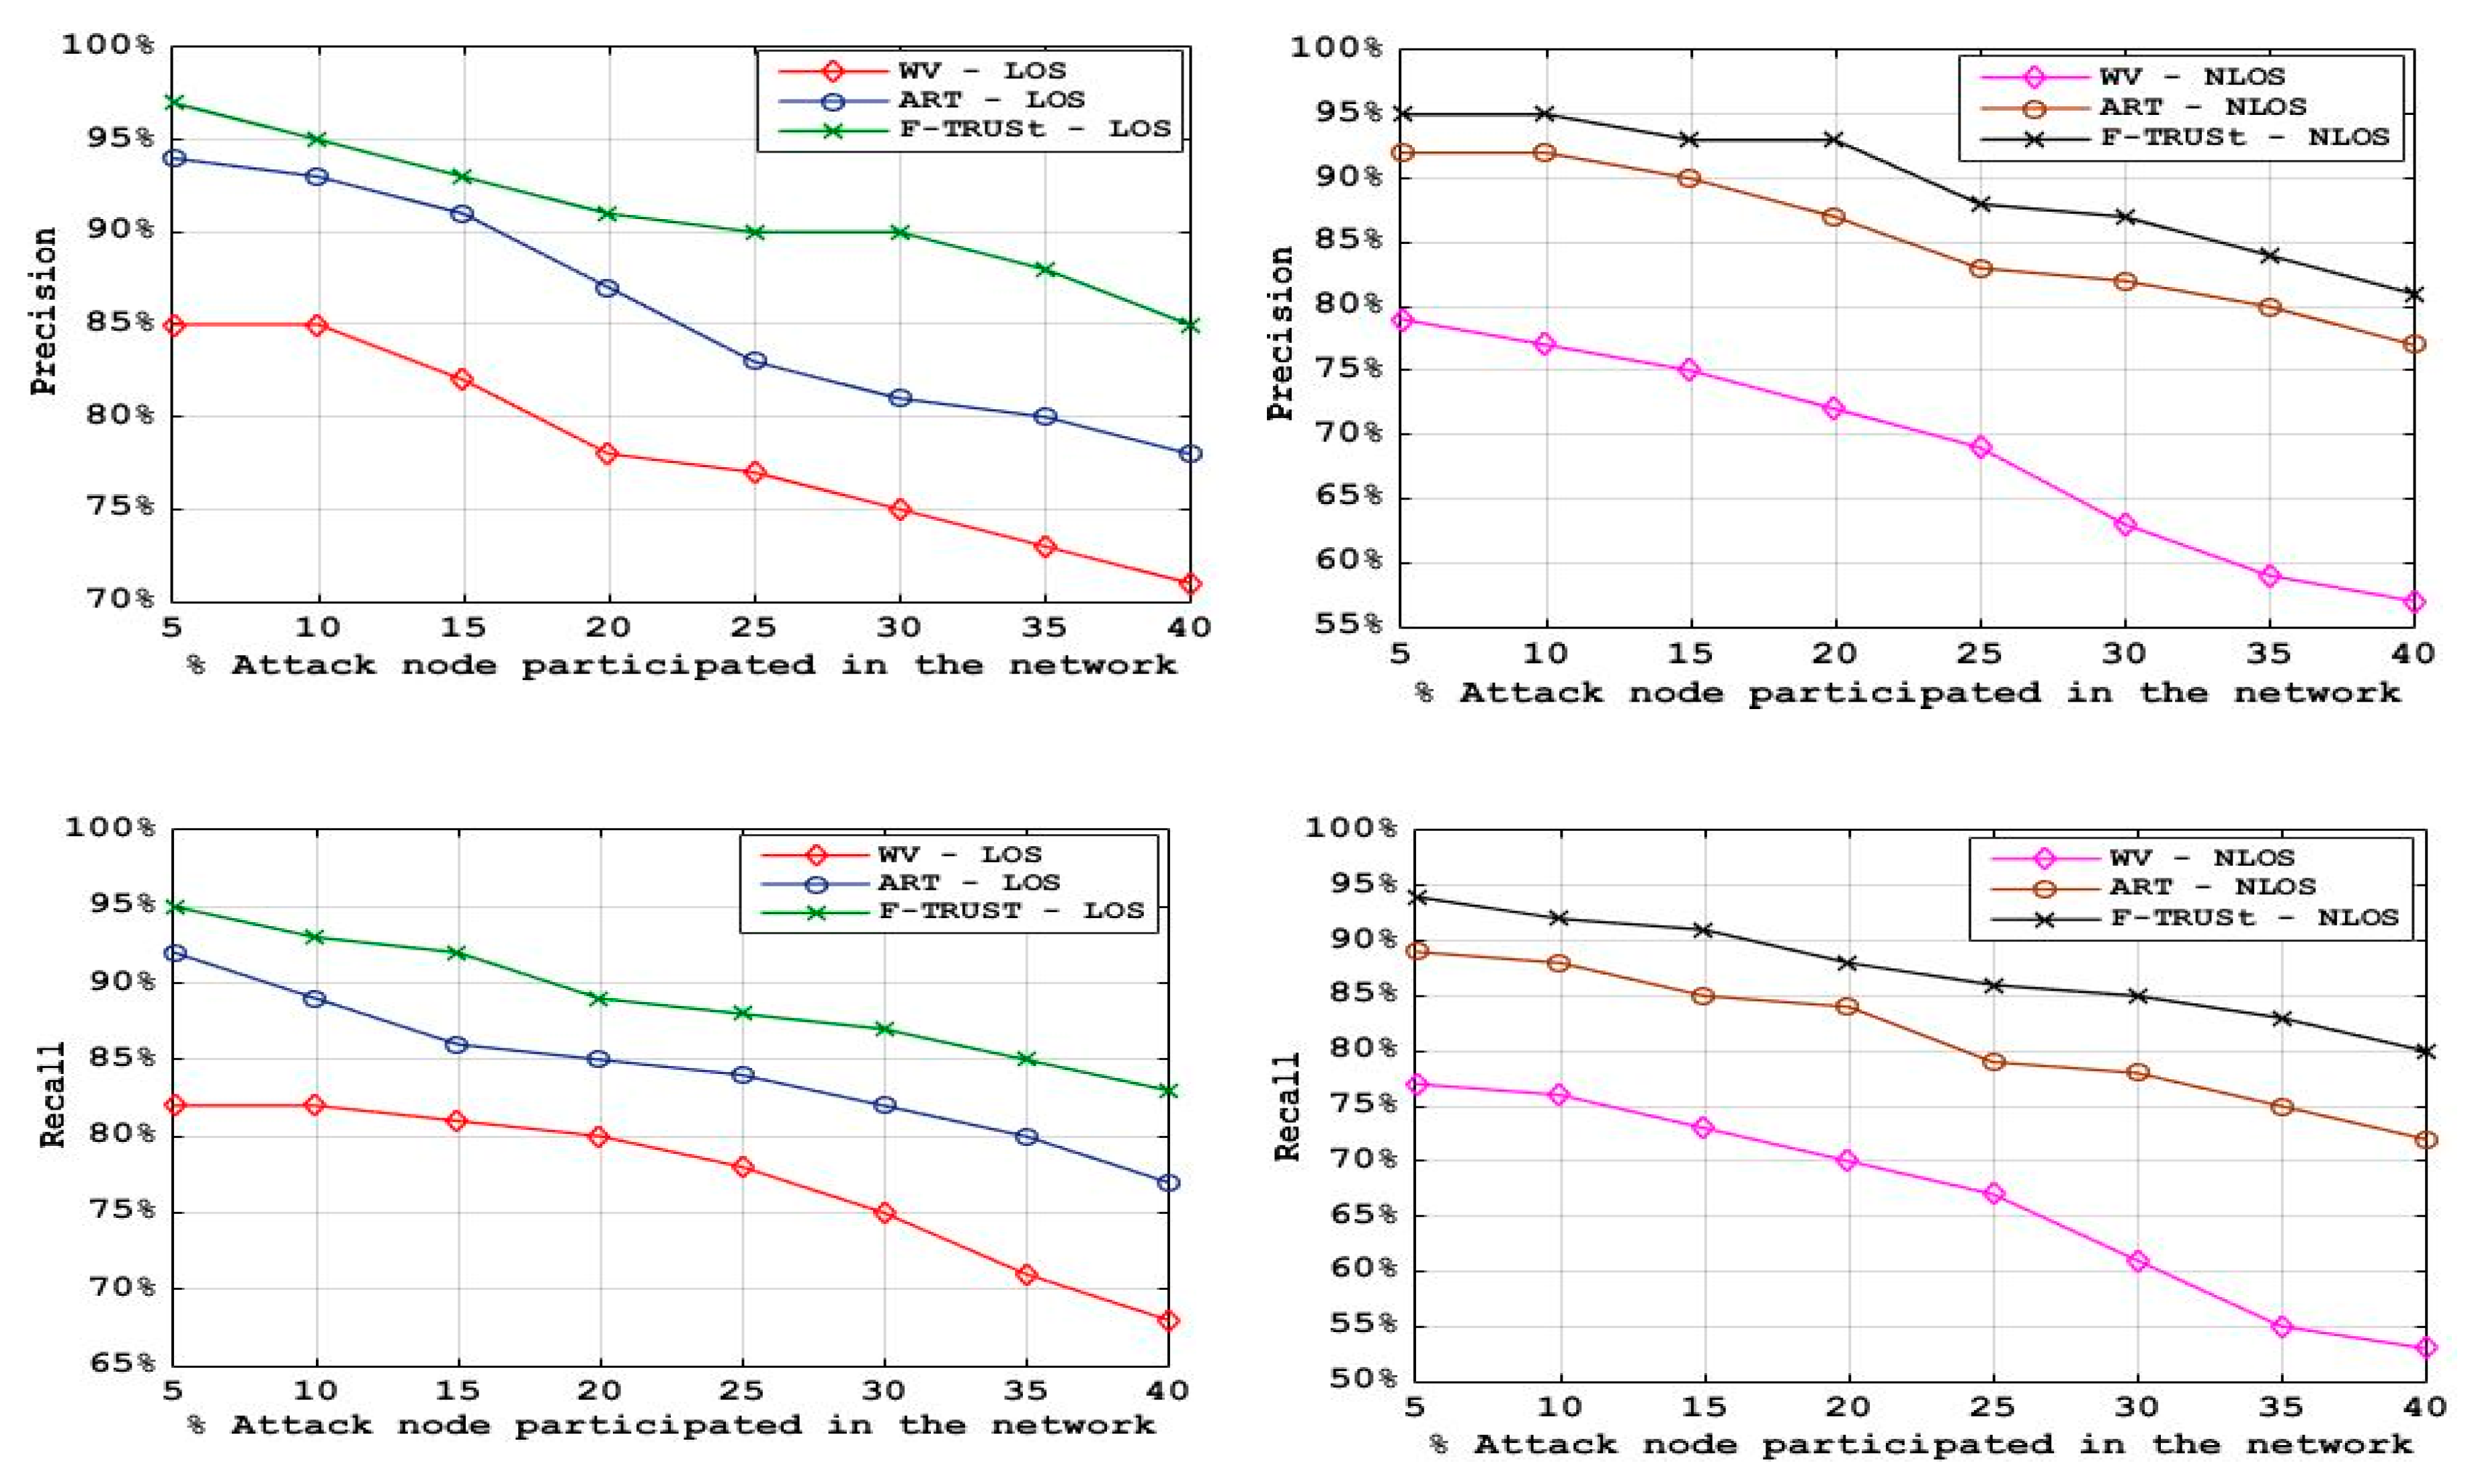
6.5. Performance Evaluation of F-TRUST under Different Patterns of Attack
In addition to the first set of experiments which aim to evaluate the overall performance of the proposed trust scheme under different network parameters, this paper is also particularly interested in knowing how well the proposed model is resistant to different attack patterns, such as a simple attack, opinion-tampering attack, and cunning attack, as described previously. Therefore, to observe the performance of F-TRUST with these attack patterns, some other experiments which involve launching different types of malicious attacks in both LoS and NLoS conditions are conducted. As shown in the following figures, the F-TRUST approach outperforms both the ART and WV approaches regardless of which attack pattern is utilized.
Figure 9 shows that the difference between the
F-TRUST, ART and WV approaches is not significant. It indicates that a simple attack pattern is not very difficult to cope with for the mentioned schemes. This is true because malicious nodes are simply dropping or modifying packets without spreading any fake trust opinions or framing any benign nodes.
Figure 10 shows that the WV approach suffers from the opinion-tampering pattern, especially when there are a large number of malicious nodes in the network, whereas the
F-TRUST and ART approaches can still achieve over 80% of precision and recall even when 40% of the nodes are malicious and are conducting opinion-tampering attacks. In the case of NLoS, the precision and recall of
F-TRUST and ART are better than that of WV when there are approximately 40% of opinion-tampering attacks. Note that the opinion-tampering attack aims to intentionally share fake trust opinions (for example, telling others a node is malicious while it is actually benign, and vice versa) so that the malicious nodes can remain undetected for a longer period of time and the benign nodes are falsely accused of malicious behaviors.
Finally, an attacker can also launch the cunning attack, in which the attack behaviors are conducted in a more intermittent manner. Moreover, the attacker can demonstrate different attack patterns to different nodes. Thus, it is naturally more difficult to identify malicious behaviors as well as the attacker who follows this attack pattern. Viewed from
Figure 11, it is obvious that the F-TRUST approach can still resist the cunning attack and achieve high precision and recall, even when 40% of the nodes are malicious. This is mainly because of the experience module used in the proposed model. On the other hand, the precision and recall values for ART and WV approaches get significantly degraded when the percentage of the attackers who follow the cunning pattern increases.
In the following, we prove the validity of
F-TRUST using the Monte Carlo simulation. According to [
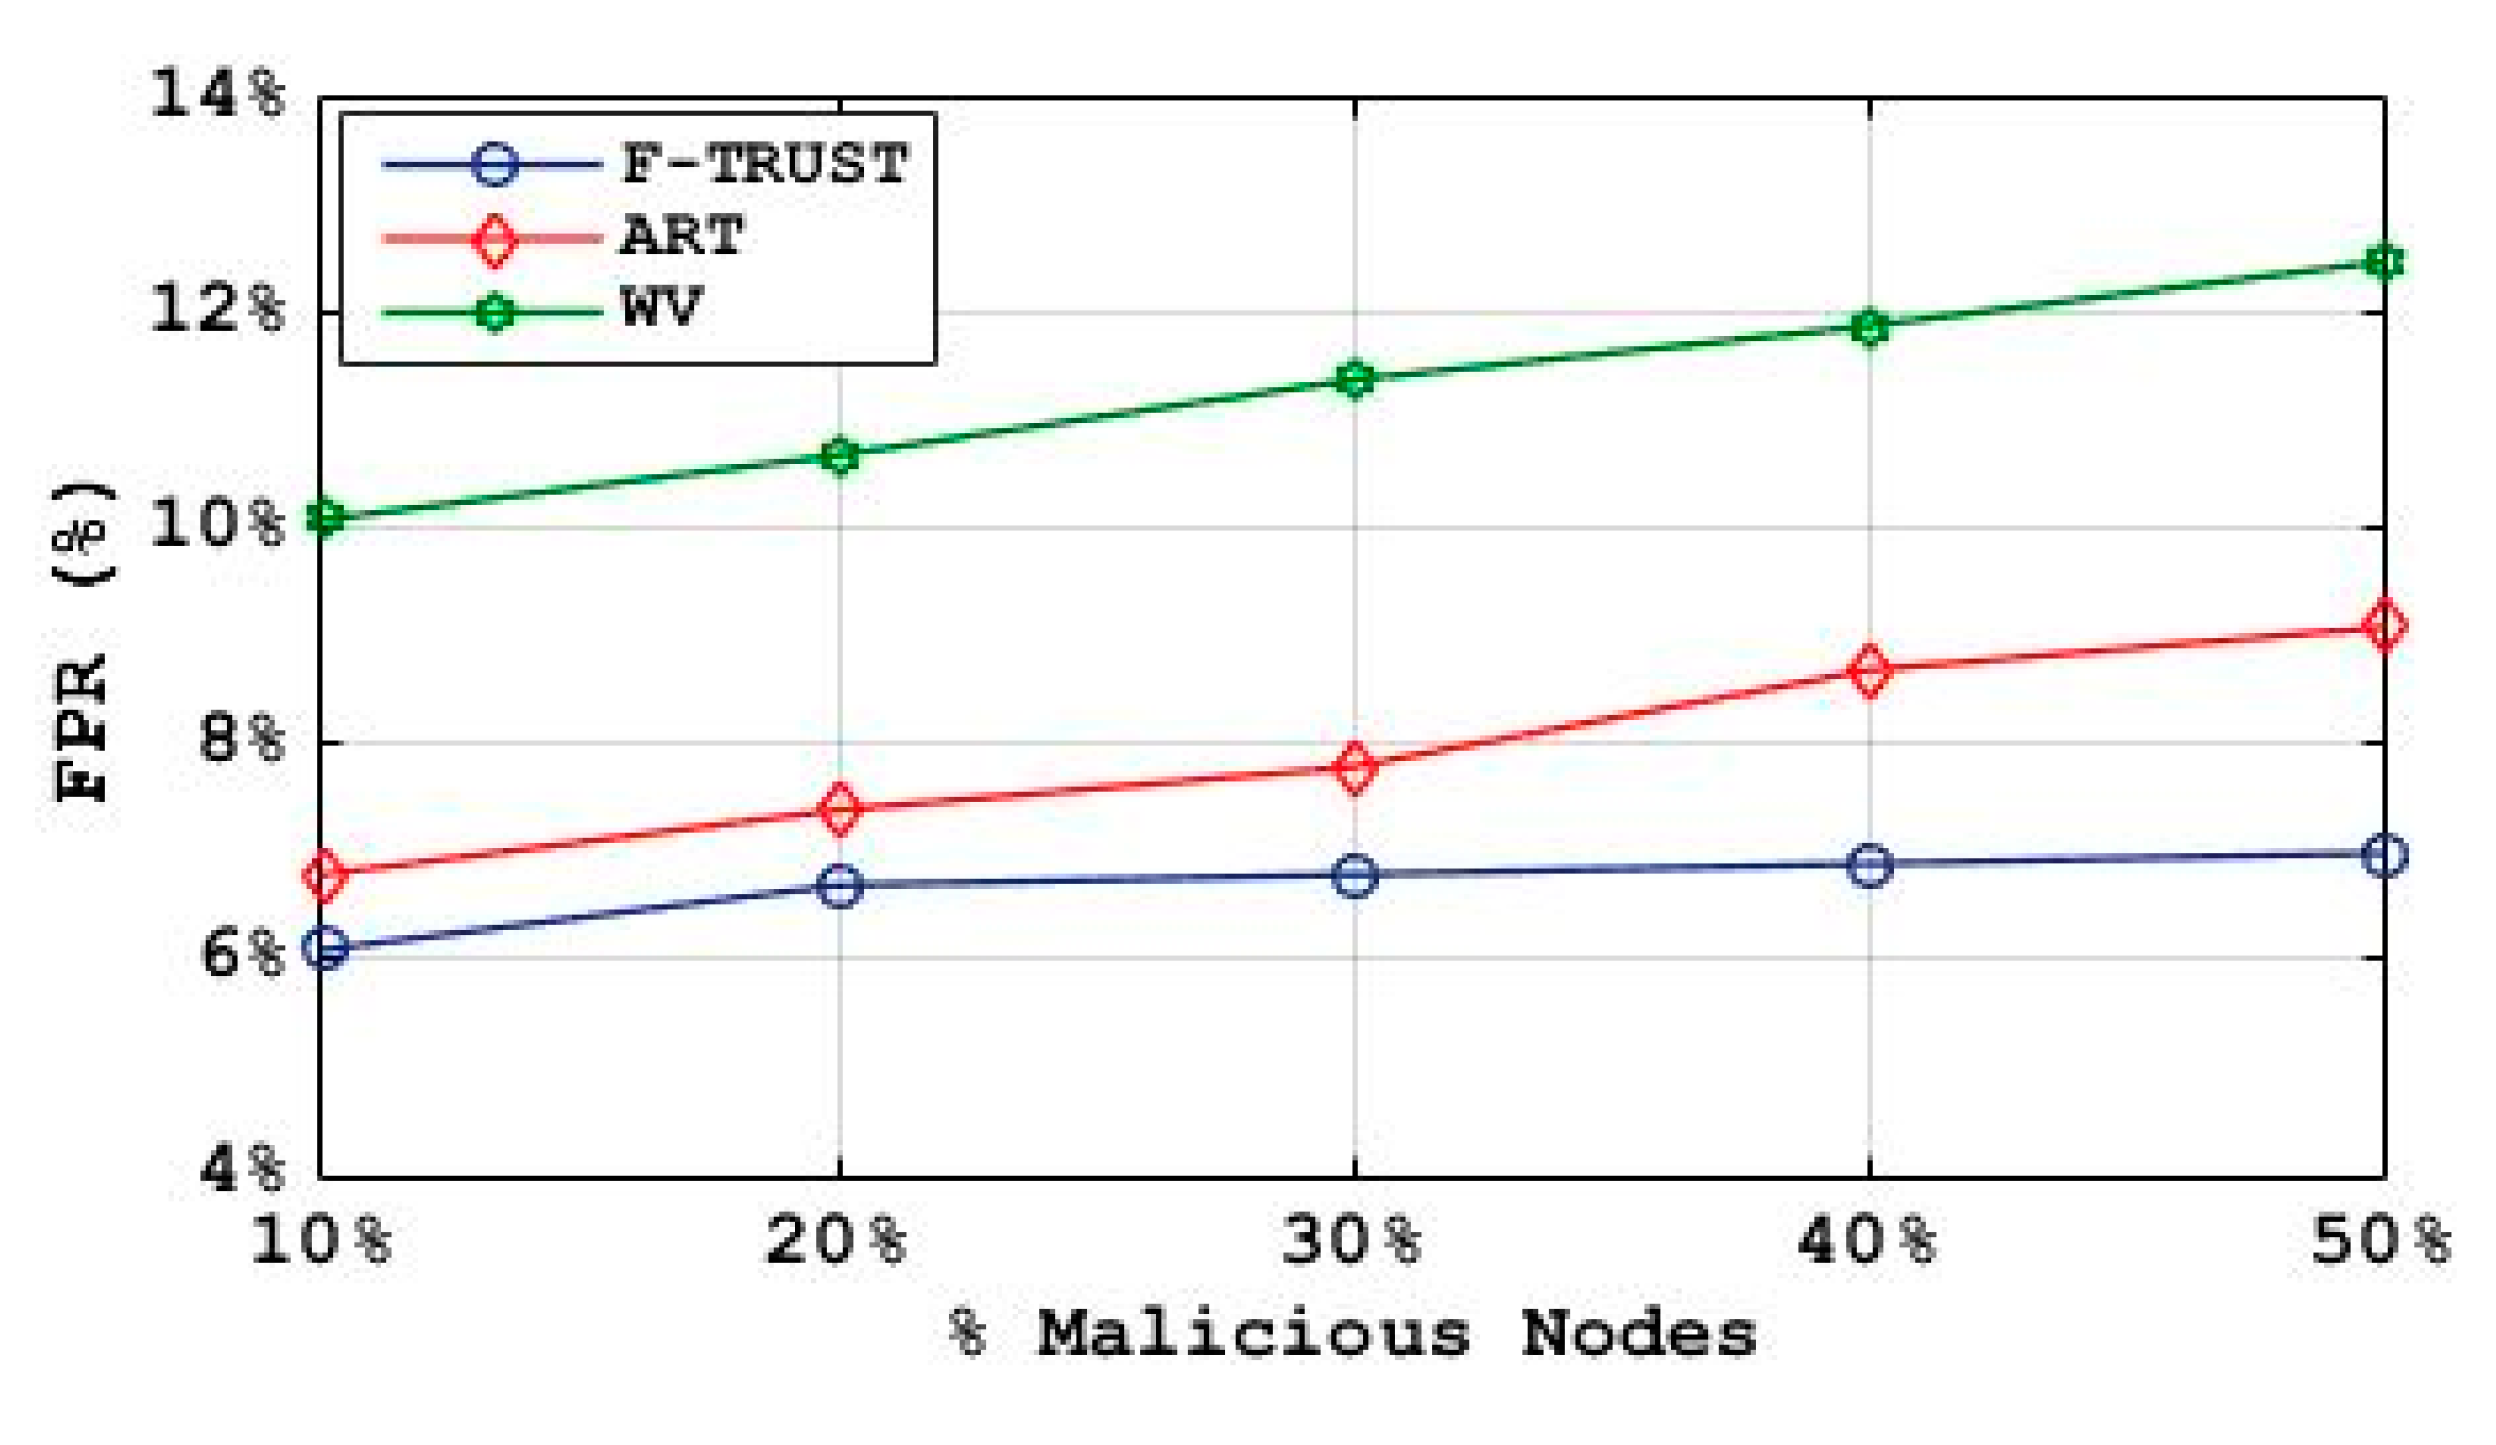
29], the Monte Carlo simulation investigates the validity and reliability of the model. As per Monte Carlo’s rule, the experiment is repeated a very large number of times. In this study, we perform 1000 Monte Carlo simulations for a large-scale network to estimate false-positive rate (FPR). It is measured using Equation (10) as follows:
where
FP is the number of nodes incorrectly found as malicious nodes and
TN is the number of nodes correctly detected as nonmalicious nodes.
According to [
30], FPR denotes the percentage of normal vehicles which are incorrectly regarded as malicious vehicle nodes. The result of the Monte Carlo simulation is presented in
Figure 12. The figure indicates that the false-positive rate would increase as the malicious node increases in the network, but this is not significant for the proposed model. As shown in this figure, the average FPR of the proposed model is about 6.3%, whereas it is 8.1% and 11.2%, respectively, for ART, and WV. The Monte Carlo simulation results also validate
F-TRUST and show better performance than other comparable approaches.
7. Conclusions
In this study, a trust model, namely F-TRUST, is proposed to assess the accuracy and integrity of both event messages and senders of the event messages, by performing fuzzy logic in a VANET. To this end, plausibility, experience, and type of vehicle are used as the main parameters to measure the trust score. In this model, plausibility and experience are based on location verification and the history of past direct communication, respectively. Type of vehicle is also based on the authentication level. The registered vehicles are categorized into low, medium and high levels of authentication. In order to determine the type of vehicle, a query is performed on a cuckoo filter of the relevant edge node. The proposed trust model is analyzed under both LoS and NLoS conditions. In order to detect NLoS status, a classification model based on kNN is also proposed. In the proposed kNN classification algorithm, RSSI, PDR, and the distance between two vehicle nodes are used as the features of samples. The proposed trust model is evaluated on different node density, different velocity and different percentage of malicious nodes. The obtained results show that F-TRUST is highly resilient to different types of malicious attacks. A comparison of the F-TRUST scheme and the WV method shows that F-TRUST has better performance than ART and WV in the case of LoS and NLoS conditions. Additionally, F-TRUST is more precise and accurate than both ART and WV. Finally, we performed numerous Monte Carlo simulations to prove the validity of the proposed model, which demonstrated that it has superior performance than other comparable models. In the future, we plan to develop the proposed trust model in the flying ad hoc network (FANET) using UAVs as edge nodes.
Author Contributions
Methodology, S.A.S., S.G. and M.H.A.; software, S.A.S., S.G. and M.Z.; validation, S.A.S., and S.G.; investigation, S.A.S., S.G, M.H.A.; writing–original draft preparation, S.A.S.; writing–review and editing, S.A.S. and S.G.; supervision, A.H.A., N.K., S.A.I., and A.A; funding acquisition, N.K., S.A.I., and A.A. Resources: S.A.I. All authors have read and agreed to the published version of the manuscript.
Funding
This research is a joint collaboration between Universiti Teknologi Malaysia, Universiti Kebangsaan Malaysia, University of Essex United Kingdom, and Tecnologico de Monterrey, Monterrey, Mexico. Since UTM is the research principal, this publication is fully-supported by Universiti Teknologi Malaysia under the UTM Fundamental Research Grant (UTMFR) with vote no Q.K130000.2556.21H12.
Conflicts of Interest
The authors declare no conflict of interest.
References
- Meireles, R.; Boban, M.; Steenkiste, P.; Tonguz, O.; Barros, J. Experimental study on the impact of vehicular obstructions in VANETs. In Proceedings of the 2010 IEEE Vehicular Networking Conference (VNC 2010), Jersey City, NJ, USA, 13–15 December 2010; pp. 338–345. [Google Scholar]
- Luo, J.; Liu, X.; Fan, M. A trust model based on fuzzy recommendation for mobile ad-hoc networks. Comput. Netw. 2009, 53, 2396–2407. [Google Scholar] [CrossRef]
- Mármol, F.G.; Pérez, G.M. TRIP, a trust and reputation infrastructure-based proposal for vehicular ad hoc networks. J. Netw. Comput. Appl. 2012, 35, 934–941. [Google Scholar] [CrossRef]
- Shaikh, R.A.; Alzahrani, A.S. Intrusion-aware trust model for vehicular ad hoc networks. Secur. Commun. Netw. 2014, 7, 1652–1669. [Google Scholar] [CrossRef]
- Liu, Z.; Ma, J.; Jiang, Z.; Zhu, H.; Miao, Y. LSOT: A lightweight self-organized trust model in VANETs. Mob. Inf. Syst. 2016, 2016, 1–15. [Google Scholar] [CrossRef] [Green Version]
- Hu, H.; Lu, R.; Zhang, Z.; Shao, J. REPLACE: A reliable trust-based platoon service recommendation scheme in VANET. IEEE Trans. Veh. Technol. 2016, 66, 1786–1797. [Google Scholar] [CrossRef]
- Li, W.; Song, H. ART: An attack-resistant trust management scheme for securing vehicular ad hoc networks. IEEE Trans. Intell. Transp. Syst. 2015, 17, 960–969. [Google Scholar] [CrossRef]
- Yao, X.; Zhang, X.; Ning, H.; Li, P. Using trust model to ensure reliable data acquisition in VANETs. Ad Hoc Netw. 2017, 55, 107–118. [Google Scholar] [CrossRef]
- Kerrache, C.A.; Lagraa, N.; Calafate, C.T.; Lakas, A. TFDD: A trust-based framework for reliable data delivery and DoS defense in VANETs. Veh. Commun. 2017, 9, 254–267. [Google Scholar] [CrossRef] [Green Version]
- Boeira, F.; Asplund, M.; Barcellos, M.P. Vouch: A secure proof-of-location scheme for vanets. In Proceedings of the 21st ACM International Conference on Modeling, Analysis and Simulation of Wireless and Mobile Systems (MSWIM’18), Montreal, QC, Canada, 28 October 2018; pp. 241–248. [Google Scholar]
- Xie, L.; Ding, Y.; Yang, H.; Wang, X. Blockchain-Based Secure and Trustworthy Internet of Things in SDN-Enabled 5G-VANETs. IEEE Access 2019, 7, 56656–56666. [Google Scholar] [CrossRef]
- Bißmeyer, N.; Njeukam, J.; Petit, J.; Bayarou, K.M. Central misbehavior evaluation for vanets based on mobility data plausibility. In Proceedings of the Ninth ACM International Workshop on Vehicular Inter-Networking, Systems, and Applications (VANET’12), Low Wood Bay Lake District, UK, 25 June 2012; pp. 73–82. [Google Scholar]
- Engoulou, R.G.; Bellaïche, M.; Pierre, S.; Quintero, A. VANET security surveys. Comput. Commun. 2014, 44, 1–13. [Google Scholar] [CrossRef]
- Minhas, U.F.; Zhang, J.; Tran, T.; Cohen, R. A multifaceted approach to modeling agent trust for effective communication in the application of mobile ad hoc vehicular networks. IEEE Trans. Syst. Man Cybern. Part C (Appl. Rev.) 2011, 41, 407–420. [Google Scholar] [CrossRef]
- Soleymani, S.A.; Abdullah, A.H.; Hassan, W.H.; Anisi, M.H.; Goudarzi, S.; Baee, M.A.R.; Mandala, S. Trust management in vehicular ad hoc network: A systematic review. EURASIP J. Wirel. Commun. Netw. 2015, 2015, 146. [Google Scholar] [CrossRef] [Green Version]
- Goudarzi, S.; Abdullah, A.H.; Mandala, S.; Soleymani, S.A.; Baee, M.A.R.; Anisi, M.H.; Aliyu, M.S. A systematic review of security in vehicular Ad Hoc network. In Proceedings of the 2nd International Symposium on Wireless Sensor & Cellular Networks (WSCN 2013), Jeddah, Saudi Arabia, 13–16 December 2013; pp. 1–10. [Google Scholar]
- Soleymani, S.A.; Abdullah, A.H.; Zareei, M.; Anisi, M.H.; Vargas-Rosales, C.; Khan, M.K.; Goudarzi, S. A secure trust model based on fuzzy logic in vehicular ad hoc networks with fog computing. IEEE Access 2017, 5, 15619–15629. [Google Scholar] [CrossRef]
- Singh, A.; Garg, S.; Kaur, R.; Batra, S.; Kumar, N.; Zomaya, A.Y. Probabilistic data structures for big data analytics: A comprehensive review. Knowl. Based Syst. 2020, 188, 104987. [Google Scholar] [CrossRef]
- Bender, M.A.; Farach-Colton, M.; Johnson, R.; Kraner, R.; Kuszmaul, B.C.; Medjedovic, D.; Montes, P.; Shetty, P.; Spillane, R.P.; Zadok, E. Don’t Thrash: How to Cache Your Hash on Flash. PVLDB 2012, 5, 1627–1637. [Google Scholar] [CrossRef]
- Fan, B.; Andersen, D.G.; Kaminsky, M.; Mitzenmacher, M.D. Cuckoo filter: Practically better than bloom. In Proceedings of the 10th ACM International on Conference on Emerging Networking Experiments and Technologies (CoNEXT’14), Sydney, Australia, 2–5 December 2014; pp. 75–88. [Google Scholar]
- Dhurandher, S.K.; Obaidat, M.S.; Jaiswal, A.; Tiwari, A.; Tyagi, A. Vehicular security through reputation and plausibility checks. IEEE Syst. J. 2013, 8, 384–394. [Google Scholar] [CrossRef]
- Shah, S.; Shah, B.; Amin, A.; Al-Obeidat, F.; Chow, F.; Moreira, F.J.L.; Anwar, S. Compromised user credentials detection in a digital enterprise using behavioral analytics. Future Gener. Comput. Syst. 2019, 93, 407–417. [Google Scholar] [CrossRef]
- Davis, J.; Goadrich, M. The relationship between Precision-Recall and ROC curves. In Proceedings of the 23rd International Conference on Machine Learning, Pittsburgh, PA, USA, 25–29 June 2006; pp. 233–240. [Google Scholar]
- García Villalba, L.J.; Sandoval Orozco, A.L.; Trivino Cabrera, A.; Barenco Abbas, C.J. Routing protocols in wireless sensor networks. Sensors 2009, 9, 8399–8421. [Google Scholar] [CrossRef] [Green Version]
- Raya, M.; Papadimitratos, P.; Gligor, V.D.; Hubaux, J.P. On data-centric trust establishment in ephemeral ad hoc networks. In Proceedings of the IEEE INFOCOM 2008-The 27th Conference on Computer Communications, Phoenix, AZ, USA, 13–18 April 2008; pp. 1238–1246. [Google Scholar]
- Chen, R.; Bao, F.; Chang, M.; Cho, J.H. Dynamic trust management for delay tolerant networks and its application to secure routing. IEEE Trans. Parallel Distrib. Syst. 2013, 25, 1200–1210. [Google Scholar] [CrossRef]
- Ahmed, S.; Al-Rubeaai, S.; Tepe, K. Novel trust framework for vehicular networks. IEEE Trans. Veh. Technol. 2017, 66, 9498–9511. [Google Scholar] [CrossRef]
- Kumar, N.; Yashwant, S. Routing protocols in wireless sensor networks. In Handbook of Research on Advanced Wireless Sensor Network Applications, Protocols, and Architectures; IGI Global: Hershey, PA, USA, 2017; pp. 86–128. [Google Scholar]
- Goudarzi, S.; Anisi, M.H.; Abdullah, A.H.; Lloret, J.; Soleymani, S.A.; Hassan, W.H. A hybrid intelligent model for network selection in the industrial Internet of Things. Appl. Soft Comput. 2019, 74, 529–546. [Google Scholar] [CrossRef] [Green Version]
- Xiao, B.; Yu, B.; Gao, C. Detection and localization of sybil nodes in VANETs. In Proceedings of the workshop on Dependability Issues in Wireless ad hoc Networks and Sensor Networks, Los Angeles, CA, USA, 26 September 2006; pp. 1–8. [Google Scholar]
Figure 1.
The modular framework of F-TRUST.
Figure 1.
The modular framework of F-TRUST.
Figure 2.
System architecture.
Figure 2.
System architecture.
Figure 3.
Trust level’s membership function.
Figure 3.
Trust level’s membership function.
Figure 4.
Accuracy of kNN classification on the dataset with different k.
Figure 4.
Accuracy of kNN classification on the dataset with different k.
Figure 5.
Impact of density, velocity and different percentage of malicious nodes participating in the network on precision under LoS (Left) and NLoS (Right). (a) under different density, (b) under different velocity, and (c) under different percentage of malicious nodes.
Figure 5.
Impact of density, velocity and different percentage of malicious nodes participating in the network on precision under LoS (Left) and NLoS (Right). (a) under different density, (b) under different velocity, and (c) under different percentage of malicious nodes.
Figure 6.
Impact of density, velocity and different percentage of malicious nodes participating in the network on recall under LoS (Left) and NLoS (Right). (a) under different density, (b) under different velocity, and (c) under different percentage of malicious nodes.
Figure 6.
Impact of density, velocity and different percentage of malicious nodes participating in the network on recall under LoS (Left) and NLoS (Right). (a) under different density, (b) under different velocity, and (c) under different percentage of malicious nodes.
Figure 7.
Overall accuracy of F-TRUST against ART and WV under LoS and NLoS.
Figure 7.
Overall accuracy of F-TRUST against ART and WV under LoS and NLoS.
Figure 8.
Communication overhead of F-TRUST compared with ART and WV under LoS and NLoS (a) under different density, (b) under different velocity, and (c) under different percentage of malicious nodes.
Figure 8.
Communication overhead of F-TRUST compared with ART and WV under LoS and NLoS (a) under different density, (b) under different velocity, and (c) under different percentage of malicious nodes.
Figure 9.
The precision and recall of F-TRUST compared with ART and WV under a simple attack.
Figure 9.
The precision and recall of F-TRUST compared with ART and WV under a simple attack.
Figure 10.
The precision and recall of F-TRUST compared with ART and WV under opinion tampering attack
Figure 10.
The precision and recall of F-TRUST compared with ART and WV under opinion tampering attack
Figure 11.
The precision and recall of F-TRUST compared with WV under cunning attack.
Figure 11.
The precision and recall of F-TRUST compared with WV under cunning attack.
Figure 12.
False-positive rate of F-TRUST vs ART and WV under different percentage of malicious node.
Figure 12.
False-positive rate of F-TRUST vs ART and WV under different percentage of malicious node.
Table 1.
Training samples for line-of-sight (LoS) label.
Table 1.
Training samples for line-of-sight (LoS) label.
| RSSI (dB) | PDR (%) | Dist (m) |
|---|
| | |
| | |
| | |
| | |
| | |
Table 2.
Training samples for LoS blocked by a movable obstacle (non-line-of-sight (NLoS) label).
Table 2.
Training samples for LoS blocked by a movable obstacle (non-line-of-sight (NLoS) label).
| RSSI (dB) | PDR (%) | Dist (m) |
|---|
| | |
| | |
| | |
| | |
| | |
Table 3.
Training samples for LoS blocked by an immovable obstacle (NLoS label).
Table 3.
Training samples for LoS blocked by an immovable obstacle (NLoS label).
| RSSI (dB) | PDR (%) | Dist (m) |
|---|
| | |
| | |
| | |
| | |
| | |
© 2020 by the authors. Licensee MDPI, Basel, Switzerland. This article is an open access article distributed under the terms and conditions of the Creative Commons Attribution (CC BY) license (http://creativecommons.org/licenses/by/4.0/).


