Estimation of Natural Radionuclides’ Concentration of the Plutonic Rocks in the Sakarya Zone, Turkey Using Multivariate Statistical Methods

 ,
,  , ,
, ,
Abstract
:1. Introduction
2. Materials and Methods
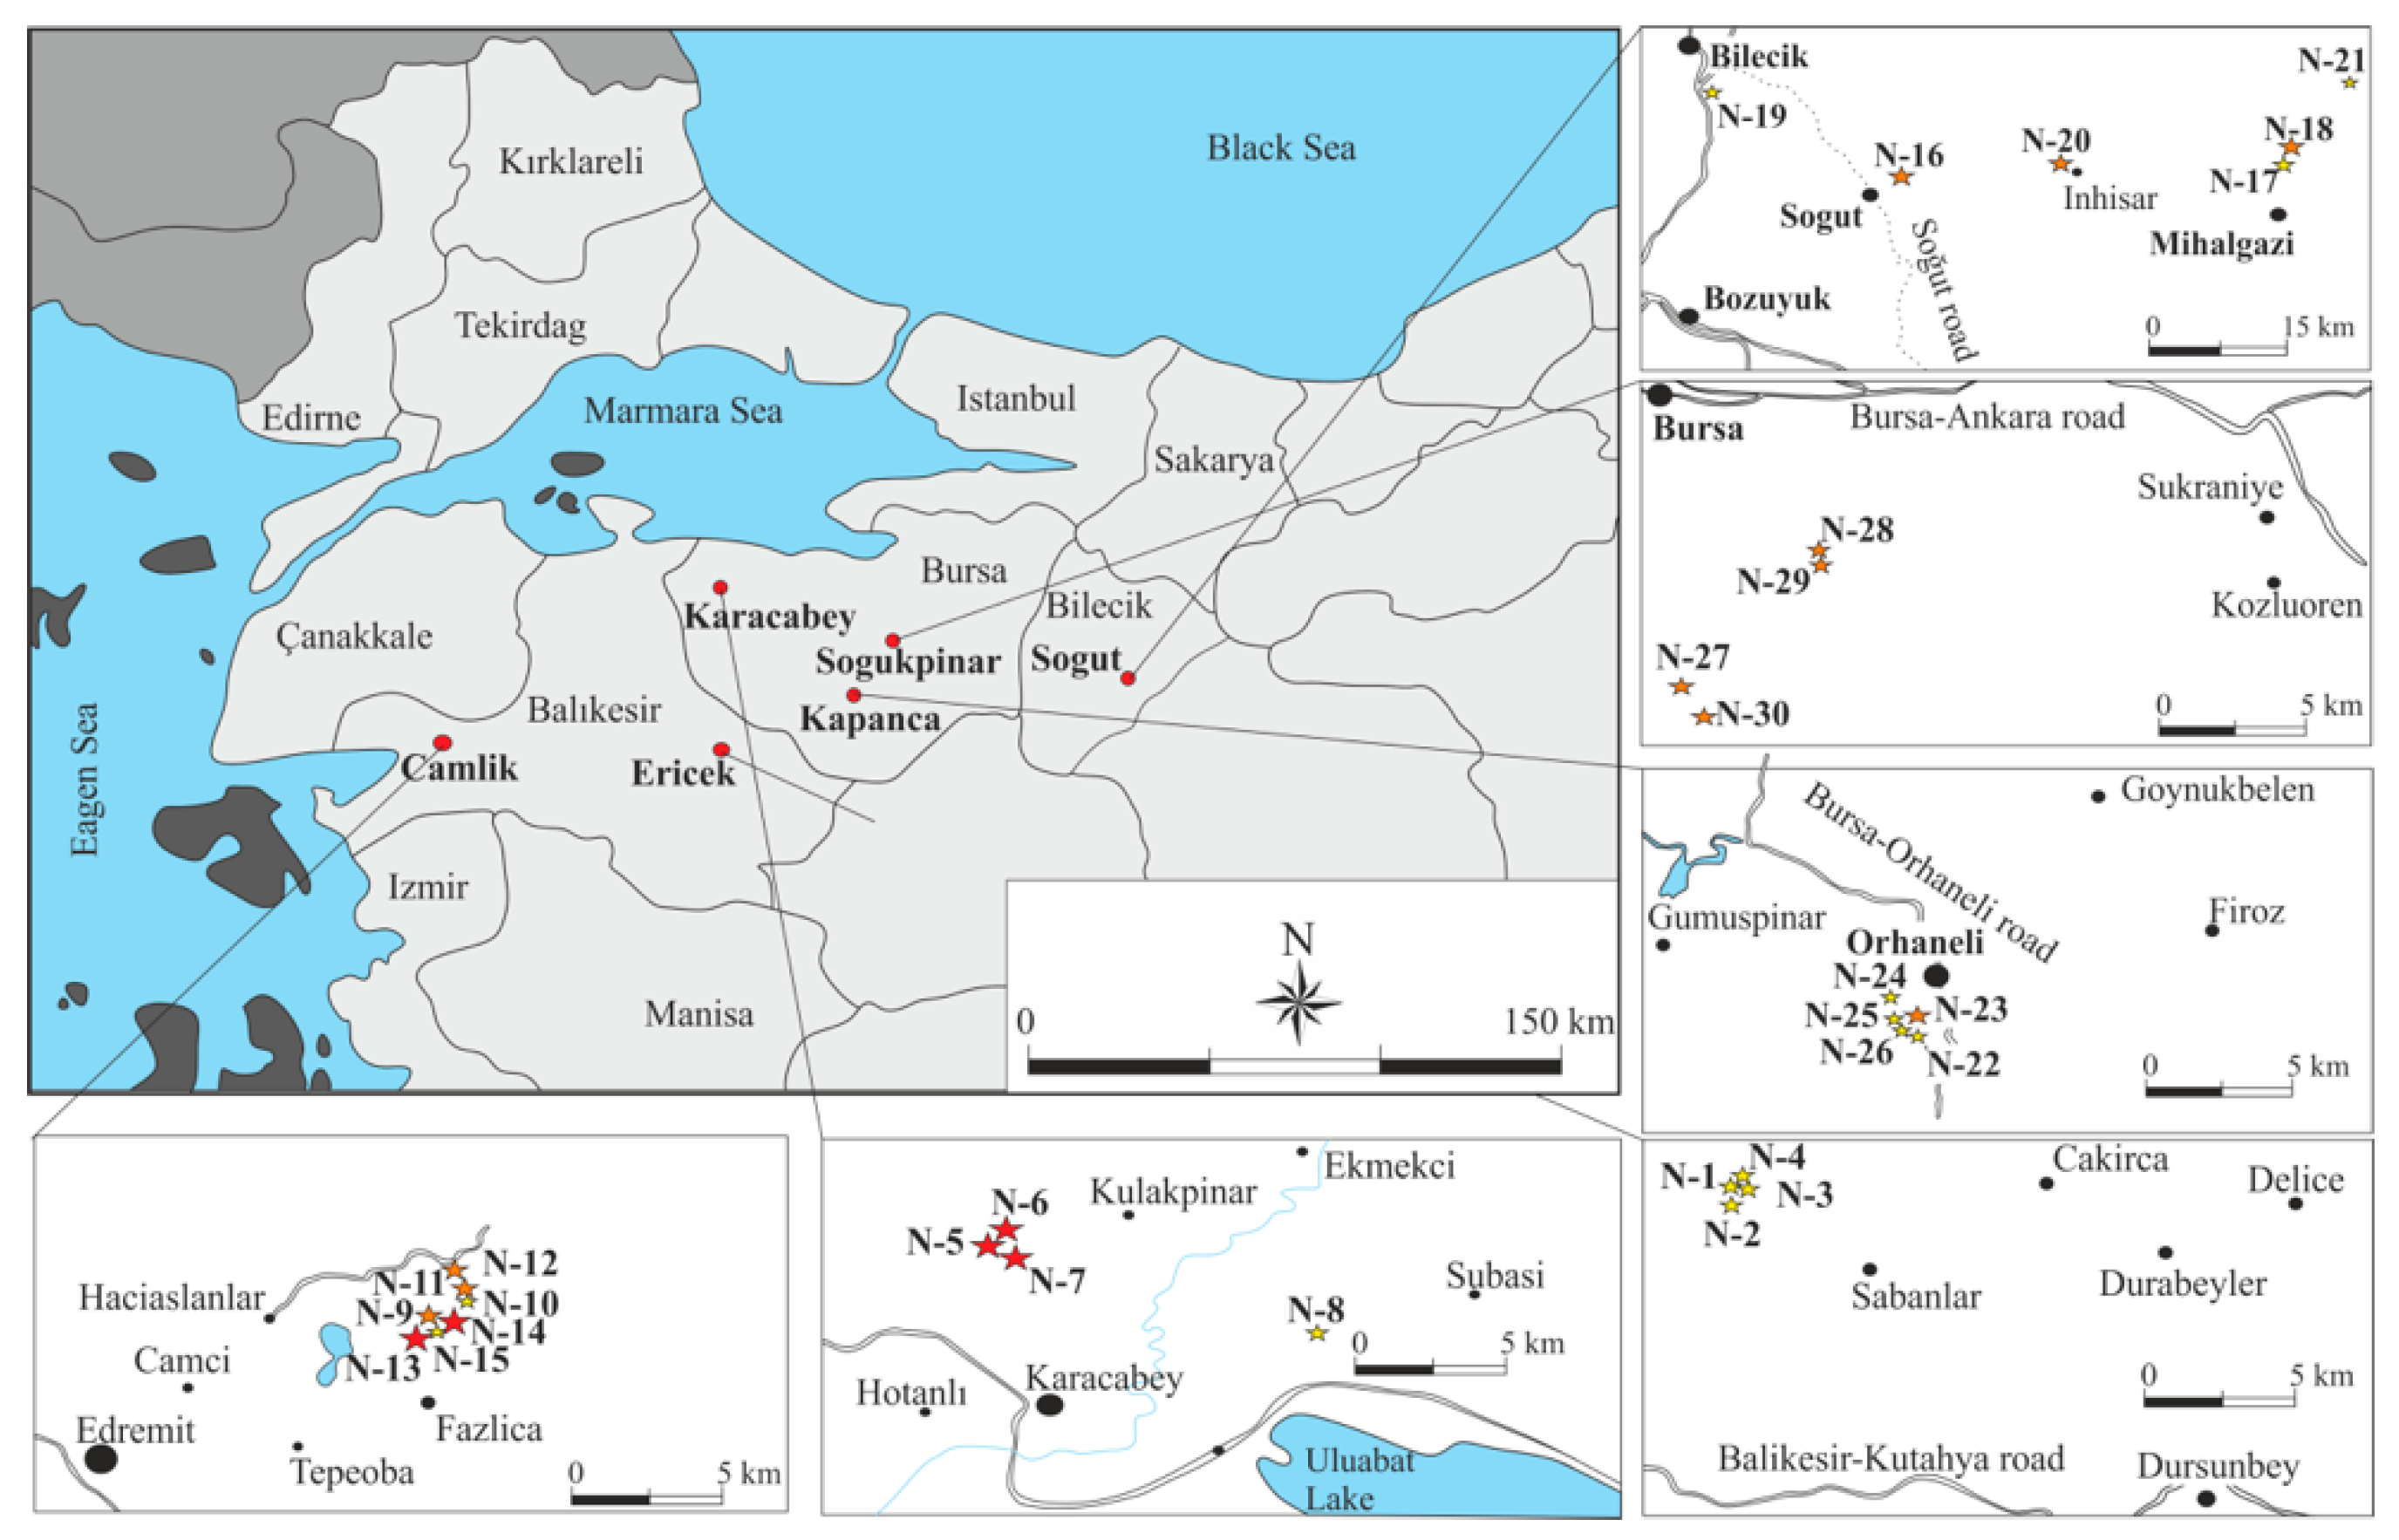
2.1. Description of the Study Area
2.2. Sampling and Preparation
2.3. Radioactivity Measurements Using High-Purity Germanium (HPGe) Detector and Dose Calculations
2.4. Radiation Hazards Parameters
2.5. Statistical Analysis
2.6. Comparison with Other Countries
3. Findings
3.1. Activity Concentration and Radiological Characterization
3.2. Multivariate Statistical Analysis and Data Mining
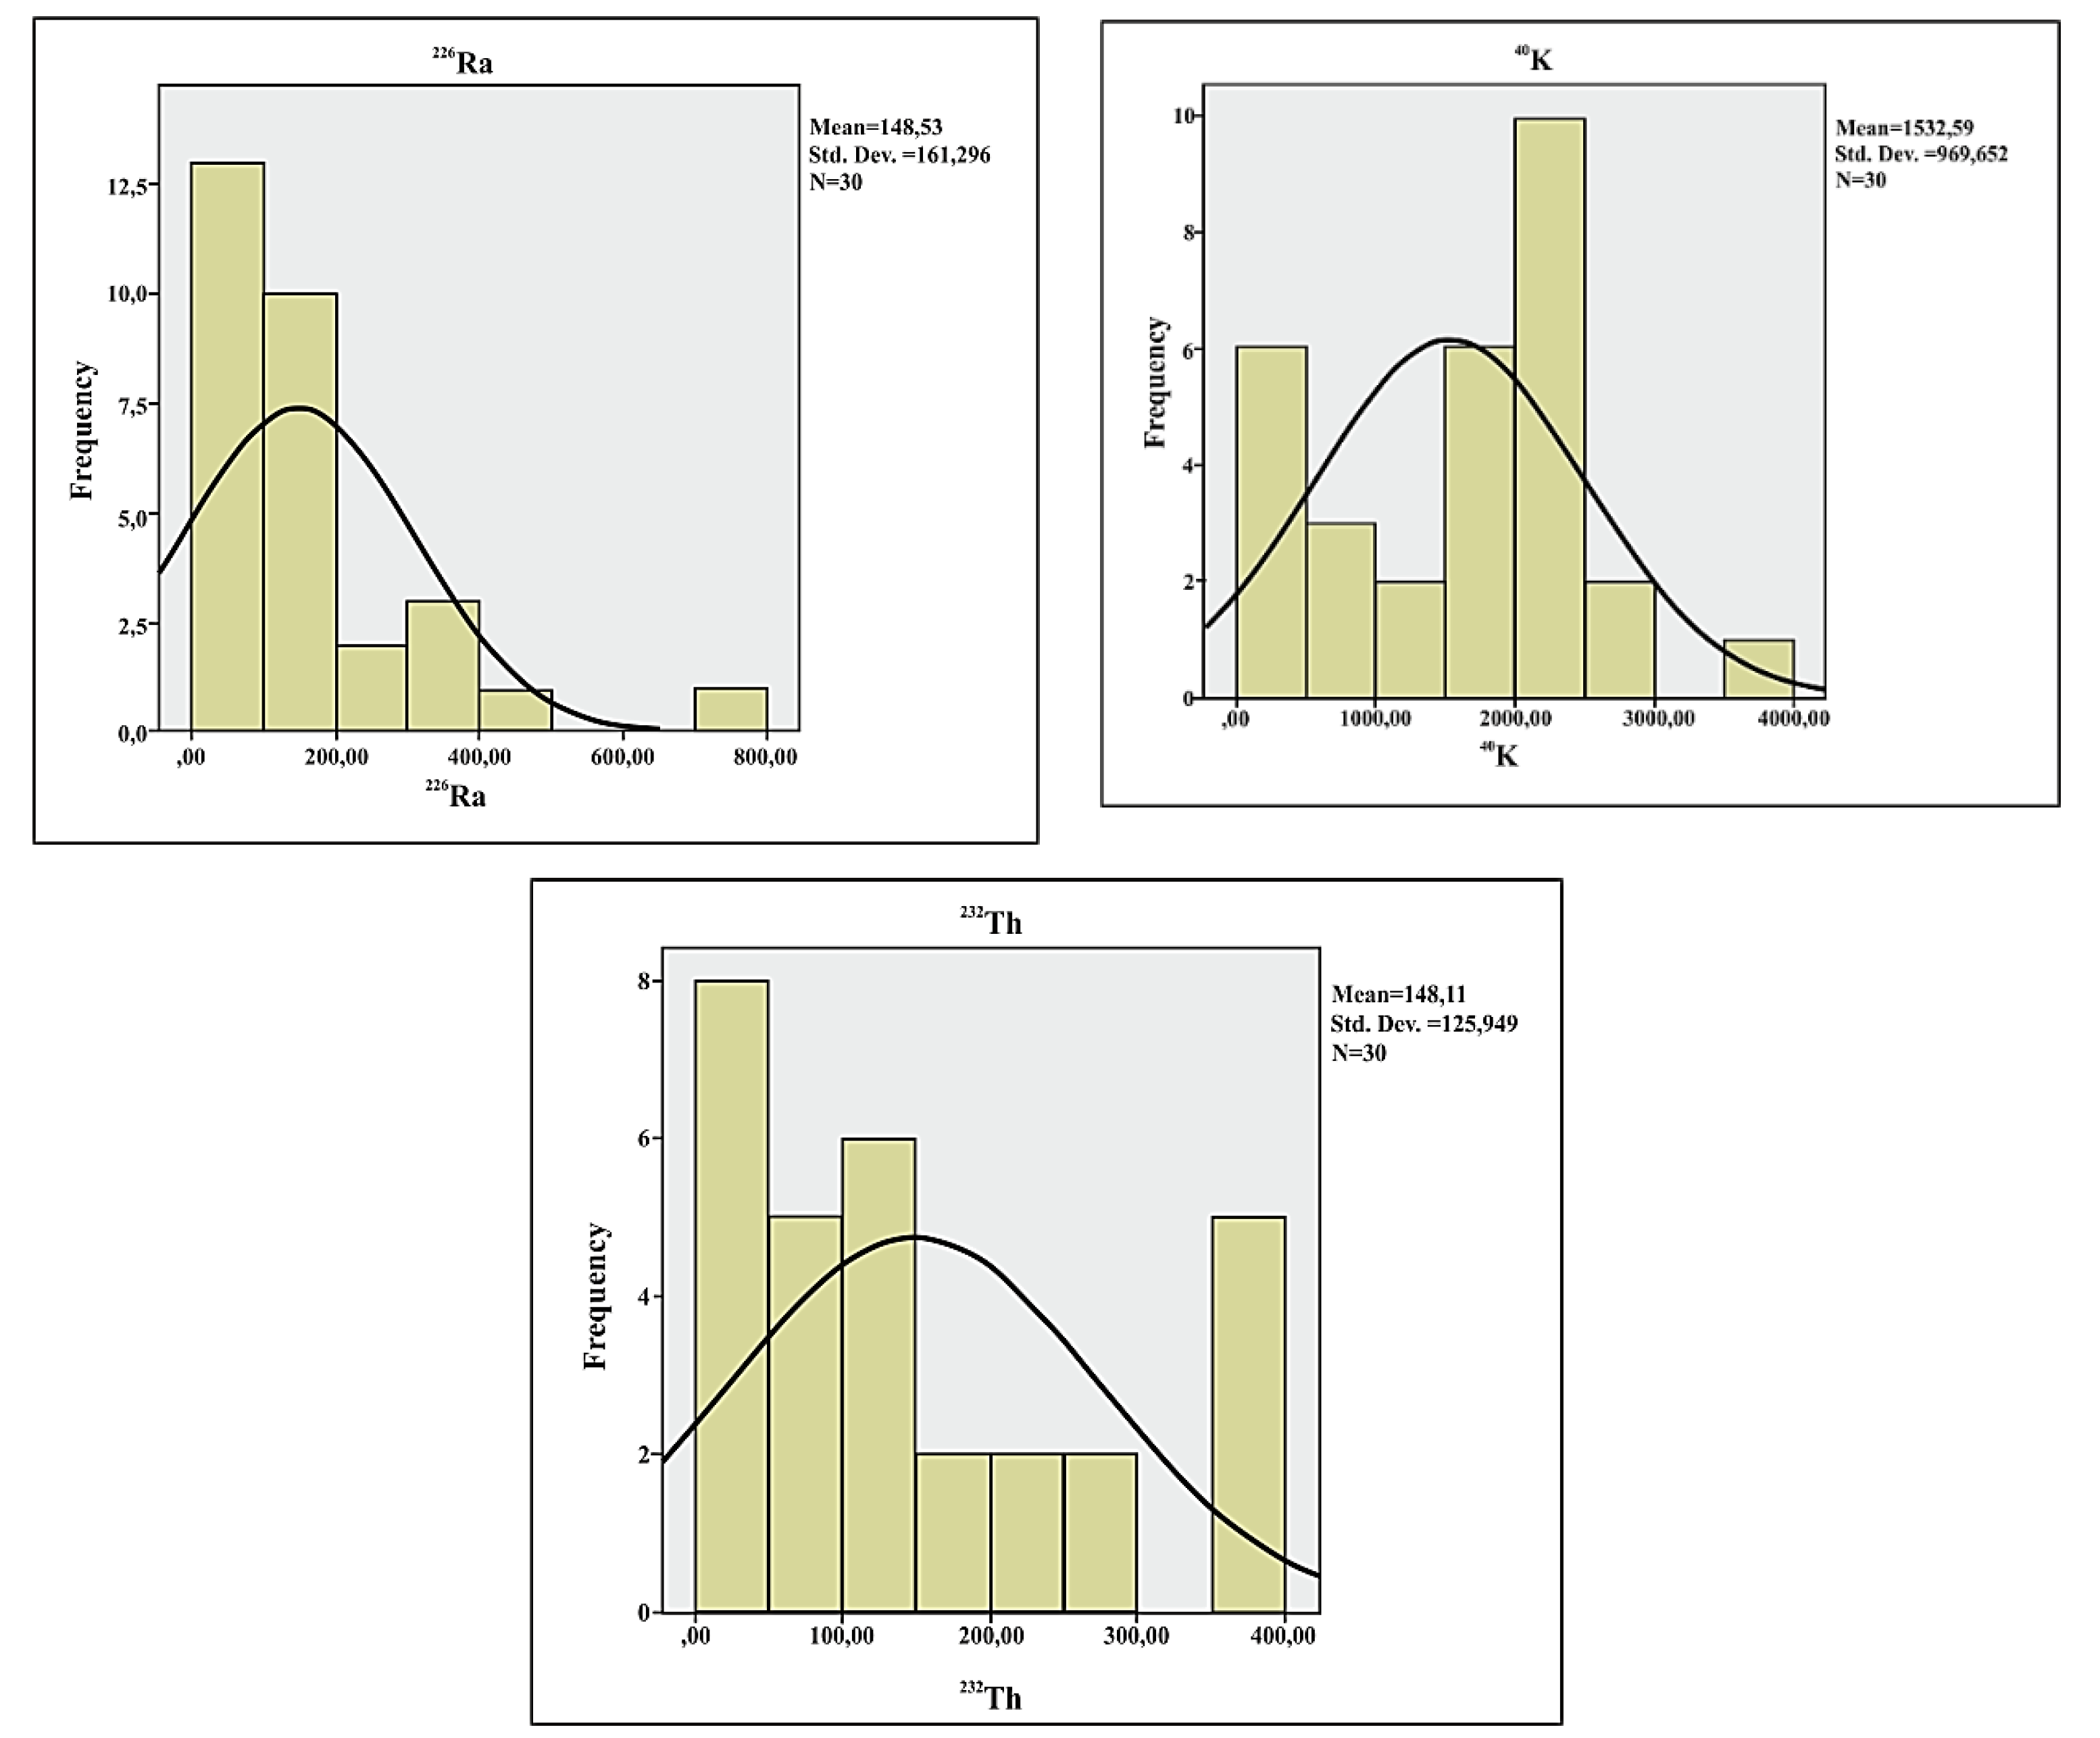
3.2.1. Descriptive Statistics
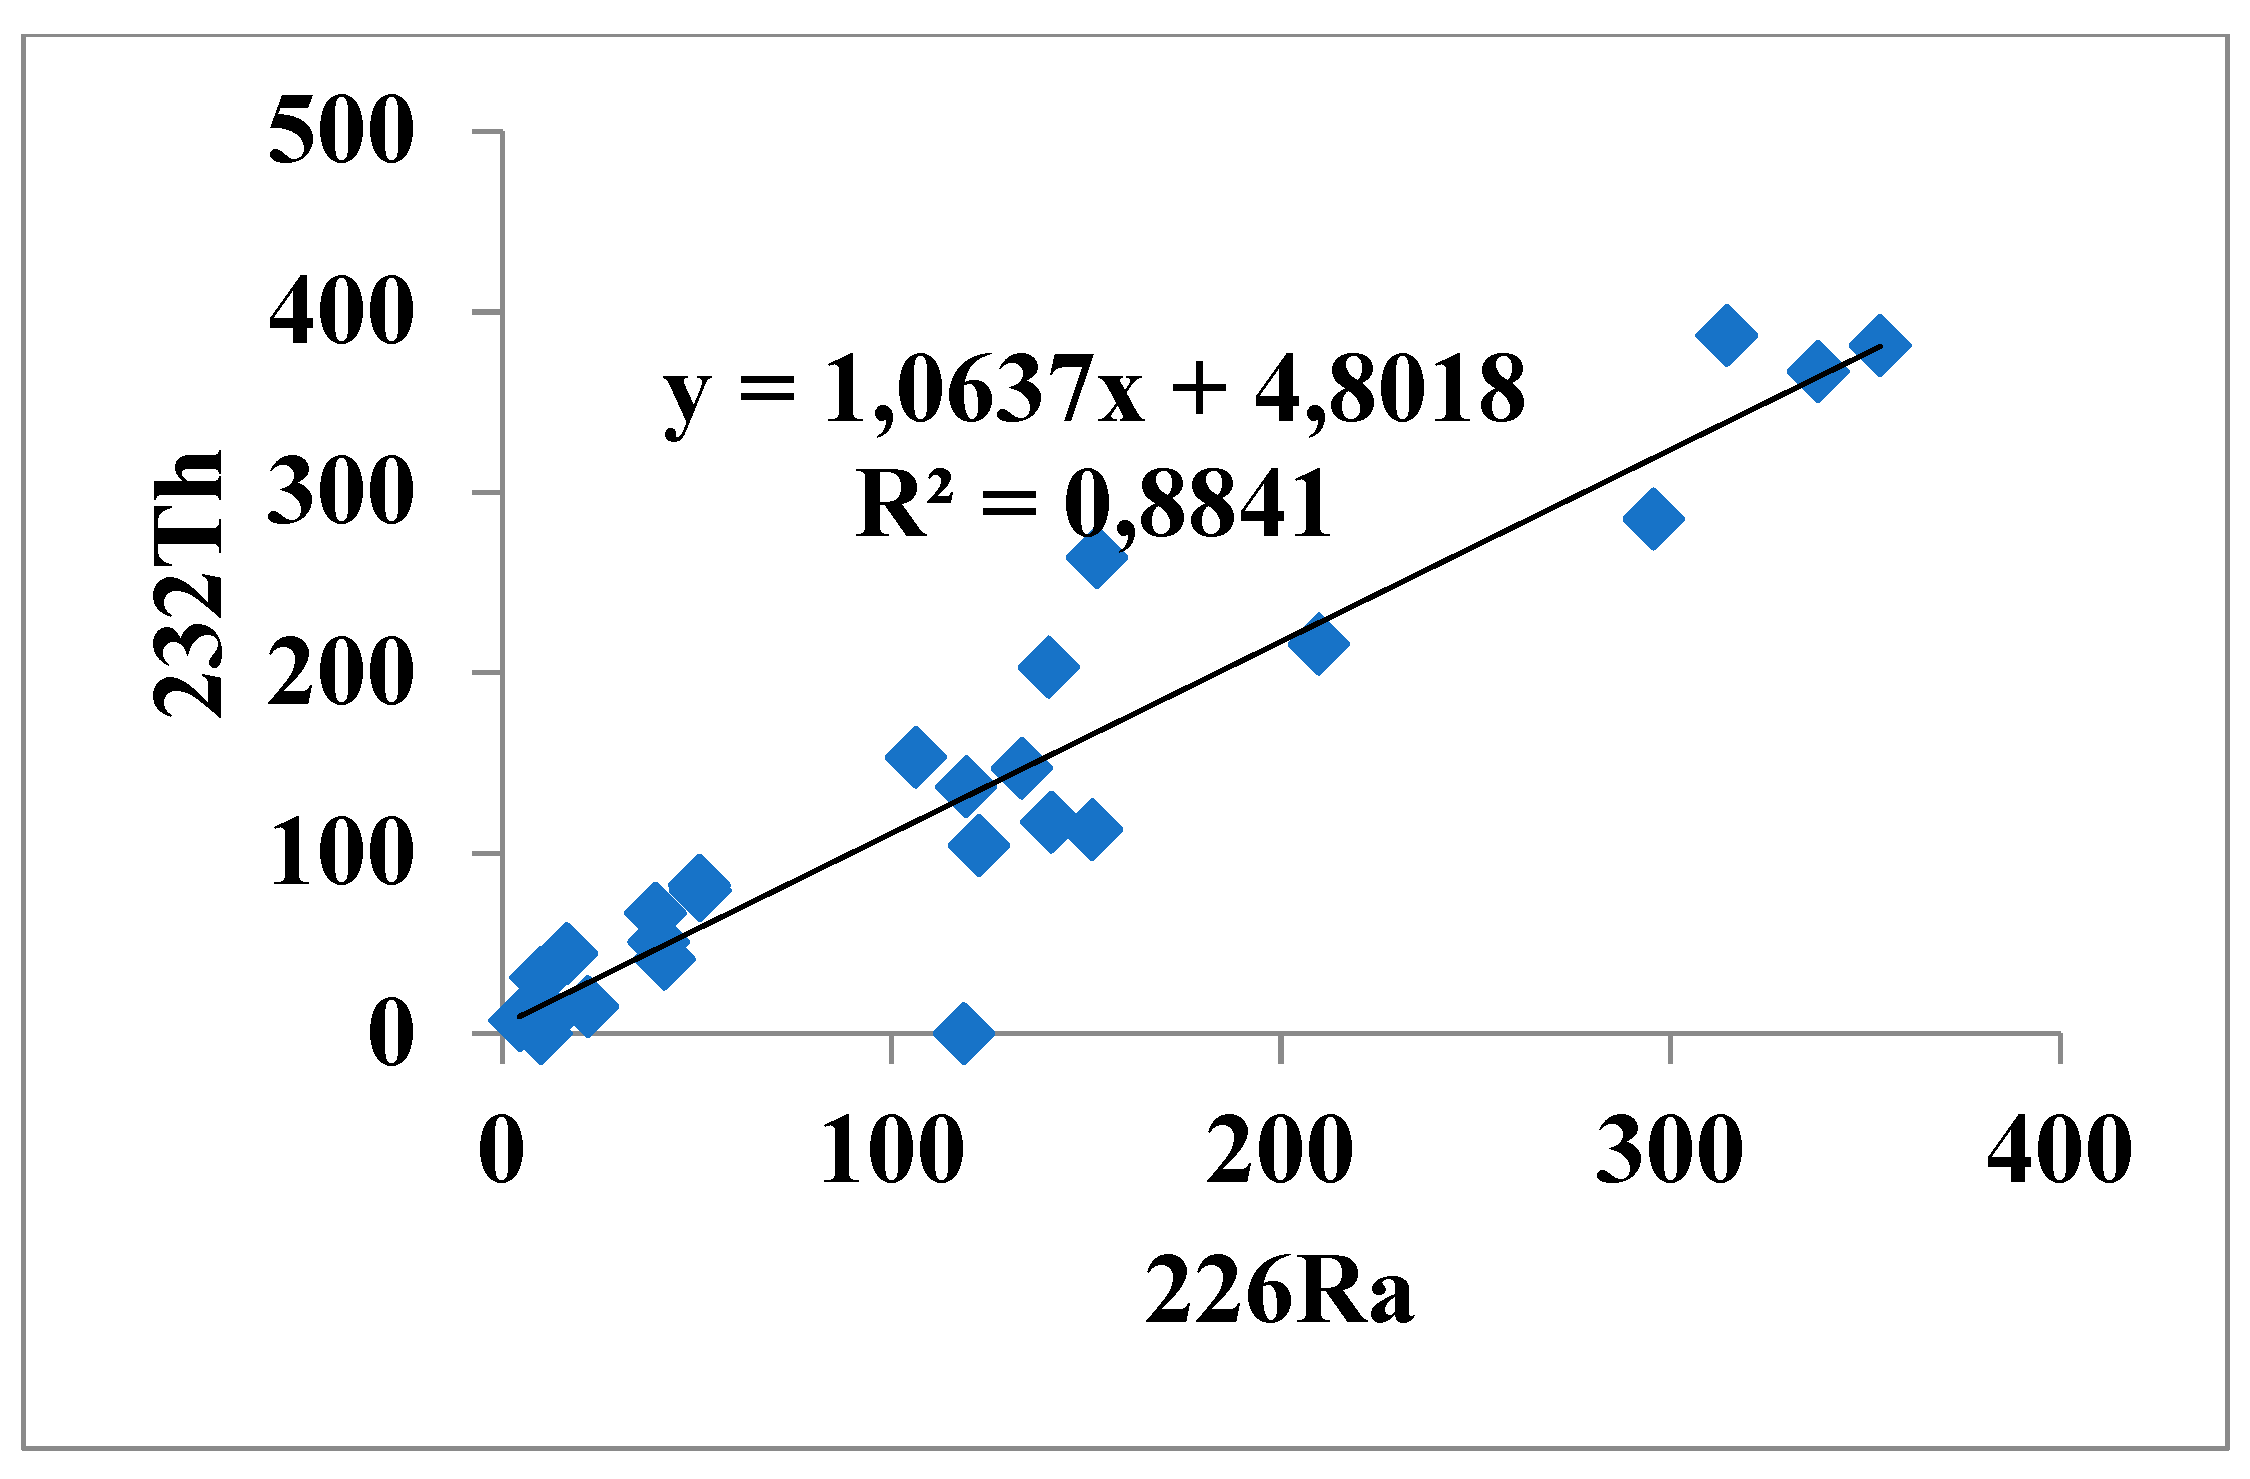
3.2.2. Correlation Analysis
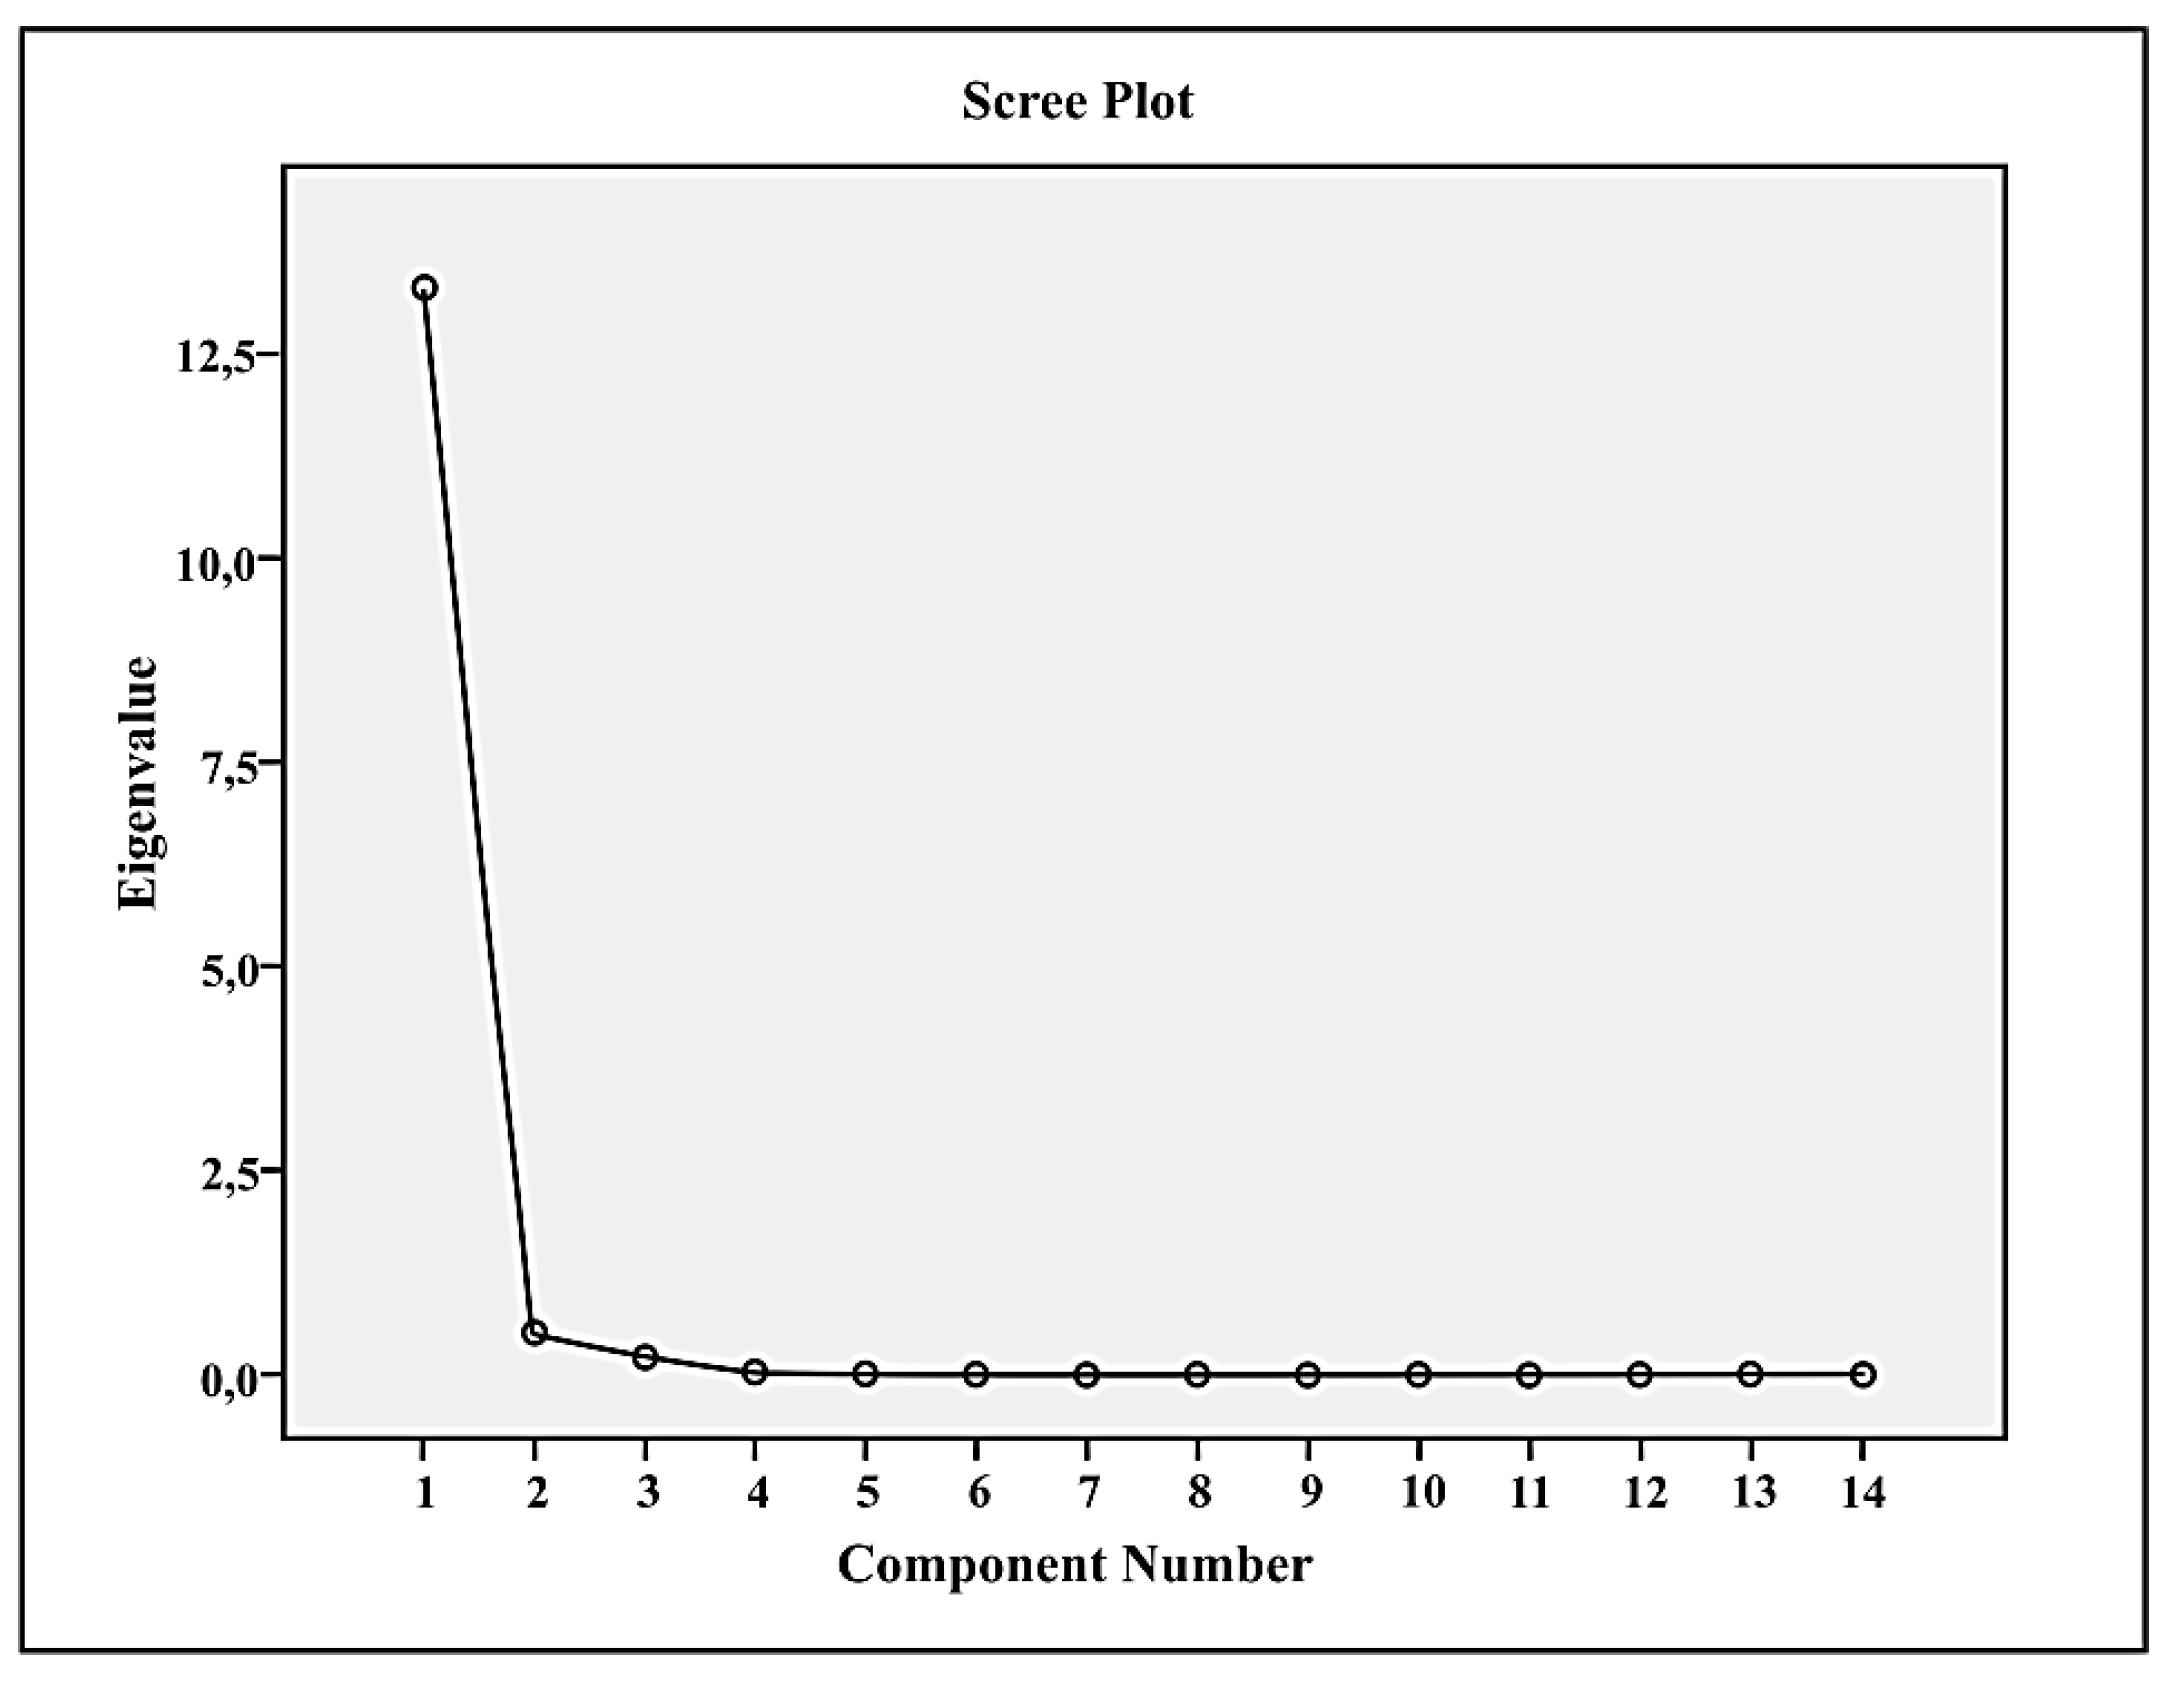
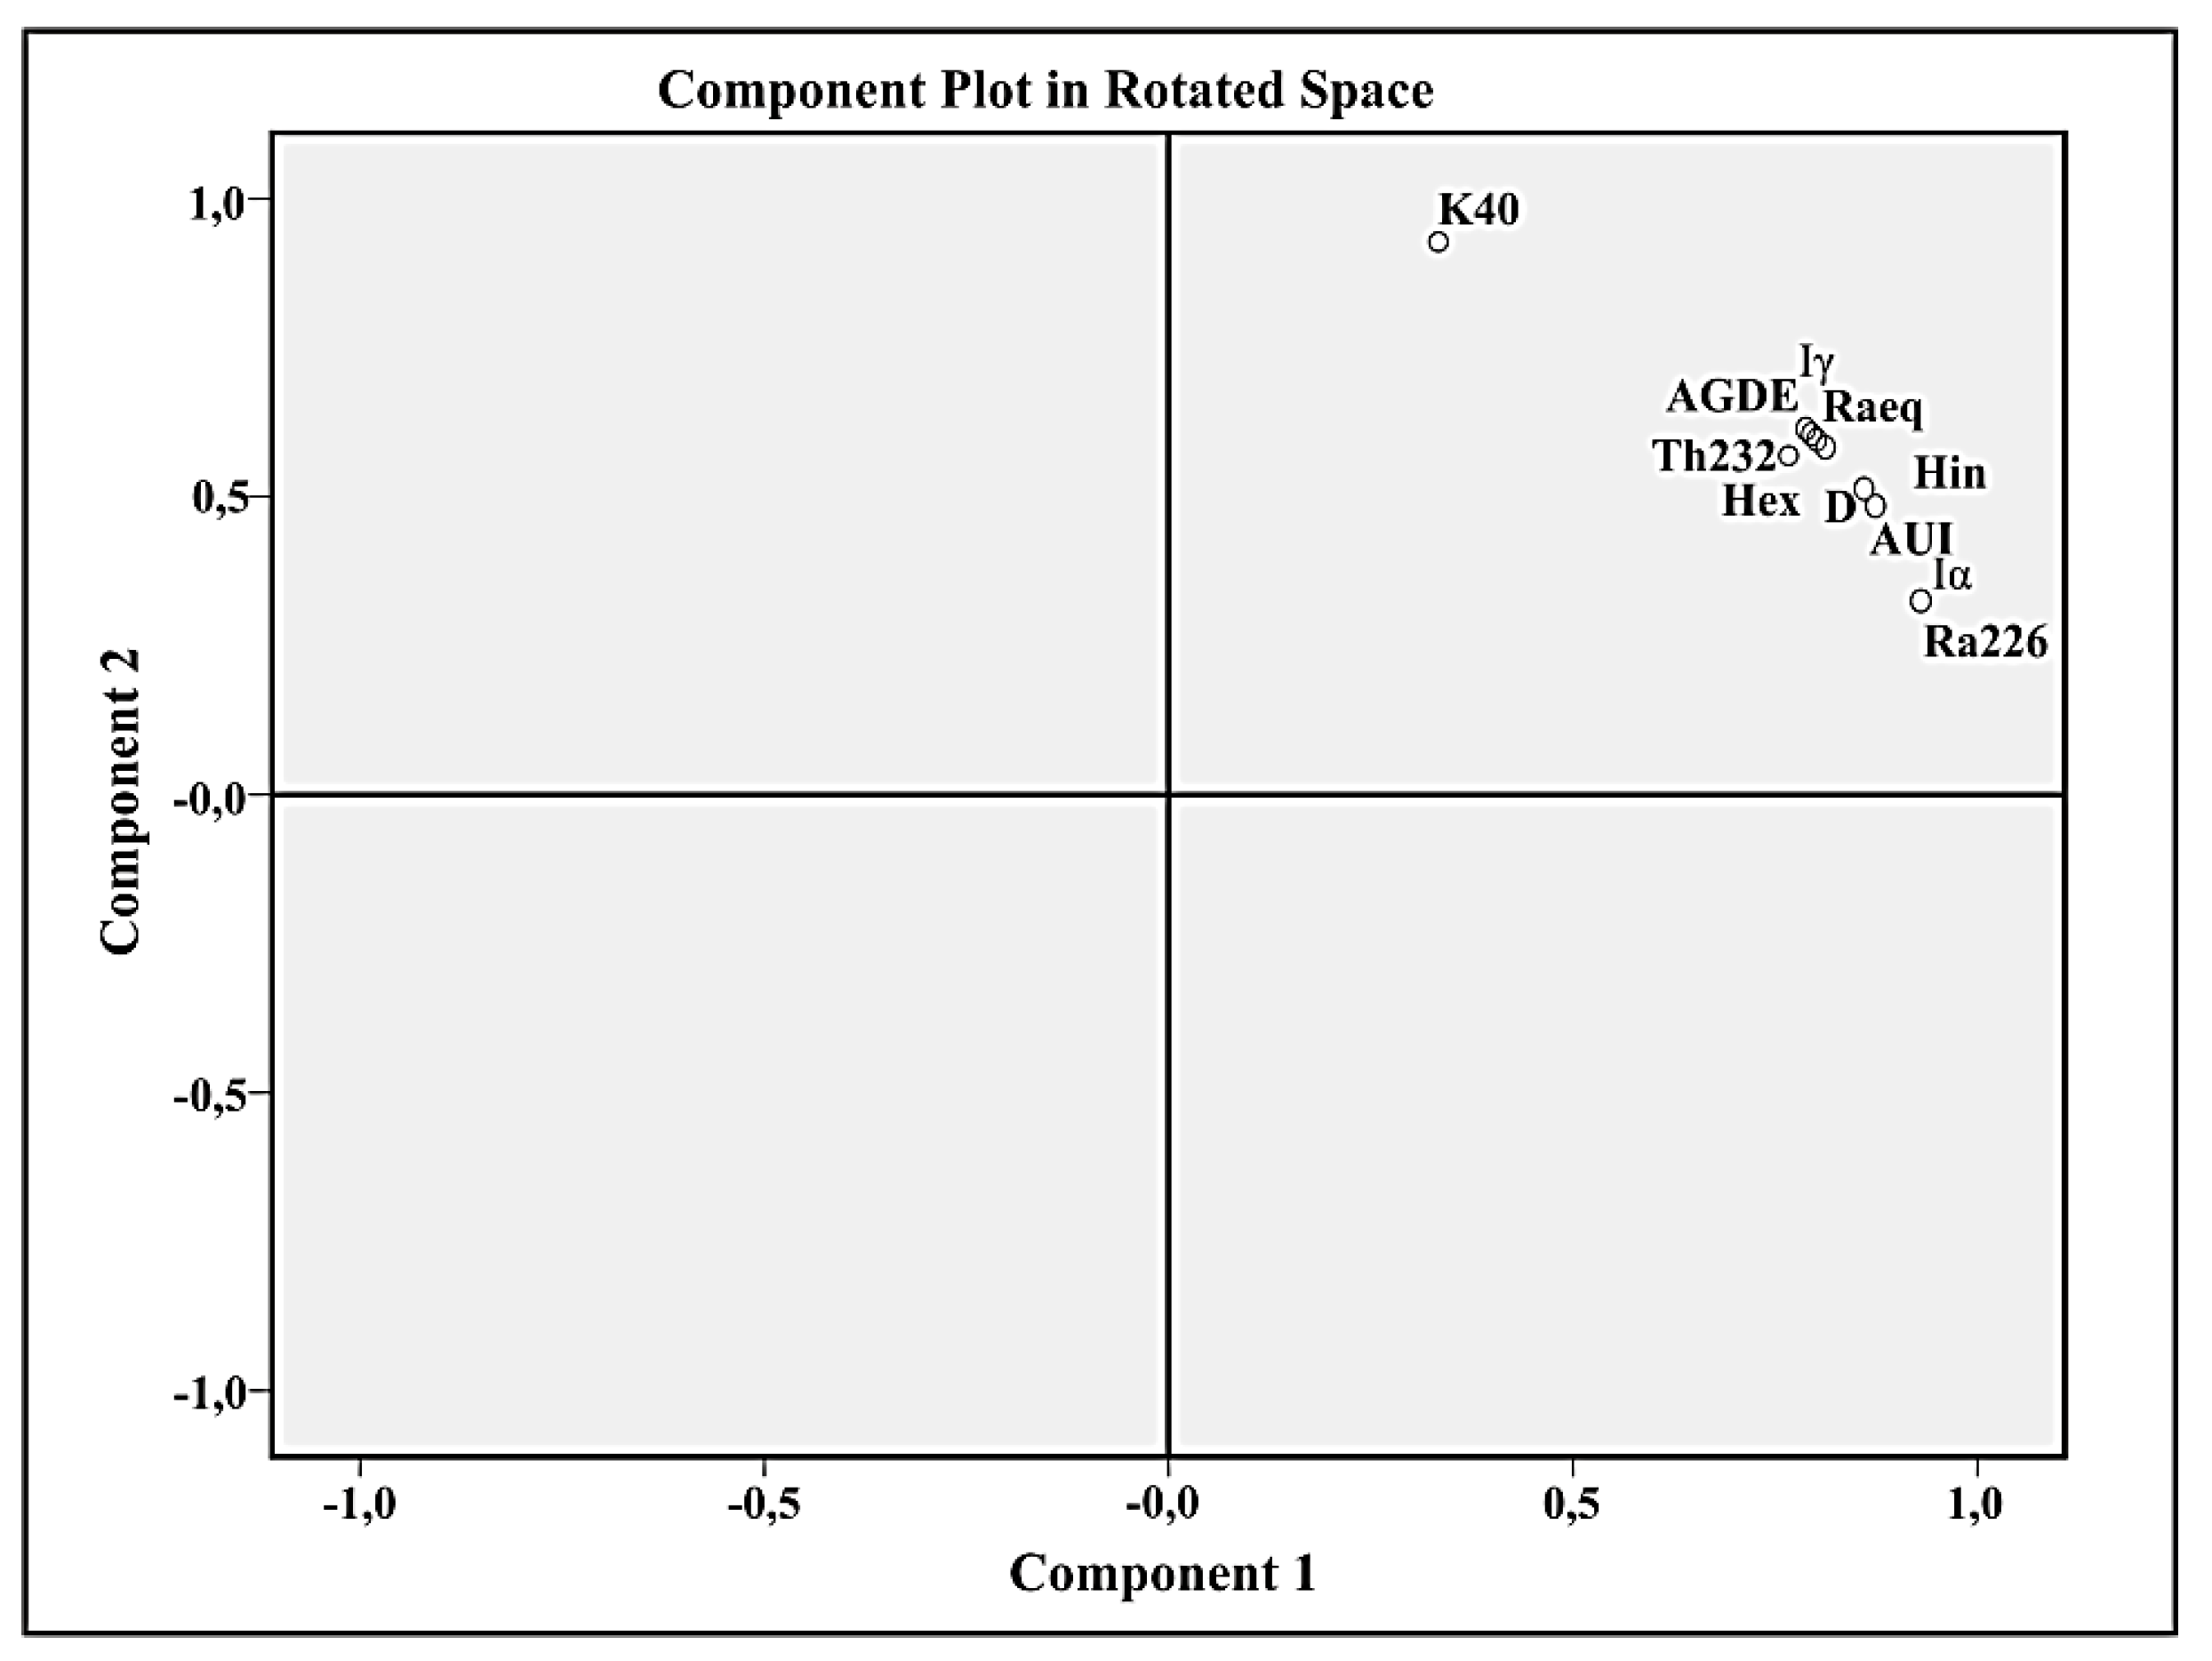
3.2.3. Factor Analysis
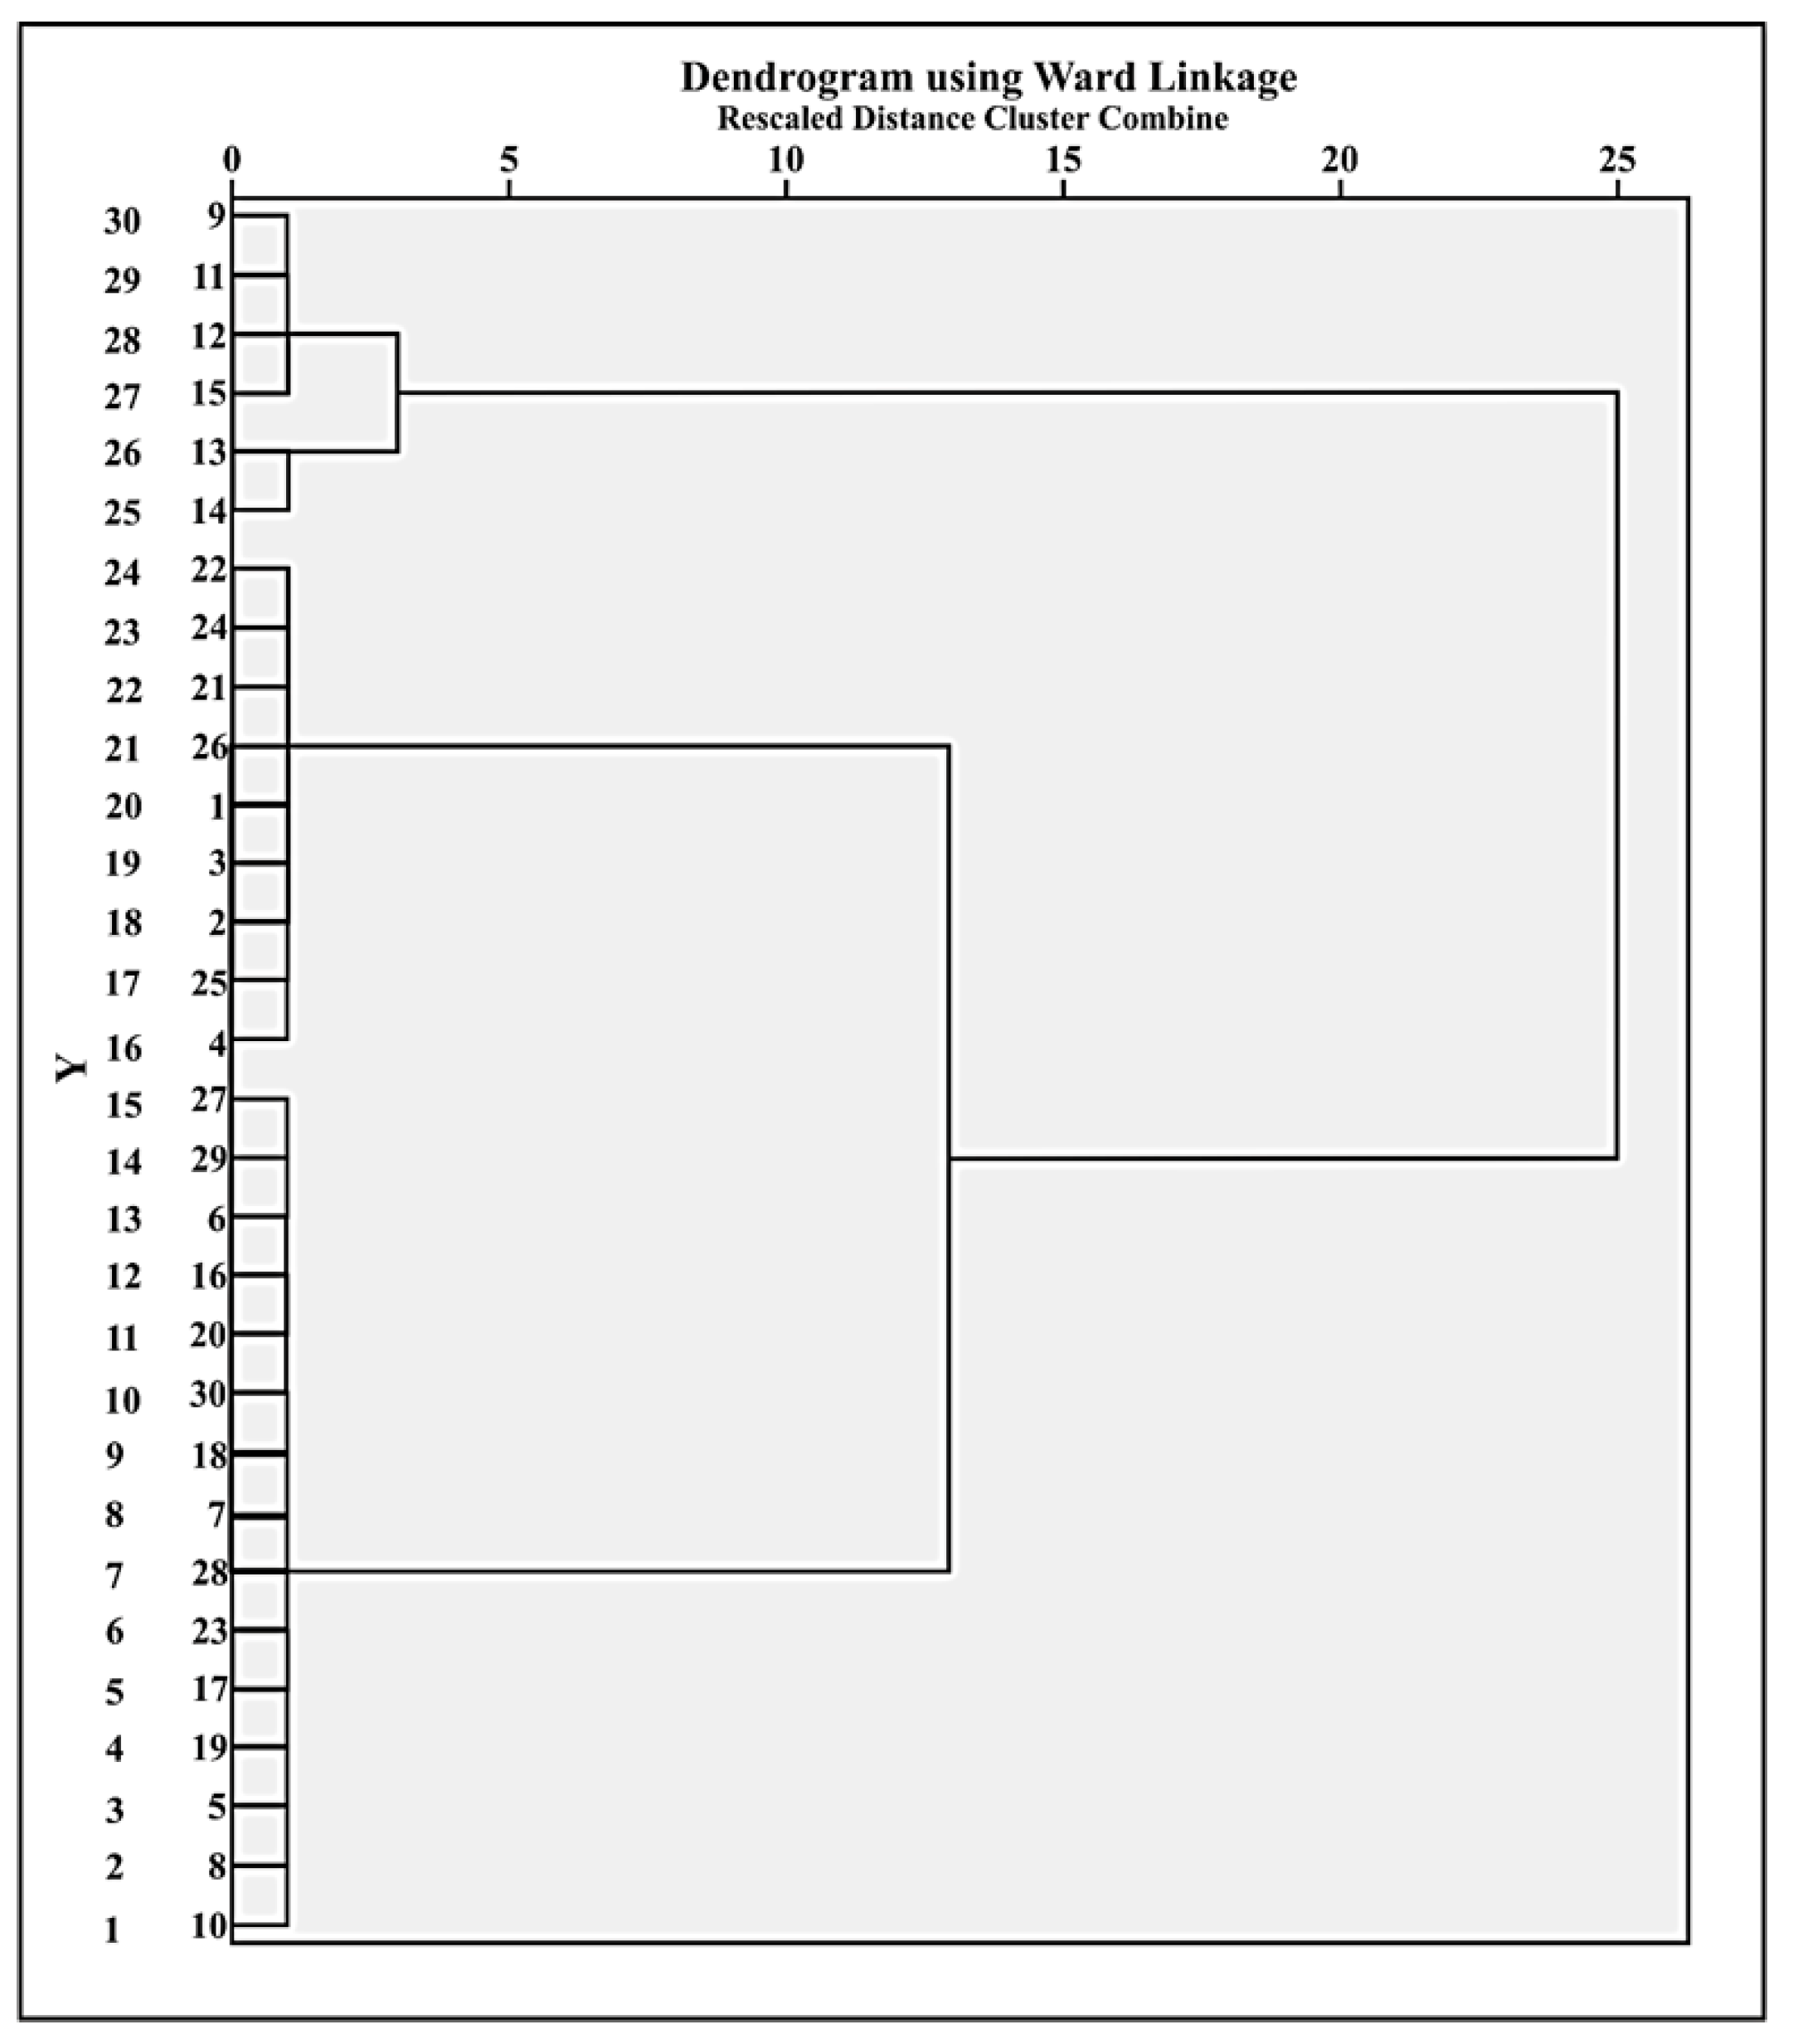
3.2.4. Cluster Analysis (CA)
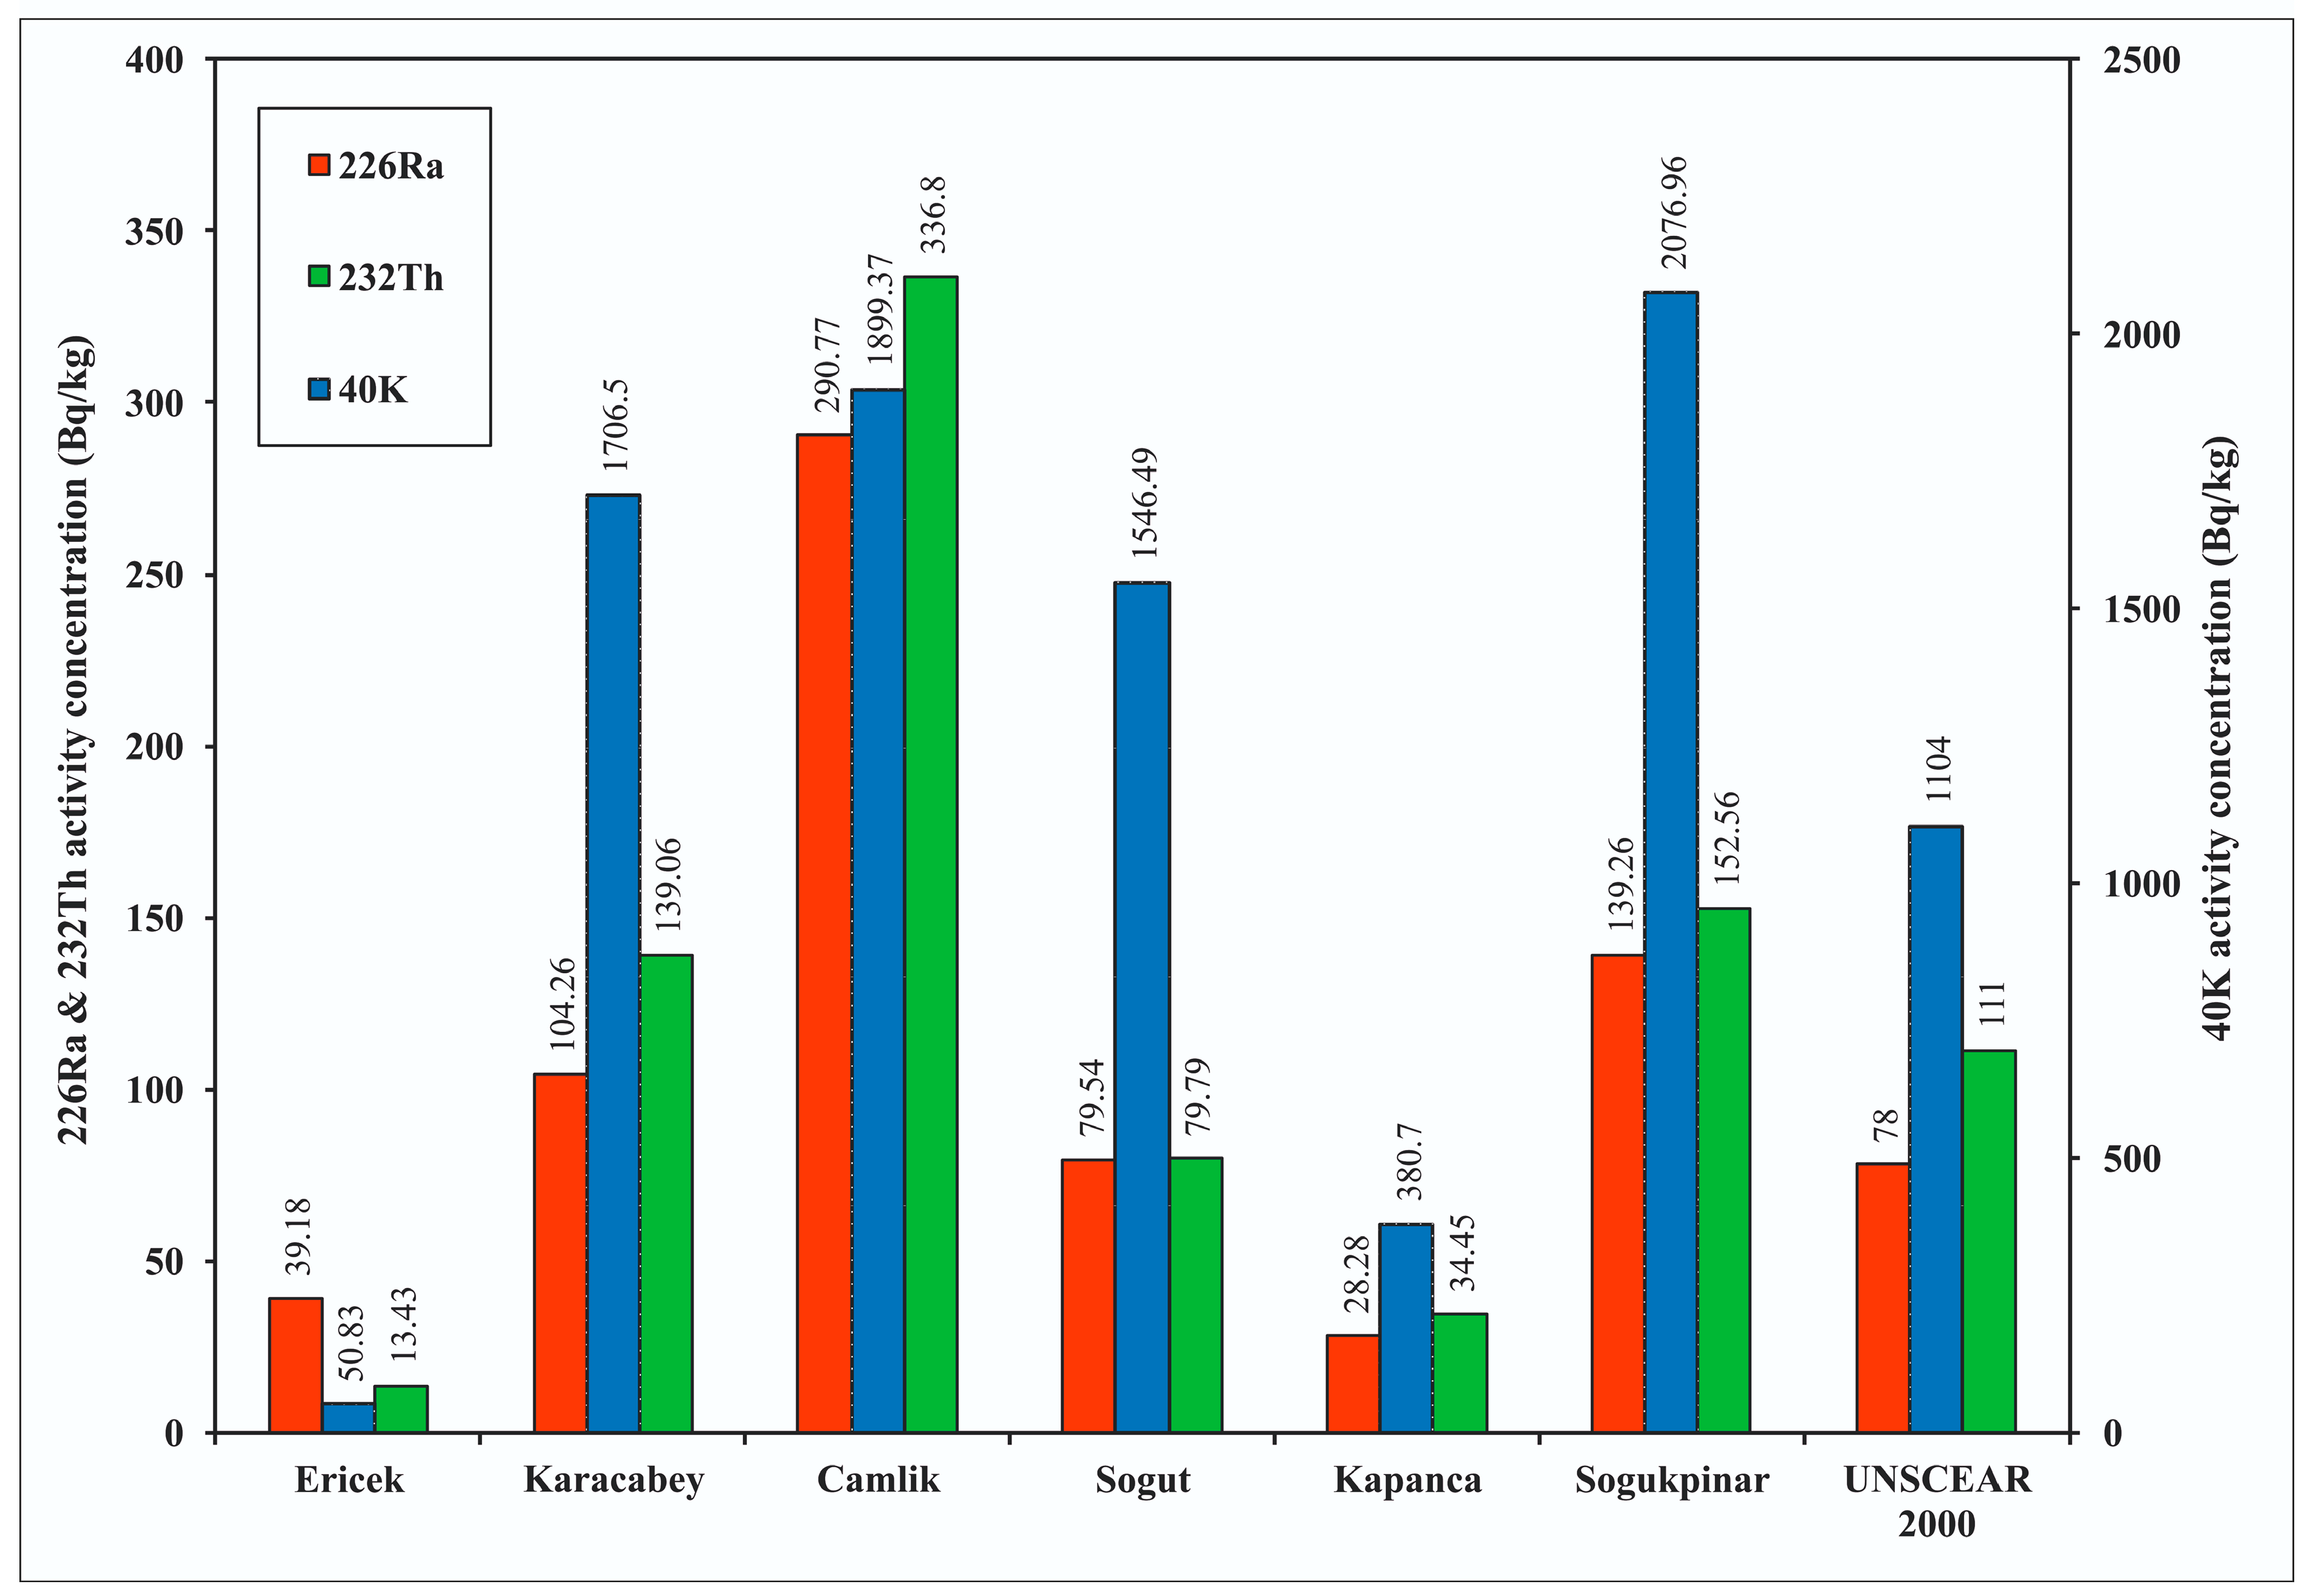
3.3. Comparison with Other Countries
4. Conclusions
Author Contributions
Funding
Acknowledgments
Conflicts of Interest
References
- Beck, H.L. Exposure Rate Conversion Factors for Radionuclides Deposited on the Ground, Report no.EML-378; Department of Energy: New York, NY, USA, 1980. [Google Scholar]
- Onargan, T.; Gur, F.; Kaya, E.; Guneri, S. Assessment of natural radioactivity in commercial granites used in Turkey. J. Environ. Sci. Health Part A 2012, 47, 1825–1830. [Google Scholar] [CrossRef]
- Ramassay, V.; Dheenathayalu, M.; Ravisankar, R.; Ponnusamy, V. Natural radioactivity measurements in Beach-rock samples of South-East Coast of Tamilnadu, India. Radiat. Prot. Dosim. 2004, 111, 229–235. [Google Scholar] [CrossRef]
- Rati, V.; Mahur, A.; Sonkawade, R.; Suhail, M.; Azam, A.; Prasad, R. Evaluation and analysis of 226Ra, 232Th, 40K and radon exhalation rate in various grey cements. Indian J. Pure Appl. Phys. 2010, 48, 473–482. [Google Scholar]
- Saito, K.; Jacop, P. Gamma ray fields in the air due to sources in the ground. Radiat. Prot. Dosim. 1995, 58, 29–45. [Google Scholar]
- Agbalagba, E.O.; Avwiri, G.O.; Chad-Umoreh, Y.E. Gamma-spectroscopy measurement of natural radioactivity and assessment of radiation hazard indices in soil samples from oil fields environment of Delta State, Nigeria. J. Environ. Radioact. 2012, 109, 64–70. [Google Scholar] [CrossRef]
- Mohamed, R.I.; Algamdi, S.K.; Al-Shamani, N.S. Evaluation of radionuclide concentrations and associated radiological hazard in marble indices and granite used as building materials in Al-Madinah Al-Munawarah. J. Taibah Univ. Sci. 2016, 10, 369–374. [Google Scholar] [CrossRef] [Green Version]
- El-Gamal, H.; El-Haddad, M. Estimation of Natural Radionuclides and Rare Earth Elements Concentration of the Rocks of Abu Khuruq Ring Complex, Egypt. Symmetry 2019, 11, 1041. [Google Scholar] [CrossRef] [Green Version]
- Nyamsari, D.G.; Yalcin, M.G.; Wolfson, I. Alteration, Chemical Process and Parent Rock of Haléo-Danielle Plateau Bauxite, Adamawa–Cameroon. Lith. Miner. Res. 2020, 55, 231–243. [Google Scholar] [CrossRef]
- Ozmen, S.F.; Boztosun, I.; Yavuz, M.; Tunc, M.R. Determination of gamma radioactivity levels and associated dose rates of soil samples of the Akkuyu/Mersin using high-resolution gamma-ray spectrometry. Radiat. Prot. Dosim. 2013, 158, 461–465. [Google Scholar] [CrossRef]
- Monica, S.; Visnu Prasad, A.K.; Soniya, S.R.; Jojo, P.J. Estimation of indoor and outdoor effective doses and lifetime cancer risk from gamma dose rates along the coastal regions of Kollam district, Kerala. Radiat. Prot. Environ. 2016, 39, 38–43. [Google Scholar]
- Qureshi, A.A.; Manzoor, S.; Younis, H.; Shah, K.H.; Ahmed, T. Assessment of Radiation Dose and Excessive Life-Time Cancer Risk from the Bunair Granite, Northern Pakistan. Radiat. Prot. Dosim. 2018, 178, 143–151. [Google Scholar] [CrossRef] [PubMed] [Green Version]
- UNSCEAR, United Nations Scientific Committee on the Effects of Atomic Radiation. Sources and Biological Effects of Ionizing Radiation; United Nations: New York, NY, USA, 1988. [Google Scholar]
- UNSCEAR, United Nations Scientific Committee on the Effects of Atomic Radiation. Sources, Effects and Risks of Ionizing Radiation, Report to the General Assembly with Annex B: Exposures from Natural Sources of Radiation; United Nations: New York, NY, USA, 2000. [Google Scholar]
- Anjos, R.M.; Juri Ayub, J.; Cid, A.S.; Cardoso, R.; Lacerda, T. External gamma-ray dose rate and radon concentration in indoor environments covered with Brazilian granites. J. Environ. Radioact. 2011, 102, 1055–1061. [Google Scholar] [CrossRef]
- Moura, C.L.; Artur, A.C.; Bonotto, D.M.; Guedes, S.; Martinelli, C.D. Natural radioactivity and radon exhalation rate in Brazilian igneous rocks. J. Appl. Radiat. Isot. 2011, 69, 1094–1099. [Google Scholar] [CrossRef] [PubMed]
- Mao, Y.; Liu, Y.; Fu, Y.; Lin, L. Physical models and limits of radionuclides for decorative building materials. Health Phys. 2006, 90, 471–476. [Google Scholar] [CrossRef]
- Xinwei, L.; Lingqing, W.; Xiaodan, J. Radiometric analysis of Chinese commercial granites. J. Radioanal. Nucl. Chem. 2006, 267, 669–673. [Google Scholar] [CrossRef]
- Gbadamosi, M.R.; Afolabi, T.A.; Banjoko, O.O.; Ogunneye, A.L.; Abudu, K.A.; Ogunbanjo, O.O.; Jegede, D.O. Spatial distribution and lifetime cancer risk due to naturally occurring radionuclides in soils around tar-sand deposit area of Ogun State, southwest Nigeria. Chemosphere 2018, 193, 1036–1048. [Google Scholar] [CrossRef]
- Tzortzis, M.; Tsertos, H.; Christofides, S.; Christodoulides, G. Gamma measurements and dose rates in commercially used tiling rocks (granites). J. Environ. Radioact. 2003, 70, 223–235. [Google Scholar] [CrossRef] [Green Version]
- El-Gamal, H.; Sidique, E.; El-Haddad, M.; Farid, M.A. Assessment of the natural radioactivity and radiological hazards in granites of Mueilha area (South Eastern Desert, Egypt). Environ. Earth Sci. 2018, 77, 19. [Google Scholar] [CrossRef]
- Heikal, S.; Gomaa, S.R.; Abd El Monsef, M.; Taha, A.A.; Top, G.; Mahmoud, K.R.; El-Mansi, M.M. Insight on Radiological Risk Assessment and its Statistical Evaluations for Abu Dabbab Albite Granite Mining Area, Central Nubian Shield, Egypt. Arab J. Nucl. Sci. Appl. 2018, 51, 143–167. [Google Scholar]
- Papadopoulos, A.; Christofides, G.; Koroneos, A.; Papadopoulou, L.; Papastefanou, C.; Stoulos, S. Natural radioactivity and radiation index of the major granitic plutons in Greece. J. Environ. Radioact. 2013, 124, 227–238. [Google Scholar] [CrossRef]
- Papadopoulos, A.; Altunkaynak, S.; Koroneos, A.; Unal, A.; Kamaci, O. Distribution of natural radioactivity and assessment of radioactive dose of Western Anatolian plutons, Turkey. Turk. J. Earth Sci. 2016, 25, 434–455. [Google Scholar] [CrossRef]
- Pavlidou, S.; Koroneos, A.; Papastefanou, C.; Christofides, G.; Stoulos, S.; Vavelides, M. Natural radioactivity of granites used as building materials. J. Environ. Radioact. 2006, 89, 48–60. [Google Scholar] [CrossRef] [PubMed]
- Abbasi, A. Calculation of gamma radiation dose rate and radon concentration due to granites used as building materials in Iran. Radiat. Prot. Dosim. 2013, 155, 335–342. [Google Scholar] [CrossRef] [PubMed]
- Michael, F.; Parpottas, Y.; Tsertos, H. Gamma Radiation Measurements and dose rates in commonly used building materials in Cyprus. Radiat. Prot. Dosim. 2010, 142, 282–291. [Google Scholar] [CrossRef] [Green Version]
- Iwaoka, K.; Hosoda, M.; Tabe, H.; Ishikawa, T.; Tokonami, S.; Yonehara, H. Activity concentration of natural radionuclides and radon and thoron exhalation rates in rocks used as decorative wall coverings in Japan. Health Phys. 2013, 104, 41–50. [Google Scholar] [CrossRef]
- Hamideen, M.S.; Bdair, O.M.; Chandrasekaran, A.; Saleh, H.; Elimat, Z.M. Multivariate statistical investigations of natural radioactivity and radiological hazards in building materials mainly used in Amman Province, Jordan. Int. J. Environ. Anal. Chem. 2020, 100, 189–203. [Google Scholar] [CrossRef]
- Ademola, J.A. Occupational Exposure Due to Naturally Occurring Radionuclide Material in Granite Quarry Industry. Radiat. Prot. Dosim. 2012, 148, 297–300. [Google Scholar] [CrossRef]
- Thabayneh, K.M. Measurement of Natural Radioactivity and Radon Exhalation Rate in Granite Samples Used in Palestinian Buildings. Arab. J. Sci. Eng. 2013, 38, 201–207. [Google Scholar] [CrossRef]
- Guillen, J.; Tejado, J.J.; Baeza, A.; Corbacho, J.A.; Munoz, J.G. Assessment of radiological hazard of commercial granites from Extremadura (Spain). J. Environ. Radioact. 2014, 132, 81–88. [Google Scholar] [CrossRef]
- Angi, O.S.; Yavuz, O.; Yalcin, T.; Ciftci, E. Mineralogy-induced radiological aspects with characterization of commercial granites exploited in Turkey. Bull. Eng. Geol. Environ. 2016, 76, 507–522. [Google Scholar] [CrossRef]
- Cetin, E.; Altinsoy, N.; Orgun, Y. Natural radioactivity levels of granites used in Turkey. Radiat. Prot. Dosi. 2012, 151, 299–305. [Google Scholar] [CrossRef] [PubMed]
- Turhan, S. Estimation of possible radiological hazards from natural radioactivity in commercially-utilized ornamental and countertops granite tiles. Ann. Nucl. Energy 2012, 44, 34–39. [Google Scholar] [CrossRef]
- Sahin Bal, S. The determination of concentrations of radioisotopes in some granite samples in Turkey and their radiation hazards. Rad. Eff. Def. Sol. 2018, 173, 353–366. [Google Scholar] [CrossRef]
- Kitto, M.E.; Haines, D.K.; Menia, T.A. Assessment of gamma-ray emissions from natural and manmade decorative stones. J. Radioanal. Nucl. Chem. 2009, 282, 409–413. [Google Scholar] [CrossRef]
- Abd El-mageed, A.I.; El-Kamel, A.H.; Abbady, A.; Harb, S.; Youssef, A.M.M.; Saleh, I.I. Assessment of natural and anthropogenic radioactivity levels in rocks and soil in the environments of Juban town in Yemen. Radiat. Phys. Chem. 2011, 80, 710–715. [Google Scholar] [CrossRef]
- Okay, A. Metamorphic Evolution of the Pre-Jurassic Basement of the Sakarya Zone. Geol. Congr. Turk. 2011, 64, 215–216. [Google Scholar]
- Yilmaz, M.; Ozmen, S.F. Radiologic Risk Assessment of Fish Feed and Feed Raw Materials. Aquac. Res. 2020, 51, 2190–2196. [Google Scholar] [CrossRef]
- Ozmen, S.F.; Cesur, A.; Boztosun, I.; Yavuz, M. Distribution of natural and anthropogenic radionuclides in beach sand samples from Mediterranean Coast of Turkey. Radiat. Phys. Chem. 2014, 103, 37–44. [Google Scholar] [CrossRef]
- Unal, S.; Yalcin, M.G.; Ocak, S.; Yalcin, R.; Ozmen, S.F. Computation of gamma radioactivity of natural rocks in the vicinity of Antalya province and its effect on health. Kerntechnik 2018, 83, 112–120. [Google Scholar] [CrossRef]
- Alam, M.N.; Chowdhury, M.I.; Kamal, M.; Ghose, S.; Islam, M.N.; Mustafa, M.N.; Miah, M.M.H.; Ansary, M.M. The 226Ra, 232Th and 40K activities in beach sand minerals and beach soils of Cox’s Bazar, Bangladesh. J. Environ. Radioact. 1999, 46, 243–250. [Google Scholar] [CrossRef]
- Beretka, J.; Mathew, P.J. Natural radioactivity of Australian building materials, industrial wastes and by-products. Health Phys. 1985, 48, 87–95. [Google Scholar] [CrossRef]
- Mamont-Ciesla, K.; Gwiazdowski, B.; Biernacka, M.; Zak, A. Radioactivity of building materials in Poland. In Natural Radiation Environment; Halsted Press: New York, NY, USA, 1982; p. 551. [Google Scholar]
- Jallad, K.N. Radiation hazard indices and excess lifetime cancer risk in sand from the northern and eastern regions of Kuwait. Environ. Earth Sci. 2016, 75, 1–10. [Google Scholar] [CrossRef]
- Mohammed, R.S.; Ahmed, R.S. Estimation of excess lifetime cancer risk and radiation hazard indices in southern Iraq. Environ. Earth Sci. 2017, 76, 303. [Google Scholar] [CrossRef]
- Ravisankar, R.; Vanasundari, K.; Suganya, M.; Raghu, Y.; Rajalakshmi, A.; Chandrasekaran, A.; Sivakunar, S.; Chandramohan, J.; Vijayagopal, P.; Venkatraman, B. Multivariate statistical analysis of radiological data of building materials used in Tiruvannamalai, Tamilnadu, India. Appl. Radiat. Isot. 2014, 85, 114–127. [Google Scholar] [CrossRef]
- Heikal, M.T.S.; Top, G. Assessment of radioactivity levels and potential radiation health hazards of Madsus granites and associated dikes nearby and around Ruwisat village, South Sinai, Egypt. J. Afr. Earth Sci. 2018, 146, 191–208. [Google Scholar] [CrossRef]
- Yalcin, M.G.; Unal, S. Natural radioactivity levels and associated radiation hazards in ophiolites around Tekirova, Kemer, and Kumluca Touristic Regions in Antalya, Turkey. J. Radioanal. Nucl. Chem. 2018, 316, 321–330. [Google Scholar] [CrossRef]
- Nyamsari, D.G.; Yalcin, F.; Mboh, M.T.; Alfred, F.G.; Yalcin, M.G. Natural radioactive risk assessment in top soil and possible health effect in Minim and Martap villages, Cameroon: Using radioactive risk index and statistical analysis. Kerntechnik 2019, 84, 115–122. [Google Scholar] [CrossRef]
- Morsy, Z.; El-wahab, M.A.; El-Faramawy, N. Determination of natural radioactive elements in Abo Zaabal, Egypt by means Gamma Spectroscopy. Ann. Nucl. Energy 2012, 44, 8–11. [Google Scholar] [CrossRef]
- Ramasamy, V.; Sundarrajan, M.; Paramasivam, K.; Meenakshisundaram, V.; Suresh, G. Assessment of spatial distribution and radiological hazardous nature of radionuclides in high background area, Kerala, India. Appl. Radiat. Isot. 2013, 73, 21–31. [Google Scholar] [CrossRef] [PubMed]
- Orgun, Y.; Altınsoy, N.; Sahin, S.Y.; Gungor, Y.; Gultekin, A.H.; Karahan, G.; Karacik, Z. Natural and anthropogenic radionuclides in rocks and beach sands from Ezine region (Canakkale), Western Anatolia, Turkey. Appl. Radiat. Isot. 2007, 65, 739–747. [Google Scholar] [CrossRef] [PubMed]
- Canbaz, O.B.; Yaprak, G.; Cam, N.F.; Candan, O. A radiological Survey of the Egrigoz Granitoid, Western Anatolia/Turkey. Radiat. Prot. Dosi. 2015, 164, 510–518. [Google Scholar] [CrossRef] [PubMed]


| Standard | Reference Value (Bq kg−1) | Measured Value (Bq kg−1) |
|---|---|---|
| RGU-1 | 4940 ± 30 | 4964 ± 72 |
| RGTh-1 | 3250 ± 90 | 3276 ± 64 |
| RGK-1 | 14000 ± 400 | 14240 ± 546 |
| S/N | Radiological Parameters | Units | Used Formula | References |
|---|---|---|---|---|
| 1 | Absorbed dose rate (D) | nGy hr−1 | DR = (0.462 AU + 0.604ATh + 0.0417 AK) ≤ 80 | [14,36] |
| 2 | Radium equivalent (Raeq) | Bq kg−1 | Raeq = (Au + 1.43 ATh + 0.077 AK) ≤ 370 | [14,36] |
| 3 | Alfa index (Iα) | µRh r−1 | Iα = AU/200 ≤ 1 | [42] |
| 4 | Gamma index (Iγ) | - | Iγr = AU/300 + ATh/200 + AK/3000 ≤ 1 | [43] |
| 5 | External hazard index (Hex) | - | Hex = AU/370 + ATh/259 + AK/4810 ≤ 1 | [44] |
| 6 | Internal hazard index (Hin) | - | Hin = AU/185 + ATh/259 + AK/4810 ≤ 1 | [42] |
| 7 | Annual effective dose equivalent (AEDEindoor) | µSv yr−1 | AEDE(indoor) = DR × 8766 h × 0.7 Sv/Gy × 0.8 × 10⁻³ ≤ 0.48 | [14,36,42] |
| 8 | Annual effective dose equivalent (AEDEoutdoor) | µSv yr−1 | AEDE(outdoor)= DR × 8766 h × 0.7 Sv/Gy × 0.2 × 10⁻³ ≤ 0.48 | [14,36] |
| 9 | Annual gonadal dose equivalent (AGDE) | µSv yr−1 | AGDE= 3.09 AU × 4.18 ATh × 0.314 AK ≤ 300 | [36,45] |
| 10 | Excess lifetime cancer risk (ELCRoutdoor) | µSv yr−1 | ELCR(outdoor) = AEDEoutdoor × DL × RF ≤ 0.29 | [35,46,47] |
| 11 | Activity utilization index (AUI) | - | AUI = AU/50 fU + ATh/50 fTh + AK/500 fK ≤ 2 | [48] |
| Locations | Number | Longitude | Latitude | Rock Types | 226Ra (Bq kg−1) | ± | 232Th (Bq kg−1) | ± | 40K (Bq kg−1) | ± | D | Raeq | Iα | Iγ | Hex | Hin | AEDEindoor | AEDEoutdoor | AGDE | ELCR | AUI |
|---|---|---|---|---|---|---|---|---|---|---|---|---|---|---|---|---|---|---|---|---|---|
| nGy hr−1 | Bq kg−1 | µRhr −1 | µSv yr−1 | µSv yr−1 | µSv yr−1 | µSv yr−1 | |||||||||||||||
| Ericek | N1-ER-2 | 28.432043098 | 39.676005958 | Metagranite | 12.11 | 0.81 | 9.33 | 0.73 | 39.26 | 2.03 | 12.87 | 28.47 | 0.06 | 0.10 | 0.08 | 0.11 | 63.16 | 15.79 | 88.74 | 55.26 | 0.23 |
| N2-ER-3 | 28.431755220 | 39.676180693 | Chlorite schist | 16.41 | 0.99 | 44.39 | 3.74 | 18.75 | 0.90 | 35.17 | 81.33 | 0.08 | 0.28 | 0.22 | 0.26 | 172.66 | 43.17 | 242.13 | 151.08 | 0.69 | |
| N3-ER-4 | 28.431715042 | 39.675928916 | Metagranite | 9.84 | 0.70 | 0.00 | 0.00 | 99.35 | 3.80 | 8.69 | 17.49 | 0.05 | 0.07 | 0.05 | 0.07 | 42.65 | 10.66 | 61.59 | 37.32 | 0.10 | |
| N4-ER-5 | 28.431291691 | 39.675753940 | Metagranite | 118.36 | 8.86 | 0.00 | 0.00 | 45.94 | 1.76 | 56.60 | 121.90 | 0.59 | 0.41 | 0.33 | 0.65 | 277.84 | 69.46 | 380.16 | 243.11 | 1.10 | |
| Karacabey | N5-KR-1 | 28.324269802 | 40.273353542 | Metagranite | 39.18 | 3.32 | 66.84 | 3.15 | 1982.63 | 111.78 | 141.15 | 287.42 | 0.20 | 1.13 | 0.78 | 0.88 | 692.88 | 173.22 | 1022.99 | 606.27 | 1.33 |
| N6-KR-3 | 28.327619381 | 40.278639427 | Musqovite schist | 141.97 | 8.83 | 126.70 | 6.96 | 2300.20 | 122.99 | 238.04 | 500.27 | 0.71 | 1.87 | 1.35 | 1.73 | 1168.51 | 292.13 | 1690.57 | 1022.45 | 3.03 | |
| N7-KR-4 | 28.334002977 | 40.271881386 | Metagranite | 140.29 | 12.19 | 203.21 | 12.24 | 2026.38 | 78.34 | 272.05 | 586.91 | 0.70 | 2.16 | 1.59 | 1.96 | 1335.50 | 333.88 | 1919.20 | 1168.56 | 3.92 | |
| N8-KR-7 | 28.467674661 | 40.252524554 | Granite | 133.31 | 10.46 | 147.12 | 11.33 | 1110.49 | 46.14 | 196.76 | 429.20 | 0.67 | 1.55 | 1.16 | 1.52 | 965.87 | 241.47 | 1375.58 | 845.13 | 3.10 | |
| Camlik | N9-F-29 | 27.147836611 | 39.654970995 | Granite | 337.78 | 24.65 | 366.98 | 18.60 | 2164.45 | 95.02 | 467.97 | 1029.23 | 1.69 | 3.68 | 2.78 | 3.69 | 2297.25 | 574.31 | 3257.37 | 2010.09 | 7.73 |
| N10-F-31 | 27.160345614 | 39.660657918 | Dike | 152.58 | 7.67 | 263.77 | 20.58 | 1160.89 | 57.31 | 278.22 | 619.17 | 0.76 | 2.21 | 1.67 | 2.08 | 1365.77 | 341.44 | 1938.57 | 1195.05 | 4.69 | |
| N11-F-34 | 27.160405794 | 39.666523519 | Granite | 314.22 | 14.91 | 386.84 | 27.14 | 2158.89 | 88.00 | 468.85 | 1033.64 | 1.57 | 3.70 | 2.79 | 3.64 | 2301.56 | 575.39 | 3265.84 | 2013.86 | 7.76 | |
| N12-F-35A | 27.157165668 | 39.677241137 | Granite | 353.71 | 23.43 | 381.28 | 25.06 | 2323.22 | 89.28 | 490.59 | 1077.83 | 1.77 | 3.86 | 2.91 | 3.87 | 2408.26 | 602.07 | 3416.20 | 2107.23 | 8.07 | |
| N13-E-3 | 27.141680038 | 39.648329069 | Aplite | 425.80 | 29.54 | 351.98 | 31.85 | 3569.09 | 162.79 | 558.15 | 1203.96 | 2.13 | 4.37 | 3.25 | 4.40 | 2739.93 | 684.98 | 3907.71 | 2397.44 | 8.48 | |
| N14-E-14 | 27.153147118 | 39.652747590 | Pegmatite | 752.30 | 50.70 | 367.90 | 17.46 | 2921.97 | 130.26 | 691.62 | 1503.39 | 3.76 | 5.32 | 4.06 | 6.09 | 3395.14 | 848.79 | 4779.93 | 2970.75 | 11.64 | |
| N15-E-18 | 27.148632065 | 39.650834260 | Granite | 295.53 | 15.30 | 285.12 | 18.10 | 1689.39 | 85.85 | 379.20 | 833.34 | 1.48 | 2.97 | 2.25 | 3.05 | 1861.46 | 465.36 | 2635.47 | 1628.78 | 6.32 | |
| Sogut | N16-ST-1 | 30.221631828 | 40.034862141 | Metagranite | 151.35 | 11.15 | 113.01 | 9.74 | 1924.67 | 110.23 | 218.44 | 461.15 | 0.76 | 1.71 | 1.25 | 1.65 | 1072.30 | 268.07 | 1544.37 | 938.26 | 2.92 |
| N17-ST-52 | 30.583316796 | 40.069253317 | Granite | 50.41 | 2.55 | 82.25 | 5.65 | 1694.93 | 81.92 | 143.65 | 298.54 | 0.25 | 1.14 | 0.81 | 0.94 | 705.17 | 176.29 | 1031.79 | 617.02 | 1.60 | |
| N18-ST-59 | 30.588577067 | 40.081668280 | Pegmatite | 83.98 | 4.33 | 99.68 | 5.22 | 2221.42 | 88.19 | 191.64 | 397.57 | 0.42 | 1.52 | 1.07 | 1.30 | 940.74 | 235.19 | 1373.68 | 823.15 | 2.17 | |
| N19-ST-80 | 30.011660747 | 40.093298000 | Metagranite | 50.75 | 3.98 | 79.35 | 6.75 | 1569.46 | 78.43 | 136.82 | 285.07 | 0.25 | 1.09 | 0.77 | 0.91 | 671.66 | 167.91 | 981.33 | 587.70 | 1.56 | |
| N20-ST-87 | 30.383392504 | 40.042351196 | Metagranite | 140.83 | 12.93 | 117.24 | 8.57 | 1975.17 | 91.55 | 218.24 | 460.57 | 0.70 | 1.71 | 1.24 | 1.62 | 1071.34 | 267.84 | 1545.44 | 937.43 | 2.88 | |
| N21-ST-89 | 30.728501362 | 40.137206230 | Diorite | 4.36 | 0.23 | 7.11 | 0.40 | 568.24 | 22.08 | 30.00 | 58.28 | 0.02 | 0.24 | 0.16 | 0.17 | 147.28 | 36.82 | 221.60 | 128.87 | 0.17 | |
| Kapanca | N22-KP-1 | 28.972752904 | 39.888305934 | Metagranite | 9.70 | 0.48 | 30.97 | 2.15 | 623.95 | 29.57 | 49.21 | 102.03 | 0.05 | 0.40 | 0.28 | 0.30 | 241.55 | 60.39 | 355.34 | 211.35 | 0.52 |
| N23-KP-2 | 28.970348655 | 39.890517980 | Pegmatite | 60.63 | 5.08 | 195.26 | 10.36 | 2582.37 | 147.27 | 253.63 | 538.69 | 0.30 | 2.04 | 1.45 | 1.62 | 1245.07 | 311.27 | 1814.39 | 1089.43 | 3.13 | |
| N24-KP-8 | 28.965301549 | 39.895612630 | Granite | 21.78 | 1.29 | 14.93 | 0.71 | 545.25 | 31.45 | 41.82 | 85.12 | 0.11 | 0.33 | 0.23 | 0.29 | 205.28 | 51.32 | 300.92 | 179.62 | 0.43 | |
| N25-KP-11 | 28.969088271 | 39.889386245 | Granite | 41.52 | 2.67 | 41.22 | 2.53 | 10.47 | 0.47 | 44.52 | 101.27 | 0.21 | 0.35 | 0.27 | 0.39 | 218.53 | 54.63 | 303.89 | 191.21 | 0.88 | |
| N26-KP-12 | 28.967971372 | 39.891225020 | Granite | 40.11 | 2.70 | 50.67 | 4.52 | 343.10 | 13.97 | 63.44 | 138.98 | 0.20 | 0.50 | 0.38 | 0.48 | 311.42 | 77.86 | 443.45 | 272.49 | 1.01 | |
| Sogukpinar | N27-SR-5 | 29.109736537 | 40.073022948 | Metagranite | 106.13 | 9.41 | 153.35 | 8.01 | 2099.64 | 105.49 | 229.21 | 487.10 | 0.53 | 1.82 | 1.32 | 1.60 | 1125.20 | 281.30 | 1628.25 | 984.55 | 3.01 |
| N28-SR-11 | 29.153432195 | 40.122621203 | Metagranite | 209.55 | 17.49 | 215.89 | 10.78 | 2061.64 | 77.85 | 313.18 | 677.02 | 1.05 | 2.47 | 1.83 | 2.39 | 1537.39 | 384.35 | 2197.29 | 1345.22 | 4.72 | |
| N29-SR-12 | 29.153432195 | 40.122621203 | Metagranite | 119.06 | 7.29 | 136.83 | 9.29 | 2134.53 | 85.91 | 226.66 | 479.09 | 0.60 | 1.79 | 1.29 | 1.62 | 1112.67 | 278.17 | 1610.09 | 973.58 | 2.93 | |
| N30-SR-18 | 29.118678516 | 40.064157408 | Granite | 122.31 | 8.34 | 104.17 | 6.33 | 2012.03 | 102.53 | 203.33 | 426.20 | 0.61 | 1.60 | 1.15 | 1.48 | 998.14 | 249.53 | 1445.16 | 873.37 | 2.56 |
| 226Ra | 232Th | 40K | Raeq | D | Iα | Iγ | Hex | Hin | AEDEindoor | AEDEoutdoor | AGDE | ELCR | AUI | |
|---|---|---|---|---|---|---|---|---|---|---|---|---|---|---|
| N | 30 | 30 | 30 | 30 | 30 | 30 | 30 | 30 | 30 | 30 | 30 | 30 | 30 | 30 |
| Minimum | 4.4 | 0.0 | 10.5 | 17.5 | 8.7 | 0.02 | 0.07 | 0.05 | 0.1 | 42.7 | 10.66 | 61.59 | 37.32 | 0.10 |
| Maximum | 752.3 | 386.8 | 3569.1 | 1503.4 | 691.6 | 3.8 | 5.3 | 4.1 | 6.1 | 3395.1 | 848.79 | 4779.93 | 2970.75 | 11.64 |
| Mean ± SEM | 148.5 | 148.1 | 1532.6 | 478.3 | 222 | 0.7 | 1.7 | 1.3 | 1.7 | 1089.7 | 272.43 | 1559.3 | 953.52 | 3.28 |
| Std. Deviation | 161.3 | 125.9 | 969.7 | 384.7 | 175.8 | 0.8 | 1.4 | 1.03 | 1.5 | 863.02 | 215.75 | 1220.73 | 755.14 | 2.95 |
| Kurtosis | 5.8 | −0.7 | −0.8 | 0.4 | 0.5 | 5.8 | 0.3 | 0.4 | 1.6 | 0.5 | 0.468 | 0.388 | 0.468 | 0.893 |
| Skewness | 2.1 | 0.7 | −0.2 | 1. | 0.9 | 2.1 | 0.9 | 1 | 1.3 | 0.9 | 0.929 | 0.889 | 0.929 | 1.197 |
| Kolmogorov–Smirnov a | Shapiro–Wilk | |||||
|---|---|---|---|---|---|---|
| Statistic | df | Sig. | Statistic | df | Sig. | |
| 226Ra | 0.257 | 30 | 0.000 | 0.776 | 30 | 0.000 |
| 232Th | 0.150 | 30 | 0.083 | 0.889 | 30 | 0.005 |
| 40K | 0.190 | 30 | 0.007 | 0.912 | 30 | 0.017 |
| Raeq | 0.144 | 30 | 0.114 | 0.906 | 30 | 0.012 |
| D | 0.141 | 30 | 0.131 | 0.910 | 30 | 0.015 |
| Iα | 0.258 | 30 | 0.000 | 0.776 | 30 | 0.000 |
| Iγ | 0.134 | 30 | 0.176 | 0.913 | 30 | 0.018 |
| Hex | 0.145 | 30 | 0.111 | 0.906 | 30 | 0.012 |
| Hin | 0.190 | 30 | 0.007 | 0.878 | 30 | 0.003 |
| AEDEindoor | 0.141 | 30 | 0.131 | 0.910 | 30 | 0.015 |
| AEDEoutdoor | 0.141 | 30 | 0.131 | 0.910 | 30 | 0.015 |
| AGDE | 0.145 | 30 | 0.110 | 0.914 | 30 | 0.018 |
| ELCR | 0.141 | 30 | 0.131 | 0.910 | 30 | 0.015 |
| AUI | 0.222 | 30 | 0.001 | 0.869 | 30 | 0.002 |
| 226Ra | 232Th | 40K | Raeq | D | Iα | Iγ | Hex | Hin | AEDEindoor | AEDEoutdoor | AGDE | ELCR | AUI | |
|---|---|---|---|---|---|---|---|---|---|---|---|---|---|---|
| 226Ra | 1 | |||||||||||||
| 232Th | 0.845 ** | 1 | ||||||||||||
| 40K | 0.641 ** | 0.729 ** | 1 | |||||||||||
| Raeq | 0.939 ** | 0.963 ** | 0.804 ** | 1 | ||||||||||
| D | 0.937 ** | 0.959 ** | 0.817 ** | 1.000 ** | 1 | |||||||||
| Iα | 1.000 ** | 0.845 ** | 0.641 ** | 0.939 ** | 0.937 ** | 1 | ||||||||
| Iγ | 0.931 ** | 0.962 ** | 0.822 ** | 1.000 ** | 1.000 ** | 0.931 ** | 1 | |||||||
| Hex | 0.939 ** | 0.963 ** | 0.803 ** | 1.000 ** | 1.000 ** | 0.939 ** | 0.999 ** | 1 | ||||||
| Hin | 0.969 ** | 0.941 ** | 0.765 ** | 0.995 ** | 0.994 ** | 0.969 ** | 0.992 ** | 0.995 ** | 1 | |||||
| AEDEindoor | 0.937 ** | 0.959 ** | 0.817 ** | 1.000 ** | 1.000 ** | 0.937 ** | 1.000 ** | 1.000 ** | 0.994 ** | 1 | ||||
| AEDEoutdoor | 0.937 ** | 0.959 ** | 0.817 ** | 1.000 ** | 1.000 ** | 0.937 ** | 1.000 ** | 1.000 ** | 0.994 ** | 1.000 ** | 1 | |||
| AGDE | 0.933 ** | 0.958 ** | 0.826 ** | 0.999 ** | 1.000 ** | 0.933 ** | 1.000 ** | 0.999 ** | 0.992 ** | 1.000 ** | 1.000 ** | 1 | ||
| ELCR | 0.937 ** | 0.959 ** | 0.817 ** | 1.000 ** | 1.000 ** | 0.937 ** | 1.000 ** | 1.000 ** | 0.994 ** | 1.000 ** | 1.000 ** | 1.000 ** | 1 | |
| AUI | 0.958 ** | 0.962 ** | 0.727 ** | 0.993 ** | 0.990 ** | 0.958 ** | 0.989 ** | 0.993 ** | 0.995 ** | 0.990 ** | 0.990 ** | 0.988 ** | 0.990 ** | 1 |
| Component | Initial Eigenvalues | Extraction Sums of Squared Loadings | Rotation Sums of Squared Loadings | ||||||
|---|---|---|---|---|---|---|---|---|---|
| Total | % of Variance | Cumulative % | Total | % of Variance | Cumulative % | Total | % of Variance | Cumulative % | |
| 1 | 13.321 | 95.151 | 95.151 | 13.321 | 95.151 | 95.151 | 9.079 | 64.849 | 64.849 |
| 2 | 0.489 | 3.496 | 98.647 | 0.489 | 3.496 | 98.647 | 4.732 | 33.799 | 98.647 |
| Variables | Component | |
|---|---|---|
| 1 | 2 | |
| 226Ra | 0.929 | 0.325 |
| 232Th | 0.767 | 0.569 |
| 40K | 0.332 | 0.926 |
| Raeq | 0.813 | 0.582 |
| D | 0.802 | 0.597 |
| Iα | 0.929 | 0.325 |
| Iγ | 0.794 | 0.607 |
| Hex | 0.813 | 0.582 |
| Hin | 0.858 | 0.513 |
| AEDEindoor | 0.802 | 0.597 |
| AEDEoutdoor | 0.802 | 0.597 |
| AGDE | 0.793 | 0.609 |
| ELCR | 0.802 | 0.597 |
| AUI | 0.874 | 0.483 |
| % of variance explained | 95.151 | 3.496 |
| Extraction Method: Principal Component Analysis. | ||
| Rotation Method: Varimax with Kaiser Normalization. a | ||
| Location | Specific activity (Bq kg−1) | References | |||
|---|---|---|---|---|---|
| 226Ra | 232Th | 40K | |||
| Turkey | Western and Central Sakarya Zone 1 | 119.7 | 132.1 | 1295.3 | This Study |
| World average | Granite samples | 78 | 111 | 1104 | [14] |
| Brazil | commercial 2 | 82.5 | 227 | 1109.5 | [15] |
| imported3 | 69.6 | 75.6 | 580 | [16] | |
| China | commercial 2 | 102 | 94 | 632 | [17] |
| commercial 2 | 88 | 114 | 1270 | [18] | |
| commercial 2 | 90 | 116 | 969 | [19] | |
| Cyprus | commercial 2 | 77 | 143 | 1215 | [20] |
| Egypt | South Eastern Desert 1 | 121.3 | 82.2 | 840 | [21] |
| Abu Dabbab Mine 1 | 45.8 | 29.8 | 619.7 | [22] | |
| Greece | commercial 2 | 74 | 85 | 881 | [23] |
| commercial 2 | 64 | 81 | 1104 | [25] | |
| Iran | commercial 2 | 44.5 | 77.4 | 1017.2 | [26] |
| Italy | imported 2 | 59.8 | 92.3 | 1141.2 | [27] |
| Japan | commercial 2 | 43 | 72 | 1004 | [28] |
| Jordan | Amman 1 | 41.5 | 58.4 | 497 | [29] |
| Nigeria | commercial 2 | 51.1 | 88 | 1433 | [30] |
| Palestine | commercial 2 | 71.0 | 82 | 780.8 | [31] |
| Saudi Arabia | Al Madinah 1 | 33.25 | 51.45 | 1334 | [7] |
| Spain | commercial 2 | 84 | 42 | 1138 | [32] |
| Turkey | commercial 2 | 71 | 80 | 965 | [33] |
| imported 3 | 93.4 | 124.8 | 1050 | [34] | |
| Western Anatolia | 58 | 90 | 1097 | [24] | |
| commercial 1 | 88 | 95 | 1055 | [35] | |
| Kutahya 1 | 56.4 | 25.9 | 538.4 | [36] | |
| Ezine 1 | 175 | 205 | 1172 | [54] | |
| Egrigoz 1 | 55 | 76 | 1111 | [55] | |
| commercial 2 | 61 | 60 | 851 | [36] | |
| USA | commercial 2 | 31 | 61 | 1210 | [37] |
| Yemen | Juban 1 | 54 | 127 | 1743 | [38] |
© 2020 by the authors. Licensee MDPI, Basel, Switzerland. This article is an open access article distributed under the terms and conditions of the Creative Commons Attribution (CC BY) license (http://creativecommons.org/licenses/by/4.0/).
Share and Cite
Yalcin, F.; Ilbeyli, N.; Demirbilek, M.; Yalcin, M.G.; Gunes, A.; Kaygusuz, A.; Ozmen, S.F. Estimation of Natural Radionuclides’ Concentration of the Plutonic Rocks in the Sakarya Zone, Turkey Using Multivariate Statistical Methods. Symmetry 2020, 12, 1048. https://doi.org/10.3390/sym12061048
Yalcin F, Ilbeyli N, Demirbilek M, Yalcin MG, Gunes A, Kaygusuz A, Ozmen SF. Estimation of Natural Radionuclides’ Concentration of the Plutonic Rocks in the Sakarya Zone, Turkey Using Multivariate Statistical Methods. Symmetry. 2020; 12(6):1048. https://doi.org/10.3390/sym12061048
Chicago/Turabian StyleYalcin, Fusun, Nurdane Ilbeyli, Mehmet Demirbilek, Mustafa Gurhan Yalcin, Alper Gunes, Abdullah Kaygusuz, and Suleyman Fatih Ozmen. 2020. "Estimation of Natural Radionuclides’ Concentration of the Plutonic Rocks in the Sakarya Zone, Turkey Using Multivariate Statistical Methods" Symmetry 12, no. 6: 1048. https://doi.org/10.3390/sym12061048