Cloud-Model-Based Method for Risk Assessment of Mountain Torrent Disasters


1
Research Center on Mountain Torrent and Geologic Disaster Prevention of MWR, Changjiang River Scientific Research Institute, 23 Huangpu Road, Wuhan 430010, China
2
College of Hydropower and Information Engineering, HuaZhong University of Science and Technology, Wuhan 430074, China
*
Author to whom correspondence should be addressed.
Water 2018, 10(7), 830; https://doi.org/10.3390/w10070830
Submission received: 21 May 2018
/
Revised: 19 June 2018
/
Accepted: 20 June 2018
/
Published: 23 June 2018
(This article belongs to the Section Water Resources Management, Policy and Governance)
Abstract
:Mountain torrent disasters are common natural hazards that occur in mountainous terrains. The risk assessment of mountain torrent disasters entails a multi-criteria decision-making process and involves a transformation between qualitative and quantitative uncertainties. By incorporating probability statistics and fuzzy set theories, cloud model derived from information science, can aid the required transformation between the qualitative concepts and quantitative data. A cloud model-based approach has thus been proposed for practical risk assessment of mountain torrent disasters. The hybrid weighting method comprising the analytic hierarchy process (AHP) and entropy was employed for determining the weights of the indicators in the multi-criteria decision-making process. The degree of certainty associated with a particular risk level can be calculated through repeated assessments by employing the normal cloud model. The proposed approach was validated by comparing with the actual situation. The obtained results demonstrate that the cloud-model-based method is capable of indicating the risk level of mountain torrent disasters, as well as signifying the relative probability of risk at the same level. The proposed study provides guidelines for future risk management of basin floods and extends the scope of present risk-evaluation methods. Thus, the proposed study can be helpful in the precaution of mountain torrent hazards.
1. Introduction
A mountain torrent disaster is one of the most frequent and severe natural disasters worldwide. It generally occurs in mountainous terrain with flash flood, can cause severe economic losses and casualties, and pose a great threat to human lives and property [1].
In the face of such frequent natural disasters, minimizing people’s losses has become the primary issue. Risk analysis has received increasing attention as a non-engineering measure for mountain torrent prevention and mitigation [2,3,4]. It can aid the authorities in addressing natural disasters, i.e., a shift from passive resistance to active evasion. The risk assessment of mountain torrents considers numerous factors, which have multiple sources and different spatiotemporal scales. This fairly increases the challenge in assessment.
Two types of uncertainties should be considered in the risk assessment of mountain torrent disasters: (1) randomness, which is generally exhibited in the observed data of related factors and (2) fuzziness, which is embodied in the mutual influence of the factors [5]. Various methods have been proposed to address the above uncertainties in the risk assessment of mountain torrent disasters, e.g., a principal component analysis method based on statistical and stochastic theories, and a fuzzy assessment method based on fuzzy set theory [6,7]. However, most of these are single random or fuzzy type models. A coupled model incorporating both randomness and fuzziness is required.
A cloud model is a comprehensive model that considers randomness with fuzziness; it was developed by Li in 1995 [8]. In statistical mathematics, the uncertainty of random phenomena can be modeled using a probability distribution. In fuzzy mathematics, the uncertainty of membership associated with a fuzzy concept is generally modeled by a membership function. The cloud model can model randomness and fuzziness uncertainties with three fixed parameters, and transform between qualitative concepts and quantitative data, and vice versa, with forward and backward cloud models [9]. It should be noted that the cloud model is completely different from cloud computing, which is an Internet-based service mode. After over 20 years of development, the cloud model is widely used in numerous fields including intelligent control [10], decision support [11], water quality assessment [12], hydraulic conductivity estimation [13], etc. [14]. The main objective of this study is to develop an approach based on cloud model for the risk assessment of mountain torrent disasters because randomness and fuzziness are inherent in their risk assessment.
The risk assessment of mountain torrent disasters is a kind of multi-criteria decision-making analysis [15]. Each factor in the assessment exerts a different influence, which introduces the issue of weight assignments. Present studies, primarily include two types of weight-determination methods: subjective and objective [16]. Subjective weighting methods rely on the subjective experience of decision makers to allocate weights to factors. The commonly-used methods include the analytic hierarchy process (AHP) method and pair-wise comparison method [17,18]. The objective weighting methods rely entirely on the differences in the sample data. A factor with a large difference will be assigned a correspondingly large weight. Entropy is the most popular method and has been widely applied to water resources and ecological environment assessments [19,20].
In this study, a hybrid weighting method incorporating AHP and the entropy method is employed to determine a reasonable set of weights of the factors. This can compensate for the reliance on human judgment in the subjective weighting method and the lack of consideration of the importance of the factors in the objective weighting method [21].
Therefore, the objective of this study entails the establishment of a risk assessment index system, data preprocessing, AHP-entropy-based weight determination, and a cloud-model-based comprehensive evaluation of mountain torrent disaster risks. It is expected that the potential risk of mountain torrent disasters in the study area can be effectively evaluated and revealed, and can provide guideline for future risk management of basin floods.
2. Study Area and Dataset
2.1. Study Area
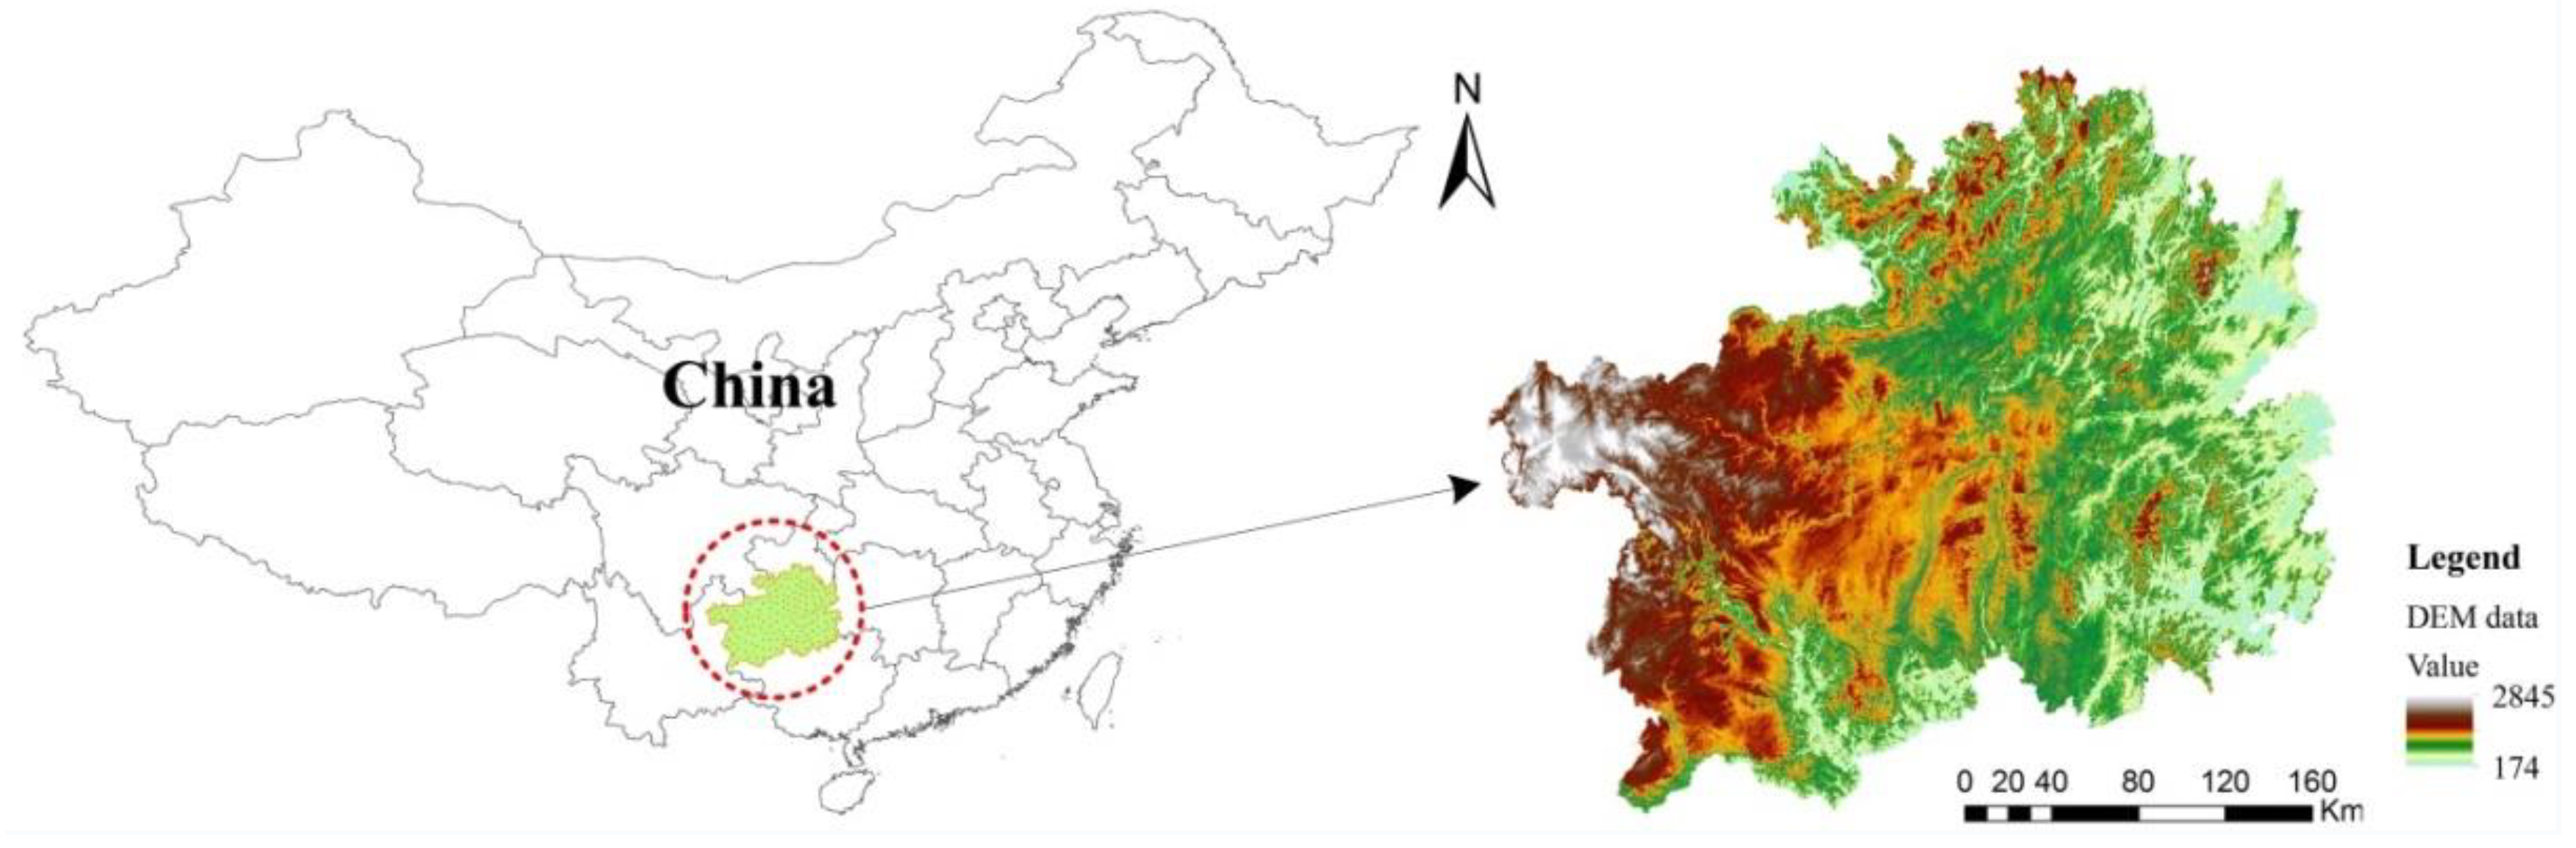
Guizhou is a typical mountainous province located in southwest China, within the geographical range of 24°37′ N–29°13′ N and 103°36′ E–109°35′ E. It is situated on the slope of the Yunnan-Guizhou plateau. Owing to its extraordinary natural conditions, e.g., well-developed river networks, undulating terrain, low forest coverage, and high annual rainfall, mountain torrent disasters occur frequently. The study area is shown in Figure 1.
2.2. Risk Index System for Mountain Torrent Disaster Assessment
Mountain torrent disasters are complex and affected by several factors including nature, society, and the economy. Its influence factors can be summarized as hazard and vulnerability. The hazard can be divided into disaster-inducing factors and a disaster-pregnant environment. The vulnerability involves the disaster-bearing body. The disaster-inducing factors generally refer to the precipitation. The disaster-pregnant environment refers to the terrain-surface conditions, mainly including the topography, river network, soil, and vegetation. The disaster-bearing body primarily refers to the socio-economic conditions.
Considering the characteristics of mountain torrents in southwest China, this study selected eight typical indices—namely, the annual average rainfall (u1), annual maximum 6-h heavy rainfall (u2), annual maximum 60-min heavy rainfall (u3), river network density (u4), vegetation index (u5), topographic relief (u6), population density (u7), and gross domestic product (GDP) density (u8)—to establish a comprehensive risk-evaluation index system for mountain torrent disasters (Table 1).
As shown in Table 1, the index system comprises three layers: the target layer, intermediate layer, and index layer. The target layer is the assessment of the mountain torrent disaster risk. The intermediate layer includes the hazard and vulnerability. The index layer contains eight indices. The evaluation cases, not listed in Table 1, incorporate nine cities or autonomous prefecture-administrative units of Guizhou province: Zunyi City, Tongren City, and Bijie City, the autonomous prefecture (AP) of southeast Guizhou, the AP of south Guizhou, Guiyang City, Liupanshui City, Anshun City, and the AP of southwest Guizhou.
2.3. Dataset
2.3.1. Data Resources
A multi-source dataset of Guizhou province was collected based on a previous index system. The Advanced Spaceborne Thermal Emission and Reflection Radiometer (ASTER) global digital elevation model (GDEM) data, with a spatial resolution of 30 m, was used as the digital elevation model data. It can be freely obtained from its official website (http://gdem.ersdac.jspacesystems.or.jp /download.jsp). The 6-h and 60-min extreme heavy rain thematic maps of JPG formats and 200-dpi resolution were provided by the Water Resources Research Institute of Guizhou Province. The datasets for the administrative boundary, annual average rainfall, river network, vegetation index, population density, and GDP density were provided by the Data Center for Resources and Environmental Sciences, Chinese Academy of Sciences (RESDC) (http://www.resdc.cn). Further specifications about the multi-source data employed in this study are shown in Table 2.
2.3.2. Data Preprocessing
First, all the collected data were projected into the same coordinate system, Krasovsky_1940_Albers. Then, all these data were further processed and resampled into raster data with a 1000-m resolution. Detailed information about the data preprocessing follows:
• Indices u1, u5, u7, and u8
The required data for u1, u5, u7, and u8, were directly extracted from the collected raster data of China region according to the Guizhou administrative boundary. The original resolution of u1 was 500 m; it was resampled to the 1000-m resolution. Subsequently, the mean index values within each city or AP were counted using the Arc/Info software spatial-statistics tools.
• Indices u2 and u3
The original data of u2 and u3 were pictures and did not contain spatial references. First, they were geo-referenced and vectorized. Then, the vectorized contours were processed into a large number of points. Based on these point layers, the raster layers of the 6-h and 60-min data with 1000-m resolution were acquired using the spline spatial interpolation method.
• Index u4
The river network density was defined as the length of the river per unit area in a basin, which is expressed as Equation (1):
where is the density of the river network (m/km2) and L and A are the total length and area, respectively, of a certain region.
Based on the feature layers of the river network and the administrative boundaries, the river lengths within the cities were calculated. The corresponding river-network densities were counted and stored in a new field of the administrative-boundary feature layer, which was converted and resampled into a raster layer with a resolution equal to that of the other indices.
• Index u6
Index u6, the topographic relief, involves the difference between the maximum and minimum elevation in a particular area. It is an essential indicator that quantitatively describes the topographic features and landform type. The neighborhood analysis method was adopted to extract the topographic relief of the study area, which can be expressed by the following equation:
where is the region topographic relief; and represent the maximum and minimum elevations, respectively, of the region; and n is the number of grid cells.
The analysis radius value is crucial to the result of the topographic relief. A small analysis radius will generate relatively flat terrain and a minor topographic relief value. As the radius increases, the topographic relief value increases accordingly, to a certain extent. Subsequently, the topographical relief value does not change correspondingly. The statistics-based mean change-point theory was employed to determine the appropriate radius so as to reflect the true terrain fluctuation. The calculation tests of the mean topographic reliefs under different grids from to were performed using the Arc/Info software (Environmental Systems Research Institute, Redlands, California, USA). The results demonstrated that the optimal grid size was , with a corresponding area of m2. On this basis, the final topographic relief within Guizhou province could be calculated and resampled into the 1000-m resolution.
The spatial distributions of the eight indices are shown in Figure 2.
3. Methodology and Basic Theory
3.1. Hybrid Entropy–AHP Weight-Calculation Method
3.1.1. AHP Method
The AHP method, as a subjective weighting approach, was first proposed by T. L. Satty in the 1970s [22]. It expresses and processes subjective human judgments in quantitative terms. It is widely used in multi-criteria decision-making. The fundamental principle of AHP is the hierarchical analysis of complex issues. First, the complex issues are decomposed into different components and levels, forming a multi-level analysis index system. On this basis, the relative importance of any two indices at the same level is compared and scored using the importance scale. Then, two-by-two comparison matrixes can be constructed. Subsequently, the relative importance of each indicator is sorted and normalized to obtain the final weight of each indicator.
The AHP-based method can be summarized as four steps: (1) establishment of hierarchical-analysis model; (2) two-by-two comparison matrix construction; (3) weight calculation; and (4) consistency verification.
1. Establish a hierarchical-analysis structure model
First, the components should be identified, including the evaluation issues of range, target and object. Then, a hierarchical model with several levels can be constructed. The highest level corresponds to the target layer, which represents the evaluation objective. The lowest layer corresponds to the indicator layer, which contains several indices.
2. Construct the two-by-two comparison matrix
After establishing the hierarchical model, the affiliation relationship between the layers can be determined. Next, we can analyze and compare any two factors within each layer. The factors are ranked and assigned a quantified value according to their relative importance. The 1–9 scale is widely used to denote the importance of each factor. A larger number represents a more important factor. Then, the two-by-two comparison matrix R can be constructed.
3. Calculate the weights
Based on the two-by-two comparison matrix R, the factors weights can be calculated. According to the matrix operation knowledge, the weight coefficient of each factor can be regarded as the eigenvector of R, which corresponds to the maximum eigenvalue, [23]. The weight coefficient vector, w, can be solved and acquired with the following equation:
4. Verify the consistency
Conflicting conclusions are likely while comparing two indicators within a layer. For example, when comparing the importance of factors a, b, and c, the two-by-two comparison may result in a being more important than b, b being more important than c, and c being more important than a. Thus, to ensure a reasonable judgment conclusion, the consistency of the comparison matrix should be verified, as summarized below:
Step 1: Calculate the consistency indicator (CI).
where n is the dimension of R.
Step 2: Look for the average random indicator (RI) according to the comparison-matrix dimensions listed in Table 3.
Step 3: Calculate the consistency ratio (CR).
It is generally accepted that when CR is less than 0.1, the constructed comparison matrix is completely consistent. Otherwise, the assigned values of the matrix elements should be adjusted until CR is less than 0.1.
3.1.2. Entropy Weighting Method
The concept of entropy is derived from thermodynamics [24]. In modern information theory, entropy is a quantitative measurement of uncertainty or disorder. It is proportional to the degree of uncertainty; i.e., high uncertainty corresponds to high entropy. The entropy-based weight method is an objective weight-calculation approach based on the entropy principle. Here, the weights are determined completely by the differences in the observed data.
The general procedure of entropy-based weight calculation includes: (1) the standardization of the observed data; (2) entropy calculation of each index; and (3) entropy-based weight determination. The entropy can be calculated with the following equations:
where and represent the entropy and the entropy-based weight, respectively, of the ith index; n is the number of evaluation cases; m is the number of evaluation indices; is the standardized value of the jth case under the ith index; and represents the frequency of the jth case under the ith index. If , . Then, the entropy-based weight can be calculated as in [25]:
where represents the weight of the ith index, and .
3.1.3. Hybrid-Weight Calculation Method
The hybrid-weight calculation method multiplies and normalizes the AHP-based and entropy-based weights. It can attain more effective index weights considering the objective differences among the indices as well as considering the importance of the indicators. The hybrid weight can be calculated with the following equation:
where , , and represent the hybrid, AHP-based, and entropy-based weights, respectively, of the ith index.
Finally, the hybrid weight vector can be obtained as follows: .
3.2. Cloud Model
3.2.1. Basic Theory
A cloud model, derived from information science, is a modern mathematical theory that specializes in the study of complex uncertainties, which are based on probability statistics and fuzzy set theories [26]. In the cloud model, the membership cloud yields the membership function, which compensates the shortcoming in the fuzzy set theory that uses qualitative reasoning methods to approximately assign a specified membership function. It is composed of numerous cloud droplets. Each cloud droplet represents the quantitative performance of a qualitative concept.
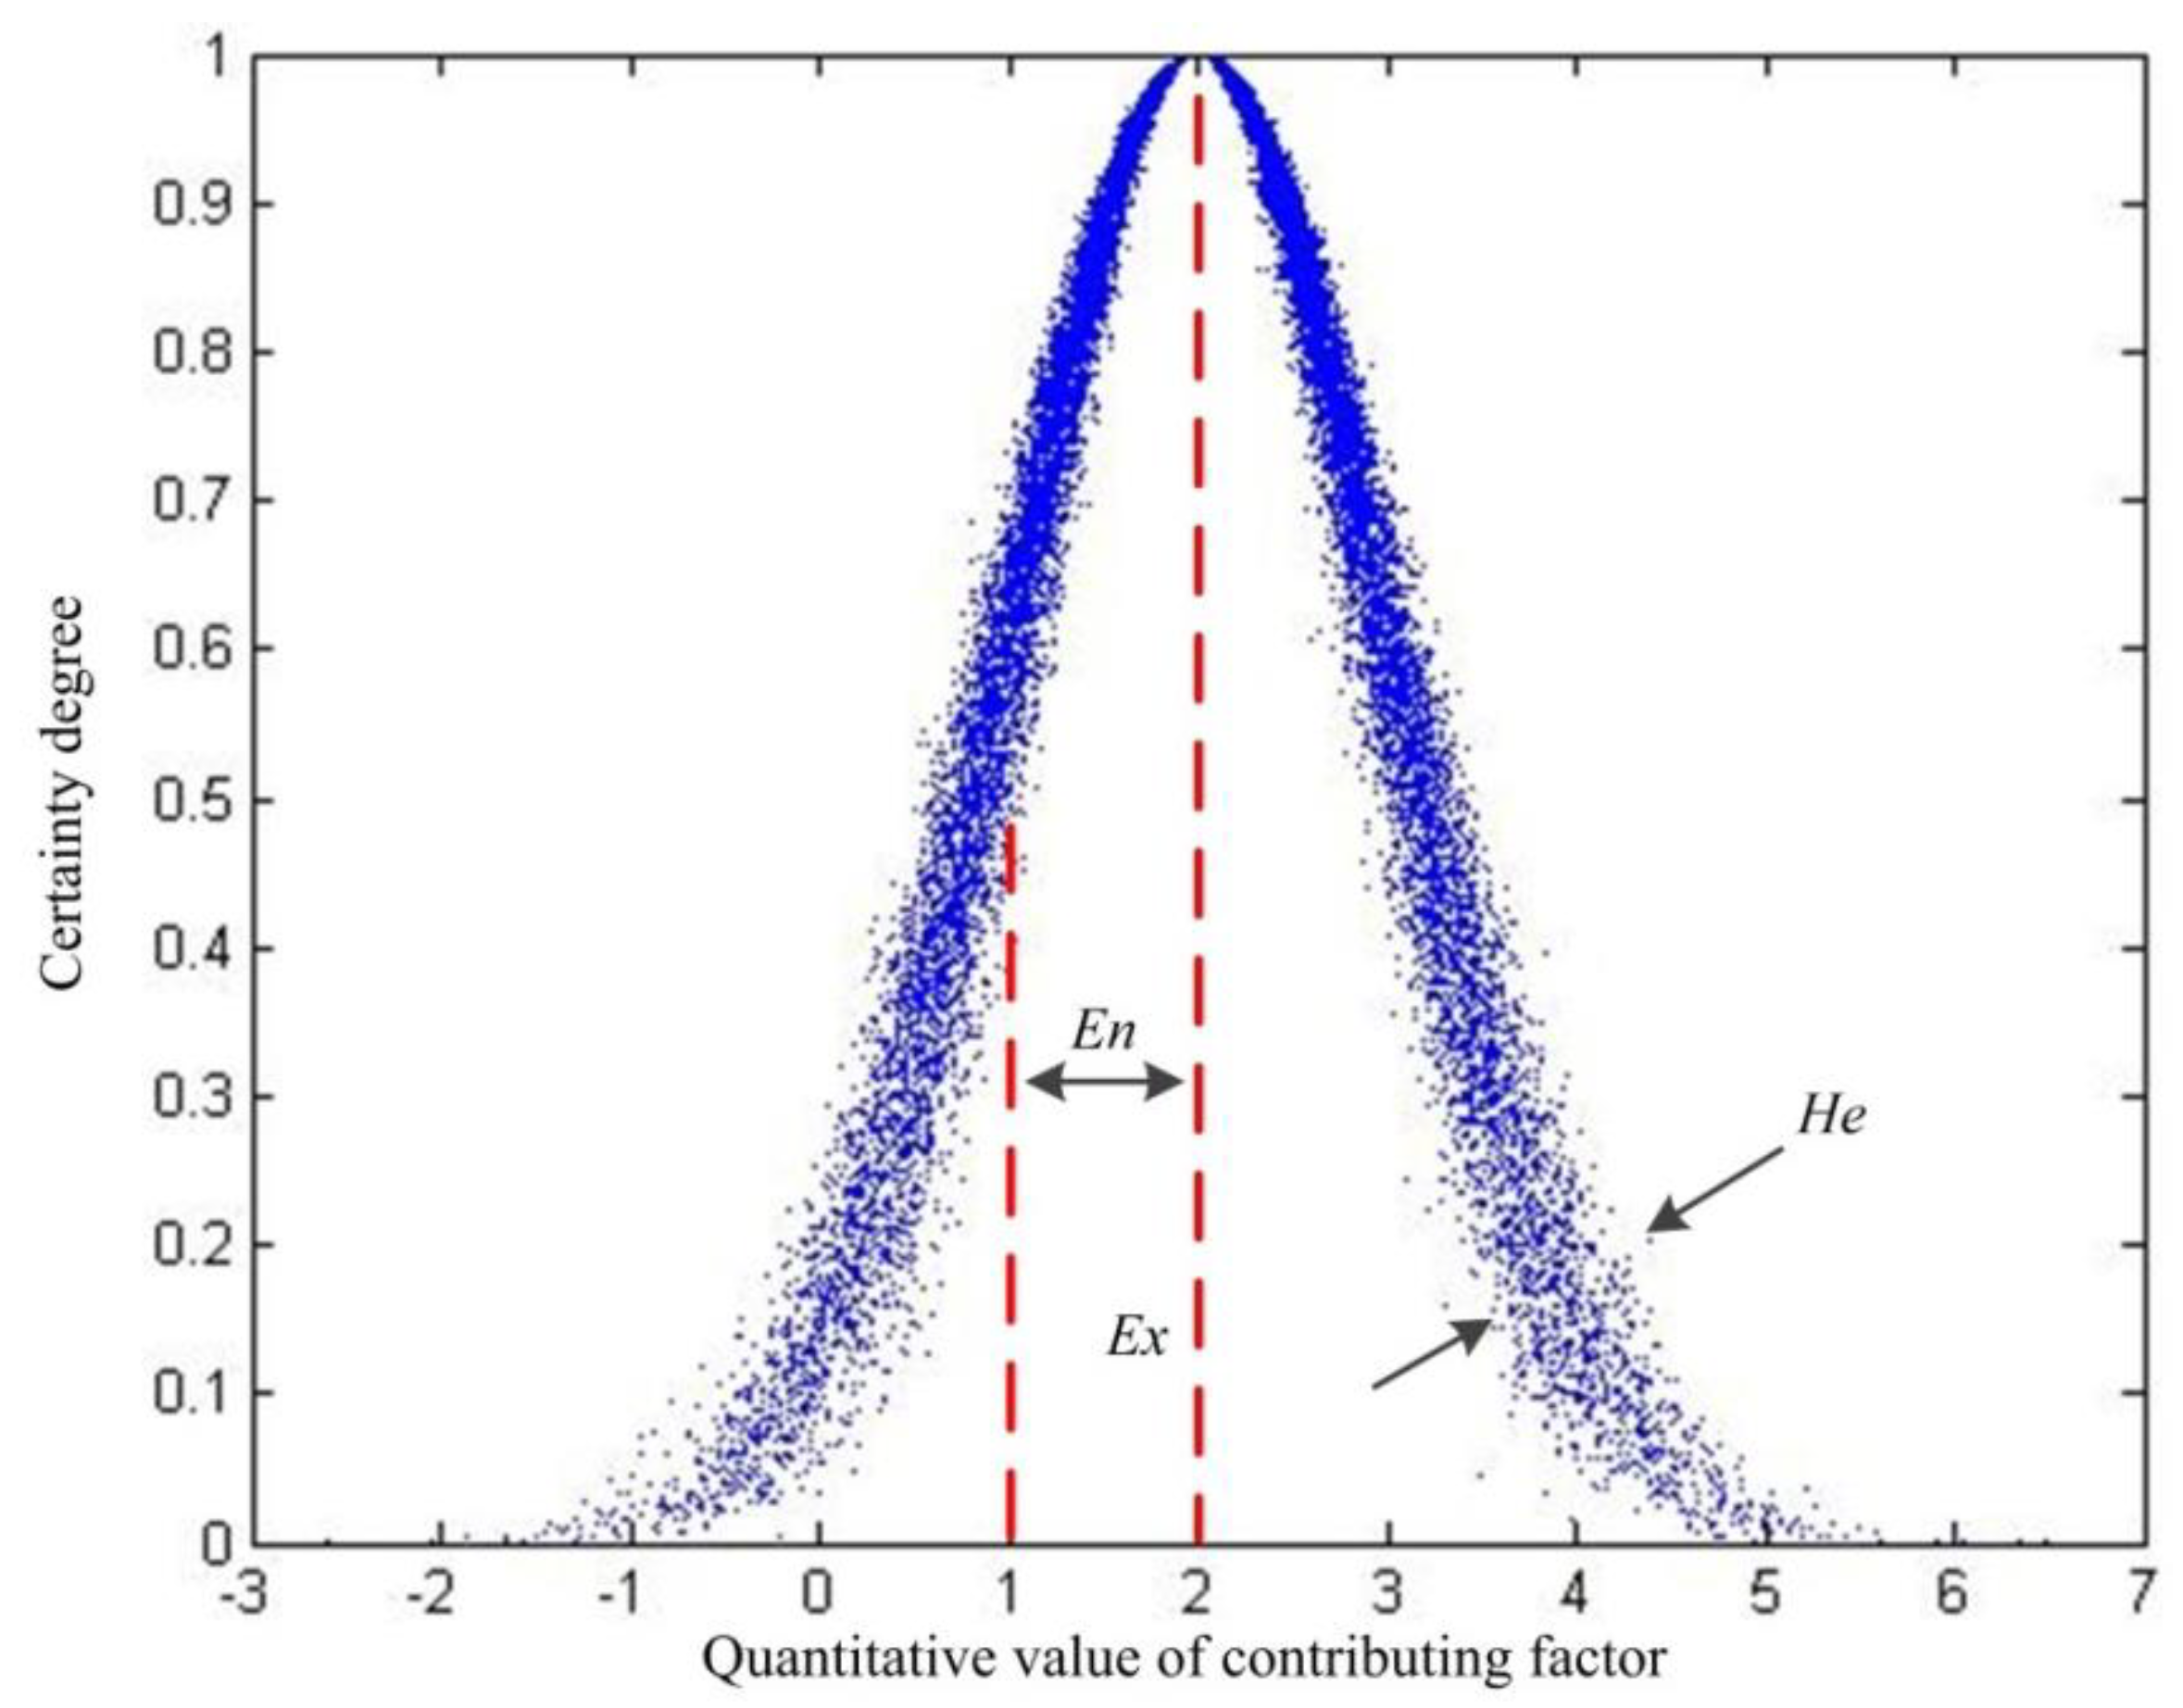
The cloud model mainly contains three parameters: the expected value (Ex), entropy (En), and hyper entropy (He). The model can be expressed as (Ex, En, He). The implications of the three parameters are illustrated below:
- Ex refers to the expectation of the cloud droplets, which is the central value in the universe of the qualitative concept.
- En is the uncertainty measurement of the qualitative concept, which is codetermined by the randomness and fuzziness of the concept.
- He is the uncertainty measurement of En, i.e., the entropy of En. It reflects the discrete degree of the cloud droplets. A larger He value represents a higher cloud dispersion, and the corresponding cloud will be thicker.
At present, the normal cloud model is the most popular in applications [27].
Assume that C is a qualitative concept in a quantitative universe U, and variable x is a random implementation of C. Note that x satisfies the normal distribution, , and . Then, the certainty degree of x to C, , can be expressed by the following equation:
The normal cloud model, (2, 1, 0.1) is demonstrated in Figure 3, in which the x-axis represents the quantitative value of the contributing factor and the y-axis represents the certainty degree. All the cloud models in this study are based on the normal model.
3.2.2. Parameter Determination
Note that factor i corresponds to level j, and the upper and lower boundary values of the level are and , respectively. The parameter can be calculated as described in [28]:
The boundary value generally belongs to two adjacent levels. It indicates that the membership degrees of the two levels at the boundary point are equal. Hence, the parameter can be deduced as follows:
Parameter is a constant and has a linear relationship with ; it is expressed as described in [29]:
where k is a coefficient assumed to be 0.1. The value of k can be adjusted according to the practical cloud discrete degree to ensure that the cloud thickness is appropriate.
3.2.3. Cloud Generator
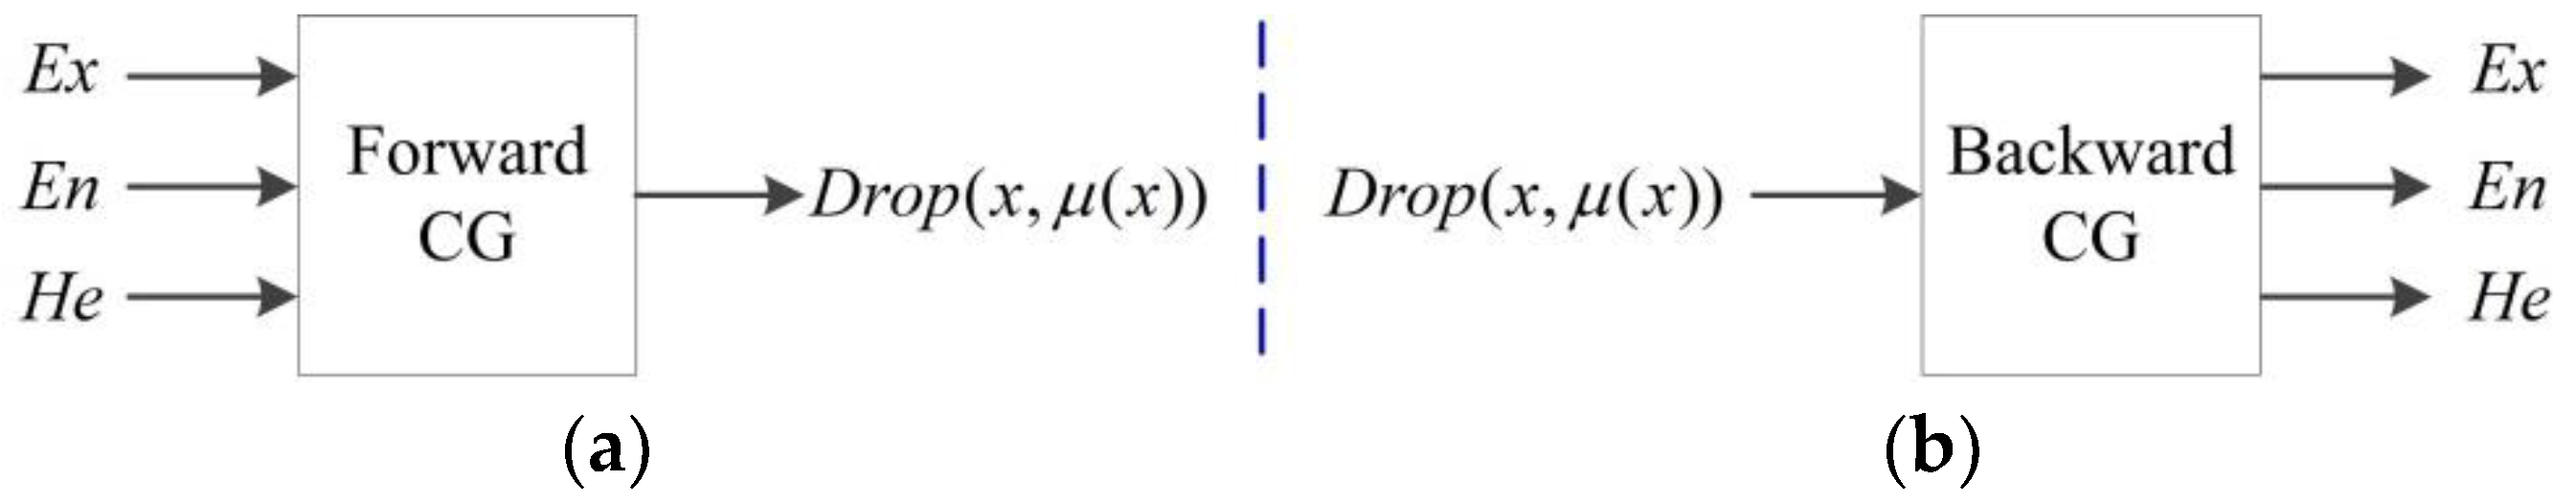
The cloud generator (CG) primarily includes two types of generators—forward and backward, as shown in Figure 4.
The forward CG involves mapping from qualitative to quantitative, which generates a number of cloud droplets based on (Ex, En, He). It is a direct forward process. Conversely, the backward CG transforms from quantitative to qualitative. It can convert precise data into the qualitative concept represented by (Ex, En, He). Because the forward CG will be used in the following context, its algorithm is described as follows [30]:
- Input: Parameters Ex, En, and He; and the number of cloud droplets to be generated, N.
- Output: Quantitative values of N cloud droplets and their corresponding certainty degrees.
Algorithm steps:
- Step 1
- Generate a random number that satisfies the normal distribution, ;
- Step 2
- Generate a random number that satisfies the normal distribution, ;
- Step 3
- Calculate the certainty degree of x, ;
- Step 4
- Repeat steps 1 to 3 until N cloud droplets are generated.
4. Results and Discussion
4.1. Weight Calculation
4.1.1. AHP-Based Weight Calculation
As mentioned in Section 2.2, the risk index system of mountain torrent disaster is divided into three layers. First, the two-by-two comparison matrixes of the intermediate layer and the index layer, with reasonable consistency, are constructed. Then, the corresponding weights can be calculated.
For example, take the matrix construction and weight calculation of the intermediate layer. First, compare the relative importance of the indices in the intermediate layer, and construct a two-by-two comparison matrix. Next, verify the consistency of the matrix. The result is that = 2, CI = 0, and CR = 0 < 0.1. Thus, the constructed matrix satisfies the consistency requirement and is acceptable. Finally, the weights of the indices in the intermediate layer can be calculated, as presented in Table 4.
The weight calculation of the other indices based on AHP can be calculated following the previous steps. The results are presented in Table 5 and Table 6.
The ultimate weight of each index for the risk assessment of a mountain torrent disaster is presented in Table 7.
4.1.2. Entropy-Based Weight Calculation
First, the observed data are standardized using the entropy-based weight-calculation procedures mentioned in Section 3.1.2; then, the dimensionless data of Guizhou province can be obtained (Table 8), including those of the cities and APs.
With Equations (6)–(8), m = 8, and n = 9, the entropy and entropy-based weight of each index can be calculated (Table 9).
4.1.3. Hybrid Weight Calculation
After acquiring the AHP-based weight and entropy-based weight, the AHP-entropy hybrid weight of each index can be attained with Equation (9), as presented in Table 10.
4.2. Evaluation Criteria Determination
Based on the risk index system, the universe of evaluation factors can be constructed as follows: . The determination of the evaluation criteria is critical to the risk assessment of mountain torrent disaster. Referring to the guidelines for mountain torrent disaster prevention, the evaluation criteria of each factor are divided into five levels: very low risk, low risk, medium risk, high risk, and very high risk. Thus, the assessment universe can be established as follows: .
To clearly reflect the risk distribution of mountain torrent hazards in Guizhou province, this study employs a normal distribution method to determine the classification threshold of each index. The method uses the normal distribution principle to predetermine the percentage of each level in the total, which are 10%, 20%, 40%, 20%, and 10%, respectively. The raster data of each index is classified into five grades, as presented in Table 11.
Based on the index criteria, and considering the parameter determination rules mentioned in Section 3.2.2, the parameters of the cloud models (Ex, En, He) of the eight indices at the different risk assessment levels can be attained (Table 12).
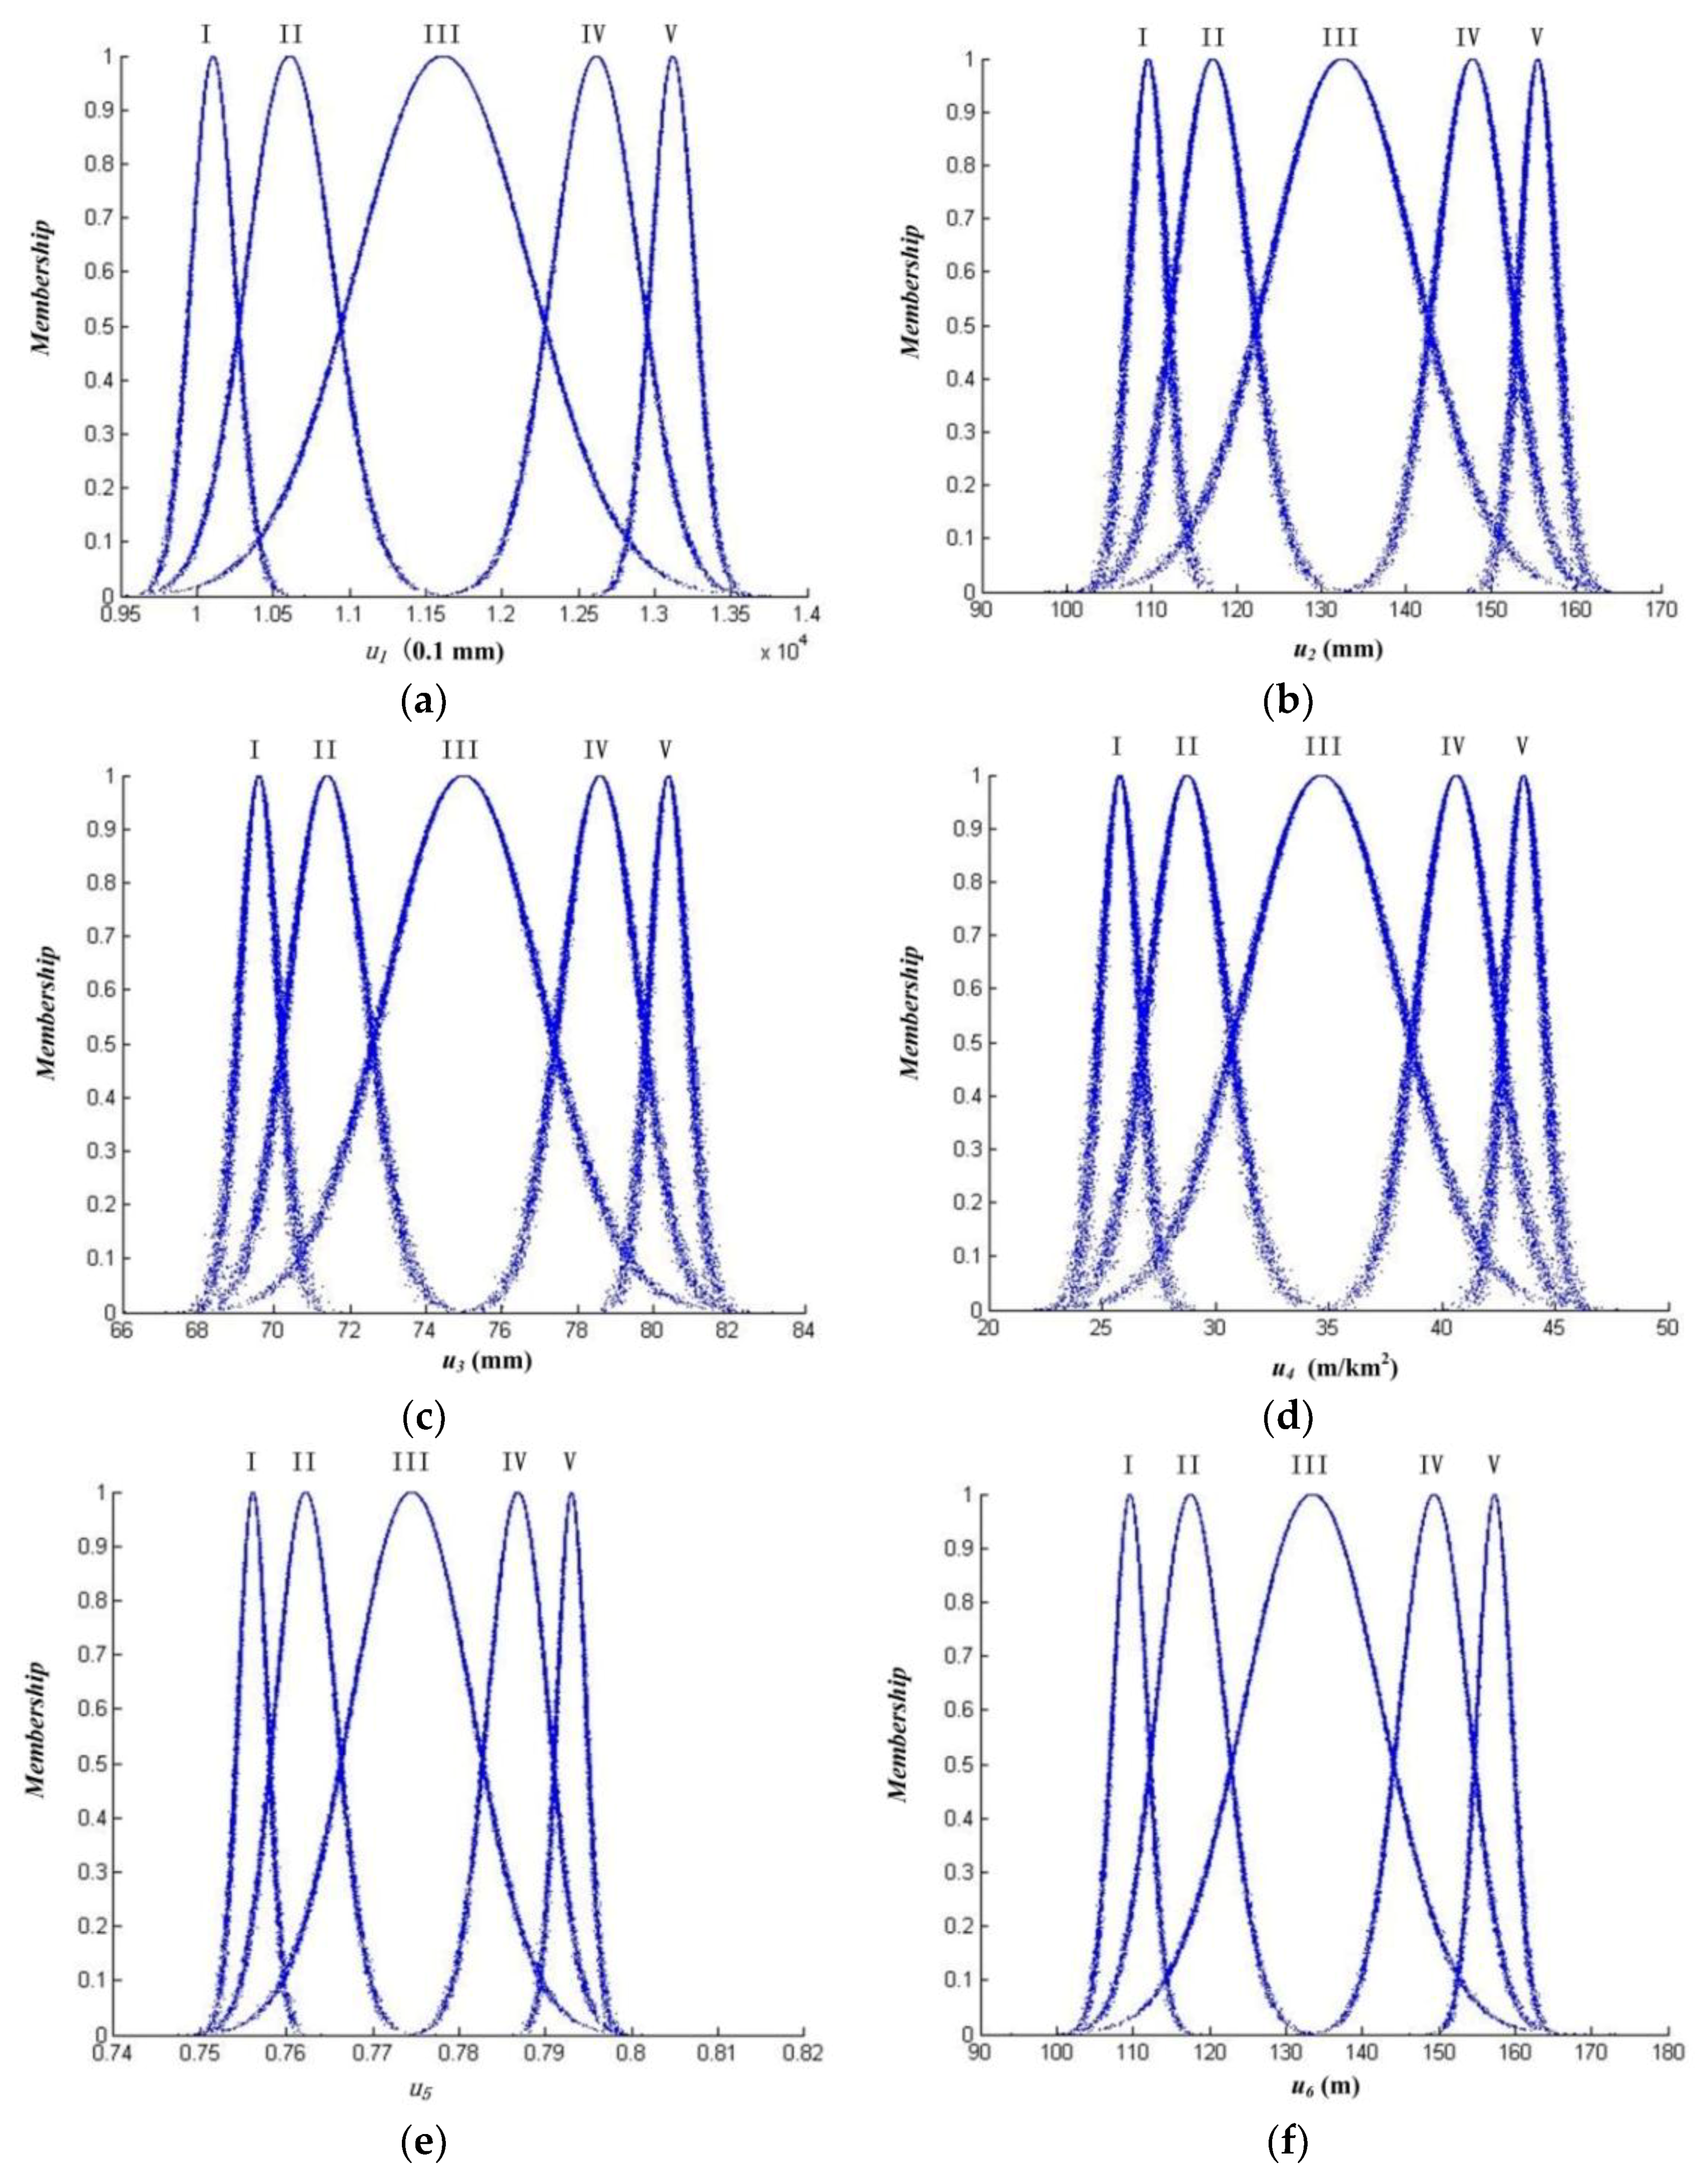
The above cloud-model parameters can be regarded as the input of the forward normal cloud model generator. Then, the quantitative values of the cloud droplets and the relationship between the membership degree and the index value can be attained.
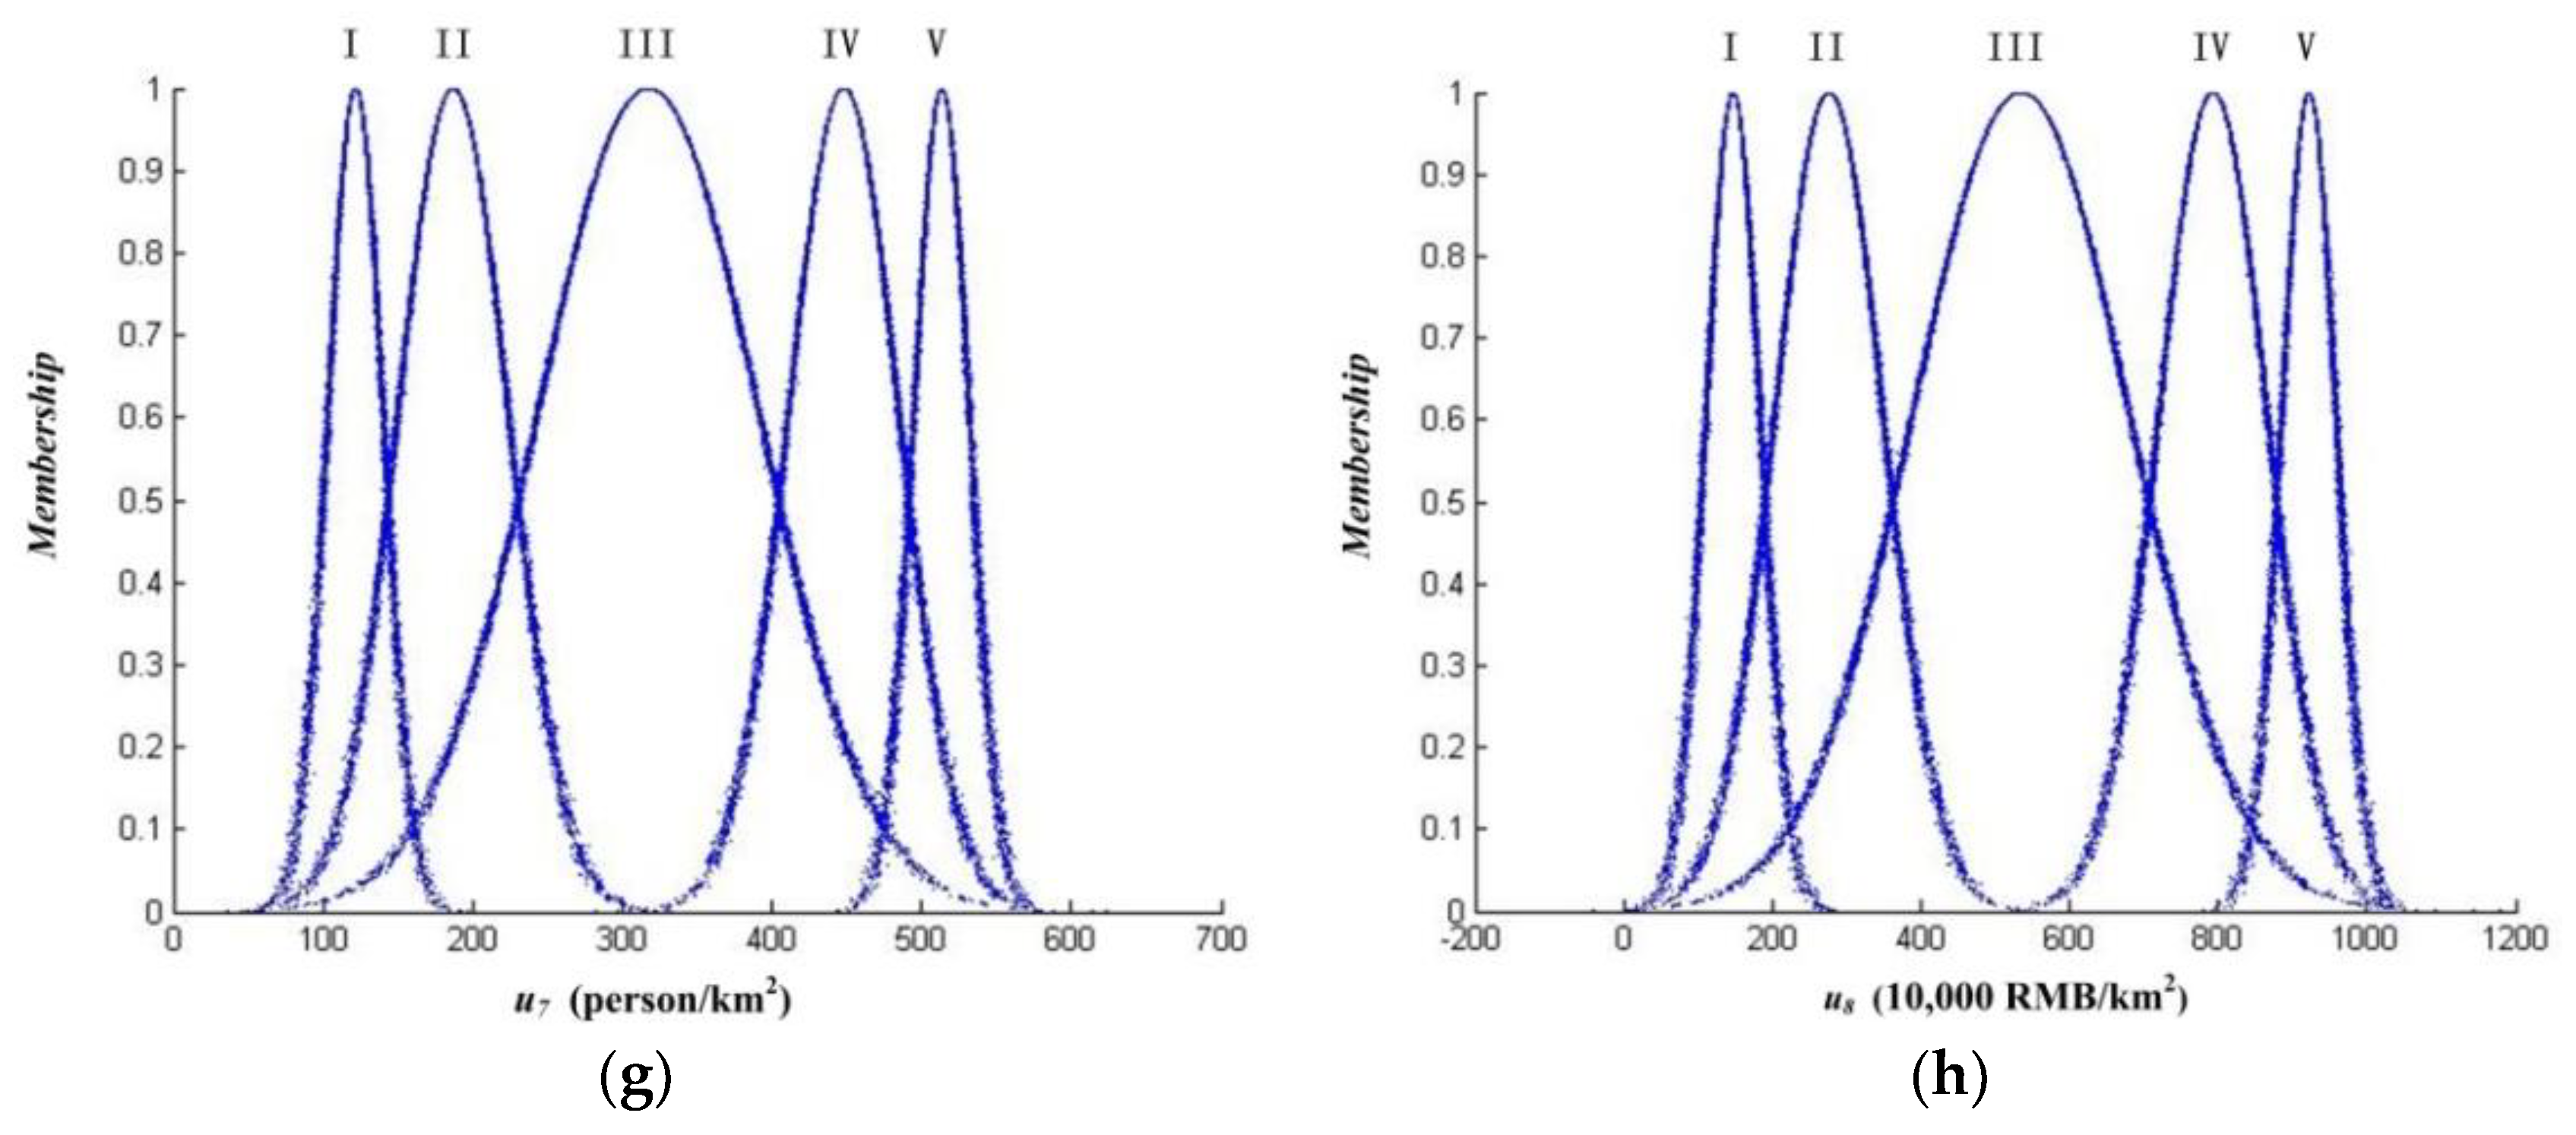
Figure 5 shows the expressions of the cloud models for the eight indices. The curves from the left to the right in each figure represent the very low risk level, low risk level, medium risk level, high risk level, and very high risk level, respectively. Moreover, the graphs also display the characteristics of the normal distribution of the cloud-model-based membership function.
4.3. Cloud Model-Based Certainty Degree Recognition
Using the algorithm of the forward normal cloud-model generator mentioned in Section 3.2.3, the certainty degree associated with a particular risk level is calculated through 2000 repeated assessments, and the average value is adopted. The certainty degrees associated with the different risk levels of Zunyi City and Tongren City are presented in Table 13 and Table 14. The certainty degrees of the other cases in Guizhou province can be similarly obtained, as presented in Table 15, Table 16, Table 17, Table 18, Table 19, Table 20 and Table 21.
4.4. Comprehensive Evaluation
As shown in Table 10, the weight vector can be described as: . To avoid having a large degree of certainty “eat” a smaller one in the comprehensive-evaluation process, the above certainty-degree matrixes should be normalized before the final evaluation. Then, the sum of each row in the normalized matrix is equal to one; i.e., . The original proportional relationship of the certainty degrees among the levels is preserved. The comprehensive evaluation can be performed using the following equation:
where G is the comprehensive evaluation vector with five elements; and represents the normalized certainty-degree matrix.
Finally, according to the maximum degree of the membership principle, the level with the largest certainty-degree is selected as the ultimate risk-evaluation grade for a mountain torrent disaster in Guizhou province, as presented in Table 22.
As shown in Table 22, the risk grade of each case can be generally classified by five status levels from low to high. The risk levels of Guiyang City and Anshun City are very high because of their low topographies, high river-network densities, as well as high rainfalls in the flood seasons.
For instance, the river network density in Guiyang City is as high as 44.59 m/km2, and the mean value of the annual maximum 6-h heavy rainfall in Anshun City is up to 80.7 mm. Both values are the highest for Guizhou province. Hence, the hazard from the disaster-inducing factor and the disaster-pregnant environment is high. Moreover, the two cities have relatively developed economies, high population density, and high GDP, which result in high vulnerability of the disaster-bearing body. Therefore, the risk levels are the highest for all the cases in the study.
The level of the AP of south Guizhou is IV. The evaluation results of Zunyi City, Tongren City, Bijie City, and Liupanshui City are of medium risk level. The levels of the APs of southwest and southeast Guizhou are II and I, respectively.
Furthermore, the assessment results are accompanied by the degree of certainty associated with a particular level, which provides more detailed information than a simple final risk grade. For example, although the final risk grades of Guiyang City and Anshun City are V, the certainty degree of Guiyang (0.434) is higher than that of Anshun City (0.294), which demonstrates that the risk level of Guiyang City is more likely to be V than that of Anshun City is. Another example involves Zunyi City, Tongren City, Bijie City, and Liupanshui City, all of whose level is III; the certainty degree of Tongren City is 0.635, significantly higher than those of the others. This indicates that the risk for Tongren City is more severe than those for the other three cities with an identical risk level.
The validity of the proposed cloud-model-based approach was practically verified by comparing with the actual situation of mountain torrent disasters in Guizhou province. They are more or less consistent. Guiyang City and Anshun City are located in the transitional zone between the Wumeng and Miaoling mountains, with plenty of karst landforms and a large disparity in altitude. Rocky desertification and soil erosion are equally severe. As a result, disasters, e.g., flash floods, landslides, and mudslides, are frequent. The AP of south Guizhou, Liupanshui City, Zunyi City, Tongren City, and Bijie City frequently experience heavy rainstorms and floods; these are particularly frequent in the flood seasons. Moreover, Tongren City is more prone to mountain torrents compared with the remaining cities [31]. Thus, it is evident that the proposed approach shows the risk level accurately also reveals the relative probability of risk at the same level.
5. Conclusions
A cloud model-based approach was proposed for the practical risk assessment of mountain torrent disasters in Guizhou province in China, considering different types of uncertainties in the risk assessment. A normal cloud model was employed to calculate the degrees of certainty of different cases based on the processed spatial data of Guizhou province. The outcomes produced by the proposed approach were validated by comparing with the actual situation. It was determined that the proposed method was effective for practical work. Moreover, the evaluation outcomes revealed the relative probability of risk at the same level, providing more detailed information for decision makers. We concluded that the cloud-model-based approach could accurately and effectively demonstrate the risk level of mountain torrent disasters.
This approach provides a new guideline for future risk management of basin floods and also extends the scope of present risk-evaluation methods. As an effective non-engineering measure, it will have broad prospects in mountain-torrent hazard prevention and land-use planning in different risk zones in the future.
Author Contributions
B.C. and S.Y. conceived the study; S.Y. and X.H. performed the experiments; S.Y., X.H., B.C., B.L., and F.Y. wrote the paper.
Acknowledgments
The authors would like to appreciate the financial supports for this study from the National Natural Science Foundation of China (51509007, 51409021, and 51379023), the Science and Technology Special Fund Project of Guizhou Provincial Water Resources Department (KT201604), the National Key R&D Program of China (2017YFC1502500 and 2016YFC0802500), and the Fundamental Research Funds for Central Public Welfare Research Institutes (Grant No. CKSF 2016033/GC).
Conflicts of Interest
The authors declare no conflict of interest.
References
- Korup, O.; Clague, J.J. Natural hazards, extreme events, and mountain topography. Quat. Sci. Rev. 2009, 28, 977–990. [Google Scholar] [CrossRef]
- Guzzetti, A. Landslide hazard evaluation: A review of current techniques and their application in a multi-scale study, Central Italy. Geomorphology 1999, 31, 181–216. [Google Scholar] [CrossRef]
- Bombino, G.; Boixfayos, C.; Gurnell, A.M.; Tamburino, V.; Zema, D.A.; Zimbone, S.M. Check dam influence on vegetation species diversity in mountain torrents of the mediterranean environment. Ecohydrology 2014, 7, 678–691. [Google Scholar] [CrossRef]
- Kavzoglu, T.; Sahin, E.K.; Colkesen, I. An assessment of multivariate and bivariate approaches in landslide susceptibility mapping: A case study of Duzkoy district. Nat. Hazards 2015, 76, 471–496. [Google Scholar] [CrossRef]
- Totschnig, R.; Fuchs, S. Mountain torrents: Quantifying vulnerability and assessing uncertainties. Eng. Geol. 2013, 155, 31–44. [Google Scholar] [CrossRef] [PubMed]
- Zou, Q.; Zhou, J.; Zhou, C.; Song, L.; Guo, J. Comprehensive flood risk assessment based on set pair analysis-variable fuzzy sets model and fuzzy AHP. Stoch. Environ. Res. Risk Assess. 2013, 27, 525–546. [Google Scholar] [CrossRef]
- Nandi, A.; Shakoor, A. A GIS-based landslide susceptibility evaluation using bivariate and multivariate statistical analyses. Eng. Geol. 2010, 110, 11–20. [Google Scholar] [CrossRef]
- Li, D.; Meng, H.; Shi, X. Membership clouds and membership cloud generators. Comput. Res. Dev. 1995, 32, 15–20, (In Chinese with English Abstract). [Google Scholar]
- Li, D.Y.; Liu, C.Y.; Gan, W.Y. A new cognitive model: Cloud model. Int. J. Intell. Syst. 2009, 24, 357–375. [Google Scholar] [CrossRef]
- Zhang, W.; Liu, S.; Sun, B.; Liu, Y.; Pecht, M. A cloud model-based method for the analysis of accelerated life test data. Microelectron. Reliab. 2014, 55, 123–128. [Google Scholar] [CrossRef]
- Lu, H.; Ren, Li.; Chen, Y.; Tian, P.; Liu, J. A cloud model based multi-attribute decision making approach for selection and evaluation of groundwater management schemes. J. Hydrol. 2017, 555, 881–893. [Google Scholar] [CrossRef]
- Wang, D.; Liu, D.; Ding, H.; Singh, V.P.; Wang, Y.; Zeng, X.; Wu, J.; Wang, L. A cloud model-based approach for water quality assessment. Environ. Res. 2016, 148, 24–35. [Google Scholar] [CrossRef] [PubMed]
- Ma, R.; Shi, J.S.; Liu, J.C.; Zhang, Y.L. Establishment and application of cloud-markov model based on aquifer hydraulic conductivity. J. Hydraul. Eng. 2012, 43, 767–776. [Google Scholar]
- Liu, Z.; Shao, J.; Xu, W.; Xu, F. Comprehensive stability evaluation of rock slope using the cloud model-based approach. Rock Mech. Rock Eng. 2014, 47, 2239–2252. [Google Scholar] [CrossRef]
- Seekao, C.; Pharino, C. Assessment of the flood vulnerability of shrimp farms using a multicriteria evaluation and GIS: A case study in the Bangpakong Sub-Basin, Thailand. Environ. Earth Sci. 2016, 75, 1–13. [Google Scholar] [CrossRef]
- Ma, J.; Fan, Z.P.; Huang, L.H. A subjective and objective integrated approach to determine attribute weights. Eur. J. Oper. Res. 1999, 112, 397–404. [Google Scholar] [CrossRef] [Green Version]
- Vaidyaab, O.S. Analytic hierarchy process: An overview of applications. Eur. J. Oper. 2006, 169, 1–29. [Google Scholar] [CrossRef]
- Ramík, J.; Korviny, P. Inconsistency of pair-wise comparison matrix with fuzzy elements based on geometric mean. Fuzzy Set. Syst. 2010, 161, 1604–1613. [Google Scholar] [CrossRef]
- Singh, V.P. The use of entropy in hydrology and water resources. Hydrol. Process. 1997, 11, 587–626. [Google Scholar] [CrossRef]
- Li, Y.; Lei, Z.; Suo, J. Comprehensive assessment of marine ecological environment based on entropy weight model. Pol. J. Environ. Stud. 2015, 25, 151–155. [Google Scholar]
- Xu, X. A note on the subjective and objective integrated approach to determine attribute weights. Eur. J. Oper. Res. 2004, 156, 530–532. [Google Scholar] [CrossRef]
- Saaty, T.L. How to make a decision: The analytic hierarchy process. Interfaces 1994, 24, 19–43. [Google Scholar] [CrossRef]
- Saaty, T.L. Decision-making with the AHP: Why is the principal eigenvector necessary. Eur. J. Oper. Res. 2007, 145, 85–91. [Google Scholar] [CrossRef]
- Shannon, C.E. A mathematical theory of communication. Bell Syst. Tech. J. 1948, 27, 379–423. [Google Scholar] [CrossRef]
- Wu, J.; Li, P.; Qian, H.; Chen, J. On the sensitivity of entropy weight to sample statistics in assessing water quality: Statistical analysis based on large stochastic samples. Environ. Earth Sci. 2015, 74, 2185–2195. [Google Scholar] [CrossRef]
- Li, D.; Cheung, D.; Shi, X.; Ng, V. Uncertainty reasoning based on cloud models in controllers. Comput. Math. Appl. 1998, 35, 99–123. [Google Scholar] [CrossRef]
- Li, D.; Liu, C.; Liu, L. Study on the universality of the normal cloud model. Eng. Sci. 2004, 6, 28–34, (In Chinese with English Abstract). [Google Scholar]
- Zou, Q.; Wang, N.; Chen, J.; He, X. Risk assessment of watershed flood control engineering system based on cloud model. Yangtze River 2016, 47, 1–4, (In Chinese with English Abstract). [Google Scholar]
- Liu, D.F.; Wang, D.; Wu, J.C.; Wang, Y.K.; Wang, L.C.; Zou, X.Q.; Chen, Y.F.; Chen, X. A risk assessment method based on RBF artificial neural network-cloud model for urban water hazard. J. Intell. Fuzzy Syst. 2014, 27, 2409–2416. [Google Scholar]
- Zhang, L.; Wu, X.; Chen, Q.; Skibniewski, M.J.; Zhong, J. Developing a cloud model based risk assessment methodology for tunnel-induced damage to existing pipelines. Stoch. Environ. Res. Risk Assess. 2015, 29, 513–526. [Google Scholar] [CrossRef]
- W, K.; L, N. Chinese Meteorological Disaster (Guizhou), 1st ed.; Chinese Meteorological Press: Beijing, China, 2006; pp. 98–122. [Google Scholar]
Figure 1.
Study area of Guizhou province.

Figure 2.
Spatial distributions of eight indices: (a) u1, annual average rainfall (0.1 mm); (b) u2, annual maximum 6-h heavy rainfall (mm); (c) u3, annual maximum 60-min heavy rainfall (mm); (d) u4, river network density (m/km2); (e) u5, vegetation index; (f) u6, topographic relief (m); (g) u7, population density (person/km2); and (h) u8, GDP density (10,000 RMB (Chinese yuan)/km2).


Figure 3.
Normal cloud model with parameters Ex = 2, En = 1, and He = 0.1.

Figure 4.
Schematic diagram of cloud generator (CG). (a) Forward CG; (b) backward CG.

Figure 5.
Cloud model expression of eight indices with five levels for risk evaluation of mountain torrent disaster. (a) Cloud model expression of index u1; (b) cloud model expression of index u2; (c) cloud model expression of index u3; (d) cloud model expression of index u4; (e) cloud model expression of index u5; (f) cloud model expression of index u6; (g) cloud model expression of index u7; and (h) cloud model expression of index u8.


Table 1.
Risk index system for mountain torrent disaster assessment.
| Target Layer | Intermediate Layer | Index Layer | Index |
|---|---|---|---|
| Risk assessment of mountain torrent disaster | Hazard | Annual average rainfall | u1 |
| Annual maximum 6-h heavy rainfall | u2 | ||
| Annual maximum 60-min heavy rainfall | u3 | ||
| River network density | u4 | ||
| Vegetation index | u5 | ||
| Topographic relief | u6 | ||
| Vulnerability | Population density | u7 | |
| GDP density | u8 |
Table 2.
Specifications of multi-source dataset employed in this study.
| Dataset | Format | Resolution | Data Source | Region |
|---|---|---|---|---|
| Administrative boundary | Vector (Arc/Info) | 1:4,000,000 | RESDC | Guizhou |
| Extreme heavy rainfall maps | Raster (.jpg) | 200 dpi | Water Resources Research Institute of Guizhou Province | Guizhou |
| GDEM | Raster (.tiff) | 30 × 30 m | ASTER GDEM official website | Guizhou |
| Annual average rainfall | Raster (.tiff) | 500 × 500 m | RESDC | China |
| River network | Vector (Arc/Info) | 1:4,000,000 | China | |
| Vegetation index | Raster (Arc/Info) | 1000 × 1000 m | China | |
| Population density | Raster (Arc/Info) | 1000 × 1000 m | China | |
| GDP density | Raster (Arc/Info) | 1000 × 1000 m | China |
Table 3.
Random indicator (RI) values corresponding to the comparison-matrix dimensions.
| n | 1 | 2 | 3 | 4 | 5 | 6 | 7 | 8 | 9 |
|---|---|---|---|---|---|---|---|---|---|
| RI | 0 | 0 | 0.58 | 0.90 | 1.12 | 1.24 | 1.32 | 1.41 | 1.45 |
Table 4.
Matrix construction and weight calculation of indices in intermediate layer.
| Indicator | Hazard | Vulnerability | Weight |
|---|---|---|---|
| Hazard | 1 | 4 | 0.8 |
| Vulnerability | 1/4 | 1 | 0.2 |
| = 2 | CI = 0 | CR = 0 < 0.1 | Acceptable |
Table 5.
Matrix construction and weight calculation of indices associated with the hazard.
| Index | u1 | u2 | u3 | u4 | u5 | u6 | Weight |
|---|---|---|---|---|---|---|---|
| u1 | 1 | 1/3 | 1/4 | 3 | 4 | 3 | 0.1509 |
| u2 | 3 | 1 | 1/2 | 4 | 5 | 4 | 0.2700 |
| u3 | 4 | 2 | 1 | 4 | 5 | 5 | 0.3728 |
| u4 | 1/3 | 1/4 | 1/4 | 1 | 4 | 3 | 0.1013 |
| u5 | 1/4 | 1/5 | 1/5 | 1/4 | 1 | 1/4 | 0.0375 |
| u6 | 1/3 | 1/4 | 1/5 | 1/3 | 4 | 1 | 0.0676 |
| = 6.5639 | CI = 0.1128 | CR = 0.0910 < 0.1 | Acceptable | ||||
Table 6.
Matrix construction and weight calculation of indices associated with the vulnerability.
| Index | u7 | u8 | Weight |
|---|---|---|---|
| u7 | 1 | 5 | 0.8333 |
| u8 | 1/5 | 1 | 0.1667 |
| = 2 | CI = 0 | CR = 0 < 0.1 | Acceptable |
Table 7.
Ultimate weight of each index for risk assessment of mountain torrent disaster.
| Target Layer | Intermediate Layer | Index | Relative Weight | Total Weight |
|---|---|---|---|---|
| Risk assessment of mountain torrent disaster | Hazard 0.8 | Annual average rainfall (u1) | 0.1509 | 0.1207 |
| Annual maximum 6-h heavy rainfall (u2) | 0.2700 | 0.2160 | ||
| Annual maximum 60-min heavy rainfall (u3) | 0.3728 | 0.2982 | ||
| River network density (u4) | 0.1013 | 0.0810 | ||
| Vegetation index (u5) | 0.0375 | 0.0300 | ||
| Topographic relief (u6) | 0.0676 | 0.0541 | ||
| Vulnerability 0.2 | Population density (u7) | 0.8333 | 0.1667 | |
| GDP density (u8) | 0.1667 | 0.0333 |
Table 8.
Dimensionless data of Guizhou province.
| Assessment Cases | u1 | u2 | u3 | u4 | u5 | u6 | u7 | u8 |
|---|---|---|---|---|---|---|---|---|
| Zunyi City | 0.204 | 0.353 | 0.630 | 0.413 | 0.927 | 0.934 | 0.223 | 0.089 |
| Tongren City | 0.391 | 0.498 | 0.403 | 0.569 | 0.511 | 0.851 | 0.148 | 0.048 |
| Bijie City | 0 | 0 | 0.534 | 0.032 | 0.805 | 0.604 | 0.330 | 0.050 |
| AP of southeast Guizhou | 0.504 | 0.334 | 0 | 0.359 | 1 | 0.832 | 0 | 0 |
| AP of south Guizhou | 0.561 | 0.714 | 0.796 | 0.317 | 0.700 | 0.594 | 0.052 | 0.031 |
| Guiyang City | 0.226 | 0.843 | 0.128 | 1 | 0.310 | 0 | 1 | 1 |
| Liupanshui City | 1 | 0.515 | 0.285 | 0 | 0.232 | 1 | 0.430 | 0.224 |
| Anshun City | 0.804 | 0.843 | 1 | 0.194 | 0 | 0.580 | 0.362 | 0.157 |
| AP of southwest Guizhou | 0.927 | 1 | 0.098 | 0.088 | 0.403 | 0.977 | 0.204 | 0.055 |
Table 9.
Entropy and entropy-based weight of each index for risk assessment of mountain torrent disaster.
Table 9.
Entropy and entropy-based weight of each index for risk assessment of mountain torrent disaster.
| Primary Index | Secondary Index | Entropy | Entropy-Based Weight |
|---|---|---|---|
| Hazard | Annual average rainfall (u1) | 0.9380 | 0.0709 |
| Annual maximum 6-h heavy rainfall (u2) | 0.9675 | 0.0372 | |
| Annual maximum 60-min heavy rainfall (u3) | 0.9023 | 0.1117 | |
| River network density (u4) | 0.8572 | 0.1632 | |
| Vegetation index (u5) | 0.9506 | 0.0565 | |
| Topographic relief (u6) | 0.9892 | 0.0123 | |
| Vulnerability | Population density (u7) | 0.8697 | 0.1490 |
| GDP density (u8) | 0.6508 | 0.3992 |
Table 10.
Hybrid weight of each index for risk assessment of mountain torrent disaster.
| Index | AHP-Based Weight | Entropy-Based Weight | Hybrid Weight |
|---|---|---|---|
| Annual average rainfall (u1) | 0.1207 | 0.0709 | 0.0826 |
| Annual maximum 6-h heavy rainfall (u2) | 0.2160 | 0.0372 | 0.0776 |
| Annual maximum 60-min heavy rainfall (u3) | 0.2982 | 0.1117 | 0.3215 |
| River network density (u4) | 0.0810 | 0.1632 | 0.1276 |
| Vegetation index (u5) | 0.0300 | 0.0565 | 0.0164 |
| Topographic relief (u6) | 0.0541 | 0.0123 | 0.0064 |
| Population density (u7) | 0.1667 | 0.1490 | 0.2397 |
| GDP density (u8) | 0.0333 | 0.3992 | 0.1283 |
Table 11.
Index criteria determination for risk assessment of mountain torrent hazards in Guizhou province.
Table 11.
Index criteria determination for risk assessment of mountain torrent hazards in Guizhou province.
| Index | Level I | Level II | Level III | Level IV | Level V |
|---|---|---|---|---|---|
| u1 | (9938, 10,272.9) | (10,272.9, 10,942.7) | (10,942.7, 12,282.3) | (12,282.3, 12,952.1) | (12,952.1, 13,287) |
| u2 | (107, 112.1) | (112.1, 122.3) | (122.3, 142.7) | (142.7, 152.9) | (152.9, 158) |
| u3 | (69, 70.2) | (70.2, 72.6) | (72.6, 77.4) | (77.4, 79.8) | (79.8, 81) |
| u4 | (24.8, 26.8) | (26.8, 30.7) | (30.7, 38.7) | (38.7, 42.6) | (42.6, 44.6) |
| u5 | (0.795, 0.791) | (0.791, 0.783) | (0.783, 0.766) | (0.766, 0.758) | (0.758, 0.754) |
| u6 | (106.9, 112.2) | (112.2, 122.8) | (122.8, 144.1) | (144.1, 154.7) | (154.7, 160) |
| u7 | (100, 143.5) | (143.5, 230.5) | (230.5, 404.5) | (404.5, 491.5) | (491.5, 535) |
| u8 | (104.2, 190.3) | (190.3, 362.4) | (362.4, 706.8) | (706.8, 878.9) | (878.9, 965) |
Table 12.
Cloud models (Ex, En, He) of eight indices at different risk assessment levels.
| Index | Level I | Level II | Level III |
| u1 | (10,105.45, 142.2081, 5) | (10,607.8, 284.4161, 5) | (11,612.5, 568.8323, 5) |
| u2 | (109.55, 2.1656, 0.2) | (117.2, 4.3312, 0.2) | (132.5, 8.6624, 0.2) |
| u3 | (69.6, 0.5096, 0.05) | (71.4, 1.0191, 0.05) | (75, 2.0382, 0.05) |
| u4 | (25.79, 0.8408, 0.1) | (28.76, 1.6815, 0.1) | (34.7, 3.3631, 0.1) |
| u5 | (0.79295, 0.0017, 0.0001) | (0.7868, 0.0035, 0.0001) | (0.7745, 0.0070, 0.0001) |
| u6 | (109.555, 2.2548, 0.1) | (117.52, 4.5096, 0.1) | (133.45, 9.0191, 0.1) |
| u7 | (121.75, 18.4713, 1) | (187, 36.9427, 1) | (317.5, 73.8854, 1) |
| u8 | (147.24, 36.5520, 2) | (276.36, 73.1040, 2) | (534.6, 146.2081, 2) |
| Index | Level IV | Level V | |
| u1 | (12,617.2, 284.4161, 5) | (131,19.55, 142.2081, 5) | |
| u2 | (147.8, 4.3312, 0.2) | (155.45, 2.1656, 0.2) | |
| u3 | (78.6, 1.0191, 0.05) | (80.4, 0.5096, 0.05) | |
| u4 | (40.64, 1.6815, 0.1) | (43.61, 0.8408, 0.1) | |
| u5 | (0.7622, 0.0035, 0.0001) | (0.75605, 0.0017, 0.0001) | |
| u6 | (149.38, 4.5096, 0.1) | (157.345, 2.2548, 0.1) | |
| u7 | (448, 36.9427, 1) | (513.25, 18.4713, 1) | |
| u8 | (792.84, 73.1040, 2) | (921.96, 36.5520, 2) |
Table 13.
Certainty degrees of Zunyi City in Guizhou province.
| Index | Risk Level | ||||
|---|---|---|---|---|---|
| I | II | III | IV | V | |
| u1 | 0.0013 | 0.8196 | 0.1791 | 0.0000 | 0.0000 |
| u2 | 0.0000 | 0.2089 | 0.7911 | 0.0000 | 0.0000 |
| u3 | 0.0000 | 0.0000 | 0.8330 | 0.1670 | 0.0000 |
| u4 | 0.0000 | 0.0459 | 0.9540 | 0.0001 | 0.0000 |
| u5 | 0.6373 | 0.3209 | 0.0418 | 0.0000 | 0.0000 |
| u6 | 0.0000 | 0.0000 | 0.0342 | 0.2607 | 0.7051 |
| u7 | 0.0002 | 0.7816 | 0.2182 | 0.0000 | 0.0000 |
| u8 | 0.5782 | 0.3745 | 0.0472 | 0.0000 | 0.0000 |
Table 14.
Certainty degrees of Tongren City in Guizhou province.
| Index | Risk Level | ||||
|---|---|---|---|---|---|
| I | II | III | IV | V | |
| u1 | 0.0000 | 0.0886 | 0.9114 | 0.0000 | 0.0000 |
| u2 | 0.0000 | 0.0035 | 0.9928 | 0.0037 | 0.0000 |
| u3 | 0.0000 | 0.0328 | 0.9671 | 0.0001 | 0.0000 |
| u4 | 0.0000 | 0.0001 | 0.9706 | 0.0293 | 0.0000 |
| u5 | 0.0000 | 0.0043 | 0.9947 | 0.0011 | 0.0000 |
| u6 | 0.0000 | 0.0000 | 0.1227 | 0.8300 | 0.0473 |
| u7 | 0.0656 | 0.8184 | 0.1160 | 0.0000 | 0.0000 |
| u8 | 0.8121 | 0.1642 | 0.0237 | 0.0000 | 0.0000 |
Table 15.
Certainty degrees of Bijie City in Guizhou province.
| Index | Risk Level | ||||
|---|---|---|---|---|---|
| I | II | III | IV | V | |
| u1 | 0.8686 | 0.1086 | 0.0228 | 0.0000 | 0.0000 |
| u2 | 0.8506 | 0.1248 | 0.0246 | 0.0000 | 0.0000 |
| u3 | 0.0000 | 0.0004 | 0.9889 | 0.0107 | 0.0000 |
| u4 | 0.8421 | 0.1362 | 0.0217 | 0.0000 | 0.0000 |
| u5 | 0.0013 | 0.8231 | 0.1757 | 0.0000 | 0.0000 |
| u6 | 0.0000 | 0.0000 | 0.9301 | 0.0699 | 0.0000 |
| u7 | 0.0000 | 0.3323 | 0.6677 | 0.0000 | 0.0000 |
| u8 | 0.8060 | 0.1697 | 0.0243 | 0.0000 | 0.0000 |
Table 16.
Certainty degrees of AP of southeast Guizhou.
| Index | Risk Level | ||||
|---|---|---|---|---|---|
| I | II | III | IV | V | |
| u1 | 0.0000 | 0.0017 | 0.9960 | 0.0023 | 0.0000 |
| u2 | 0.0000 | 0.2980 | 0.7020 | 0.0000 | 0.0000 |
| u3 | 0.8058 | 0.1699 | 0.0242 | 0.0000 | 0.0000 |
| u4 | 0.0000 | 0.1881 | 0.8119 | 0.0000 | 0.0000 |
| u5 | 0.8652 | 0.1129 | 0.0219 | 0.0000 | 0.0000 |
| u6 | 0.0000 | 0.0000 | 0.1409 | 0.8447 | 0.0144 |
| u7 | 0.8678 | 0.1097 | 0.0226 | 0.0000 | 0.0000 |
| u8 | 0.8683 | 0.1087 | 0.0230 | 0.0000 | 0.0000 |
Table 17.
Certainty degrees of AP of south Guizhou.
| Index | Risk Level | ||||
|---|---|---|---|---|---|
| I | II | III | IV | V | |
| u1 | 0.0000 | 0.0001 | 0.9796 | 0.0203 | 0.0000 |
| u2 | 0.0000 | 0.0000 | 0.4243 | 0.5756 | 0.0001 |
| u3 | 0.0000 | 0.0000 | 0.2022 | 0.7970 | 0.0008 |
| u4 | 0.0000 | 0.3962 | 0.6038 | 0.0000 | 0.0000 |
| u5 | 0.0000 | 0.4994 | 0.5006 | 0.0000 | 0.0000 |
| u6 | 0.0000 | 0.0000 | 0.9487 | 0.0513 | 0.0000 |
| u7 | 0.7924 | 0.1821 | 0.0255 | 0.0000 | 0.0000 |
| u8 | 0.8494 | 0.1298 | 0.0209 | 0.0000 | 0.0000 |
Table 18.
Certainty degrees of Guiyang City in Guizhou province.
| Index | Risk Level | ||||
|---|---|---|---|---|---|
| I | II | III | IV | V | |
| u1 | 0.0002 | 0.7765 | 0.2233 | 0.0000 | 0.0000 |
| u2 | 0.0000 | 0.0000 | 0.1226 | 0.8210 | 0.0564 |
| u3 | 0.0237 | 0.8431 | 0.1332 | 0.0000 | 0.0000 |
| u4 | 0.0000 | 0.0000 | 0.0235 | 0.1138 | 0.8627 |
| u5 | 0.0000 | 0.0000 | 0.6167 | 0.3833 | 0.0000 |
| u6 | 0.8653 | 0.1120 | 0.0227 | 0.0000 | 0.0000 |
| u7 | 0.0000 | 0.0000 | 0.0227 | 0.1096 | 0.8677 |
| u8 | 0.0000 | 0.0000 | 0.0229 | 0.1100 | 0.8671 |
Table 19.
Certainty degrees of Liupanshui City in Guizhou province.
| Index | Risk Level | ||||
|---|---|---|---|---|---|
| I | II | III | IV | V | |
| u1 | 0.0000 | 0.0000 | 0.0228 | 0.1090 | 0.8682 |
| u2 | 0.0000 | 0.0020 | 0.9919 | 0.0061 | 0.0000 |
| u3 | 0.0000 | 0.4548 | 0.5452 | 0.0000 | 0.0000 |
| u4 | 0.8644 | 0.1127 | 0.0229 | 0.0000 | 0.0000 |
| u5 | 0.0000 | 0.0000 | 0.2776 | 0.7224 | 0.0000 |
| u6 | 0.0000 | 0.0000 | 0.0223 | 0.1130 | 0.8647 |
| u7 | 0.0000 | 0.0270 | 0.9729 | 0.0001 | 0.0000 |
| u8 | 0.0002 | 0.7815 | 0.2182 | 0.0000 | 0.0000 |
Table 20.
Certainty degrees of Anshun City in Guizhou province.
| Index | Risk Level | ||||
|---|---|---|---|---|---|
| I | II | III | IV | V | |
| u1 | 0.0000 | 0.0000 | 0.1671 | 0.8304 | 0.0024 |
| u2 | 0.0000 | 0.0000 | 0.1228 | 0.8210 | 0.0561 |
| u3 | 0.0000 | 0.0000 | 0.0207 | 0.1237 | 0.8556 |
| u4 | 0.0037 | 0.8278 | 0.1685 | 0.0000 | 0.0000 |
| u5 | 0.0000 | 0.0000 | 0.0219 | 0.1249 | 0.8532 |
| u6 | 0.0000 | 0.0001 | 0.9664 | 0.0335 | 0.0000 |
| u7 | 0.0000 | 0.1820 | 0.8180 | 0.0000 | 0.0000 |
| u8 | 0.0421 | 0.8346 | 0.1233 | 0.0000 | 0.0000 |
Table 21.
Certainty degrees of AP of southwest Guizhou.
| Index | Risk Level | ||||
|---|---|---|---|---|---|
| I | II | III | IV | V | |
| u1 | 0.0000 | 0.0000 | 0.0341 | 0.2622 | 0.7037 |
| u2 | 0.0000 | 0.0000 | 0.0251 | 0.1202 | 0.8547 |
| u3 | 0.1005 | 0.7911 | 0.1084 | 0.0000 | 0.0000 |
| u4 | 0.5525 | 0.3970 | 0.0505 | 0.0000 | 0.0000 |
| u5 | 0.0000 | 0.0000 | 0.9503 | 0.0497 | 0.0000 |
| u6 | 0.0000 | 0.0000 | 0.0211 | 0.1297 | 0.8492 |
| u7 | 0.0013 | 0.8171 | 0.1816 | 0.0000 | 0.0000 |
| u8 | 0.7877 | 0.1864 | 0.0259 | 0.0000 | 0.0000 |
Table 22.
Comprehensive evaluation outcomes of mountain torrent disasters in Guizhou province.
| Cases | Risk Level | Final Risk Level | ||||
|---|---|---|---|---|---|---|
| I | II | III | IV | V | ||
| Zunyi City | 0.085 | 0.330 | 0.525 | 0.055 | 0.005 | III |
| Tongren City | 0.120 | 0.235 | 0.635 | 0.009 | 0.000 | III |
| Bijie City | 0.349 | 0.151 | 0.496 | 0.004 | 0.000 | III |
| AP of southeast Guizhou | 0.593 | 0.144 | 0.258 | 0.006 | 0.000 | I |
| AP of south Guizhou | 0.299 | 0.119 | 0.279 | 0.303 | 0.000 | IV |
| Guiyang City | 0.013 | 0.336 | 0.092 | 0.125 | 0.434 | V |
| Liupanshui City | 0.110 | 0.267 | 0.523 | 0.022 | 0.077 | III |
| Anshun City | 0.006 | 0.256 | 0.270 | 0.174 | 0.294 | V |
| AP of southwest Guizhou | 0.204 | 0.525 | 0.109 | 0.033 | 0.130 | II |
© 2018 by the authors. Licensee MDPI, Basel, Switzerland. This article is an open access article distributed under the terms and conditions of the Creative Commons Attribution (CC BY) license (http://creativecommons.org/licenses/by/4.0/).
Share and Cite
MDPI and ACS Style
Yang, S.; Han, X.; Cao, B.; Li, B.; Yan, F. Cloud-Model-Based Method for Risk Assessment of Mountain Torrent Disasters. Water 2018, 10, 830. https://doi.org/10.3390/w10070830
AMA Style
Yang S, Han X, Cao B, Li B, Yan F. Cloud-Model-Based Method for Risk Assessment of Mountain Torrent Disasters. Water. 2018; 10(7):830. https://doi.org/10.3390/w10070830
Chicago/Turabian StyleYang, Shengmei, Xianquan Han, Bo Cao, Bo Li, and Fei Yan. 2018. "Cloud-Model-Based Method for Risk Assessment of Mountain Torrent Disasters" Water 10, no. 7: 830. https://doi.org/10.3390/w10070830
Note that from the first issue of 2016, this journal uses article numbers instead of page numbers. See further details here.