Impact of Urban Growth and Changes in Land Use on River Flood Hazard in Villahermosa, Tabasco (Mexico)


1
Departamento de Ciencias de la Tierra, Tecnológico Nacional de México/Instituto Tecnológico de Pachuca, Pachuca de Soto 42080, Hidalgo, Mexico
2
Department of Civil Engineering, Universidade da Coruña Environmental and Water Engineering Group, 15001 A Coruña, Spain
3
CONACYT—Instituto Politécnico Nacional, ESIA, UZ, Miguel Bernard, S/N, Edificio de Posgrado, Mexico City 07738, Mexico
*
Author to whom correspondence should be addressed.
Water 2019, 11(2), 304; https://doi.org/10.3390/w11020304
Submission received: 29 December 2018
/
Revised: 28 January 2019
/
Accepted: 31 January 2019
/
Published: 12 February 2019
(This article belongs to the Special Issue Flood Risk and Resilience)
Abstract
:The city of Villahermosa, a logistical center in the State of Tabasco’s economy, is affected by recurrent river floods. In this study, we analyzed the impact of two factors that are the most probable causes of this increase in flood hazard: changes in land use in the hydrological catchments upstream of the city, and the uncontrolled urbanization of the floodplains adjacent to the main river channels. Flood discharges for different return periods were evaluated, considering land uses of the catchments, both as they were in 1992 and as they are today. These flood discharges were then used in a 2D shallow water model to estimate the increase of water depths in the city from 1992 to the present day. To evaluate the influence of urban expansion on inundation levels, three future urbanization scenarios were proposed on the basis of the urban growth rate forecast for 2050. Results confirm that the change in land use in the hydrological catchments is the main factor that explains the increase in inundation events observed over recent years. This study also provides useful insights for future city planning that might help to minimize the flood impact on Villahermosa.
1. Introduction
River floods due to excessive rainfall–runoff are responsible for recurrent damage to basins where soil surface characteristics have been modified as a consequence of deforestation and urban growth. A decrease in the connectivity of river networks and the loss of fluvial floodplains, in combination with the conversion of agriculture land to less permeable urban surfaces, can significantly reduce the basin’s response time during storm events, which in turn increases peak discharges and the risk of flooding.
The State of Tabasco (Mexico) recurrently experiences inundation events throughout its territory. It is located within the delta of two main rivers: the Grijalva and the Usumacinta. These rivers account for approximately 30% of the total runoff in Mexico, and converge in the same system along their course towards the Gulf of Mexico, about 40 km downstream of the city of Villahermosa. A lack of environmental planning has drastically modified the characteristics of the terrain of this state over recent decades. The elimination of vegetable cover has led to a loss of soils and a reduction in infiltration capacity, causing higher volumes of surface runoff, silting, and hillslope erosion. In the whole territory of Mexico, from 1970, there have been substantial changes in land use, which have drastically increased the number of floods [1]. The rapid transformation of the territory has led to significant loss of vegetation [2] that, together with an increase in the frequency of extreme weather phenomena, has increased the flood risk throughout the country. Zúñiga and Magaña [3] analyzed the frequency of floods in Mexico by comparing observed and modeled frequency values for the period 1970–2010, finding that most flood events had occurred as a result of the rapid process of deforestation that affected the basins of the main rivers of the country. Results of this study show that the regions experiencing substantial increases in flood frequency over recent years are located mainly along the coasts, although the authors also stressed that the spatial distribution of floods depends to a great extent on the vulnerability of the regions in which rainfall occurs. In the specific case of the State of Tabasco, Aparicio et al. [4] pointed out that the change of land use from forest to agriculture leads to the transport of large quantities of sediments due to the increased erosion of basins, and they found that this can be considered to be one of the major causes of disasters in the region. The grass cover of the basins increases the roughness of the soil and reduces the runoff coefficient [5], which determines the magnitude of the discharges downstream. Grassland can significantly reduce runoff, compared to bare and agriculture land [6].
Over the last 40 years, the construction of housing complexes and containment bridges within Villahermosa have not only modified the landscape, but have also caused a phenomenon of irregular settlements on the margins of the same embankments. This process is expected to continue in the years to come: for the next 30 years, the city’s growth rate is expected to be greater than 0.50%. In addition, the exposure of the population to river flooding has dramatically increased in recent years due the presence of hurricanes in the coastal areas of the Pacific and Atlantic oceans, which produce heavy rainfall, leading to the transportation and deposition of large quantities of silts in the Tabasco plain [7]. From 1940 to 1990, the State of Tabasco lost 97% of its forest resources due to excessive exploitation of forests, causing wind and water erosion to affect almost 50% of the territory. In October 2007, Tabasco was hit by an intense flooding event. Extraordinary rains in the Grijalva basin generated intense runoff throughout the Tabasco plain, flooding about 70% of the state. The capital city, Villahermosa, was especially badly hit, suffering economic losses of more than three billion dollars. From 2008 to 2011, the city was continuously affected by the flooding of the rivers that traverse it [8].
In recent decades, the analysis of floods in urban areas has improved considerably with the introduction of accurate numerical models [9,10,11] and advanced methodologies, which aim in particular at the combination and integration of land use change forecasting models with hydrological models, with the objective of being able to determine increasingly precise peak discharge rates as a function of the predicted urbanization [12,13]. In particular, Wang et al. [13] presented the application of a cellular automata based model (Celular Automata Dual-DraInagE Simulation, CADDIES) to a small study area to analyze flood inundation, and demonstrate the importance of identifying and using key urban features, obtained from terrain data, to better reproduce high resolution flood processes. The effect of urbanization and changes in land use on floods has been studied from different perspectives, focusing both on river feeding catchments and on potentially floodable areas [14,15,16,17], with the conclusion that an appropriate study of land use and consequent management are crucial in flood attenuation.
This study analyzed two of the main causes of the increase in flood frequency and magnitude in Villahermosa: changes in land use in the hydrological basins located upstream of the city, and the expansion of the urban area in the city.
In the present study, we first analyzed the effect of the changes in land use of the catchments that drain to Villahermosa. Flood discharges for different return periods were calculated using both the oldest information on the basin’s land use (up until 1992) and the most recent (2013). The scenarios obtained were numerically simulated with the 2D flood inundation model Iber [18]. Secondly, the effect of the increase in the area occupied by buildings in the city was analyzed by comparing the inundation depths for three possible future urbanization scenarios.
The remainder of this paper is organized as follows. Section 2 presents the estimation of flood discharges for different return periods, considering both the land uses of the basins as they were in 1992 and the present ones. The inundation model used to evaluate the flood depths in the city for past and present scenarios is described in Section 3. The results of the numerical simulations are presented and discussed in Section 4. The influence of changes in land use (from 1992 to the present day) on inundation levels in the city was quantified and analyzed. Then, three possible future urbanization scenarios were proposed, and their effects on inundation hazard were analyzed.
2. Estimation of Flood Discharges
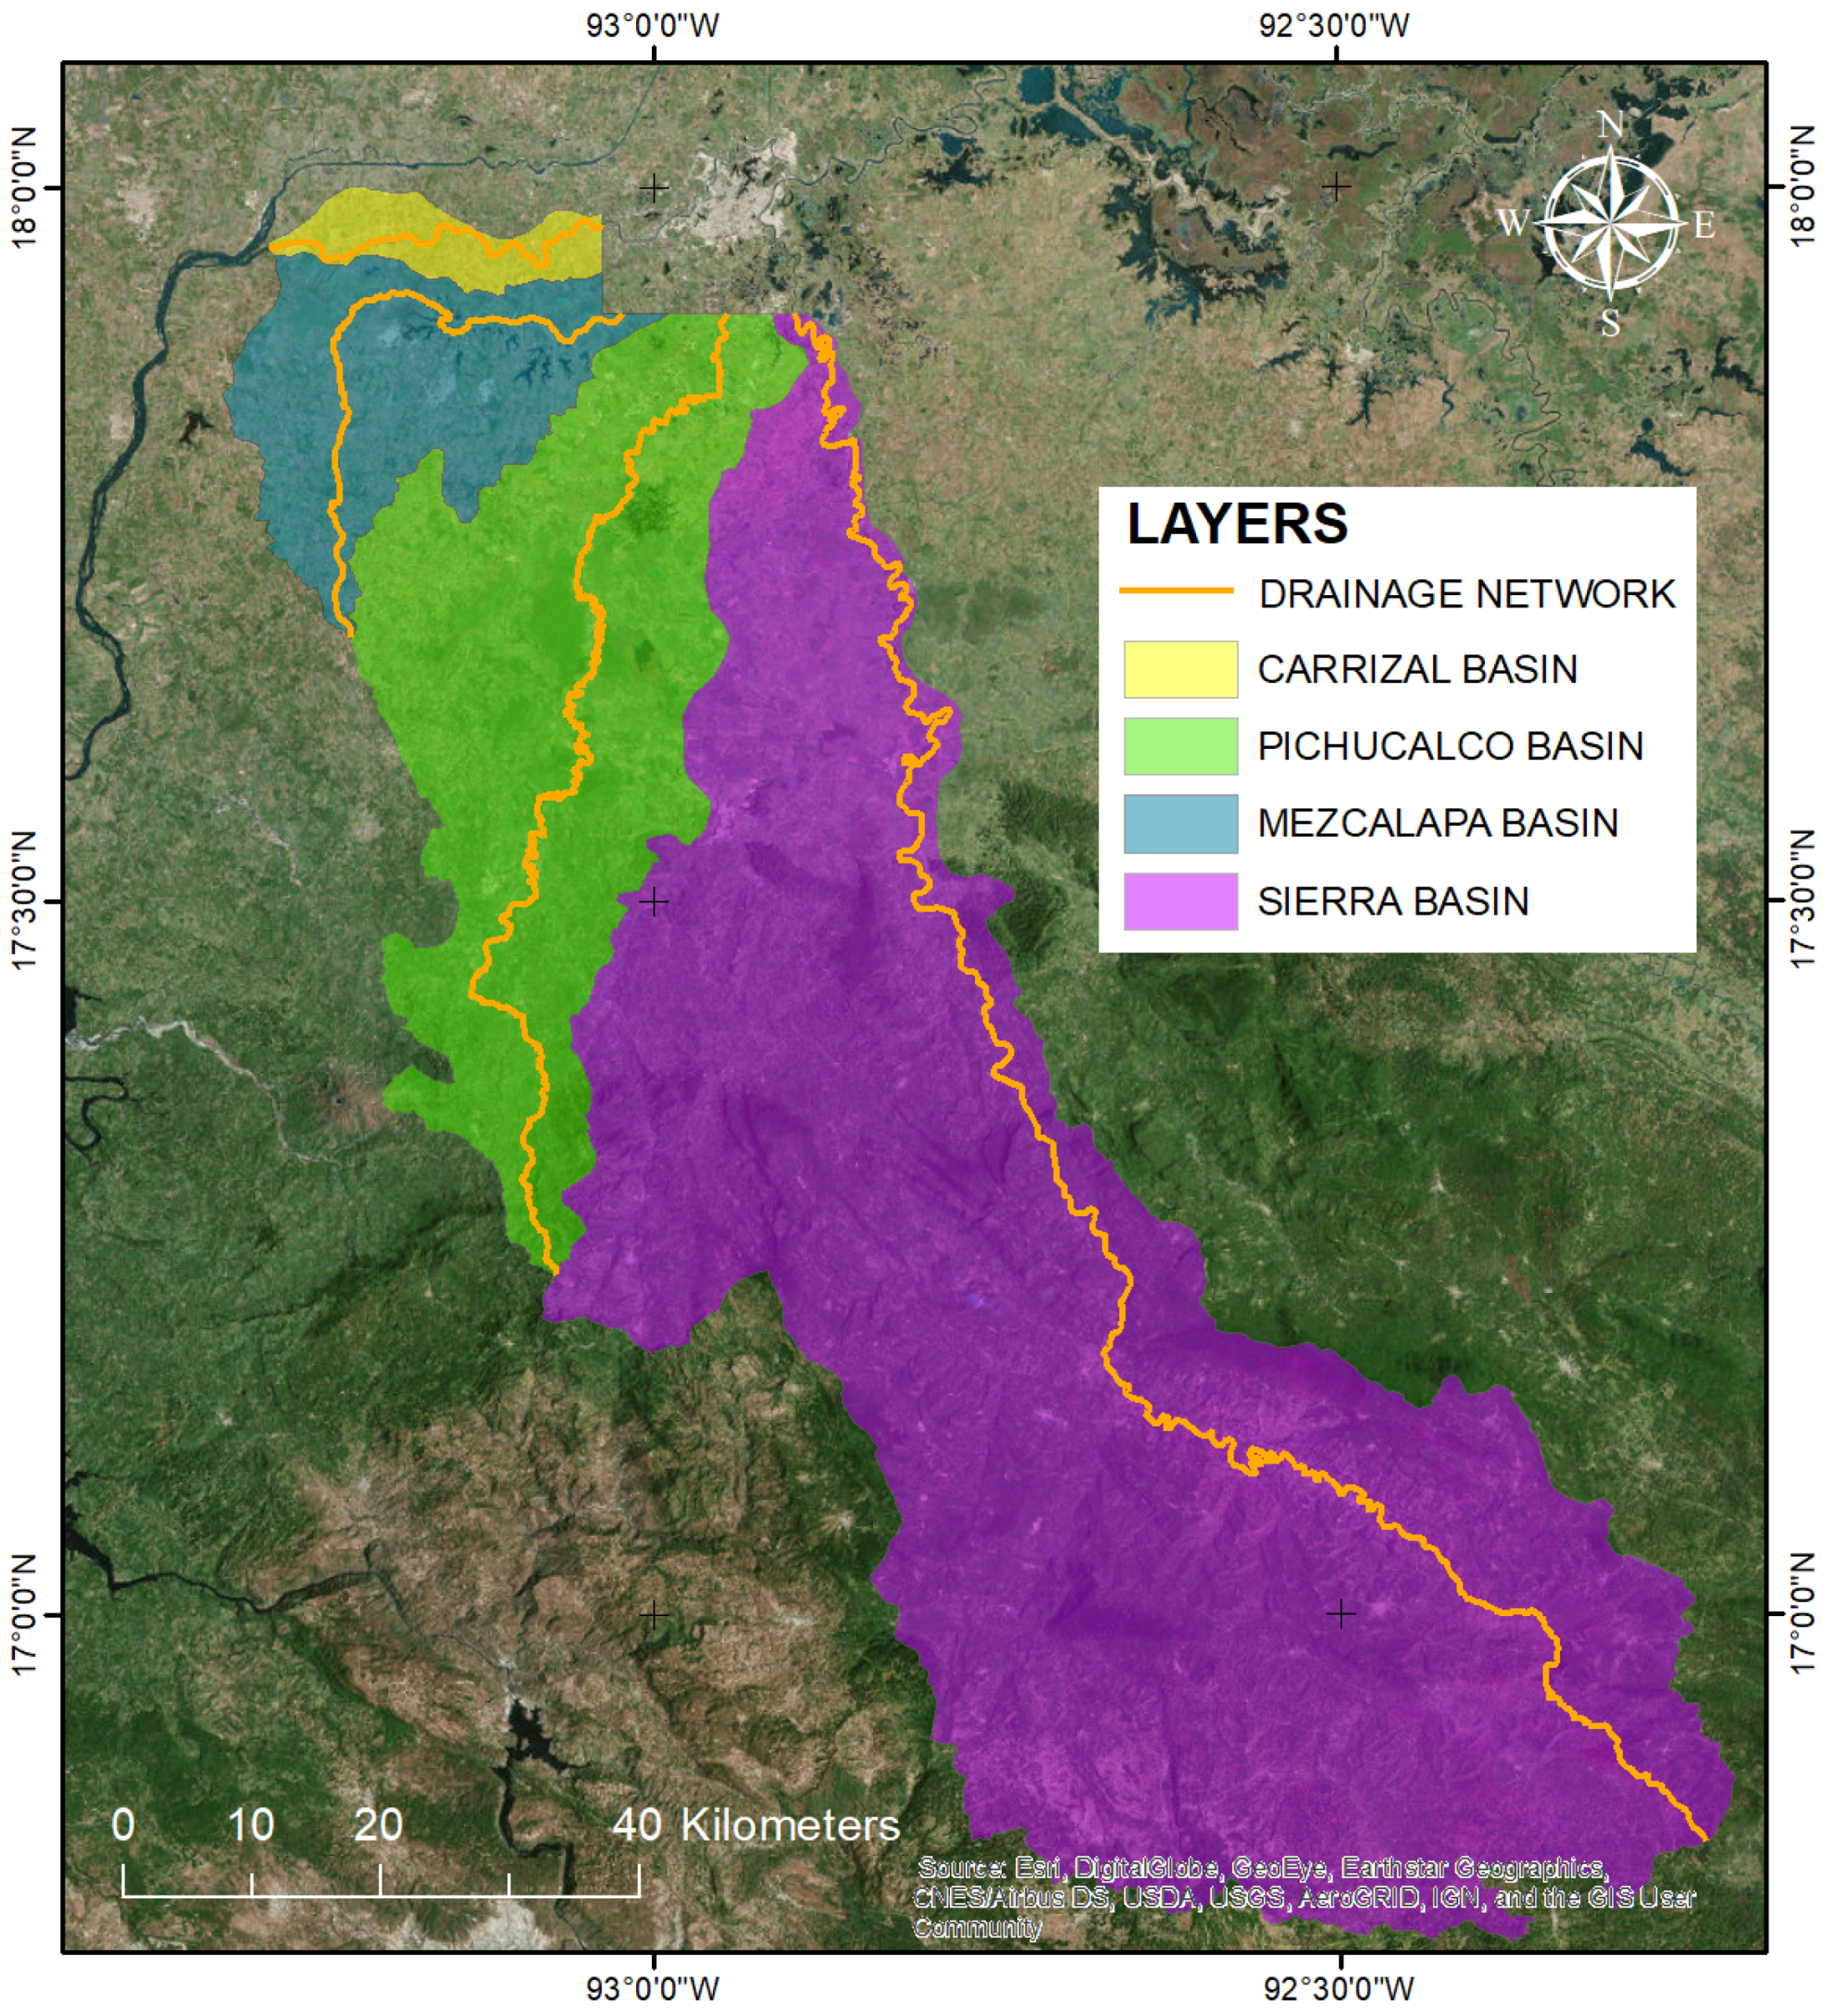
The city of Villahermosa is found in the municipality of Centro and is located within the hydrological zone of Grijalva-Usumacinta [1], which has a territorial extension of 102,456 km2. This hydrological zone is divided into 83 basins, eight of which drain into the city of Villahermosa. Four rivers are responsible for the flood events in the urban area of the city: the Carrizal, the Viejo Mezcalapa, the Pichucalco, and the de la Sierra rivers. Figure 1 shows the catchments of these rivers, while their hydrological characteristics are listed in Table 1.
Flood discharges of each river for different return periods were estimated with Chow’s method [19], including two adjustment factors to account for the spatial and temporal variability of extreme rainfall in large catchments. The flood discharge for a given return period is calculated as:
where A is the basin area (km2), X is the runoff factor (cm/h), Z is the peak reduction factor, K is a correction coefficient to account for the temporal variability of extreme rainfall, and is an areal reduction factor that relates extreme area-averaged rainfall with extreme point rainfall. Factor Z relates to the morphological parameters of each basin, and is calculated according to a relationship between the concentration time and the retrace time with the support of a nomogram [19]. For the Carrizal and Mezcalapa basins, this was estimated to 1, and for the Pichucalco and De La Sierra basins to 0.95. The runoff factor X is calculated as:
where is the excess precipitation depth (given in cm) for a given storm duration and return period, and is the catchment concentration time (given in hours). The concentration time was calculated as the average of the values obtained with Kirpich’s formula [20].
The coefficients K and are given as:
where the concentration time () is given in hours and the area of the catchment (A) in km2.
Following the recommendations of the Soil Conservation Service, the excess precipitation depth was computed from the total precipitation by means of the Curve Number (N), which is based mainly on land use:
where P is the total precipitation depth associated with a given return period, given in cm. The precipitation depths (P) were obtained from the rainfall database of the Secretary of Communications and Transportation (SCT, Mexico).
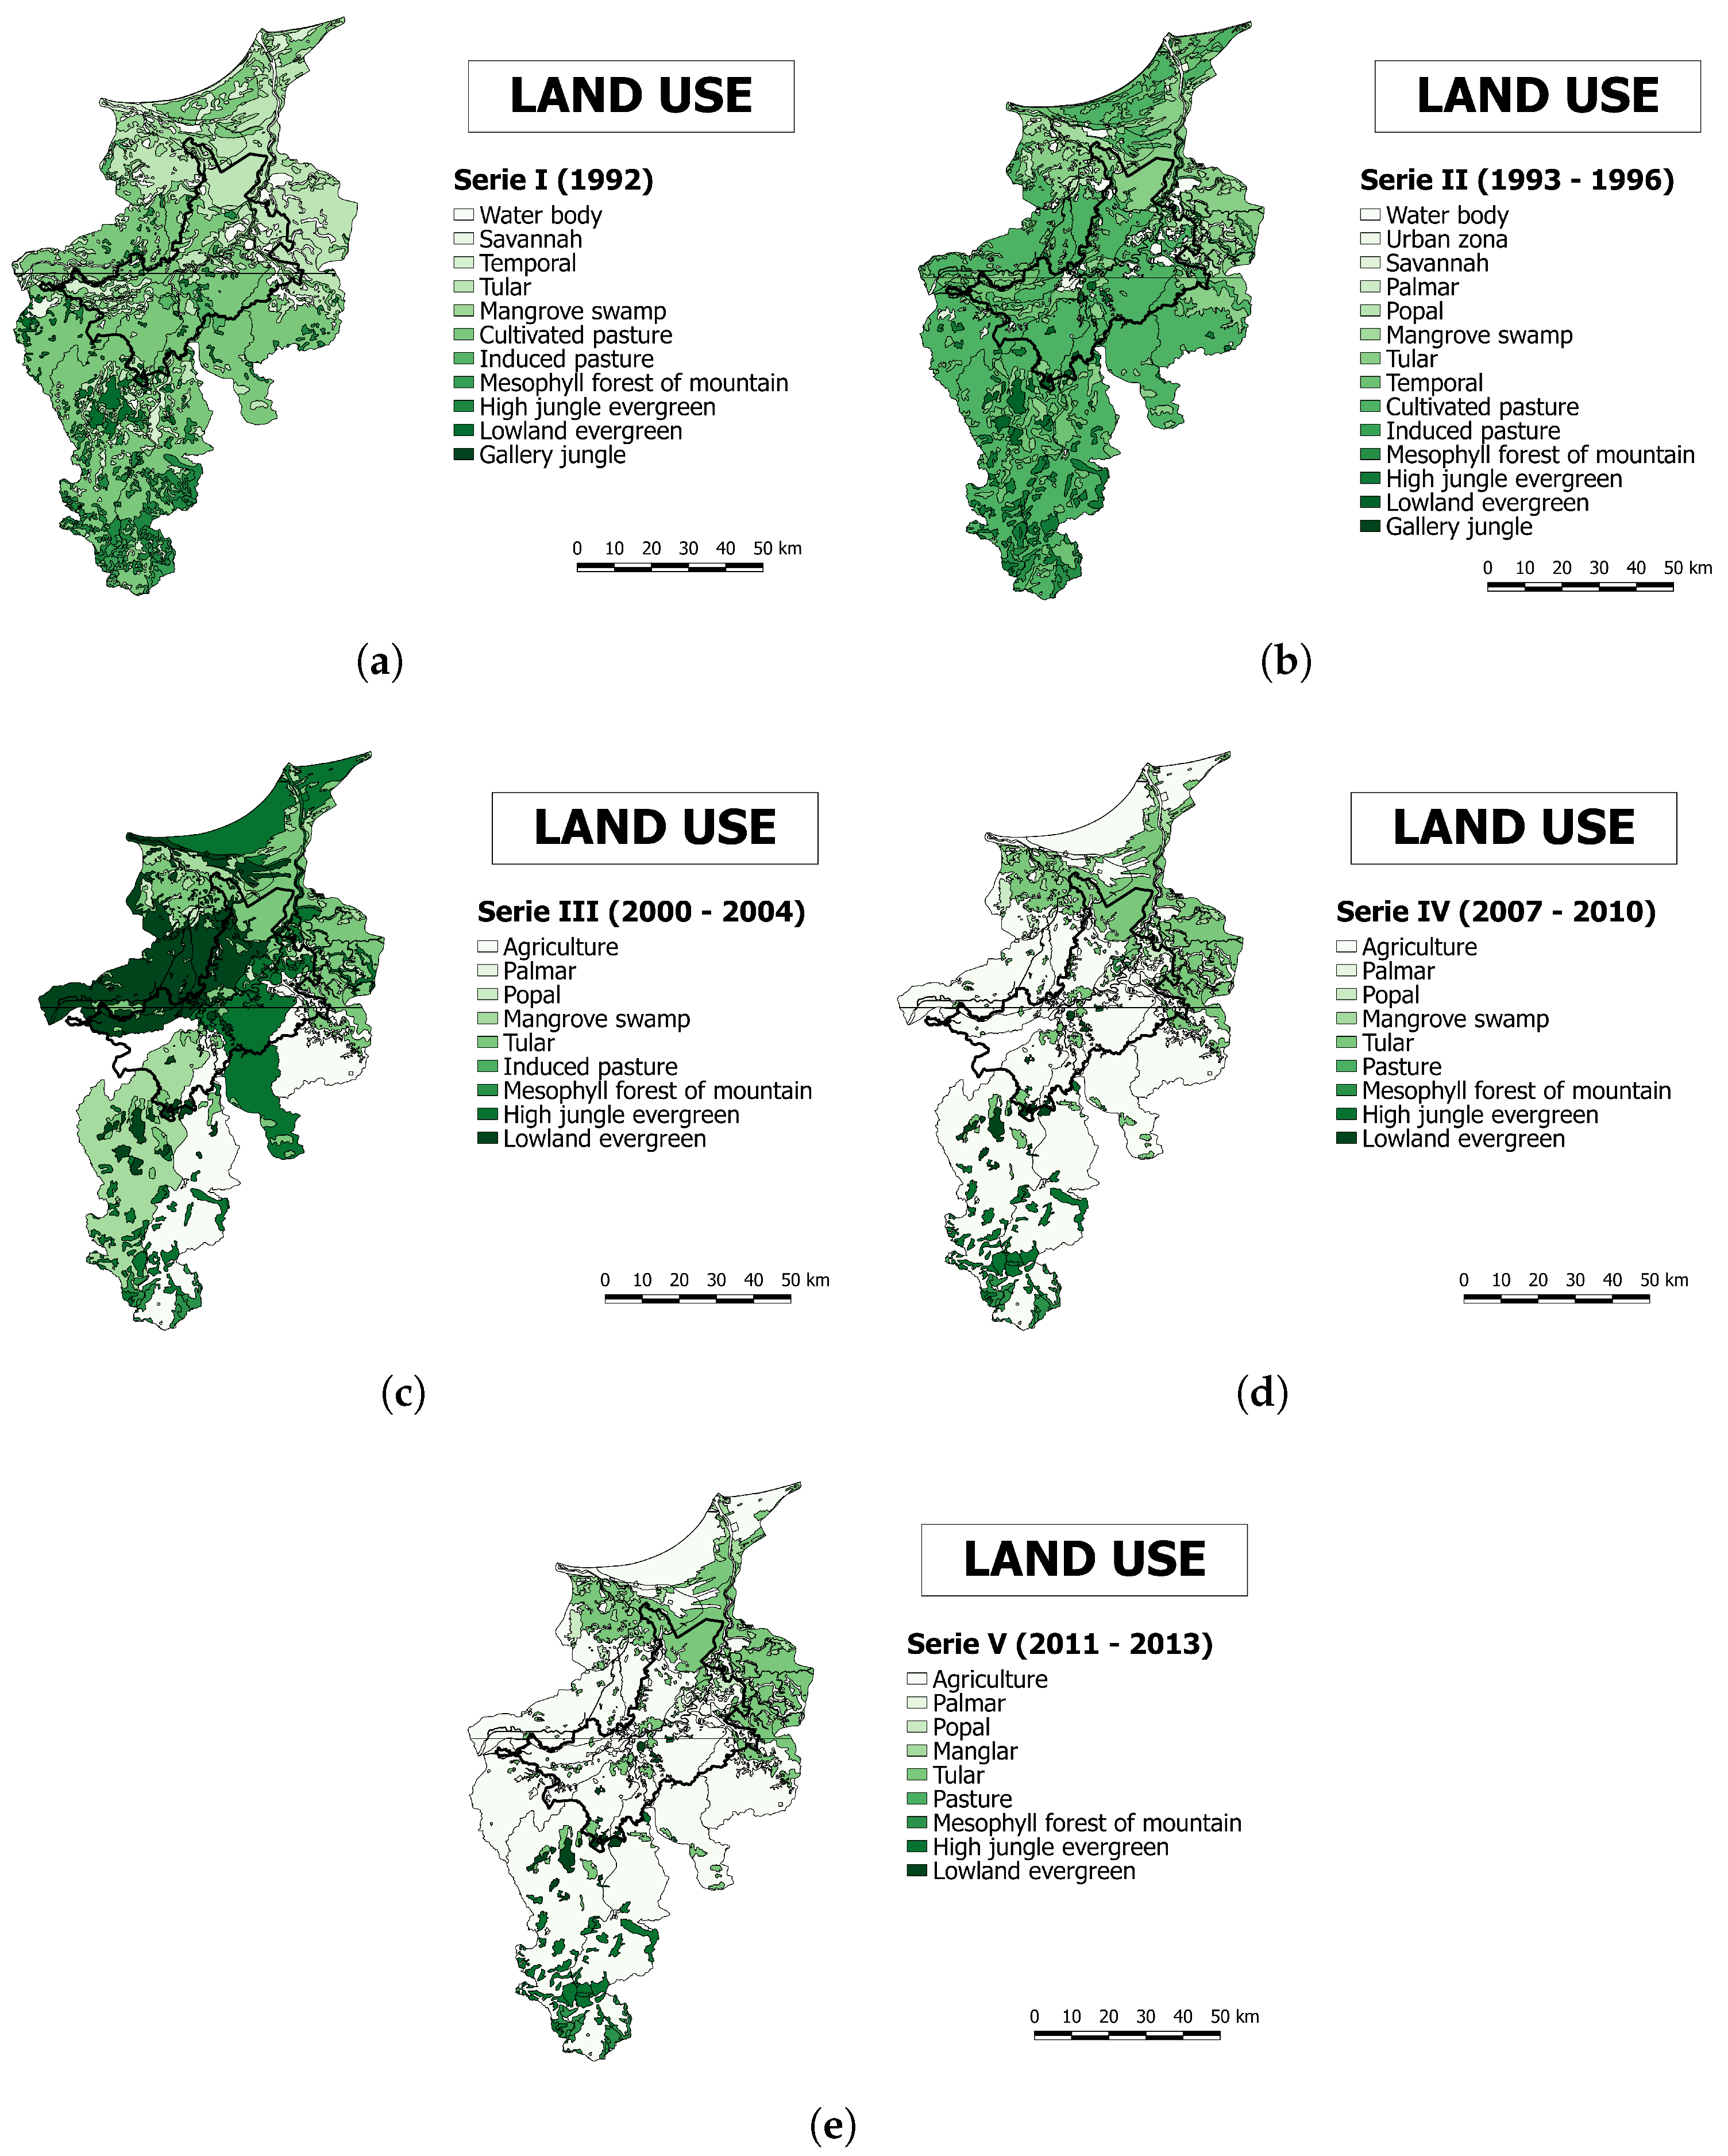
Information on the land uses of the catchments under study over recent years was provided by the National Institute of Statistics and Geography (INEGI) [1]. Geospatial Information provided by INEGI [1] shows the distribution of agricultural land use, natural land, and induced vegetation in the country. It also indicates livestock and forestry uses and other uses that occur in the territory related to vegetation cover. The use of agricultural land is represented according to the availability of water for different types of crops during their agricultural cycle. The vegetation is represented in accordance with the provisions of the Guidelines for the use of the Catalog of Types of Natural and Induced Vegetation of Mexico for statistical and geographic purposes. INEGI’s information comprises five series that provide the spatial distribution of land use until 1992 (Series I), from 1993 to 1996 (Series II), from 2000 to 2004 (Series III), from 2007 to 2010 (Series IV) and from 2011 to 2013 (Series V). From the analysis of these data, it was observed that, from 1992 to 2013, the terrains located upstream of Villahermosa mainly changed from pasture cover to agriculture cover. Figure 2 shows thematic maps of land use that have been reconstructed from all the available land use data. Table 2 shows the correspondence of land use types with their curve numbers, as well as the medium curve numbers for Series I and V.
To analyze the impact that changes in land use have on the inundation levels, the flood discharges for the return periods of 10, 25, 50 and 100 years were calculated using the curve numbers (N) corresponding to the land uses of Series I (1992) and Series V (2011–2013). Table 3 summarizes the parameters and coefficients used in Equation (1). The effective precipitation depths and flood discharges calculated for each return period are shown in Table 4.
3. Flood Inundation Model
The inundation scenarios in Villahermosa were modeled with the software Iber [18]. This numerical model solves the 2D shallow water equations to compute the spatial distribution of the water depth and the two horizontal components of the depth-averaged velocity. The shallow water equations were solved with an explicit unstructured finite volume solver. The performance of the software Iber could not be validated in the study area because there are no available historical data to do so. However, the model has been extensively validated and applied in previous studies related to river inundation, tidal currents in estuaries, and rainfall–runoff modeling [21,22,23,24,25,26,27], showing its ability to represent 2D free surface shallow flows and river inundation processes. The 2D shallow water equations solved by the software Iber are a high-fidelity physically-based model, and they were assumed to be the best representation of the inundation process for the purposes of this work. The only parameter to calibrate in the equations is the Manning coefficient. Plausible values of this parameter can be established from River Engineering Manuals, considering the land uses in the study area. Those values are expected to give a good approximation of the inundation extent [28,29].
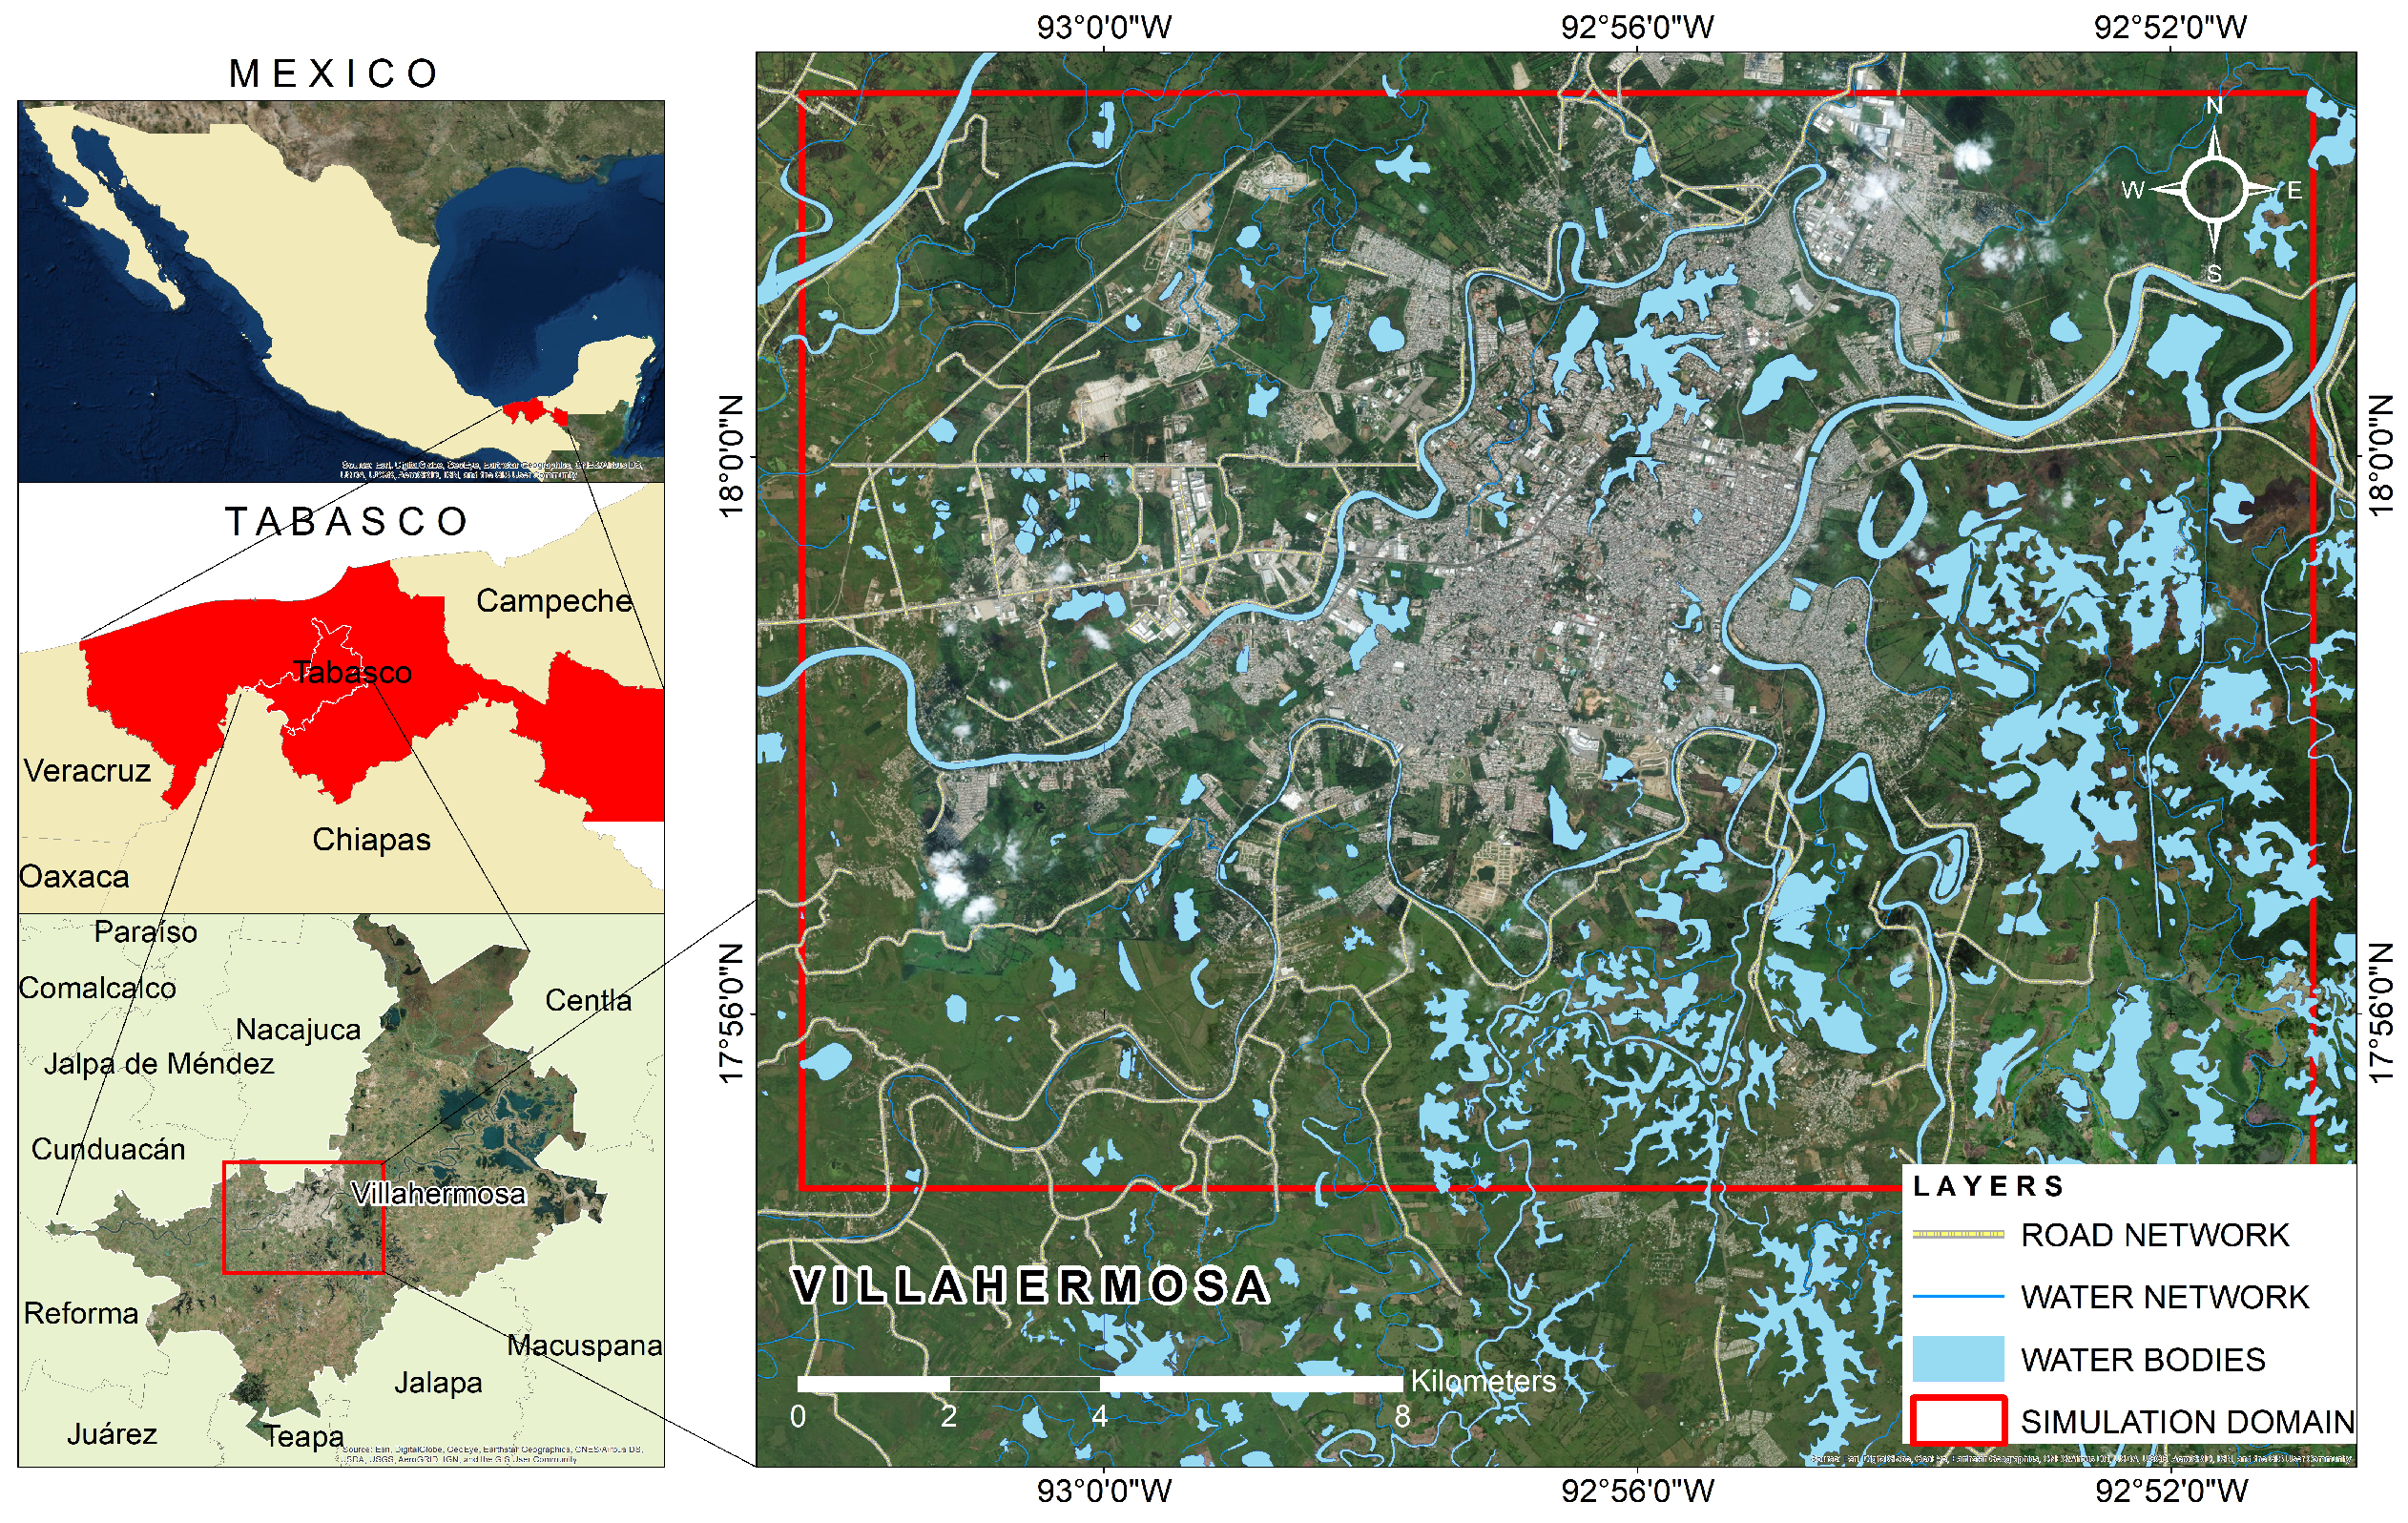
Figure 3 shows the location map of the area under study. In the figure, the city of Villahermosa plus water networks and water bodies are presented. The computation domain, which is delimited by a red line, extends over an area of 290 km2. It encompasses the entire city and the rural areas surrounding it that have been most affected by historical inundation events.
The study area was discretized with an unstructured mesh to obtain different levels of spatial resolution in the different zones of the spatial domain. After some preliminary tests to evaluate the effect of the mesh size on the results, an unstructured triangular mesh of 281,289 elements was generated, with element sizes of 50 m in the urban areas, 100 m in the agricultural areas, and 15 m in the main river channels.
Three land uses were considered within the simulation domain to characterize surface roughness: urban, agricultural and river main channel. Given the dense and complex urbanization pattern of the city, it was not possible to define in the numerical model an explicit representation of buildings. As an alternative, the effect of buildings on drag resistance was accounted for using an augmented Manning coefficient to characterize the surface roughness in the urban districts. This kind of approach has been used in previous studies, such as by Liang et al. [30], Neelz and Pender [31] and Huang et al. [32]. Here, we used the formulation proposed by Huang et al. [32] to obtain the augmented Manning roughness based on the blockage percentage of buildings. From airborne photography, the buildings’ blockage percentage ratio was estimated to be 75–80%, which, according to the formulation of Huang et al. [32], gives a Manning roughness of 0.20 in the urban area. In the agricultural areas and in the river’s main channel, the Manning coefficients used were set to 0.12 and 0.035, respectively.
4. Results
4.1. Land Use Changes in the Catchments
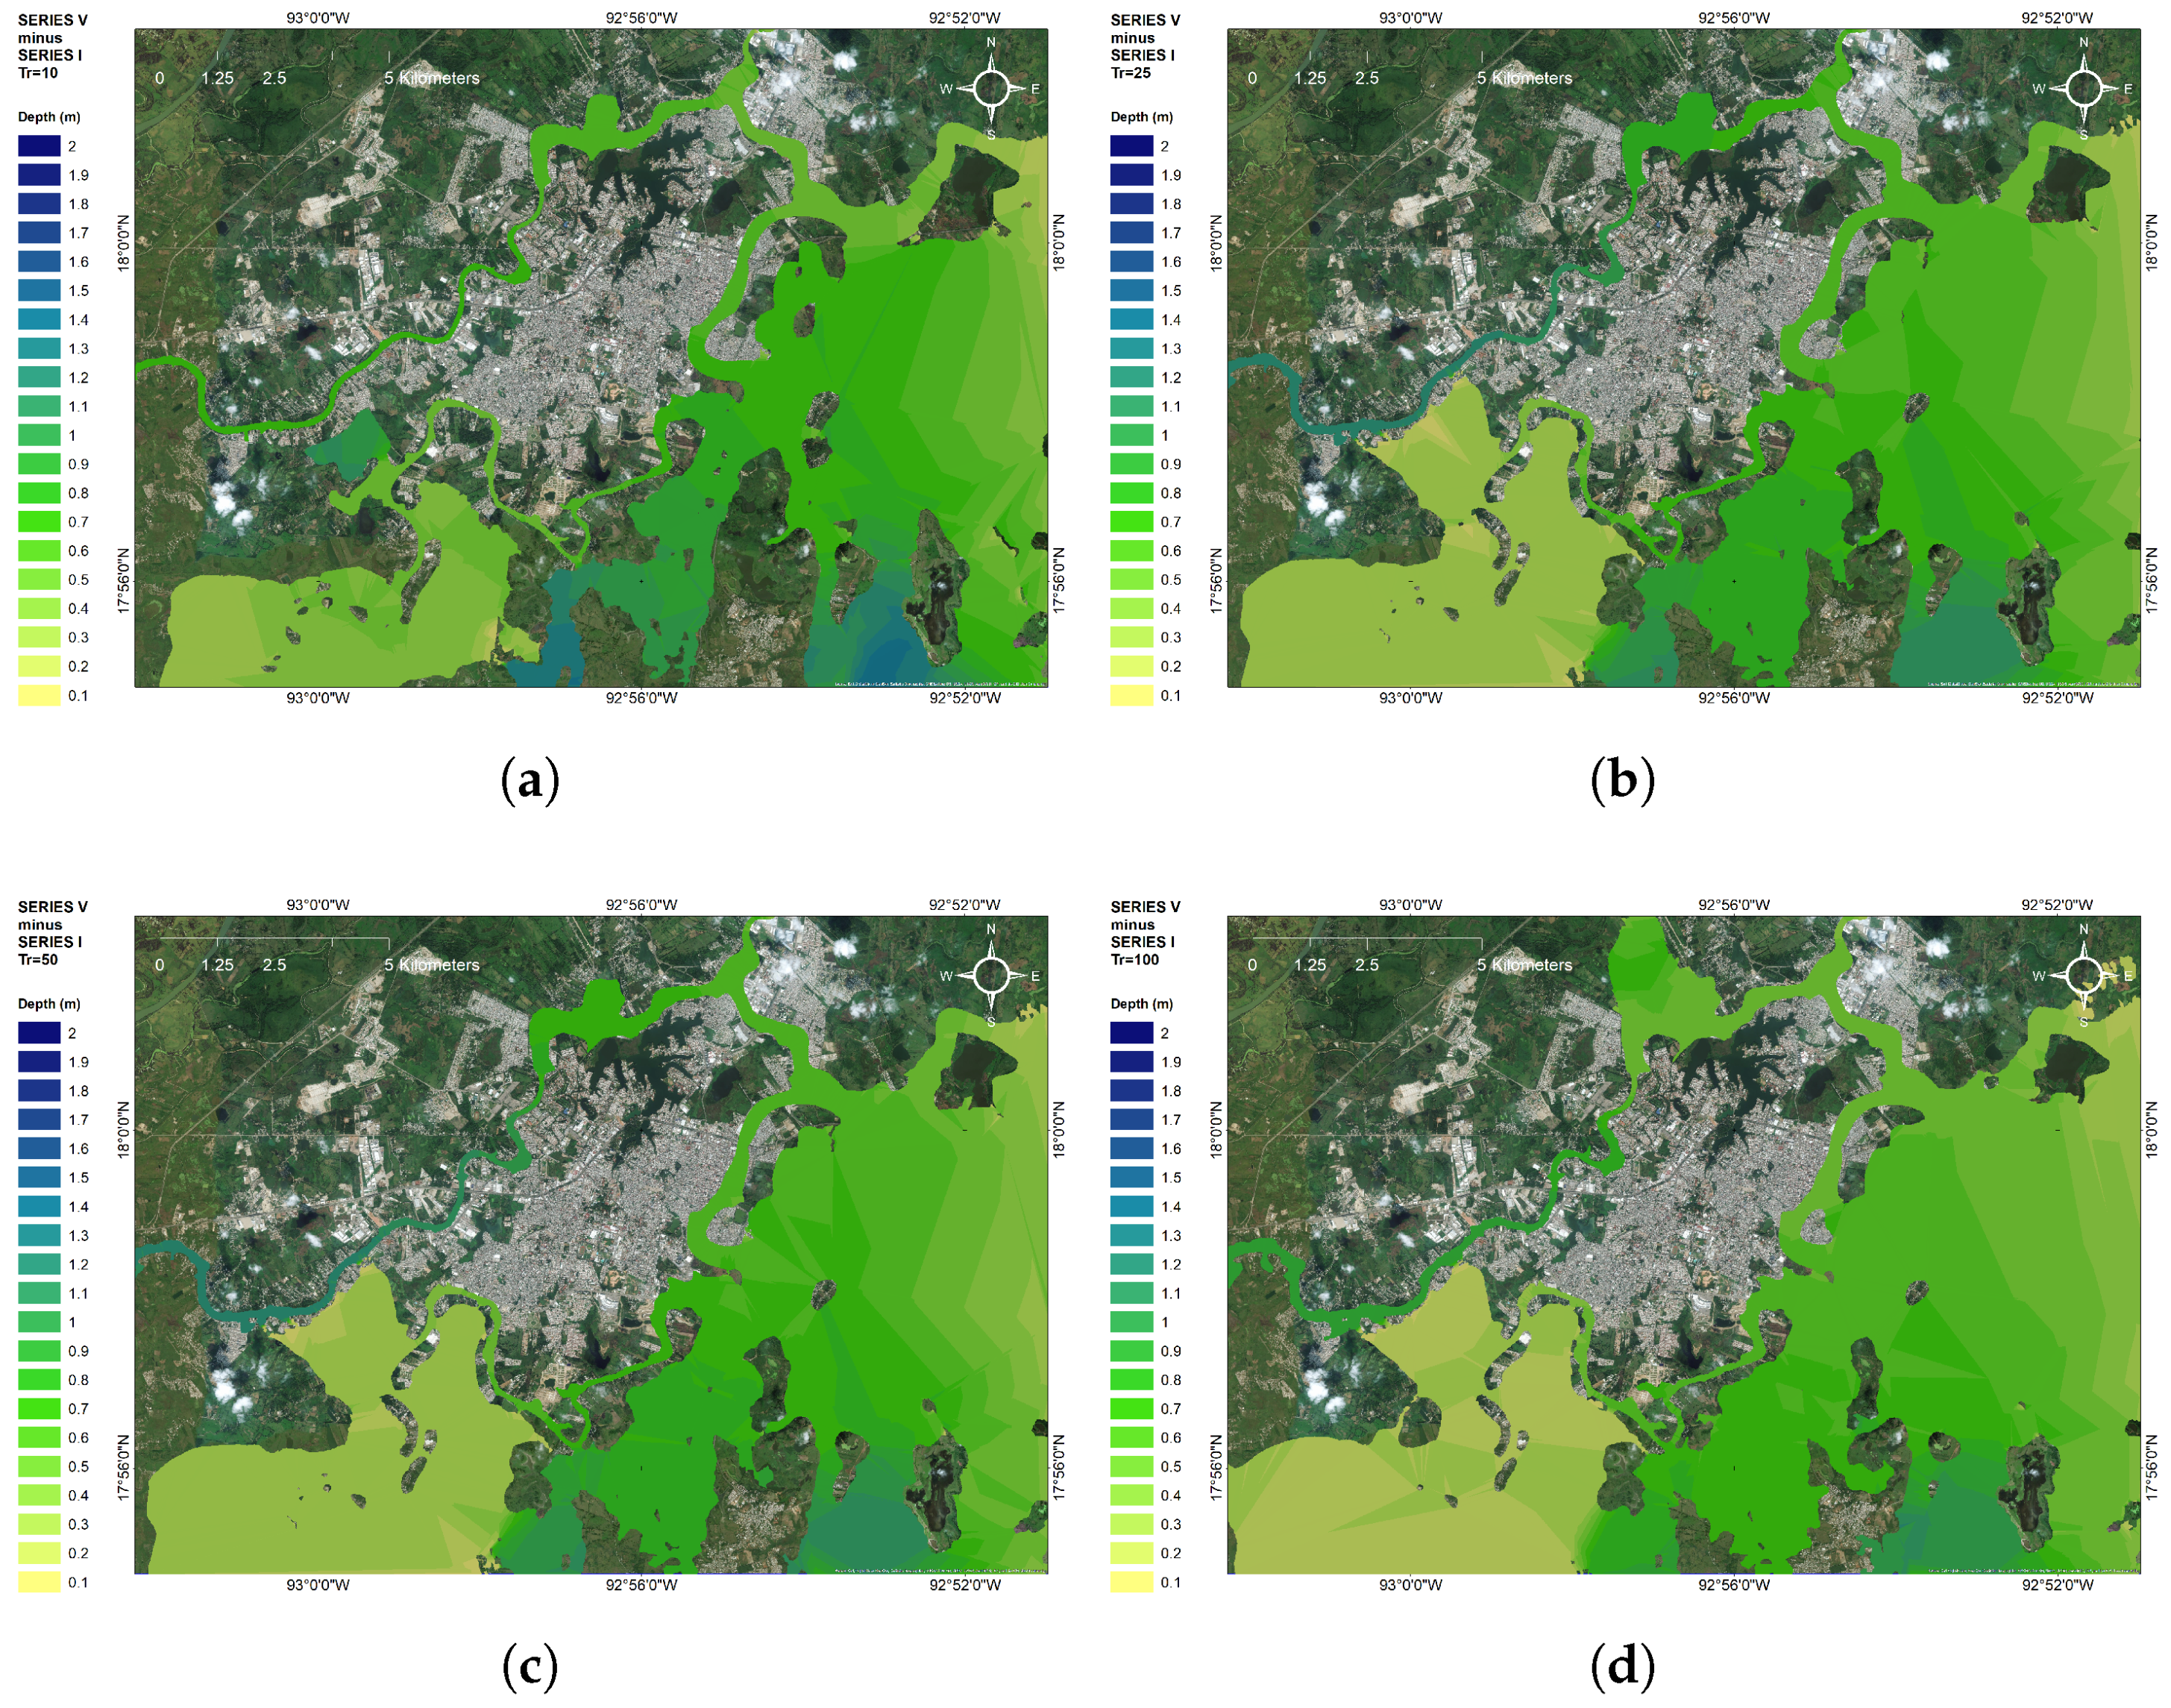
Figure 4 shows water depth differences computed for the flood discharges obtained with the basin’s land use of Series I and Series V, for different return periods. From a general qualitative observation of the maps, it is clear that, for lower return periods (10 and 25 years), the change in land use from mainly pasture soils (Series I) to agricultural soils (Series V) produces a significant increase in the flood depths, with maximum values between 1.0 and 1.6 m. These values are reduced to increases between 0.6 and 1.2 m as the return period increases (50 and 100 years).
In recent years, national news media have reported several floods hitting the city, as a consequence of tropical depressions and hurricanes. Heavy rainfall caused flood levels of over 1.5 m, especially in the neighborhoods of Gaviotas (located in the south and southeast of the city) and Tamulte (southwest of the city), resulting in damage to houses, hospitals and government offices. Maps in Figure 4 show that these neighborhoods, along with smaller neighborhoods in the south of the city, are the most affected by the increase in inundation levels due to changes in land use in the catchments upstream. This, in addition to the increase in frequency of extreme weather phenomena recorded over recent years in the area under study, increases the likelihood of serious damage due to flooding. Consequently, our results confirm the predisposition of these districts to be hit by high flood levels.
To quantify the average difference in water depth over the whole study area, the following flood depth index (DI) was computed:
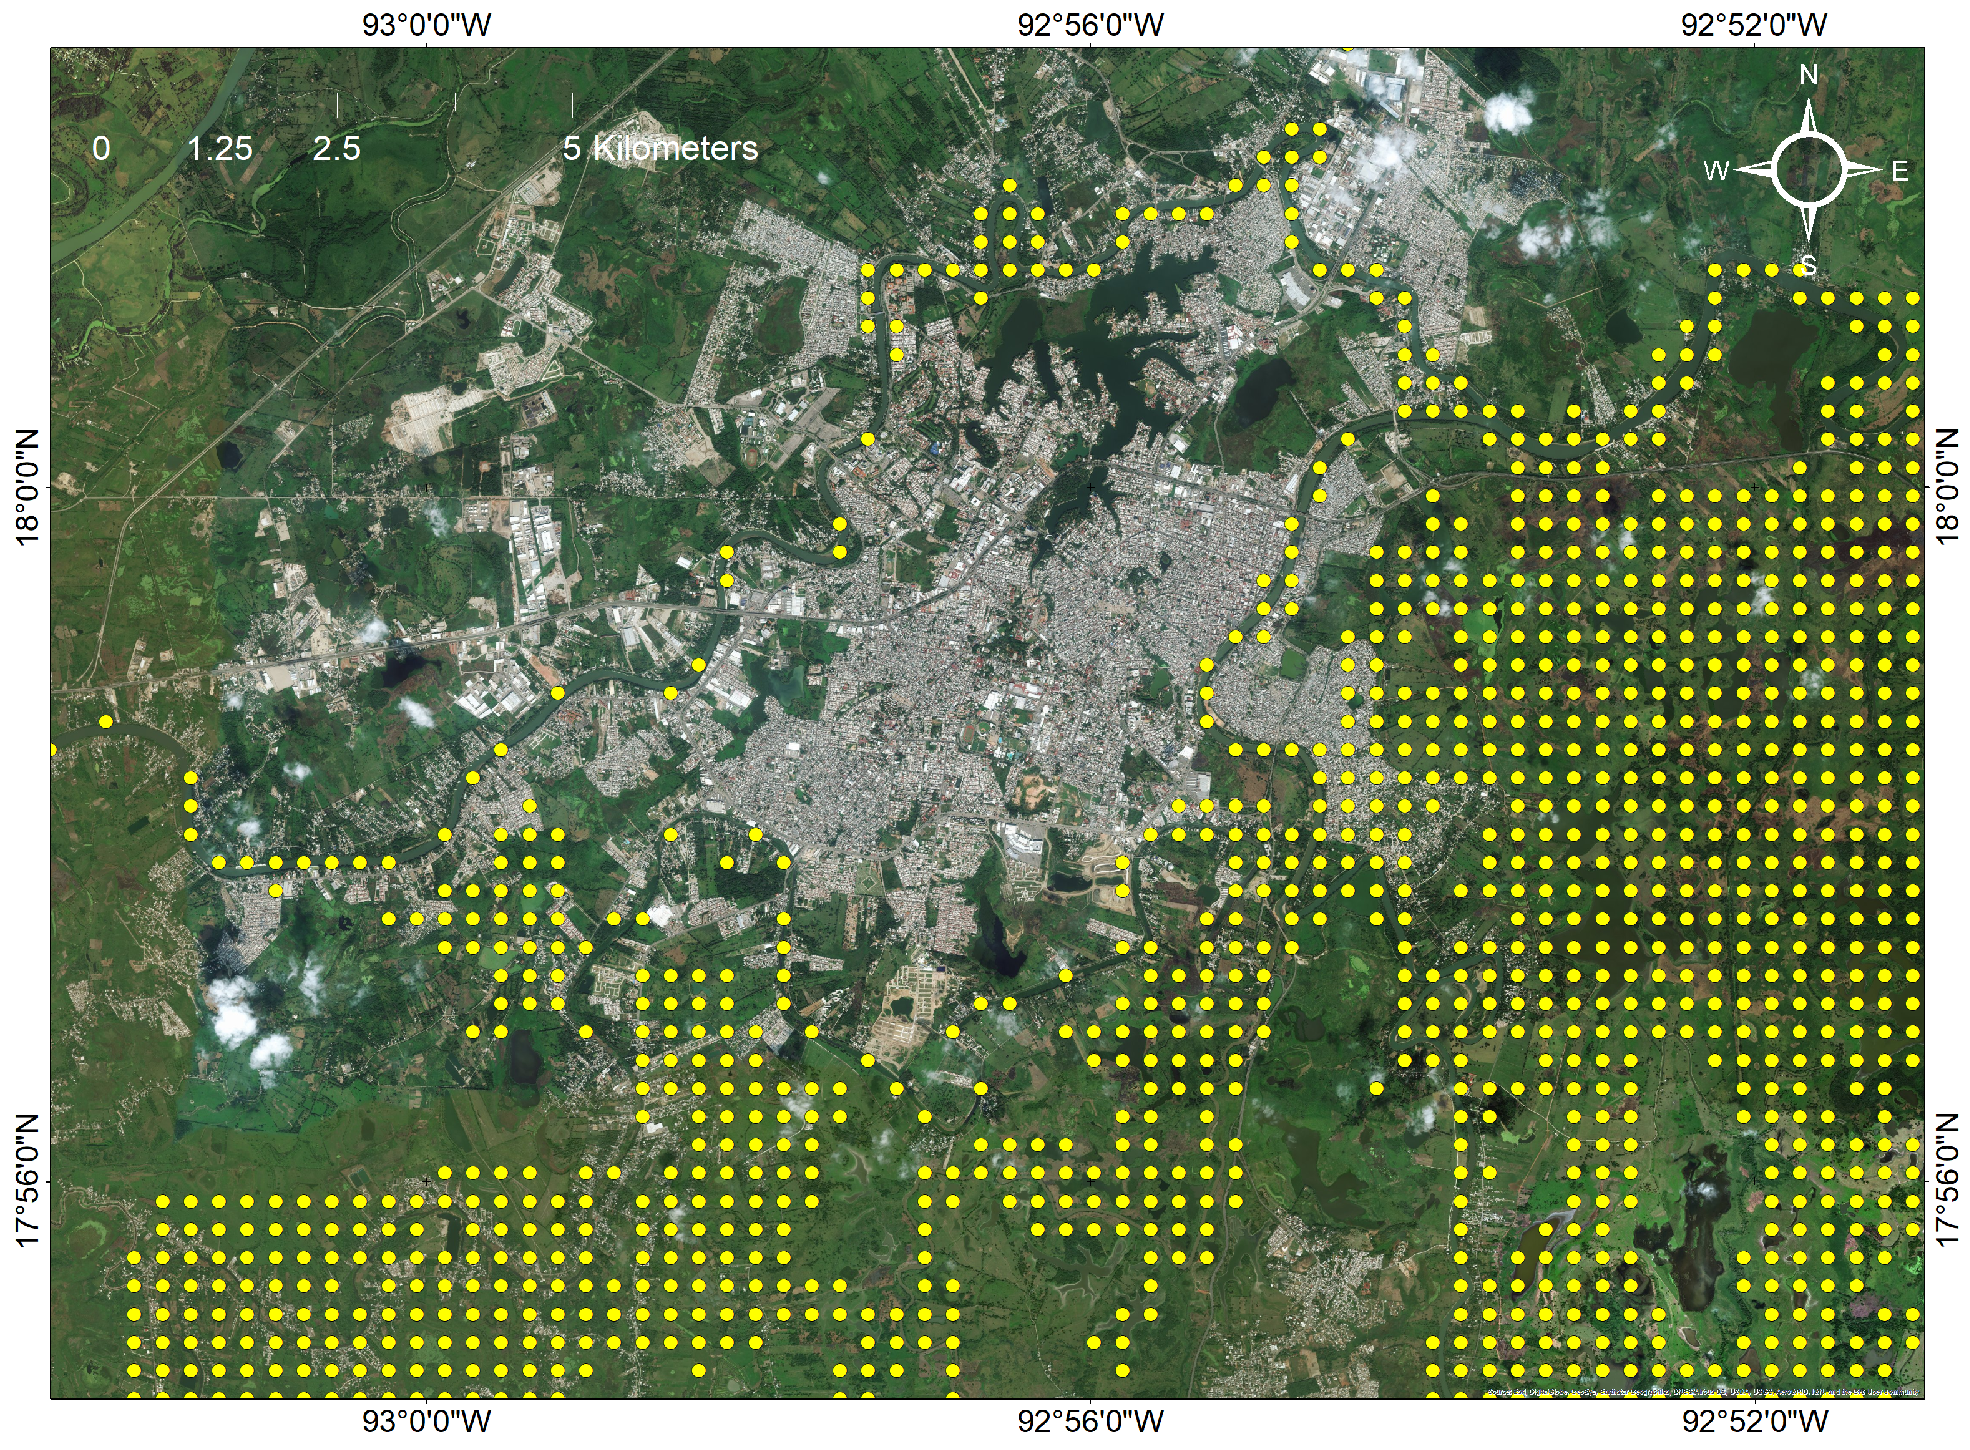
where is the flood depth at the control point i computed from Series I and Series V, and N is the number of control points, which are shown in Figure 5. To compute DI, the water depth was sampled at 1104 control points distributed over the flooded areas only, at a distance of 300 m from each other. Unflooded areas were not considered for the DI calculation. The depth index DI was computed for each return period considered in the analysis.
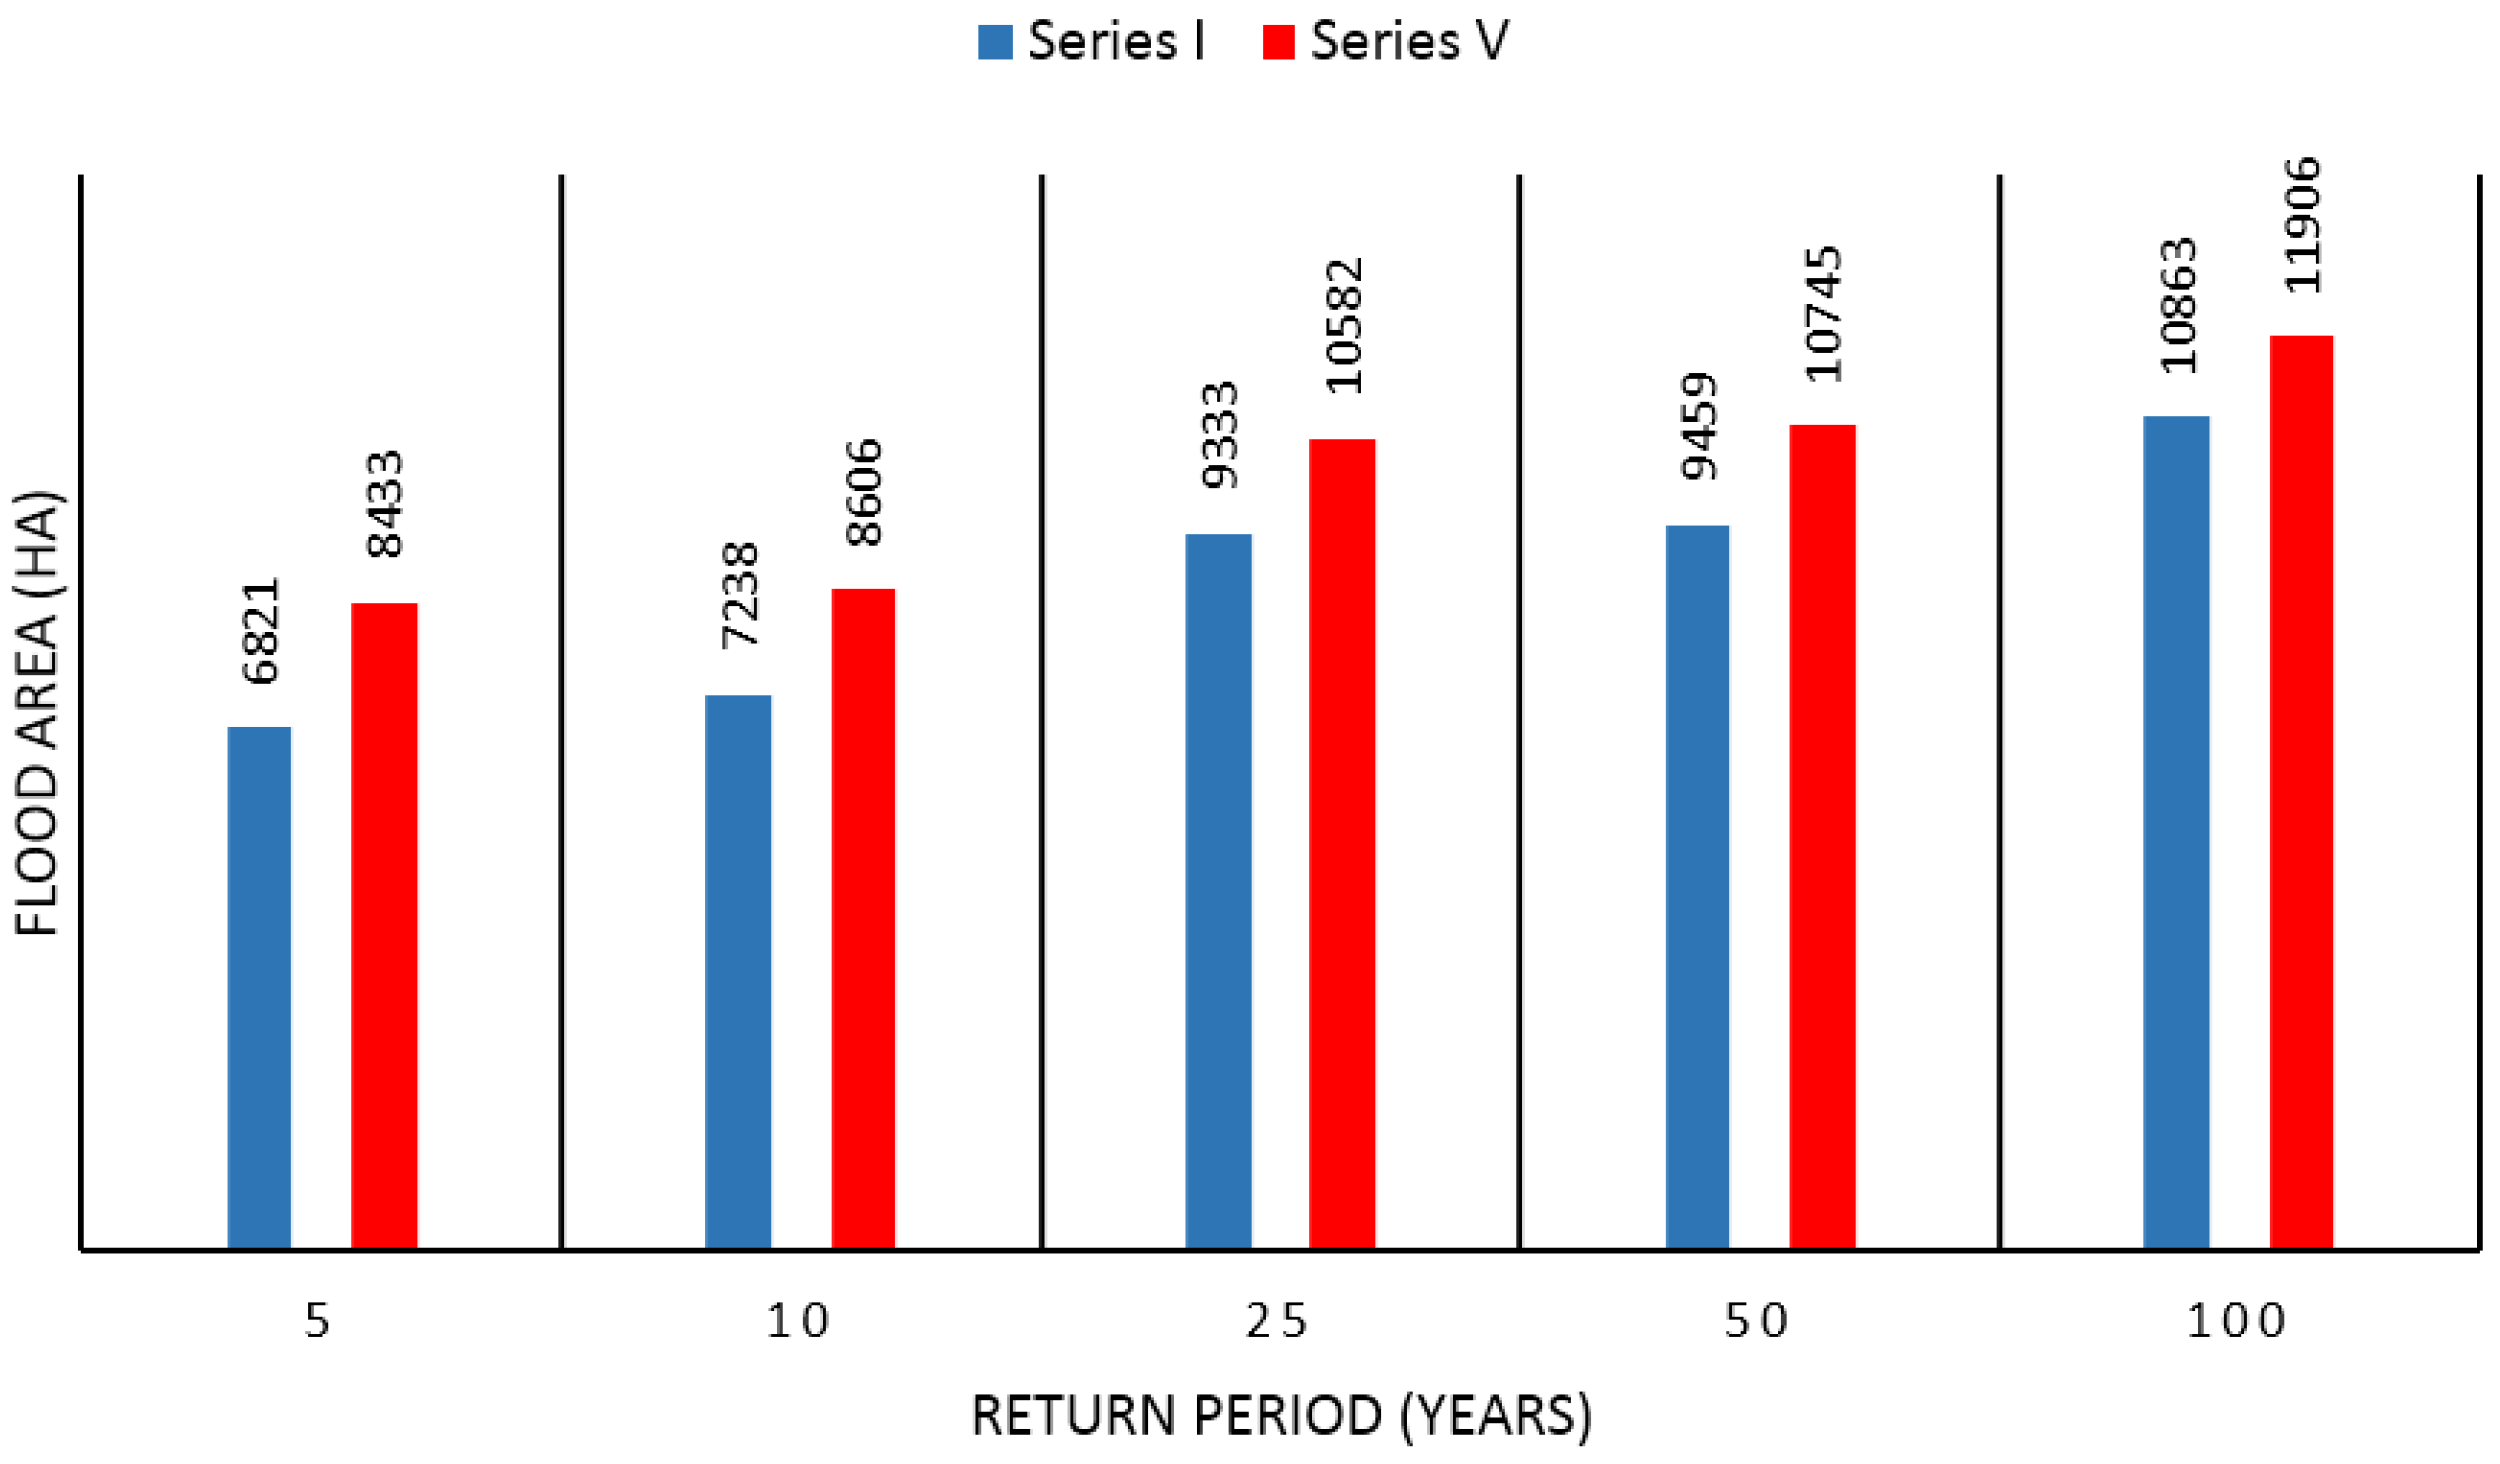
Table 5 shows the values of DI obtained for each return period. The values of DI indicate that the influence of changes in land use on the inundation levels is very notable. A measure of the effects of changes in land use on the flood level is also shown in Figure 6 where flood areas with water depths greater than 1 m are compared between Series I and Series V, for each return period.
4.2. Future Urbanization Scenarios
During the 1970s, the population of Villahermosa had approximately 100,000 inhabitants, settled in an area of 16 km2. Nowadays, the population is about 350,000 in an area of 50 km2. According to the population projections for the period 2010–2030 provided by the National Information System and Housing Indicators of the Secretary of Agrarian, Territorial and Urban Development of Mexico, in 2030, the population of Villahermosa will have risen at a rate of 0.50% per year. Extrapolating this population growth rate to 2050, it was estimated that the population will reach 496,381, settled in an area of 69.15 km2. This corresponds to an increase in the urban area of about 15 km2.
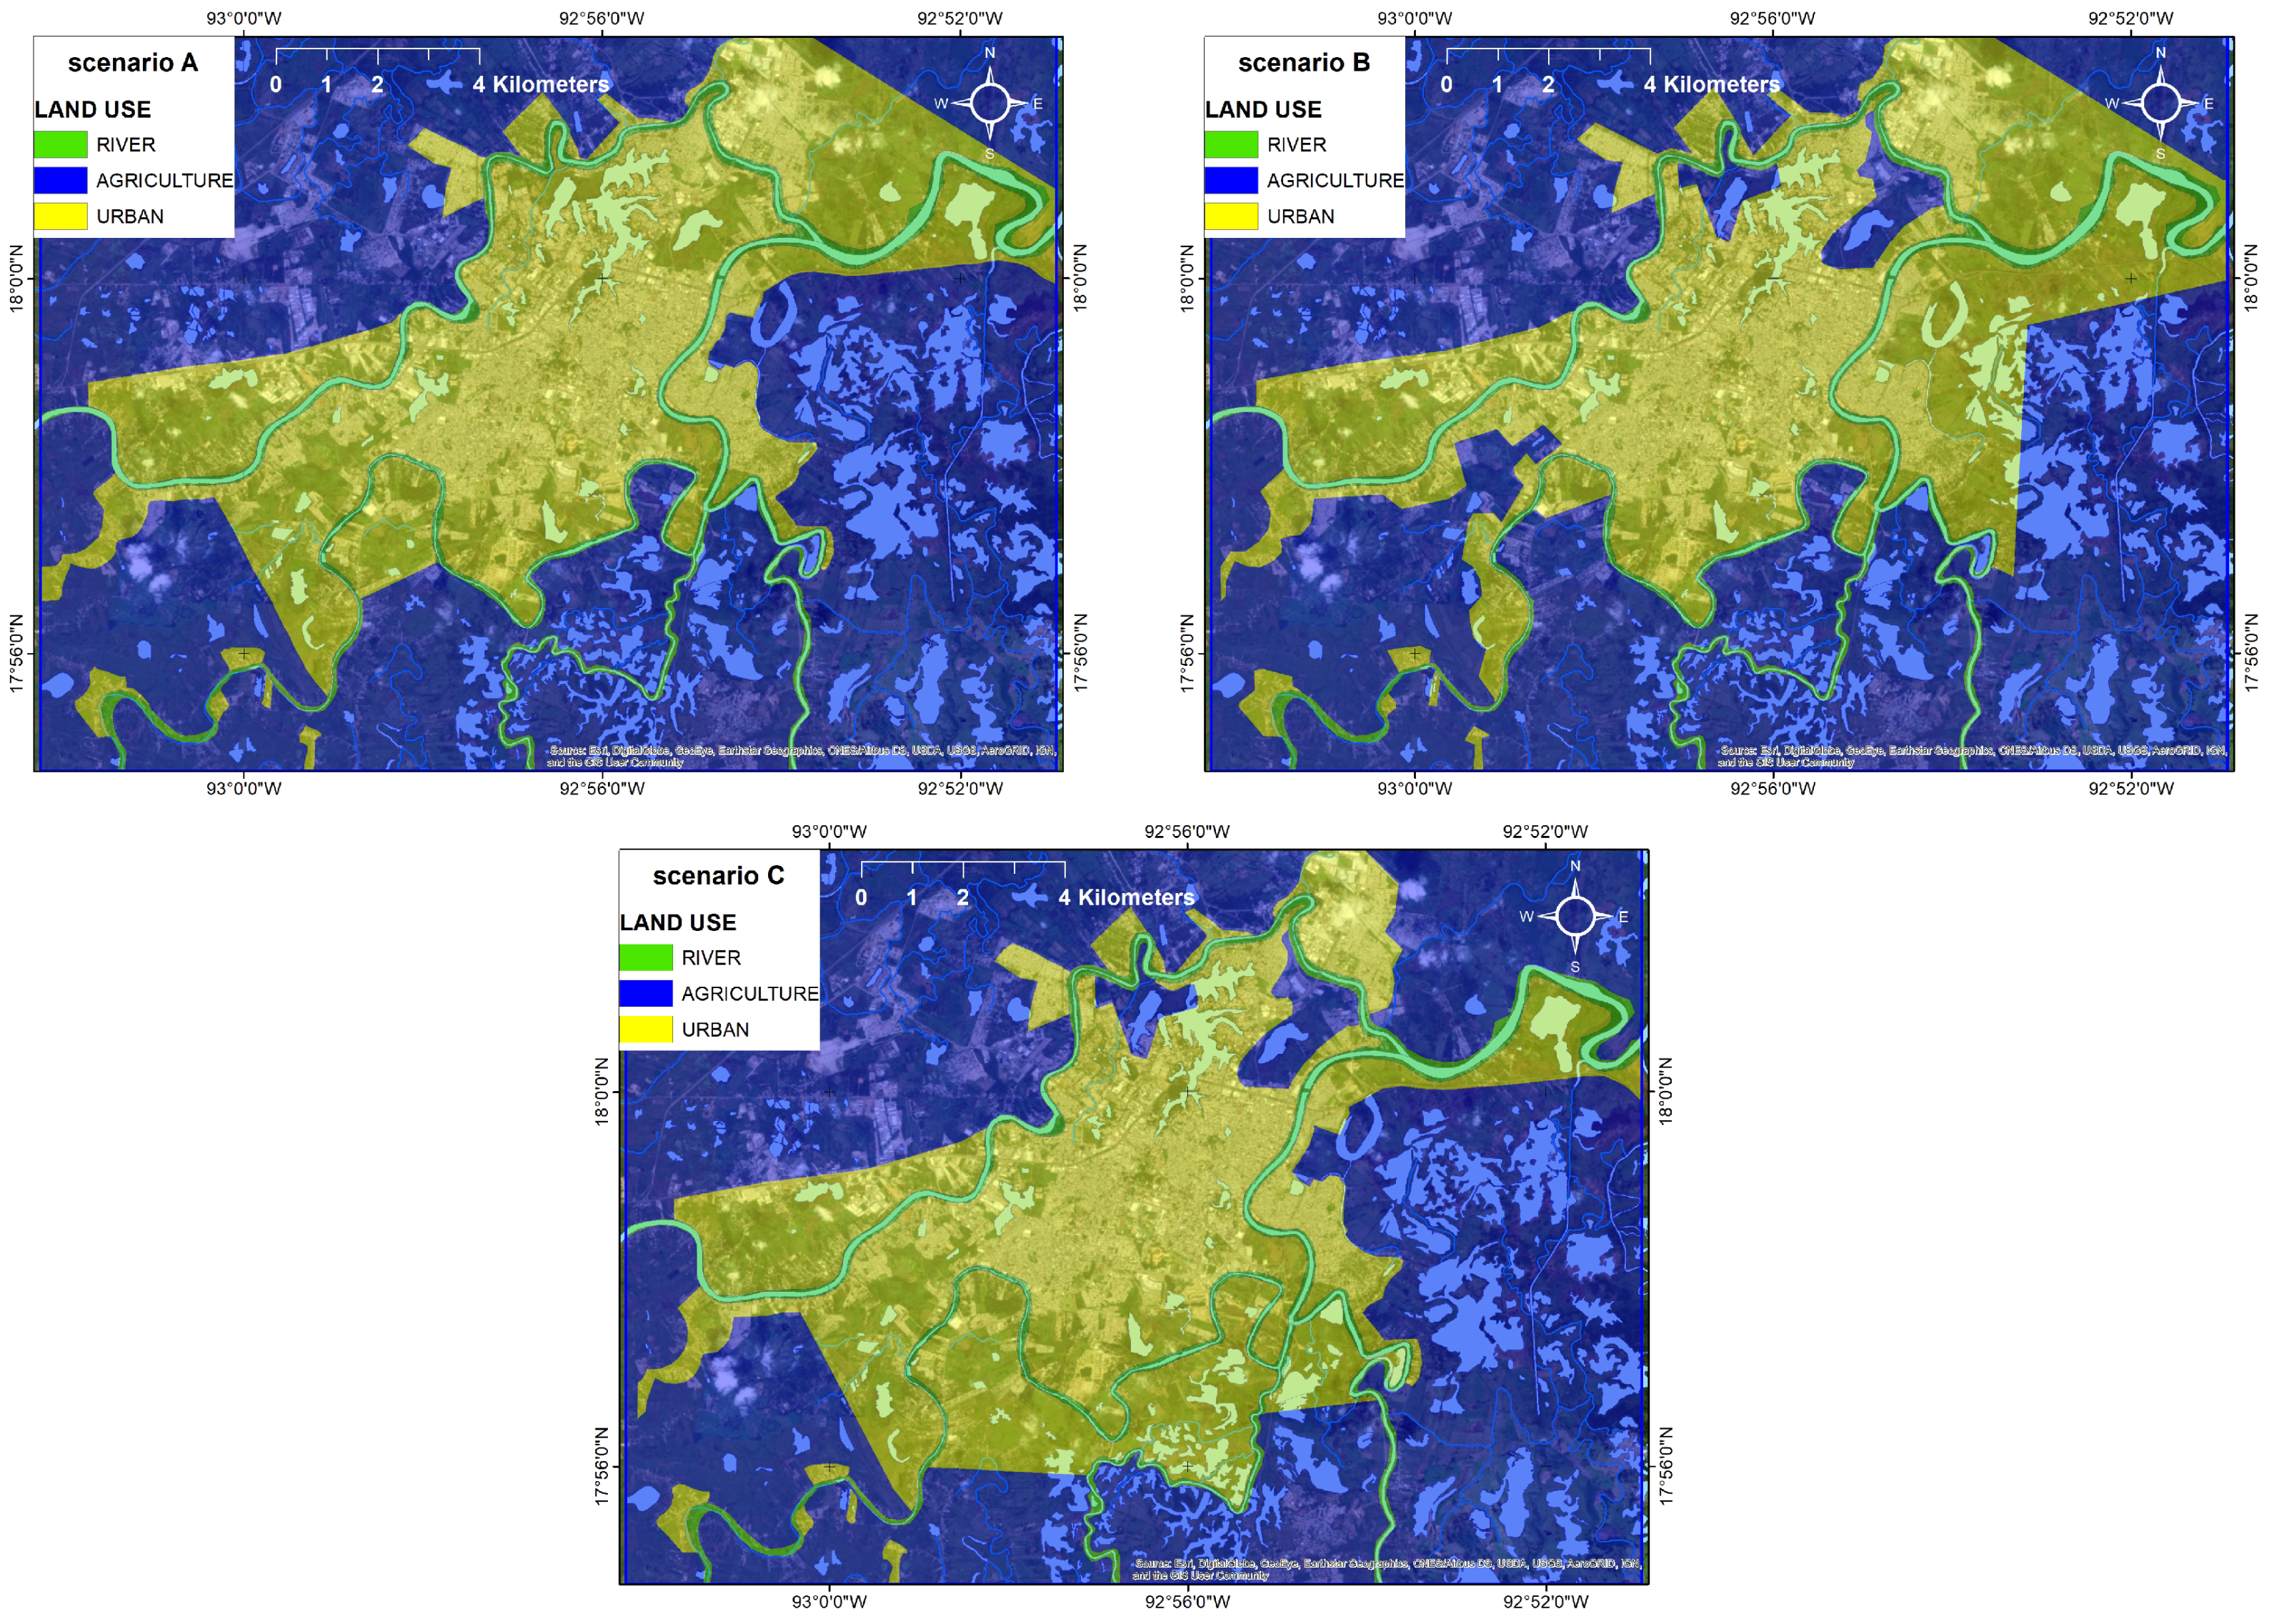
To analyze the impact on flood inundation of this urban expansion, three urbanization scenarios have been proposed, taking into account the areas that are most prone to future urbanization. The plain areas of the city, as well as the land covered by agricultural soil, were considered to be the districts with the highest probability of being urbanized in the coming years. Figure 7 presents the three proposed urbanization scenarios, which will be referred to as Scenarios A–C. In Scenario A, the new urban districts are located to the southwest–northeast of the city, at the entrance of the Carrizal River and at the exit of the Grijalva River. Scenario B assumes a future expansion of the urban area towards the east of Villahermosa, at the exit of the Grijalva River. Finally, in Scenario C, it is assumed that the city will grow towards the south. For each of these scenarios, inundation depths were computed for the flood discharge corresponding to the return period of 100 years and the land uses of Series V (see Table 4).
The computational mesh and numerical parameters used in these simulations, as well as the Manning’s coefficients assigned to each land use, are the same as those described in Section 3. Thus, the only difference among Scenarios A–C is the extension of the urban districts and, thus, the spatial distribution of the Manning’s coefficients.
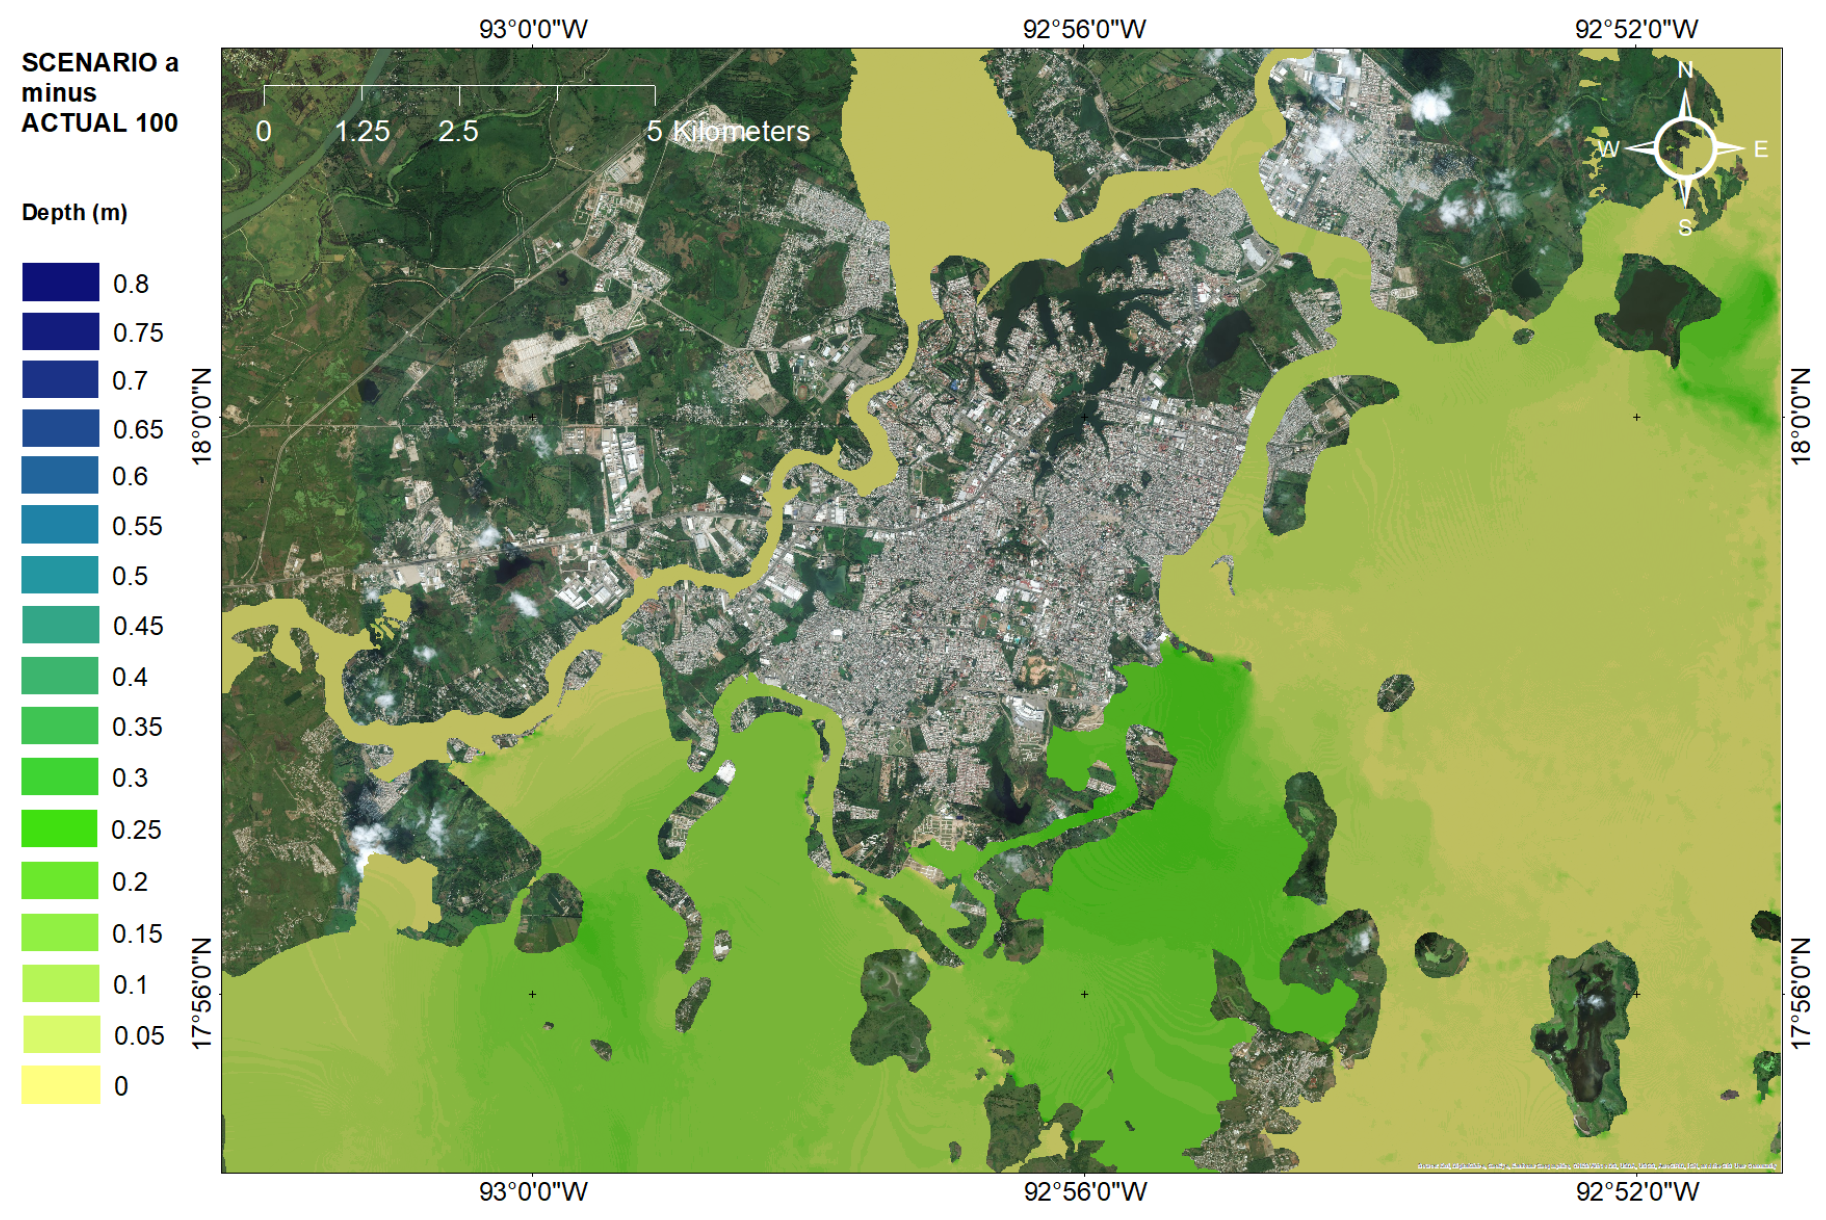
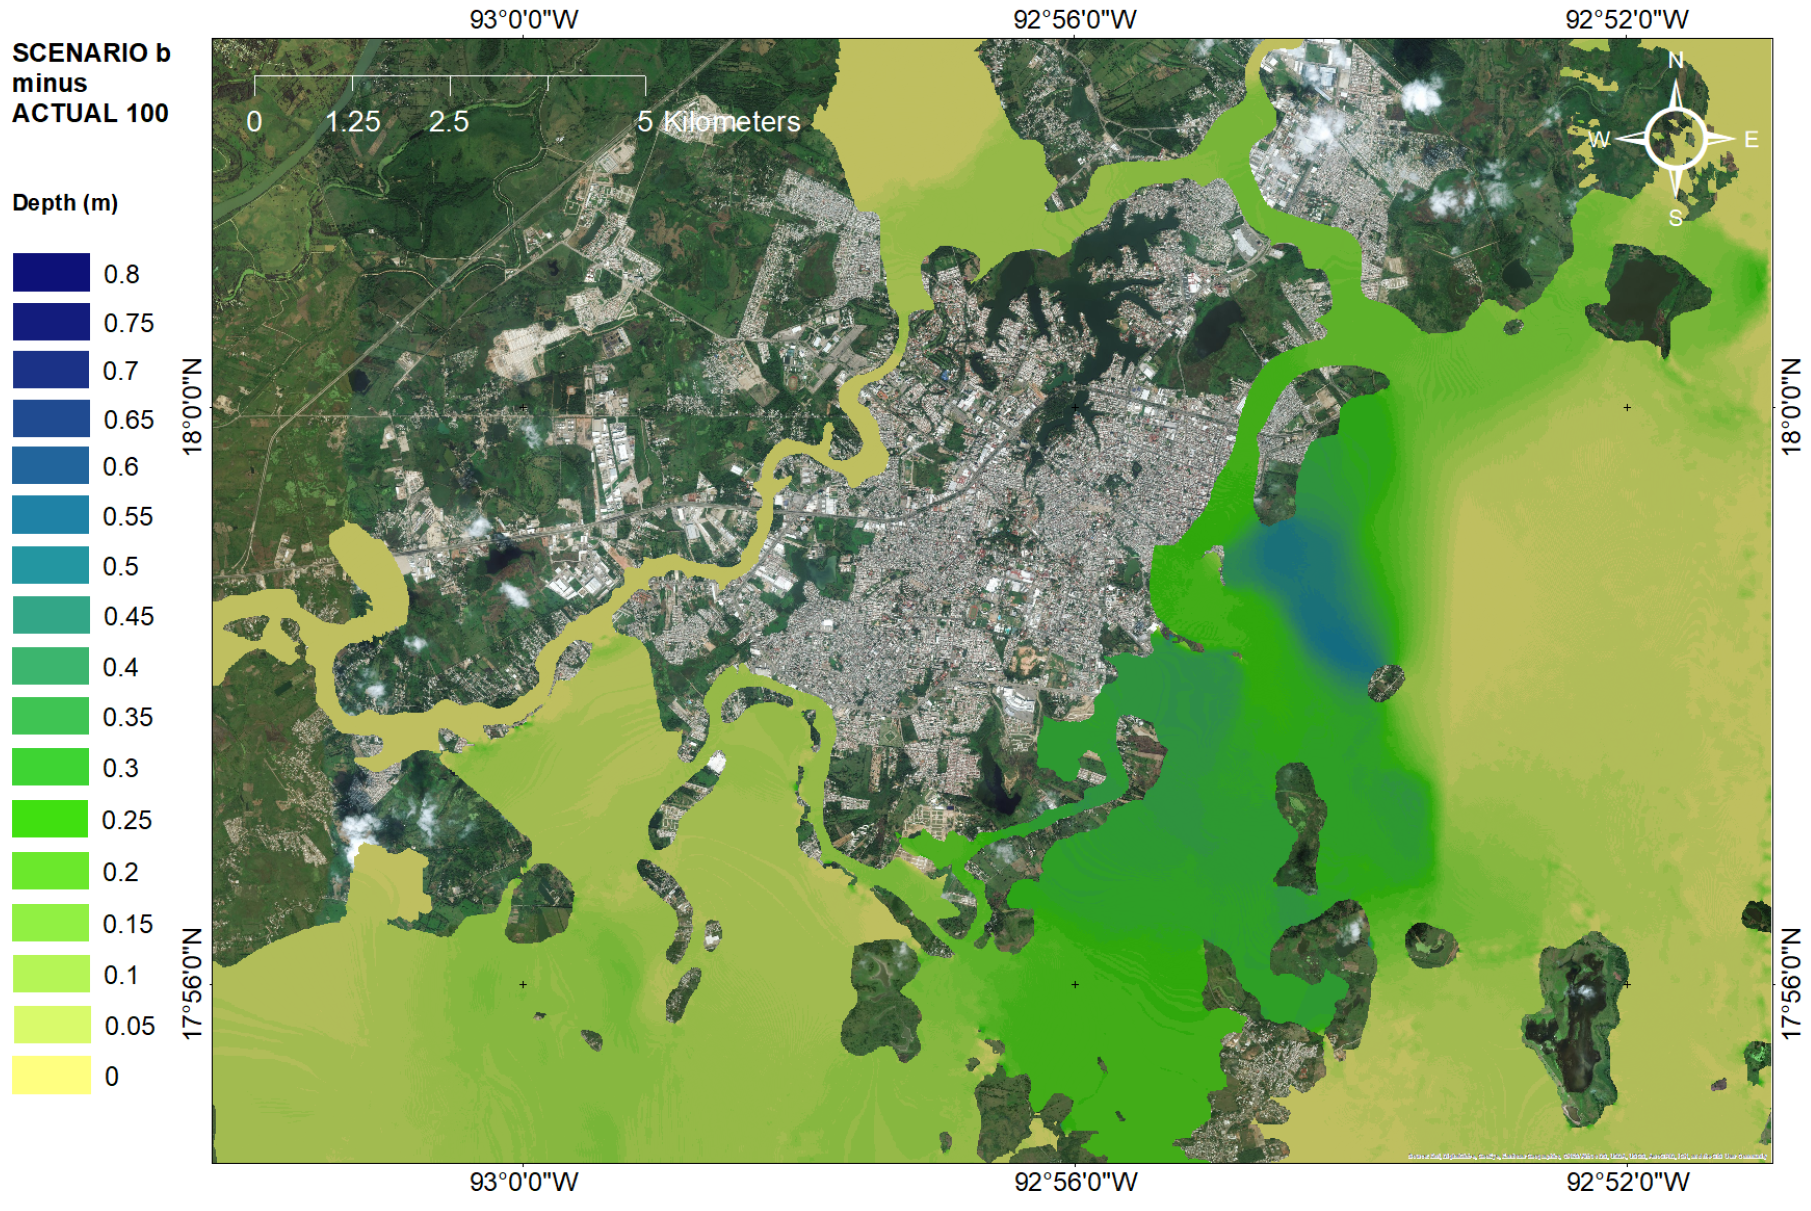
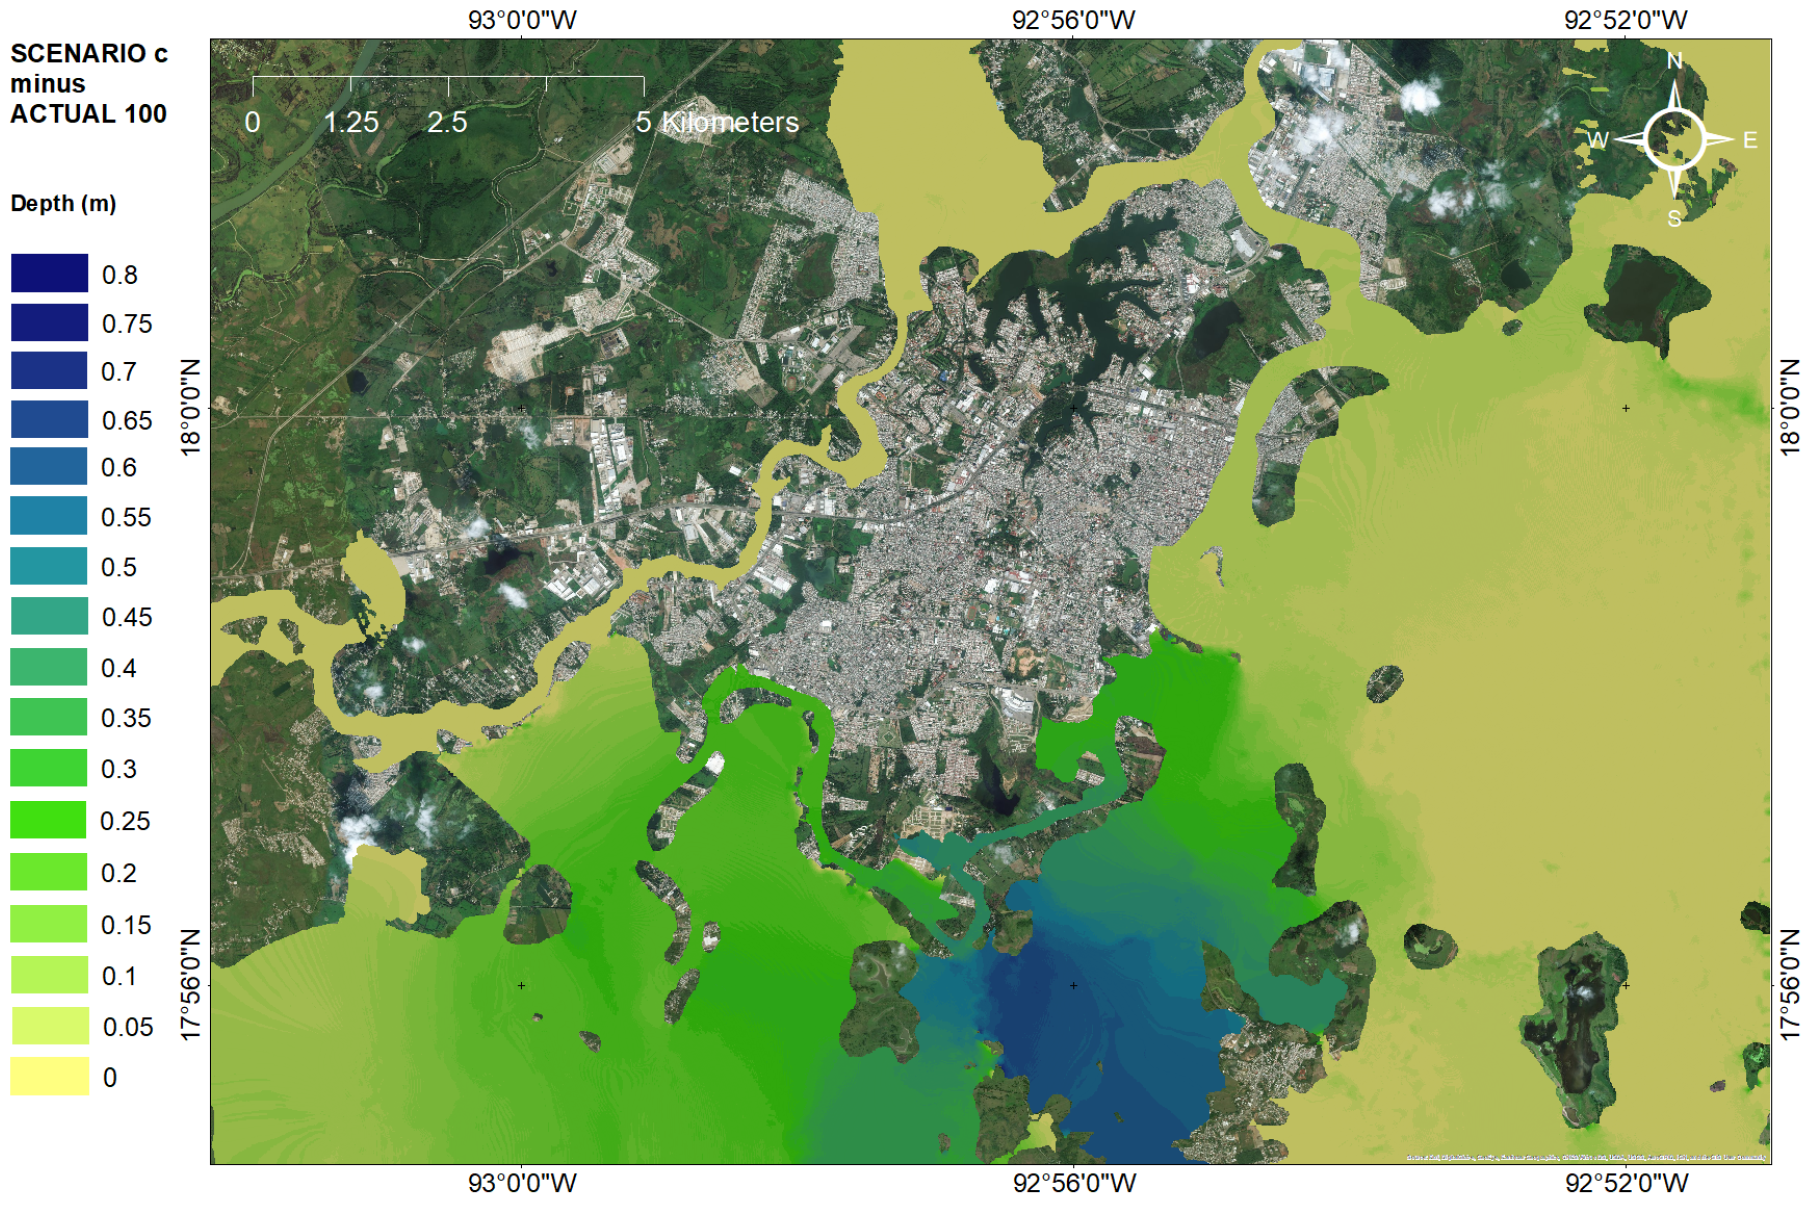
Figure 8 shows the increase in inundation depths in Scenario A with respect to the present situation. Under this urbanization scenario, a future flood would produce an increase of water levels of up to 0.3–0.35 m. Figure 9 shows the difference in water depths between Scenario B and the present. In this case, the increase in water depths would be of 0.55 m at the east of the city, one of the most affected areas today. Finally, Figure 10 shows that, under Scenario C, the increase in inundation levels would reach 0.7 m in the rural area to the south of the city, and 0.45 m in the urban area.
Table 6 shows the calculated Depth Index defined by Equation (6). Compared to the present urbanization of Villahermosa, the relative increase in water depth in the whole city is of 1.5%, 3.3% and 4% for Scenarios A–C, respectively.
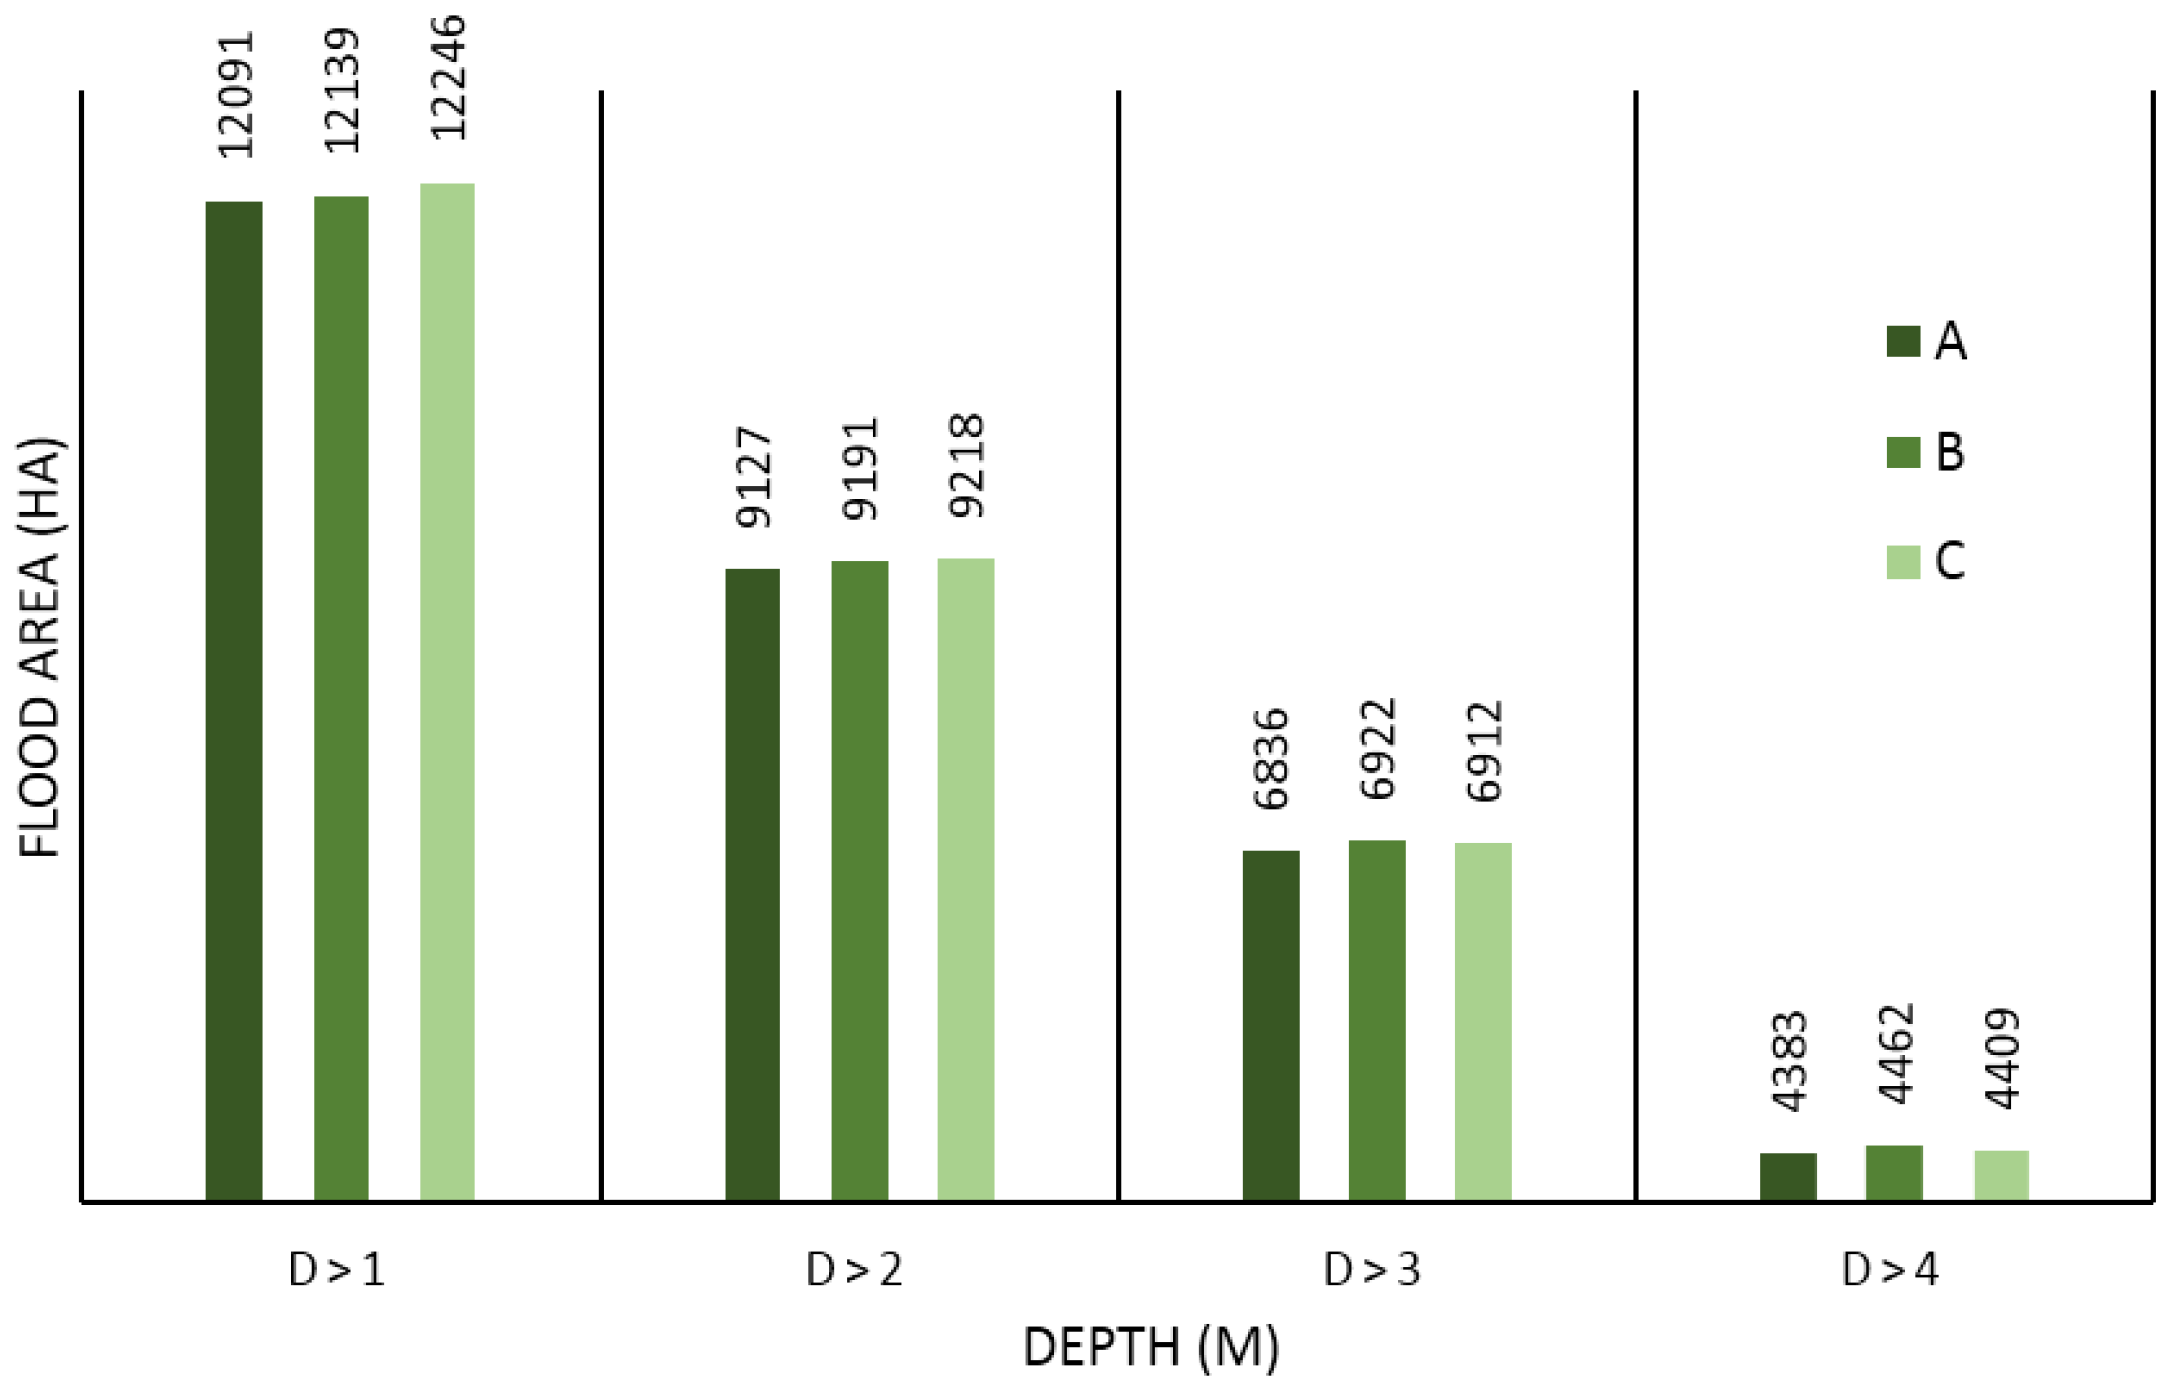
Table 7 shows, for each urbanization scenario, the extension of the flood areas where the water depth exceeds a given threshold of 1, 2, 3 and 4 m. The extension of the flood is similar for urbanization Scenarios A–C (Figure 11 and Table 7) with a slightly greater increase found in the case of Scenario C. Although the expansion of the urban area does not seem to have a considerable effect on the increase of flood levels, especially when compared to the effect of changes in land use in the basins (Table 7 and Figure 6), urban expansion should not be overlooked. In fact, it is important to bear in mind that, since the 1980s, flooding events have increased in the city of Villahermosa, causing unprecedented damage. This was mostly due to uncontrolled demographic growth since the end of the 1970s, which led to the legal and illegal expansion of the urban area within the districts most prone to flooding [4]. The areas currently at flood risk, located on the edge of the rivers that cross the city, run the risk of being even more vulnerable in the event of any further expansion of the urban area.
5. Conclusions
Results show that, for relatively frequent inundation events (return periods up to 50 years), changes in the basin’s land use cause an increase of maximum water depths in the city of up to 1.5 m. For less frequent events (return periods of 50 and 100 years) the maximum increase of water depth is between 0.7 and 1 m. The areas most affected by the rise of flood levels are those located from the southwest to the east of the city (e.g., the urban areas of Tamulte, Miguel Hidalgo, Anacleto Canabal, Ixtacomitan and Gaviotas). Such results are in accordance with recent inundations caused by tropical weather events that have caused maximum water depths of over 1.5 m in some urban districts.
The estimations obtained in this study show that during storm events the increase in flood depths due to changes in land use in the basin can range from 7% to 22%, depending on the frequency of the storm event.
On the basis of existing estimations of the city’s growth rate, three possible urban expansion scenarios were proposed for 2050. Results show that, even in the most favorable scenario, flooding levels could increase by up to 0.3 m. In the worst scenario, inundation levels could rise by up to 0.7 m in areas already affected by floods every year. As stated by Zhang et al. [33], urban/construction land will always increase the problem of flooding. In the case of Villahermosa, which is a center for business and administration for Mexico’s oil industry, as well as the connection between Mexico City and the largest cities in the southeast of the country, urban land increase will be a growing problem in years to come. It is important to note here that the present study does not consider climate change for the 2050 scenarios. According to Jenkins et al. [34], climate change and the rapid urbanization will be the two main factors responsible for increased flood rates in the coming decades. For this reason, the application of an approach that determines the impact of climate change on the future flood scenarios in Villahermosa, similar to the one proposed by Liu et al. [35], is a crucial aspect to be considered in further developments of this study.
The present study provides an indication of how much the flood levels are expected to increase if the expansion of the urban area continues in an uncontrolled manner. The model developed can be considered as a useful tool for future territorial planning and could be used to evaluate alternative measures to reduce river inundation hazard in Villahermosa. Those could include the design of new embankments and retaining walls within the city, or a more sustainable management of land uses in the basins located upstream of the city, to increase the infiltration capacity of the soils, and reduce the flood river discharges.
Author Contributions
Conceptualization, R.B.; Data curation, O.S.A.-R. and L.C.; Formal analysis, O.S.A.-R., L.C. and R.B.; Investigation, O.S.A.-R., L.C. and R.B.; Methodology, O.S.A.-R., L.C., R.B. and V.J.E.-E.; Project administration, R.B.; Software, L.C.; Supervision, R.B.; Validation, O.S.A.-R. and L.C.; Visualization, O.S.A.-R. and V.J.E.-E.; Writing—original draft, R.B.; and Writing—review and editing, O.S.A.-R., L.C. and R.B.
Funding
This research received no external funding.
Conflicts of Interest
The authors declare no conflict of interest.
References
- Instituto Nacional de Estadística, Geografía e Informática (INEGI) Uso del suelo y vegetación Series 1 a 5. 2011. Available online: http://www.beta.inegi.org.mx (accessed on 15 November 2017).
- Mas, J.F.; Velázquez, A.; Díaz-Gallegos, J.R.; Mayorga-Saucedo, R.; Alcántara, C.; Bocco, G.; Castro, R.; Pérez-Vega, A.; et al. Assessing land use/cover changes: A nationwide multidatespatial database for Mexico. Int. J. Appl. Earth Obs. Geoinf. 2004, 5, 249–261. [Google Scholar] [CrossRef]
- Zúñiga, E.; Magaña, V. Vulnerability and risk to intense rainfall in Mexico: The effect of land use cover change. Investig. Goegr. 2018. [Google Scholar] [CrossRef]
- Aparicio, J.; Martínez-Austria, P.F.; Güitrón, A.; Ramírez, A.I. Floods in Tabasco, Mexico: A diagnosis and proposal for courses of action. J. Flood Risk Manag. 2009, 2, 132–138. [Google Scholar] [CrossRef]
- Xia, J.; Qiao, Y.F.; Song, X.F.; Ye, A.Z.; Zhang, X.C. Analysis about Effect Rules of Underlying Surface Change to the Relationship between Rainfall and Runoff in the Chabagou Catchment. Resour. Sci. 2007, 29, 71–76. [Google Scholar]
- Feng, H.; Wu, S.F.; Wu, P.T.; Li, M. Study on Scouring Experiment of Regulating Runoff in Grassland Slope. J. Soil Water Conserv. 2005, 19. (In Chinese) [Google Scholar]
- Nuñez, A.J. Plan Estatal de Desarrollo 2013–2018. Available online: https://tabasco.gob.mx//sites/all/files/sites/tabasco.gob.mx/files/pled-2013-2018_web.pdf (accessed on 2 February 2019).
- Perevochtchikova, M.; Lezema, J.D. Causas de un Desastre: Inundaciones del 2007 en Tabasco, México; Centro de Estudios Demográficos, Urbanos y ambientales, El Colegio de México: Mexico City, Mexico, 2010. [Google Scholar]
- Bates, P.D.; Horritt, M.S.; Fewtrell, T.J. A simple inertial formulation of the shallow water equations for efficient two-dimensional flood inundation modelling. J. Hydrol. 2010, 387, 33–45. [Google Scholar] [CrossRef]
- Smith, L.S.; Liang, Q. Towards a generalized GPU/CPU shallow-flow modelling tool. Comput. Fluyds 2013, 88, 334–343. [Google Scholar] [CrossRef]
- Ghimire, B.; Chen, A.S.; Guidolin, M.; Keedwell, E.C.; Djordjeviç, S.; Savić, D.A. Simulation of a fast 2D urban pluvial flood model using a cellular automata approach. J. Hydroinf. 2012, 15, 676–686. [Google Scholar] [CrossRef]
- McColl, C.; Aggett, G. Land-use forecasting and hydrologic model integration for improved land-use decision support. J. Environ. Manag. 2007, 84, 494–512. [Google Scholar] [CrossRef] [PubMed]
- Wang, Y.; Chen, A.S.; Fu, G.; Djordjeviç, S.; Zhang, C.; Savić, D.A. An integrated framework for high resolution urban flood modelling considering multiple information sources and urban features. Environ. Model. Softw. 2018, 107, 85–95. [Google Scholar] [CrossRef]
- Norman, L.M.; Huth, H.; Levick, L.; Burns, I.S.; Guertin, D.P.; Lara-Valencia, F.; Semmens, D. Flood hazard awareness and hydrologic modelling at Ambo Nogales, United States-Mexico border. J. Flood Risk Manag. 2010, 3, 151–165. [Google Scholar] [CrossRef]
- Booth, D.B.; Jackson, C.R. Urbanization of aquatic system-degradation thresholds, stormwater detention, and the limit of mitigation. J. Am. Water Resour. Assoc. 1997, 22, 1077–1090. [Google Scholar] [CrossRef]
- Goonetilleke, A.; Thomas, E.; Ginn, S.; Gilbert, D. Understanding the role of land use in urban stormwater quality management. J. Environ. Manag. 2005, 74, 31–42. [Google Scholar] [CrossRef] [PubMed] [Green Version]
- Hollis, G.E. The effect of urbanization on floods of different recurrence interval. Water Resour. Res. 1975, 11, 431–435. [Google Scholar] [CrossRef]
- Bladé, E.; Cea, L.; Corestein, G.; Escolano, E.; Puertas, J.; Vázquez-Cendón, J.; Dolz, J.; Coll, A. IBER: Herramienta de simulación numérica de flujo en ríos. Rev. Int. Métodos Numer. para Cálc. y Diseño en Ing. 2014, 30, 1–10. [Google Scholar] [CrossRef]
- Chow, V.T.; Maidment, D.R.; Mays, L.W. Applied Hydrology; McGraw-Hill: New York, NY, USA, 1988. [Google Scholar]
- Kirpich, Z.P. Time of concentration in small agricultural watersheds. Civ. Eng. 1940, 1, 362. [Google Scholar]
- Fraga, I.; Cea, L.; Puertas, J. Effect of rainfall uncertainty on the performance of physically-based rainfall-runoff models. Hydrol. Process. 2018. [Google Scholar] [CrossRef]
- Bladé, E.; Cea, L.; Corestein, G. Modelización numérica de inundaciones fluviales. Ing. del agua 2014, 18, 68. [Google Scholar] [CrossRef]
- Bonasia, R.; Areu-Rangel, O.S.; Tolentino, D.; Mendoza-Sanchez, I.; González-Cao, J.; Klapp, J. Flooding hazard assessment at Tulancingo (Hidalgo, Mexico). J. Flood Risk Manag. 2018, 11, S1116–S1124. [Google Scholar] [CrossRef]
- Cea, L.; French, J.R. Bathymetric error estimation for calibration and validation of estuarine hydrodynamic models. Estuar. Coast. Shelf Sci. 2012, 100, 3317–3339. [Google Scholar] [CrossRef]
- Cea, L.; Bladé, E.; Coristein, G.; Fraga, I.; Espinal, M.; Puertas, J. Comparative analysis of several sediment transport formulations applied to dam-break flows over erodible beds. In Proceedings of the EGU General Assembly 2014, Vienna, Austria, 27 April–2 May 2014. [Google Scholar]
- Cea, L.; Bladé, E. A simple and efficient unstructured finite volume scheme for solving the shallow water equations in overland flow applications. Water Resour. Res. 2015, 51, 5464–5486. [Google Scholar] [CrossRef] [Green Version]
- Sopelana, J.; Cea, L.; Ruano, S. Determinación de la inundación en tramos de ríos afectados por marea basada en la simulación continúa de nivel. Ing. del agua 2017, 21, 231. [Google Scholar] [CrossRef] [Green Version]
- Bermúdez, M.; Neal, J.C.; Bates, P.D.; Coxon, G.; Freer, J.E.; Cea, L.; Puertas, J. Quantifying local rainfall dynamics and uncertain boundary conditions into a nested regional-local flood modeling system. Water Resour. Res. 2017, 53, 2770–2785. [Google Scholar] [CrossRef] [Green Version]
- Horritt, M.S.; Bates, P.D. Evaluation of 1D and 2D numerical models for predicting river flood inundation. J. Hydrol. 2002, 268, 87–99. [Google Scholar] [CrossRef]
- Liang, D.F.; Falconer, R.A.; Lin, B.L. Coupling surface and subsurface flows in a depth averaged flow wave model. J. Hydrol. 2007, 337, 147–158. [Google Scholar] [CrossRef]
- Neelz, S.; Pender, G. Parameterisation of square-grid hydrodynamic models of inundation in the urban area. In Proceedings of the Congress-International Association of Hydraulic Research, Venice, Italy, 1–6 July 2007; Volume 1, pp. 41–50. [Google Scholar]
- Huang, C.; Hsu, M.; Teng, W.; Wang, Y. The impact of building coverage in the metropolitan area on the flow calculation. Water 2014, 6, 2449–2466. [Google Scholar] [CrossRef]
- Zhang, Y.; Zhao, Y.; Wang, Q.; Wang, J.; Li, H.; Zhai, J.; Zhu, Y.; Li, J. Impact of Land Use on Frequency of Floods in Yongding River Basin, China. Water 2016, 8, 401. [Google Scholar] [CrossRef]
- Jenkins, K.; Surminski, L.; Hall, J.; Crick, F. Assessing surface water flood risk and management strategies under future climate change: Insights from an Agent-Based model. Sci. Total Environ. 2017, 595, 159–186. [Google Scholar] [CrossRef]
- Liu, H.; Wang, Y.; Zhang, C.; Chen, A.S.; Fu, G. Assessing real options in urban surface water flood risk management under climate change. Nat. Hazards 2018, 94, 1–18. [Google Scholar] [CrossRef]
Figure 1.
Map of the basins that drain into Villahermosa.

Figure 2.
Thematic maps of land use distribution in the basins located upstream of Villahermosa: (a) land use of Series I (until 1992); (b) land use of Series II (1993–1996); (c) land use of Series III (2000–2004); (d) land use of Series II (2007–2010); and (e) land use of Series II (2011–2013) [1].

Figure 3.
Location map of the area under study. Limits of the city, as well as water networks, are shown. The computation domain is limited by a red square.
Figure 3.
Location map of the area under study. Limits of the city, as well as water networks, are shown. The computation domain is limited by a red square.

Figure 4.
Maps of water depth differences between flood scenarios constructed with the land use data of Series I and Series V. Differences are calculated for the return periods: (a) 10 years; (b) 25 years; (c) 50 years; and (d) 100 years.
Figure 4.
Maps of water depth differences between flood scenarios constructed with the land use data of Series I and Series V. Differences are calculated for the return periods: (a) 10 years; (b) 25 years; (c) 50 years; and (d) 100 years.

Figure 5.
Location of the control points used to evaluate the flood Depth Index (DI).

Figure 6.
Extension of flood areas with depths greater than 1 m for Series I and Series V. Units in hectares.
Figure 6.
Extension of flood areas with depths greater than 1 m for Series I and Series V. Units in hectares.

Figure 7.
Proposed urbanization scenarios in the city of Villahermosa for 2050.

Figure 8.
Differences in the water depth between Scenario A (2050) and the current situation.

Figure 9.
Differences in the water depth between Scenario B (2050) and the current situation.

Figure 10.
Differences in the water depth between Scenario C (2050) and the current situation.

Figure 11.
Extension of flood areas with flood depths greater than 1, 2, 3 and 4 m, for Scenarios A–C. Units in hectares.
Figure 11.
Extension of flood areas with flood depths greater than 1, 2, 3 and 4 m, for Scenarios A–C. Units in hectares.


Table 1.
Hydrological characteristics of the main rivers that drain into Villahermosa.
| Carrizal | V. Mezcalapa | Pichucalco | de la Sierra | |
|---|---|---|---|---|
| Basin area (km2) | 133.71 | 566.13 | 1314.23 | 1073.57 |
| Length of the main channel (m) | 51,524 | 98,544 | 155,134 | 145,102 |
| Minimum elevation of the main channel (m) | 8 | 7 | 5 | 4 |
| Average elevation of the main channel (m) | 12 | 33 | 1071 | 1188 |
| Maximum elevation of the main channel (m) | 17 | 60 | 2137 | 2373 |
| Average slope of the main channel (%) | 0.017 | 0.054 | 1.37 | 1.63 |
Table 2.
Correspondence of land use types with their curve number, for SI and SV.
| Land Use | Curve Number (N) |
|---|---|
| Series I | |
| Normal forest with medium transpiration | 76 |
| Forest with low transpiration | 84 |
| Pastureland | 80 |
| Average | 80 |
| Series V | |
| Forest with low transpiration | 91 |
| Agriculture in flat areas | 90 |
| Poor pastureland | 89 |
| Little permeable urban area | 92 |
| Average | 91 |
Table 3.
Parameters used to calculate flood discharges from Equation (1).
Table 3.
Parameters used to calculate flood discharges from Equation (1).
| Carrizal | V. Mezcalapa | Pichucalco | de la Sierra | |
|---|---|---|---|---|
| Average N—Series I | 80 | 80 | 80 | 80 |
| Average N—Series V | 91 | 91 | 91 | 91 |
| (h) | 38.7 | 41.3 | 16.8 | 14.9 |
| K | 1.87 | 1.88 | 1.71 | 1.68 |
| 0.86 | 0.82 | 0.79 | 0.76 |
Table 4.
Excess precipitation depths and flood discharges estimated for every basin and each return period. Flood discharges are estimated for Series I (SI) and Series V (SV) land use in the catchments.
Table 4.
Excess precipitation depths and flood discharges estimated for every basin and each return period. Flood discharges are estimated for Series I (SI) and Series V (SV) land use in the catchments.
| Return Period | SI | SI | SV | SV | |
|---|---|---|---|---|---|
| (years) | Pe (mm) | (m3/s) | Pe (mm) | (m3/s) | |
| Carrizal | T = 5 years | 12.6 | 227 | 15.8 | 284.9 |
| T = 10 years | 13.3 | 240 | 16.6 | 298.6 | |
| T = 25 years | 22.7 | 409 | 26.4 | 474.5 | |
| T = 50 years | 23.4 | 421 | 27.1 | 486.7 | |
| T = 100 years | 30.2 | 544 | 34.1 | 612.7 | |
| V. Mezcalapa | T = 5 years | 12.9 | 924 | 16.1 | 1155.5 |
| T = 10 years | 13.6 | 977 | 16.9 | 1210.8 | |
| T = 25 years | 23.2 | 1661 | 26.8 | 1922.8 | |
| T = 50 years | 23.8 | 1710 | 27.5 | 1972.5 | |
| T = 100 years | 30.8 | 2209 | 34.6 | 2482.4 | |
| Pichucalco | T = 5 years | 3.1 | 1070 | 5.1 | 1793.7 |
| T = 10 years | 3.3 | 1152 | 5.4 | 1895.3 | |
| T = 25 years | 6.5 | 2285 | 9.1 | 3225.0 | |
| T = 50 years | 6.7 | 2369 | 9.4 | 3318.9 | |
| T = 100 years | 9.2 | 3245 | 12.1 | 4287.3 | |
| de la Sierra | T = 5 years | 2.2 | 2623 | 4.1 | 4763.4 |
| T = 10 years | 2.4 | 2838 | 4.3 | 5044.2 | |
| T = 25 years | 5 | 5475 | 7.5 | 8745.8 | |
| T = 50 years | 5.2 | 6101 | 7.7 | 9008.3 | |
| T = 100 years | 7.2 | 8492 | 10.0 | 11,720.5 |
Table 5.
Flood Depth Index values obtained as the difference between flood levels calculated for Series I and Series V of land use, for each return period.
Table 5.
Flood Depth Index values obtained as the difference between flood levels calculated for Series I and Series V of land use, for each return period.
| DI | |
|---|---|
| 5 | 2.22 |
| 10 | 1.96 |
| 25 | 1.60 |
| 50 | 1.34 |
| 100 | 1.07 |
Table 6.
Depth Index (DI) computed for the three future urban scenarios.
| Scenario | DI |
|---|---|
| A | 1.015 |
| B | 1.033 |
| C | 1.040 |
Table 7.
Flood areas in hectares.
| CASES | Total Flood | Depth > 1 m | Depth > 2 m | Depth > 3 m | Depth > 4 m |
|---|---|---|---|---|---|
| SI Tr5 | 9911 | 6821 | 3647 | 2066 | 1044 |
| SI Tr10 | 10,122 | 7238 | 4360 | 2254 | 1280 |
| SI Tr25 | 12,081 | 9333 | 6817 | 3997 | 2176 |
| SI Tr50 | 12,189 | 9459 | 6932 | 4146 | 2298 |
| SI Tr100 | 13,362 | 10,863 | 7976 | 5613 | 2968 |
| SV Tr5 | 11,319 | 8433 | 5960 | 3002 | 1669 |
| SV Tr10 | 11,449 | 8606 | 6175 | 3215 | 1735 |
| SV Tr25 | 13,305 | 10,582 | 7851 | 5557 | 2967 |
| SV Tr50 | 13,432 | 10,745 | 7950 | 5674 | 3039 |
| SV Tr100 | 14,775 | 11,906 | 8855 | 6693 | 4255 |
| Scenario A | 14,794 | 12,091 | 9127 | 6836 | 4383 |
| Scenario B | 15,058 | 12,139 | 9191 | 6922 | 4462 |
| Scenario C | 14,977 | 12,246 | 9218 | 6912 | 4409 |
© 2019 by the authors. Licensee MDPI, Basel, Switzerland. This article is an open access article distributed under the terms and conditions of the Creative Commons Attribution (CC BY) license (http://creativecommons.org/licenses/by/4.0/).
Share and Cite
MDPI and ACS Style
Areu-Rangel, O.S.; Cea, L.; Bonasia, R.; Espinosa-Echavarria, V.J. Impact of Urban Growth and Changes in Land Use on River Flood Hazard in Villahermosa, Tabasco (Mexico). Water 2019, 11, 304. https://doi.org/10.3390/w11020304
AMA Style
Areu-Rangel OS, Cea L, Bonasia R, Espinosa-Echavarria VJ. Impact of Urban Growth and Changes in Land Use on River Flood Hazard in Villahermosa, Tabasco (Mexico). Water. 2019; 11(2):304. https://doi.org/10.3390/w11020304
Chicago/Turabian StyleAreu-Rangel, Omar S., Luis Cea, Rosanna Bonasia, and Victor J. Espinosa-Echavarria. 2019. "Impact of Urban Growth and Changes in Land Use on River Flood Hazard in Villahermosa, Tabasco (Mexico)" Water 11, no. 2: 304. https://doi.org/10.3390/w11020304
Note that from the first issue of 2016, this journal uses article numbers instead of page numbers. See further details here.