Article

Assessing the Impact of Climate Change on Groundwater Quality of the Shallow Coastal Aquifer of Eastern Dahomey Basin, Southwestern Nigeria

by
Jamiu A. Aladejana
1,2,*,
Robert M. Kalin
1,
Philippe Sentenac
1 and
Ibrahim Hassan
1,3
1
Department of Civil and Environmental Engineering, University of Strathclyde, Glasgow G1 1XJ, UK
2
Department of Geology, University of Ibadan, Ibadan, Nigeria
3
Department of Civil Engineering, Abubakar Tafawa Balewa University, Bauchi, Nigeria
*
Author to whom correspondence should be addressed.
Water 2020, 12(1), 224; https://doi.org/10.3390/w12010224
Submission received: 22 November 2019 / Revised: 8 January 2020 / Accepted: 10 January 2020 / Published: 14 January 2020
(This article belongs to the Section Water Quality and Contamination)

Abstract

:
Despite the increasing interest in climate change and water security, research linking climate change and groundwater quality is still at an early stage. This study explores the seasonal effect of the change in biogeochemical process for the redox-sensitive ions and metals Fe2+, Mn2+, SO42−, and NO3 to assess the groundwater quality of the shallow coastal aquifer of Eastern Dahomey Basin in southwestern Nigeria. Field physicochemical measurement of EC, pH TDS, Eh, salinity, temperature, and the static water level (SWL) was carried out on 250 shallow wells; 230 water samples were collected for analysis between June 2017 and April 2018. A spatial distribution map of these ions and metals showed an increasing concentration in the dry season water samples compared to those of the wet season. This higher concentration could be attributed to change in the intensity of hydrochemical processes such as evaporation, redox, and mineral precipitation. Results of linear regression modelling established significant relationships between SWL, SO42−, NO3, Fe, and Eh for both wet and dry seasons with the p-value falling between 75% and 95%, which can also be seen in the plots of Eh/ORP against Fe2+, Mn2+, SO42−, and NO3. These results revealed the influence of the redox process for both seasons, while also having a higher impact in the dry season while variation of concentration revealed decrease with increase in depth, which could be attributed to a decrease in well hydraulic properties and aeration. An Eh-pH geochemical diagram revealed NO3 as the controlling biogeochemical process over Fe in most of the sample wells. Concentrations of NO3, Fe, and Mn are above the World Health Organization’s (WHO) standard for drinking water in most water samples. This study has established the link between climate change and groundwater quality in shallow coastal aquifers and suggested the need for strategic groundwater management policy and planning to ameliorate groundwater quality deterioration.

1. Introduction

Groundwater remains an important source of freshwater to meet daily water demand, especially in the developing country of sub-Saharan Africa [1,2,3,4]. It complements the water supply shortage experienced as a result of failed infrastructure. This water source must meet a certain quality standard to ensure safe consumption, based on the physicochemical composition of groundwater controlled by specific hydrochemical processes such as oxidation-reduction, evaporation, precipitation, and dissolution. The chemical composition of groundwater is not restricted to only its source(s), but also by the biogeochemical processes occurring along the groundwater flow path, particularly within the aquifers where freshwater interacts with several other inorganic and organic substances either geogenic or of anthropogenic origin [5,6,7].
Floods and drought are the common impacts of climate change on water availability [8]. In shallow coastal aquifers, flooding can also impact the quality of groundwater, especially in the unconfined aquifer with porous overburden characterised by high hydraulic conductivities offering little or no attenuation to contaminants coming from polluted surface water from the flooded river and lagoons. Recently, substantial rainfall has triggered seasonal flooding in the coastal area of the Eastern Dahomey basin, and poses a threat to groundwater quality in shallow coastal aquifers [9,10].
Climate change is expected to result in sea level rise, ocean surge [11], and flooding of the coastal plains. This combined with contamination from urbanization and waste disposal, results in a mixture of waste dumped in open refuse sites being carried along river channels [9]. The result is mineralization and nutrient loading in surface water with dissolution, advection, and absorption, eventually percolating into shallow aquifers [12,13,14]. In most cases, the recharge of floodwater to groundwater takes between a few days to a few weeks, which facilitates biogeochemical activities that result in ion and metal concentrations that could degrade the quality of groundwater. Notably, among these biogeochemical processes are oxidation and reduction, which drive ion and metal precipitation in surface and groundwater. Nutrient loads in surface water are expected to increase during precipitation and redox process with climate-induced flooding [12]. It may also be possible, via field or modelling experiments [12], to assess the impacts of climate change on individual components contributing to eutrophication.
The relationship between climate change and drinking water is casual and complicated. This is due to the climate change-related effects of extreme precipitation, temperature rise, and waterborne diseases being systematically interrelated with different types of microorganisms, geographical area, season, type of water supply, water source, and watershed characteristics [15] (Figure 1). There are substantial knowledge gaps regarding systemic causes and effects with considerable uncertainty about how heavy rainfall, microbial pollution of water supplies, and increased turbidity are interrelated. Recently, several outbreaks of waterborne diseases were attributed to extreme hydrological events in sub-Saharan Africa and other parts of the world [16,17,18,19]. This risk is enhanced in the densely populated coastal areas of a developing country like Nigeria, as waste management is a challenge due to indiscriminate dumping of waste from municipal, industrial, and agricultural activities across the cities [9].
The Intergovernmental Panel on Climate Change (IPCC) Fourth Assessment Report failed to capture, in detail, the impacts of climate change on water quality. Researchers have established the impact of climate change-driven flooding on surface water quality, especially in the coastal zones of the world where extreme precipitation occurs [20,21,22,23,24], whereas research in the area of climate change impact on groundwater quality is still in its early stage [18,24]. This is probably due to the invisibility of groundwater and the fact that groundwater quality monitoring data in the study area is rarely conducted. Previous studies [2,4,25,26] have identified elevated concentrations of ions, heavy, and traced metals in groundwater in shallow aquifers of the coastal cities of Nigeria, many of which attributed groundwater contaminations to indiscriminate waste disposal, effluents from sewage, industrial, and agricultural waste.
The study aimed to delineate the possible origin of a high elevated concentration of some ions that could impact the quality of groundwater within this basin, to serve as a fingerprint of the impact of climate change driven flooding on groundwater of the shallow coastal freshwater aquifer of Eastern Dahomey Basin (EDB). Understanding will guide policy for the Sustainable Development Goals (SDGs), management of these resources, and promotion of resilience in the wake of future climate change impacts.
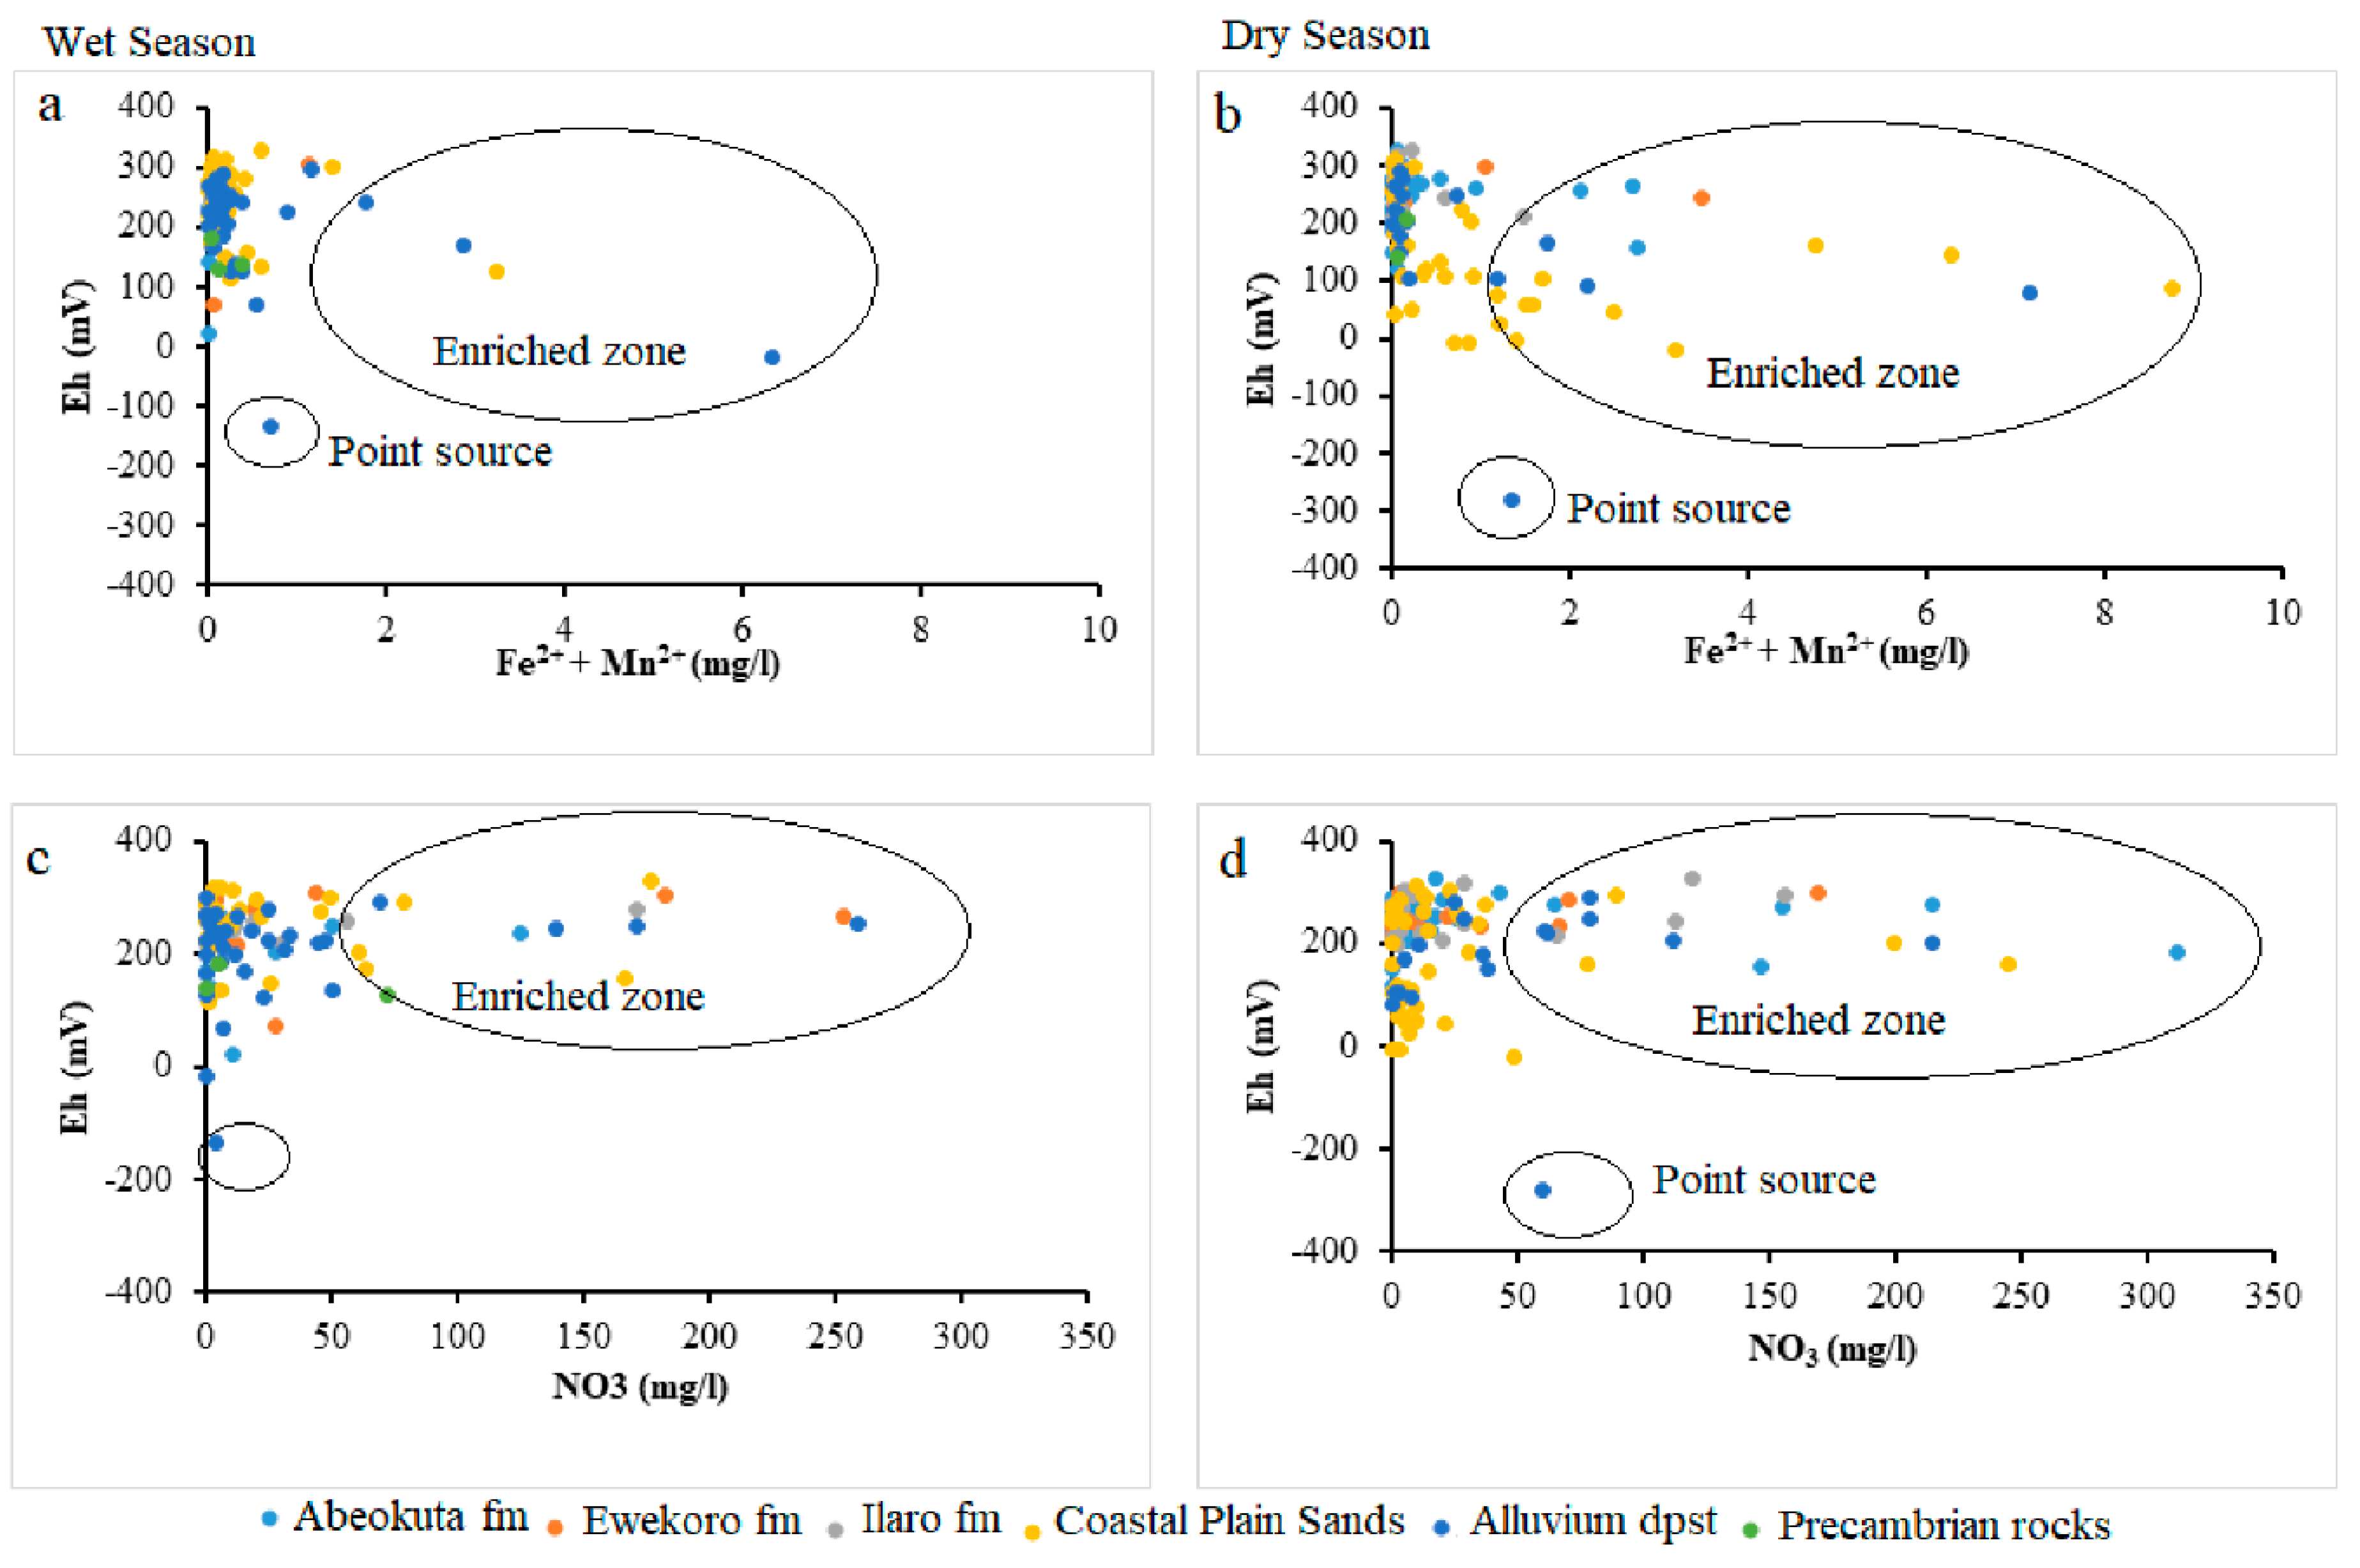
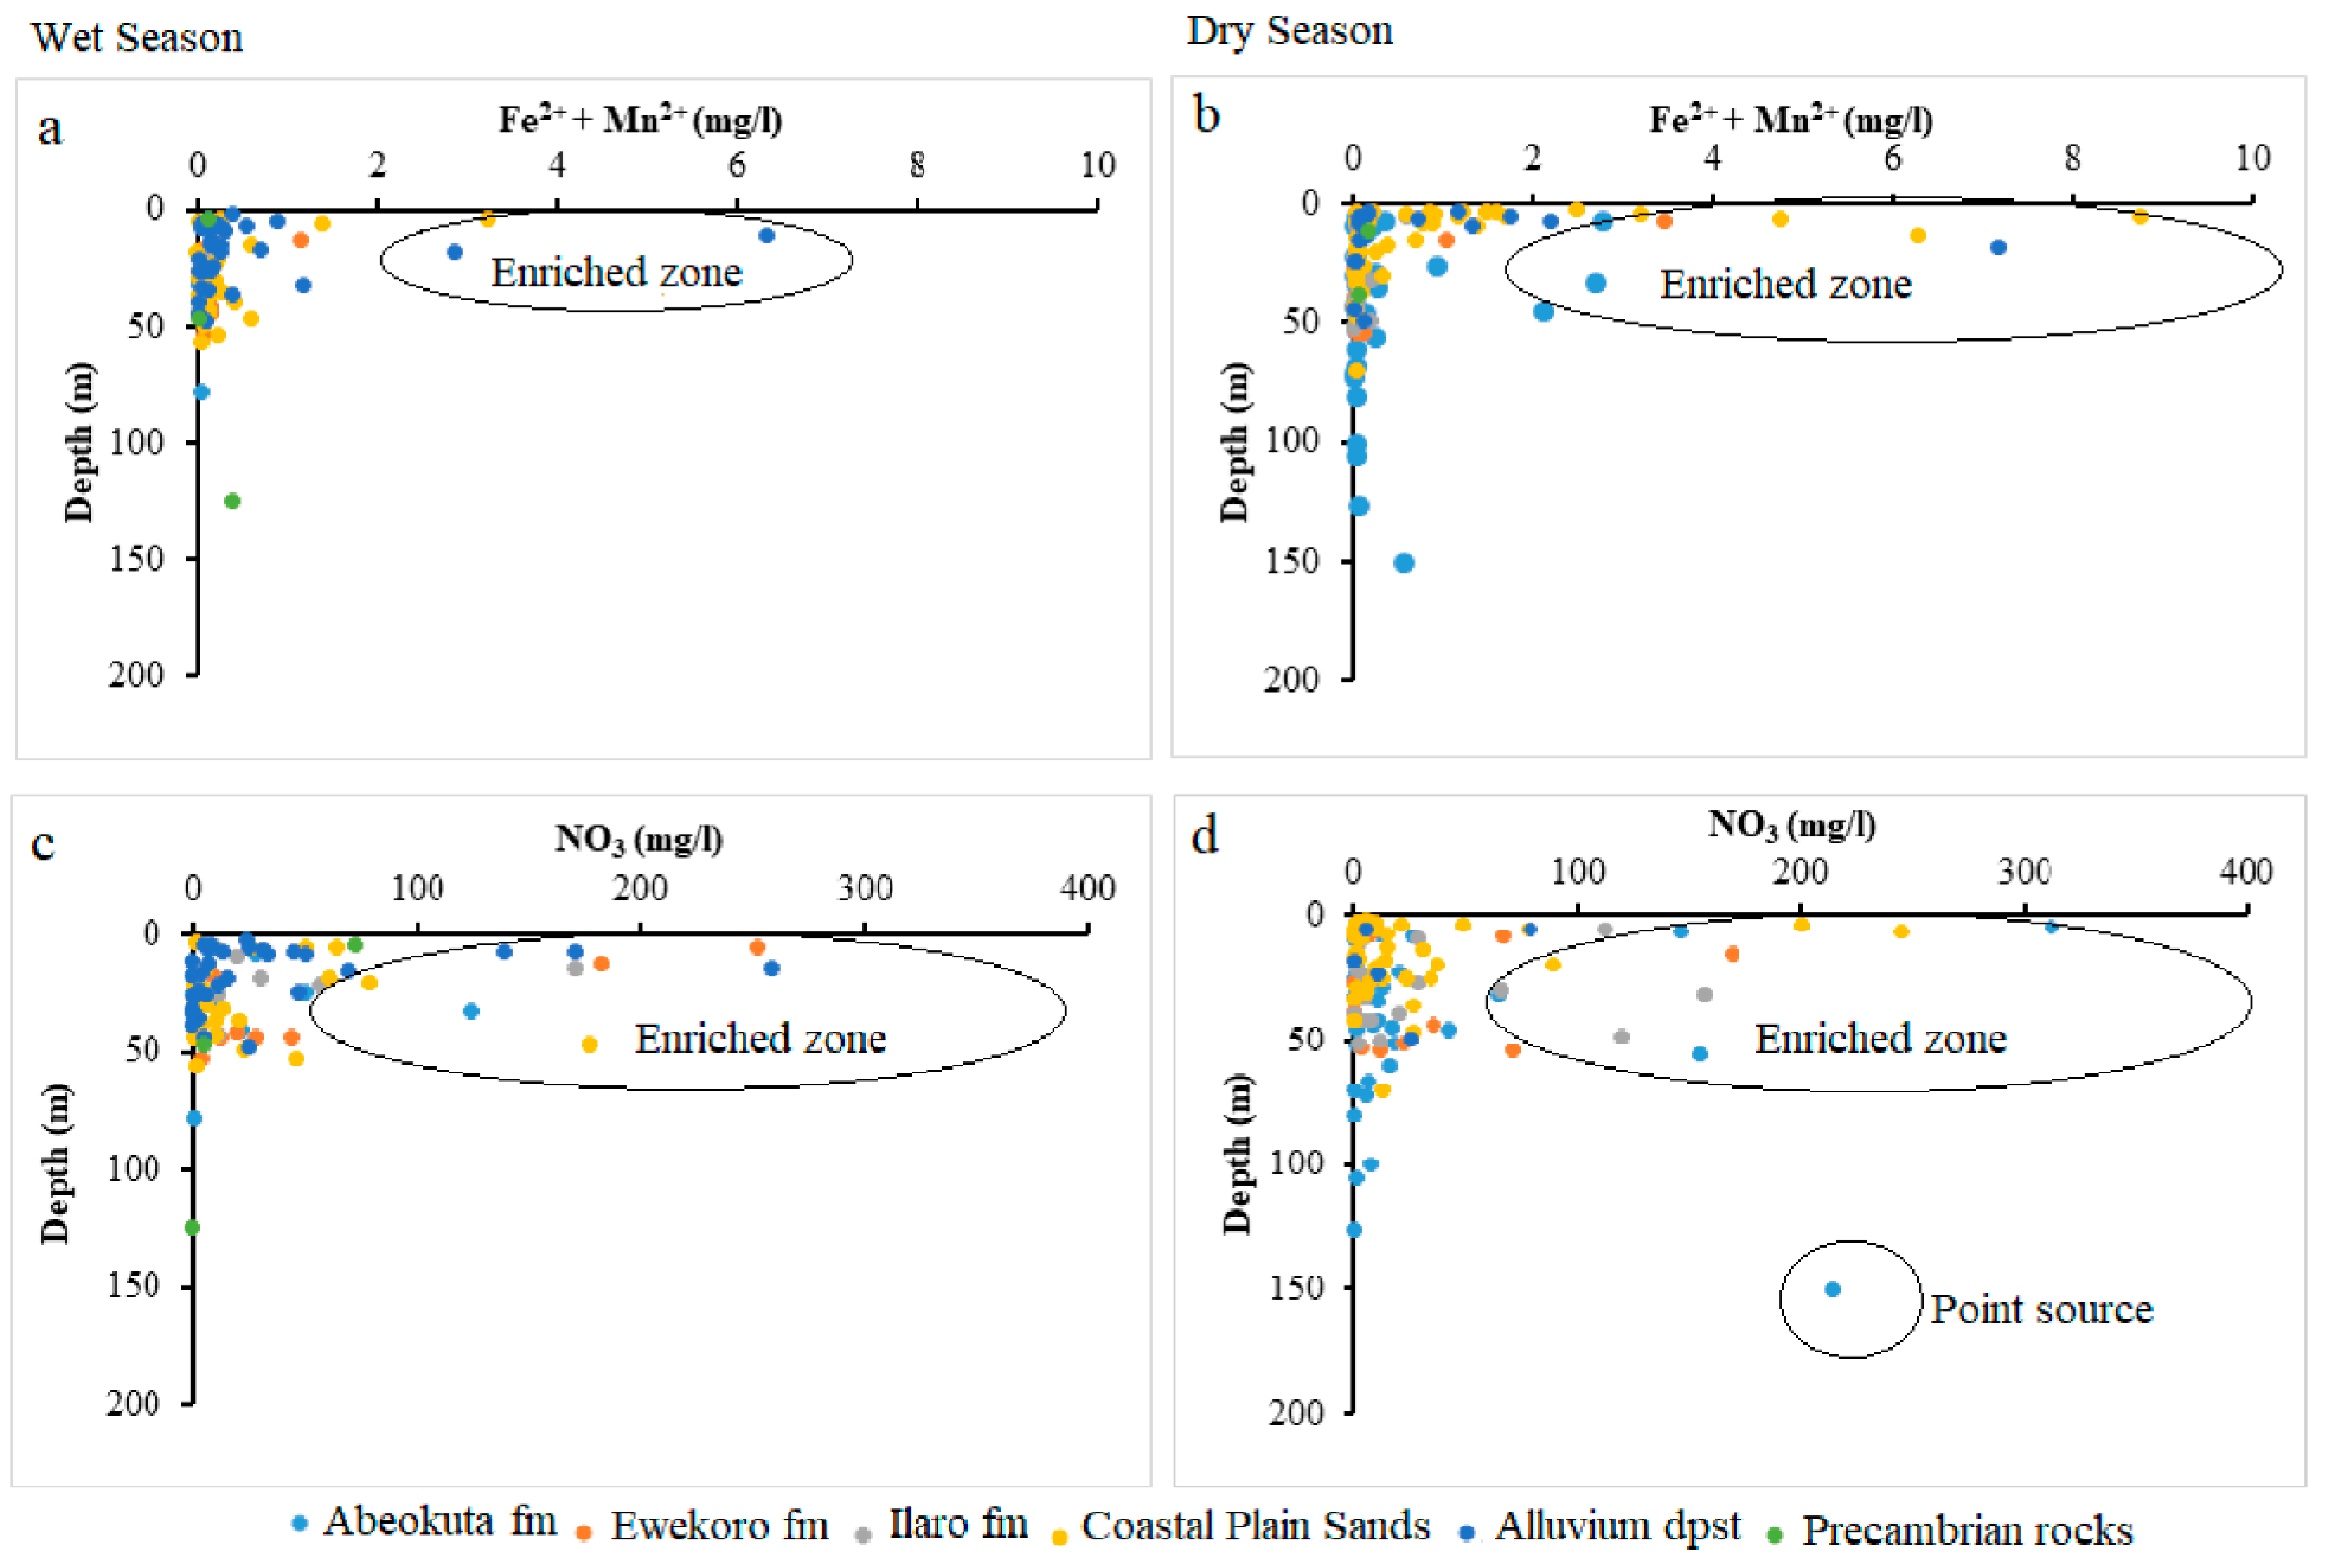
The objectives of this study were to investigate the impacts of climate change through flooding on groundwater quality of the shallow coastal groundwater of the Eastern Dahomey basin, using seasonal redox biogeochemical process of some selected redox-sensitive ions such as Fe, Mn, NO3, and SO4. Understanding the possible impacts of this seasonal flooding on the groundwater quality of the freshwater aquifer is critical to the management of this essential resource. Oxidation and reduction processes have been shown to have a significant influence on the hydrochemical status of groundwater by either removal or addition of dissolved material which controls its overall quality [13,27]. This process also controls the solubility and stability of many dominant species in groundwater. Groundwater redox process can be influenced by various factors such as recharge, presence of contaminants, local groundwater flow, and well construction configuration and development, which determines the available electron acceptors [6]. The redox variation within a basin could establish a relationship with the spatial variability of some of these ions which could be linked to the redox condition. As a result of this, groundwater from areas with a similar redox condition will generally exhibit chemical stability for redox, while groundwater from areas with varied redox conditions relating to different controlling factors display various characteristics regarding redox-influenced groundwater chemistry [28].

2. Description of the Study Area

The Eastern Dahomey Basin (also called Benin or Keta Basin) falls along the western part of Nigeria’s south coast (Figure 2). It is a transboundary basin that cuts across Ghana, Togo, and Benin to Nigeria. This basin is separated in the east from the Niger Delta basin by Okitipupa Ridge [30]. The basin lies within Latitudes 2°41′10″ N and 4°59′59″ N and Longitudes 6°21′13″ E and 7°52′42″ E along the coast of the Gulf of Guinea. The basin is bounded in the south by the Atlantic Ocean and thin out at the north into the Precambrian basement rocks of south-western Nigeria. The area of investigation towards the south is low lying with several points at or below sea level, which experiences flooding almost annually. The elevation increases towards the northern part with the highest point fall in the location around the city of Abeokuta. This area witnesses two major climatic seasons with a dry period from November to March and the wet season which usually begins around April and ends around October, with a short break in mid-August. Major rivers such as the Ogun, Ose, Oluwa, Oyan, and other smaller river tributaries drain the basin into the delta and the Atlantic Ocean. The basin hosts two major administrative water basins authorities in Nigeria which include Ogun-Osun and Benin-Owena river basins. It accommodates about 40% of the country’s population and underlies one of the most populous cities in Africa along with other large cities, towns, and villages.

2.1. Geology and Hydrogeology

2.1.1. Geology

The area is part of the Dahomey basin, which extends from Nigeria to Ghana. The lithological character of the sediments is dictated by a southerly transgression and regression of the sea, which has occurred since the Cretaceous period. The stratigraphic description of the sediments has been provided by various authors [30,31,32]. The Alluvium deposits and coastal plain sands consist of soft, very poorly sorted clayey sands, pebbly sands, sandy clays, and rare thin lignite of Oligocene to recent age [33]. The coastal sands layer is underlain by the Ilaro formation, which consists of massive, yellowish, poorly consolidated, cross-bedded sandstones, which are fine-medium-grained and poorly sorted [32]. The Ilaro formation is followed by the Ewekoro formation, which consists predominantly of Paleocene fossiliferous limestone which becomes arenaceous towards the base [33] and the Abeokuta formation, which consists of lower Cretaceous sandstone and grits with interbedded mudstone unconformity overlying the basement complex fine-grained detrital sandstone, siltstone, and shale overlying the formation in the upperparts. The geology map of the basin is presented in Figure 2 with the groundwater sampling points.

2.1.2. Hydrogeology

Three to four different hydrogeological units have been identified within the Dahomey and Niger Delta Basins. The unconfined alluvial aquifers along the delta line and major rivers (creek lines), shallow coastal plain sands and intercalations of clay, limestone, tar sands, shale, peats, and upper coal measure underlying different locations within the study area defined the layer boundaries because of their relatively low permeability [34,35,36,37]. The alternating sequence of low and high permeability layers define the three confined aquifers that define groundwater resources of the study area. The top aquifer is shallow with thickness ranging from 8–45 m. The thickness of the second aquifer ranges from 10–35 m, while the third aquifer is about 10–35 m with the depth ranging from 150–240 m [29,38]. The fourth aquifer starts from 200 to 250 m below the ground’s surface, depending on the locations. Generally, the variation in the aquifer characteristics begins from Abeokuta formation (Figure 1) in the North as the lateritic topsoil thins out as it passes through Ilaro, Ewekoro, into Coastal Plain Sand, and Alluvium units towards the sea at the south. Figure 3 shows a typical lithological description of the coastal area from a combined X-ray, resistivity logs, and electrical resistivity tomography.

3. Methodology

3.1. Field Physicochemical Measurement

Groundwater from shallow hand-dug wells and boreholes across Eastern Dahomey Basin were collected in wet (May to June 2017) and dry (February to March 2018) seasons. Field measurement of the depth of the wells and the static water level (SWL) were carried out using water level meters. Total dissolved solids (TDS), pH, electrical conductivity (EC), temperature, redox potential (Eh), and salinity were measured using a multitester Harch pH/EC meter (Model 99720). Water samples from wells were collected in a bailer and poured into a 3-L plastic from which samples were collected in 25 mL syringes with a 0.45-micron filter and then transferred into the tubes. The water samples were collected in two separate 50 mL polypropylene centrifuge tubes labelled nA and nB for metals and anions (where n stands for sampling well number from 1 to 96 and 1 to 134 for wet and dry season, respectively). Sample A was acidified with two drops of concentrated nitric acid to preserve the metals before laboratory analysis. The bottles were filled to the overflow and quickly covered with an airtight seal to prevent oxygen traps. The samples were then stored in the storage room at 4 °C until laboratory analysis.

3.2. Laboratory Analysis

Alkalinity was determined as total alkalinity in un-acidified samples by potentiometric titration with a 0.5 M HCl stock solution. Filtered samples Labelled nA which were acidified to pH two were used for cations analysis using Inductively coupled plasma mass spectrometry (ICP-MS). Unacidified samples were used for anions of chloride, bromide, nitrate, and sulphate were analyzed using Ion chromatography (IC).

3.3. Data Evaluation and Statistical Analysis

Statistical methods have proven to be useful for delineating hydrochemical processes [39,40,41,42,43,44]. In this study, a statistical method involving a summary of the minimum, maximum, mean and standard deviation was conducted for the physicochemical data to enable basic comparison, while the multivariate method of regression was run using the REGTEL software. Both pH and Eh were separately used as independent variables against which all other variables were dependent. Selection of pH and Eh were chosen based on their direct influence on the biogeochemical processes of redox, which mostly dominate nutrient loading and mineralization in surface water which subsequently infiltrate into coastal groundwater aquifers. The variations of the redox-sensitive ions were tested using the correlation, p-value and Significance values of both pH and Eh with the other selected parameters. Eh-pH diagram for Iron and Nitrogen species were plotted using Geochemist Workbench version 6 with activities values of 10−6 and 10−3 for Iron and Nitrogen, respectively. The general diagram of Eh-pH was plotted using Origin Pro 2017.

4. Results and Discussion

4.1. Physicochemical characterisation and desciption

A statistical summary of selected physicochemical parameters of groundwater in the study area during the wet and dry period is presented in Table 1. The results revealed that most of the hydrochemical parameters show a wide range and are generally higher in the dry season compared to the wet season. The high standard deviation could be attributed to dilution and mixing in the wet season and the effect of evaporation with its associated hydrochemical processes such as precipitation, oxidation, and reduction, etc. The temperature varied from 25.5 to 34.6 °C with an average of 29.4 °C during the wet season while 26.6 to 37.7 °C with an average of 31.2 °C was observed in the dry. The higher temperature observed in the dry season may be responsible for a higher rate of evapotranspiration, which probably aids the rate of hydrochemical reactions and triggers a range of hydrochemical dynamics. pH, Eh, and salinity have values ranging from 3.85–7.96, −280–362 mV, and 14–5070 mg/L in the dry season and 3.97–8.10, −136–330 mV and 0.00–5000 mg/L for the wet season with respective averages of 5.5, 208.18 mV and 173 mg/L for the dry season while 5.57, 222 mV and 137 mg/L were recorded for the wet season.

4.1.1. Sulfate (SO42−)

Sulfate in groundwater occurs from both natural and anthropogenic sources. The natural source is linked with the dissolution sulfate/evaporites minerals such as gypsum while the anthropogenic sources could be from municipal and industrial effluents mainly due to sulfur-based waste products. Unmanaged waste disposal is common within the alluvium aquifer along the rivers within the coastal areas. Seasonal flooding in this area likely triggers a biogeochemical reaction of oxidation and reduction which promotes dissolution of sulfate in water. In this study, SO42− concentration in groundwater samples from the dry season range from 0.26–576.3 mg/L with an average of 17.5 mg/L while wet season concentration ranges from 0.08–2.211 mg/L with an average of 37.9 mg/L. The relatively higher average concentration in the dry season water samples revealed the influence of evaporation. The spatial and temporal map, as shown in Figure 4 below, shows that most of the higher concentration samples are found within the coastal plain sands and alluvium deposit of the basin.

4.1.2. Nitrate (NO3)

Nitrogen in surface and groundwater is dominated by nitrate under oxidizing conditions and ammonium ions under reducing conditions. This is common when water is in direct contact with wastewater, septic tanks and sewage systems. Leachates from farming as a result of fertilizer application and animal waste also form the source of nitrate in the groundwater [7,45,46,47]. Within the study area, Nitrate concentrations in groundwater range from 0.25 to 312 mg/L and 0.02 to 259 mg/L with an average of 30.3 mg/L and 32.1 mg/L, respectively for both dry and wet seasons. In groundwater samples analyzed during the dry and wet seasons, 82.4 % (131) and 81.2 % (96) fell well within the WHO permissible limit for drinking water standard while 17.6 % and 18.8 % fell beyond the same limit, respectively. The spatial map of nitrogen as shown in Figure 5, revealed most of the samples beyond the standard are distributed close to the river channels along with alluvium deposits, which is an indication of the impact of waste from municipal, agriculture, and industries that are commonly transported in water medium along the river channels.

4.1.3. Iron (Fe)

Dissolved irons generally have a terrigenous source and are transported towards the coast during which some are precipitated out of solution through oxidation to ferric oxyhydroxides [48]. However, even though most dissolved irons sourced from catchment precipitates out as the water flow towards the coast, groundwater, and river can still accommodate significant quantities of dissolved iron to coastal environments. The input of fulvic acids can maintain iron in solution in brackish to saline coast waters [47].
Under anaerobic groundwater may contain ferrous iron at concentrations of up to several milligrams per liter without discoloration or turbidity in the water when directly pumped from a well. On exposure to the atmosphere, however, the ferrous iron oxidizes to ferric iron, giving an objectionable reddish-brown color to the water. In this study, the concentration of Fe ranges from 0.0 to 6.1 mg/L and 0.01 to 136 mg/L and average of 0.3 mg/L and 1.5 mg/L, respectively for wet and dry seasons groundwater samples. The relative higher concentrations and standard deviation observed in the dry season (11.9) compared to wet season (0.8) signifies the possible influence of precipitation/redox driven by evaporations resulting from seasonal variation in precipitation. Scatter plots (Figure 6) between Fe and pH indicates that the higher concentration of Fe predominates the Alluvium and coastal plain sands aquifer. This occurrence is hypothesized to be attributed to the preservation of metals in groundwater by organic/fulvic acid, which commonly characterized the alluvium deposits around the coastal areas [5,47]. This trend can also be observed in spatial distribution map in Figure 7.

4.1.4. Manganese (Mn)

Manganese occurs naturally in rocks and soils and finds its way into groundwater through rock-water interaction and is a well-known cause of aesthetic problems in drinking water [3,47,48]. Manganese is seldom found as a lone ion, as it is commonly found in iron-bearing water, though less abundantly than Iron. Most soils and rocks around the world commonly contain manganese. pH and ORP/Eh is one of the environmental parameters that control the behavior of manganese in groundwater. In this study, concentrations of groundwater range from 0.00 to 1.11 mg/L and 0.00 to 27.7 mg/L with an average of 0.1 mg/L and 0.3 mg/L for both wet and dry seasons, respectively. The slightly higher concentration observed in the dry season could be attributed to higher intensity of evaporation and hydrochemical process of reduction. The spatial distribution of Mn across the EDB is presented in Figure 8. 81.8% of 133 and 80.2% of the 96 water samples for both dry and wet seasons fell well within the permissible limit of WHO while 18.2% and 19.8%, respectively, exceed the limit.

4.2. Seasonal Effect of Climate Change on Biogeochemical Processes

The dynamic of mobilization of Fe, Mn, SO42−, and NO3 at the sediment-water interface in the free water surface, especially along the delta and flood plains of coastal areas can be seasonally dependent (and therefore impacted by changes in climate). High contrast in the seasonal concentration of Fe has been found in coastal wetlands and flood plains [48]. It is well-known that pH in water is affected by the biogeochemical process which occurs either in coastal wetlands or river channels and shallow unconfined aquifers between the period of the end of one season and the beginning of another [5,6,7]. This process is known for its sensitivity to pH and Eh of the environment. Using changes in Eh and Eh/ORP as drivers for geochemical changes in the selected redox-sensitive ions and metals allows us to hypothesize factors to link assessing groundwater quality changes with climate change. In order to assess the possible linkage for EDB shallow coastal aquifers, PH, and Eh are selected as dependent variables which control the concentration of redox-sensitive groundwater quality parameters as independent variables.

Multiple Linear Regression Model

Multiple linear regressions were used to model selected redox-sensitive hydro geochemical parameters related to pH and ORP/Eh as independent variables from both seasons using the REGTEL statistical software package. The results of the multiple linear regression models were used to assess and predict EC, salinity, temperature, static water level (SWL), SO42−, Cl, NO3, Fe, and Mn. Values of both pH and Eh of the water across different locations within the EDB for both wet and dry seasons were presented in Table 2 and Table 3 for the wet season and Table 4 and Table 5 for the dry season water samples.
For wet season samples, SO42−, Cl, NO3, Fe, and temperature have a p-value of 0.0001 with 99% significance, and with pH a coefficient of 0.0192, −0.0022, −0.0022, 0.2721, and −0.0777, respectively (Table 4). This suggests a strong relationship between these variables. In the dry season Temperature, NO3 and Static water level (SLW) are significantly related to pH (99 percentile) while other parameters such SO42−, Cl, Fe, and Mn show weak response to pH with no significance. In the rainy season water samples, SO42−, Cl, NO3, Fe, and temperature show significant change in concentration with change in pH, while only temperature, NO3, and static water level (SWL) show significant change with change in pH of the water sample in the dry season. This relationship could be attributed to relatively higher groundwater recharge by the contaminated surface water during the wet season with higher water level compared to the dry season when most coastal groundwater aquifers are being recharged through baseflow.
Other groundwater quality parameters such as temperature, SO42−, NO3, Cl, and Mn show a higher p-value well above 0.05 maximum. The Eh showed high predictability with salinity, Fe, and the static water level but little or no sensitivity towards temperature, SO42−, NO3, Cl, and Mn. This indicates their weak response to fluctuation in Eh resulting from possible dilution effect due to high precipitation in the wet season as presented in Table 4 which can also be observed in the scatter diagram in Figure 6. In the dry season, the results show that Eh is well predicted by the independent variables of Salinity, SWL, Cl and NO3 with 99% significance and regression coefficient −0.6204, 0.9631, −0.2583, and 0.4514. The temperature has a significance of 95% with coefficient −0.2611 while SO42− and Fe each have 75% significance. The observed predictability of Eh with these independent variables in the dry season water samples could be attributed to the effect of evaporation and mineral precipitation and other relevant hydrochemical processes that characterized the dry season.
Lack of Mn significance contrary to other selected parameters could result from anthropogenic influence on the Fe concentration in the groundwater from this area. This nutrient enrichment is higher in Alluvium deposit and Coastal Plain Sands groundwater aquifers, as shown in the scatter diagram in Figure 9, Figure 10 and Figure 11.
The overall result of the linear regression analysis indicated that the seasonal flooding possibly resulting from climate change has a significant influence on the quality of the groundwater of EDB. This is more prominent in the shallow coastal aquifers where the groundwater level is relatively high and consequently vulnerable to contamination from surface water with dissolved ions and metals from a different source. This could stimulate redox reaction that results in mobilization and remobilization of Fe into the particulate form. Iron mobilization is known for his ability to precipitate SO4, NO3 Mn2+, and phosphate [49]. Though not a direct linkage between climate change and groundwater quality, this complex linkage chain is a plausible linking mechanism.

4.3. Analysis of Biogeochemical Processes of Redox Reaction in Groundwater of EDB

Oxidation/reduction (redox) reaction potential of groundwater (Eh) plays a vital role in the geochemical processes that occur in groundwater. Redox is defined as the transfer of electrons. Redox reactions are crucial in aqueous environmental geochemistry. Eh measurements are useful in identifying the redox zones as its value decreases with increases in residence time [28,50]. Change in pH and Eh have been identified as controlling factors in the mobilization and remobilization of ions and metals in surface and groundwater of the shallow aquifer of the EDB basin (Figure 9).
Oxidation and reduction of ions and metals is a typical process in an aquifer system, especially SO42− and Fe. The Eh-pH geochemical diagram shows how Eh in groundwater is governed in the upper range by oxidation of water to O2 and lower range by reduction of hydrogen ions to H2. The groundwater samples of the study area undergo a combination of redox process (under ferrous (Fe2+), i.e., reduction state and Fe(OH)2, i.e., oxidation states. This situation from (Figure 10) revealed a scatter pattern that could be a seasonal effect. Eh values above 300 mV indicate a recharge area where sulphates are commonly stable. High Eh values indicate the regions of good recharge and low Eh values are the regions of less recharge or discharge. Eh and pH diagram (Figure 12) of the water samples from the study area in wet seasons which indicates high Eh value (330 mV) in the well L92 around Okitipupa, and the lowest Eh value (−136 mV) in well L77 at Ode-Mahin.
This value indicates groundwater flow recharge area in Okitipupa to the discharge area around the coasts at Igbokoda and Ode-Mahin. In the dry season samples, the highest Eh value (326 mV) was observed in well L59 around Ijebu-Ode and low values (−280 Mv) in well number L94 around Ode-mahin, Igbokoda (−22 mV), Araromi (−8 mV), and Badagry (−6 mV), with respective numbers L97, L86, and L34 all along the coastline of the study basin. These values also show reduction from the recharge zones to the discharge areas. Water from most of the above-mentioned wells with lower Eh values displayed yellowish to brownish color, which is an indication of redox process which transforms ferrous to ferric Iron.
The general Eh-pH diagram, (Figure 12) revealed that the groundwater from the Eastern Dahomey Basin falls within the transitional phase of the redox process, the Iron concentrations in groundwater around the study area showed a higher concentration in locations around the Alluvium deposit and Coastal Plain Sands aquifers. A high concentration of ions was also observed in some locations in other parts of the basin, especially areas within or very close to the flood plains of the major rivers. This type of area is suggested to contain a confined sandy aquifer with sedimentary organic carbon with ferrihydrite coatings on the sands. This is prominent in various locations around Isheri, Eleko, Ibeju Lekki, and Igbokoda. In these areas, the values of dissolved Iron concentration are above 3 mg/L, which have a negative implication on the groundwater quality. The Eh-pH diagram for Iron and Nitrogen species (Figure 13 and Figure 14) show samples plotted along the boundary between Hematite and Fe2+. This pattern is similar for both seasons and observed among water samples from alluvium deposit and Coastal Plain Sands aquifers. In the case of the Nitrate species, most samples plotted in the area N2 had stability between boundary lines NH4+ and NO3, indicating likely nitrifying/denitrifying biogeochemical activities. This is prominent in water from the Alluvium and Coastal Plain Sands aquifers, which could be attributed to biogeochemical activities within the flood plain and wetlands of the EDB.

4.4. Implication on the Groundwater Quality and Human Health

Quality assessment was conducted on the selected groundwater quality parameter by directly comparing them with the World Health Organization (WHO) standard for drinking water, as presented in Table 6.
For the dry season water samples, Fe2+ contamination dominates the groundwater of EDB with 92.55% sample fell above WHO permissible limits. This is followed by Mn2+ and NO3 with 18.2% and 17.6% samples having concentration beyond the standard. Only 0.4% of the samples show values above the standard limit for both SO42− and Cl, while 7.7% of samples show both EC and TDS values above the standard. Iron promotes the growth of “iron bacteria,” which derive their energy from the oxidation of ferrous iron to ferric iron and in the process deposit a slimy coating on the piping. At levels above 0.3 mg/L, iron stains laundry and plumbing fixtures. There is usually no noticeable taste at iron concentrations below 0.3 mg/liter, although turbidity and color may develop.
No health-based guideline value is proposed for iron. Water containing over 50 ug/L dissolved manganese can precipitate in media or storages (aquifer), which could lead to staining laundry and fixtures, and distinct aesthetic effects such as discoloration, odor, or taste. At levels exceeding 0.1 mg/L, Mn in water supplies causes an undesirable taste in beverages and stains sanitary ware and laundry. The presence of manganese in drinking-water, like that of iron, may lead to the accumulation of deposits in the distribution system. Concentrations below 0.1 mg/L are usually acceptable to consumers. The health-based guideline value for manganese is four times higher than this acceptability threshold of 0.1 mg/L. Excessive nitrates and nitrites consumed with drinking water (nitrate is converted to nitrite in the human body) increase the risk of methemoglobinemia and stomach cancer [51].

5. Conclusions

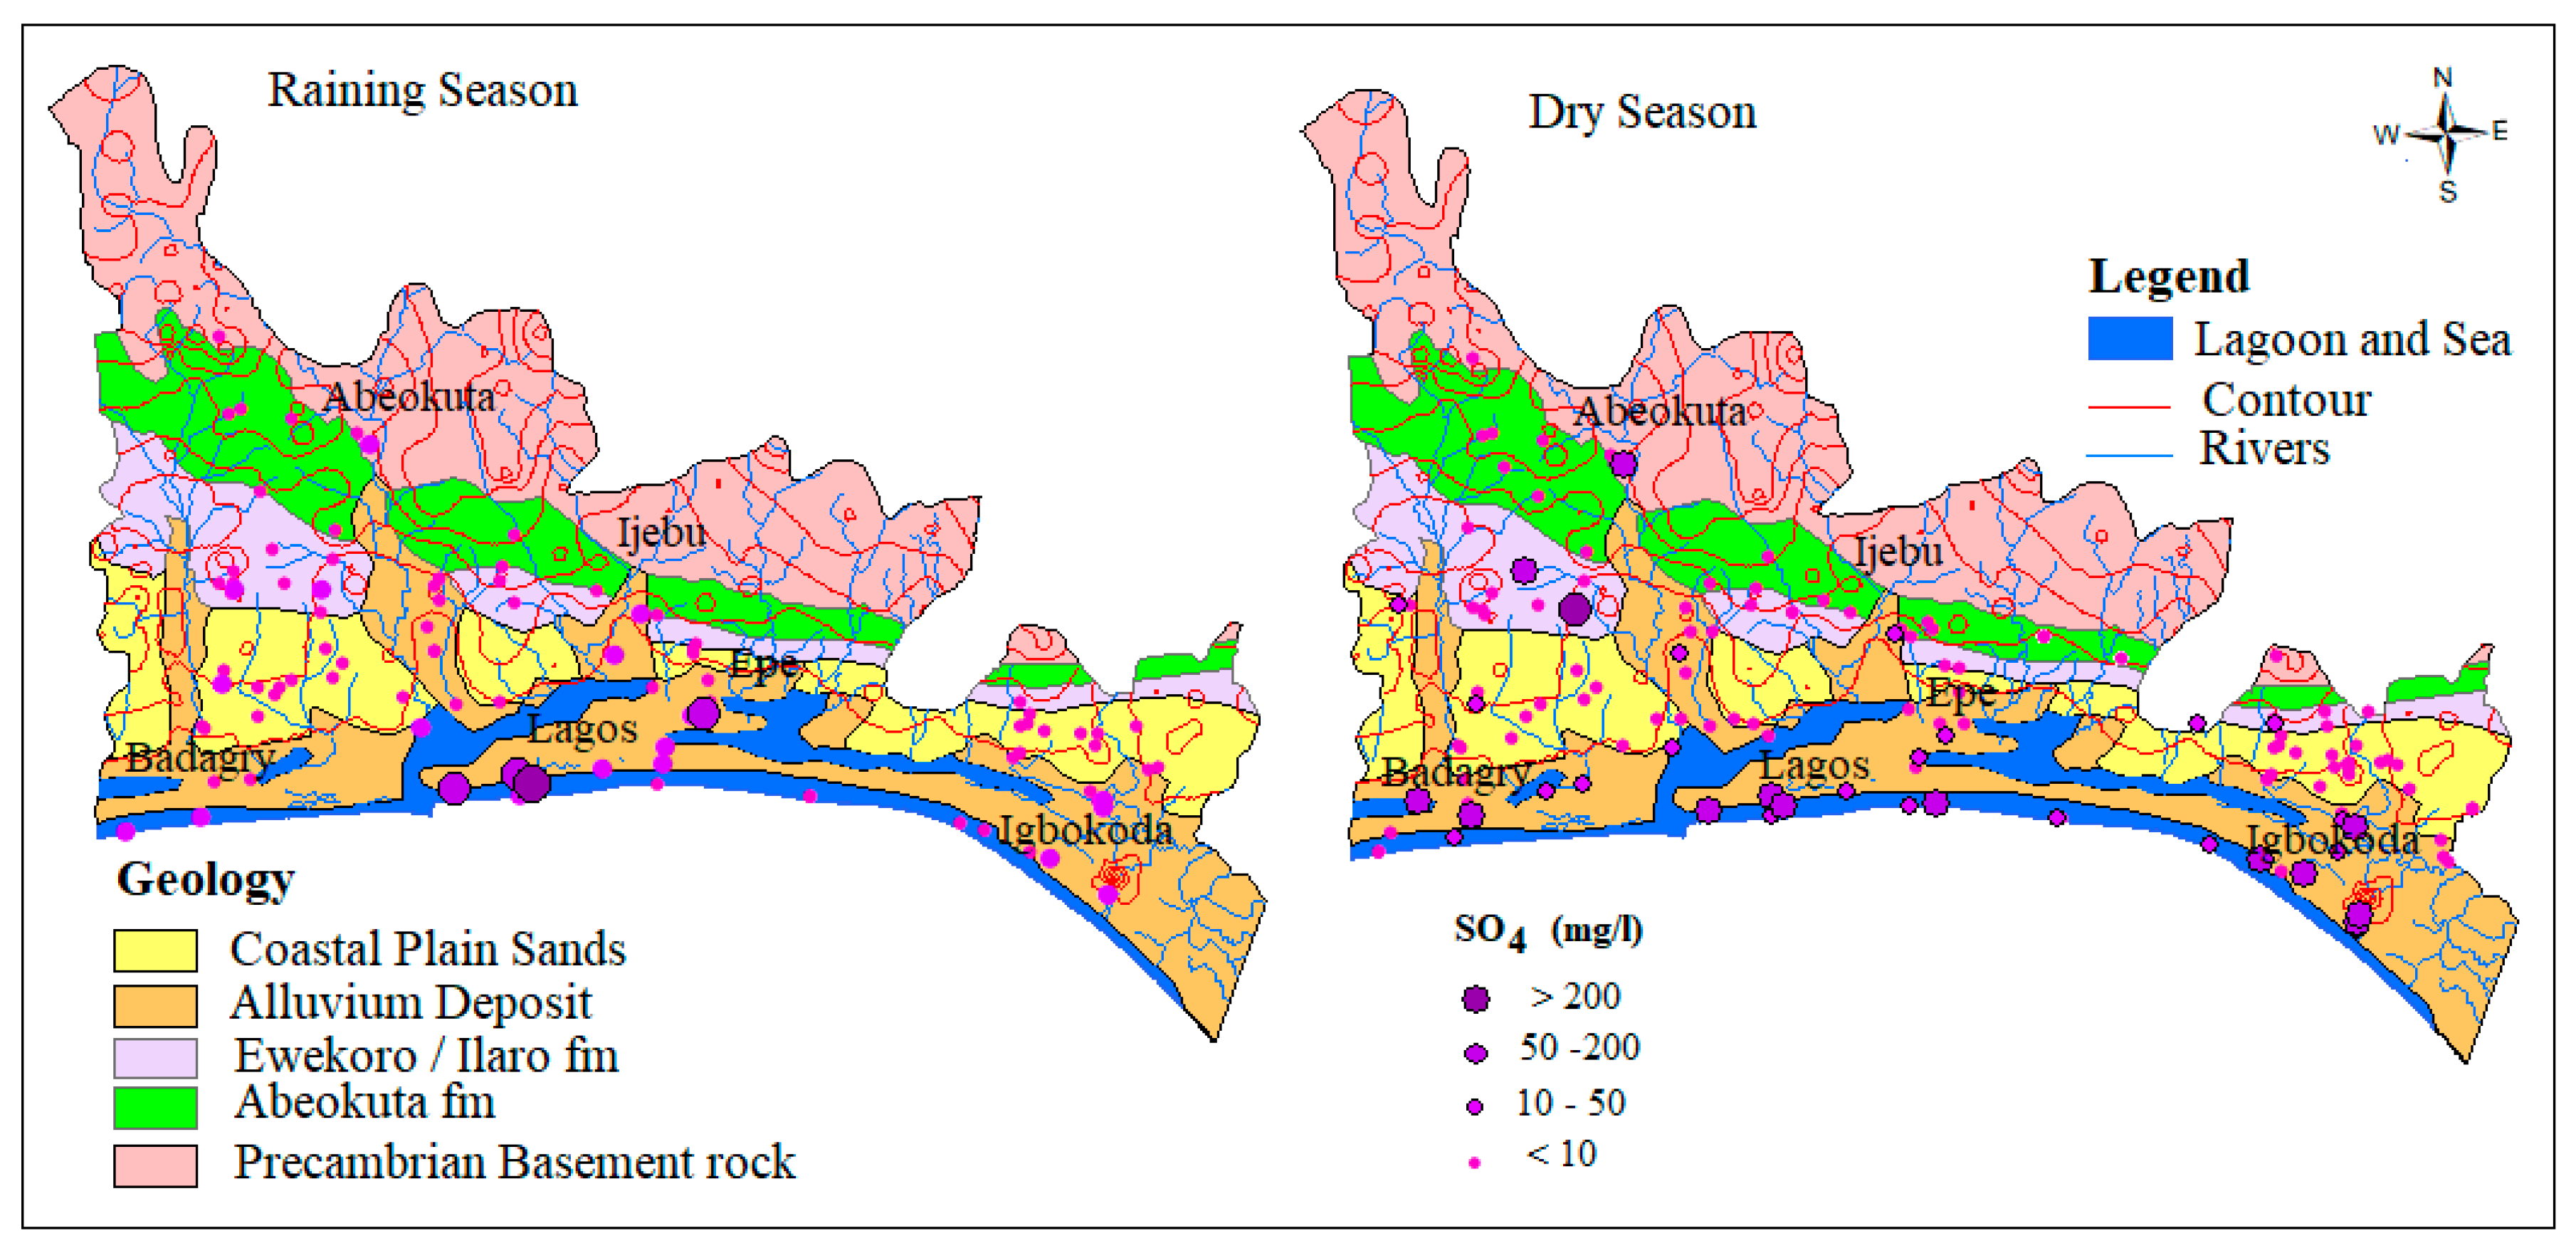
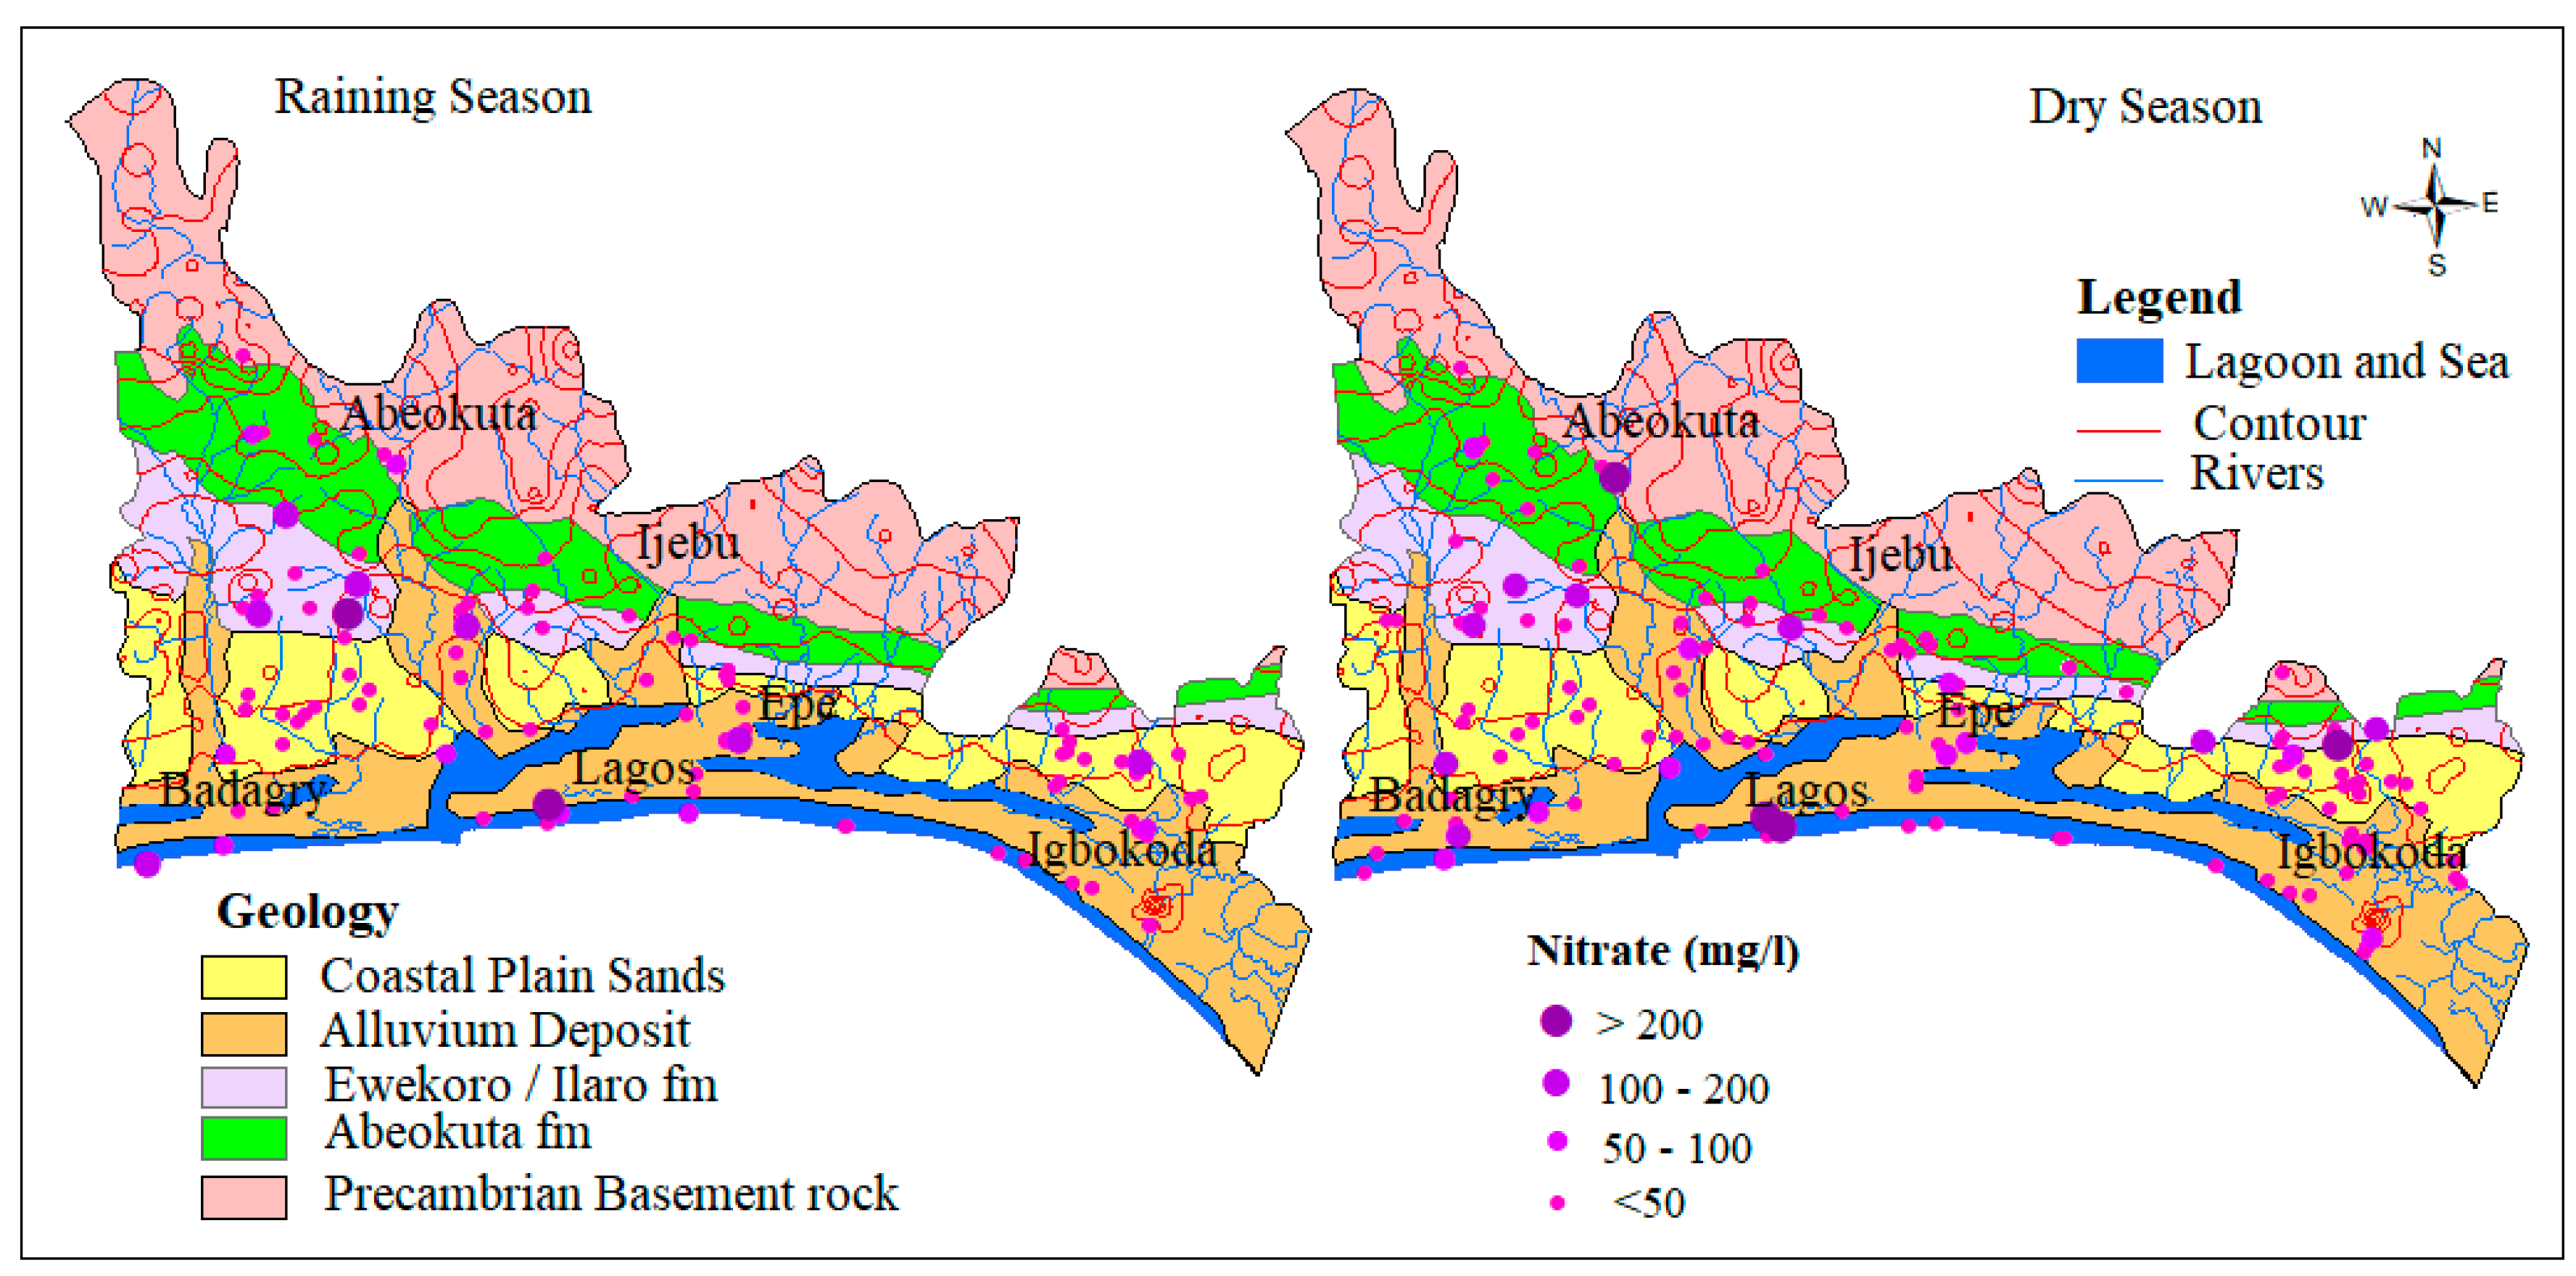
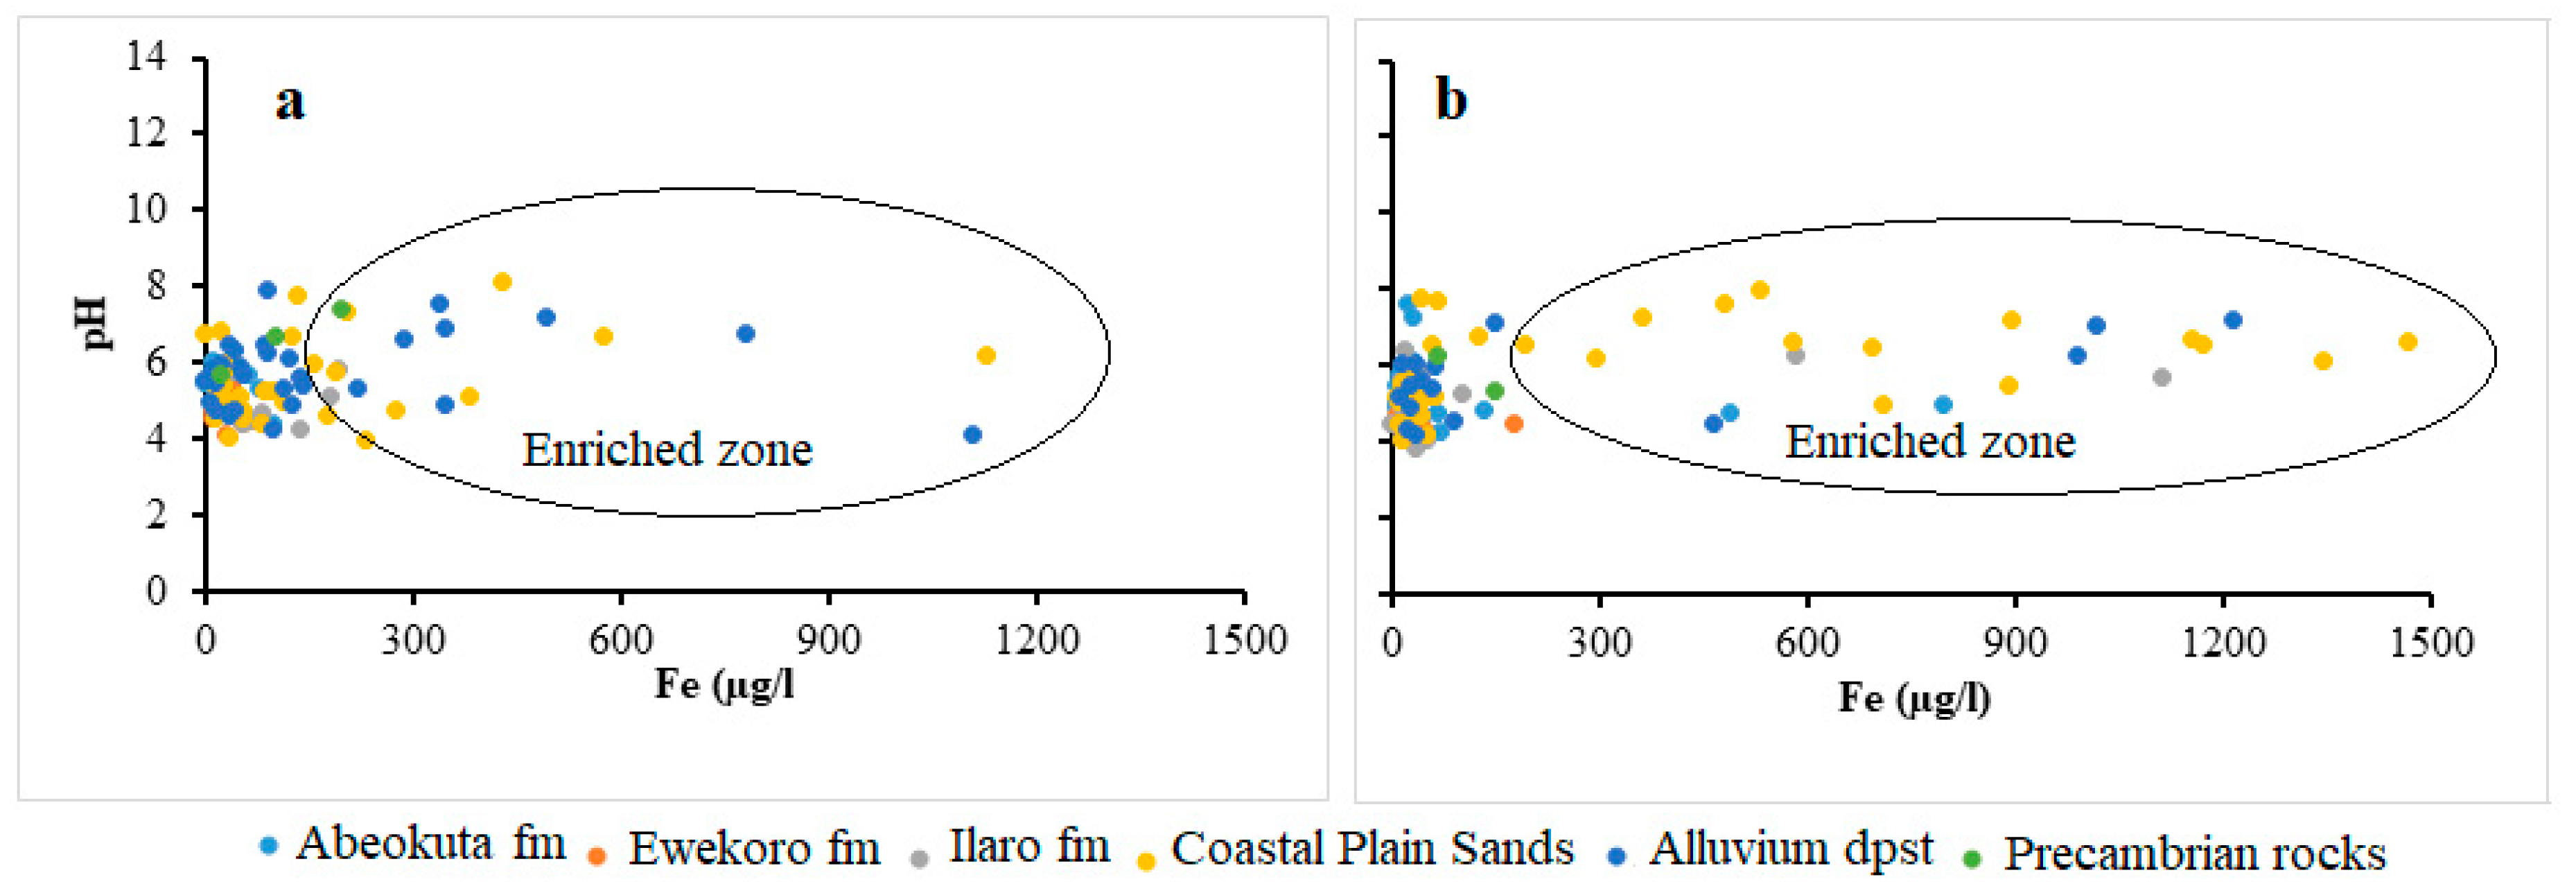
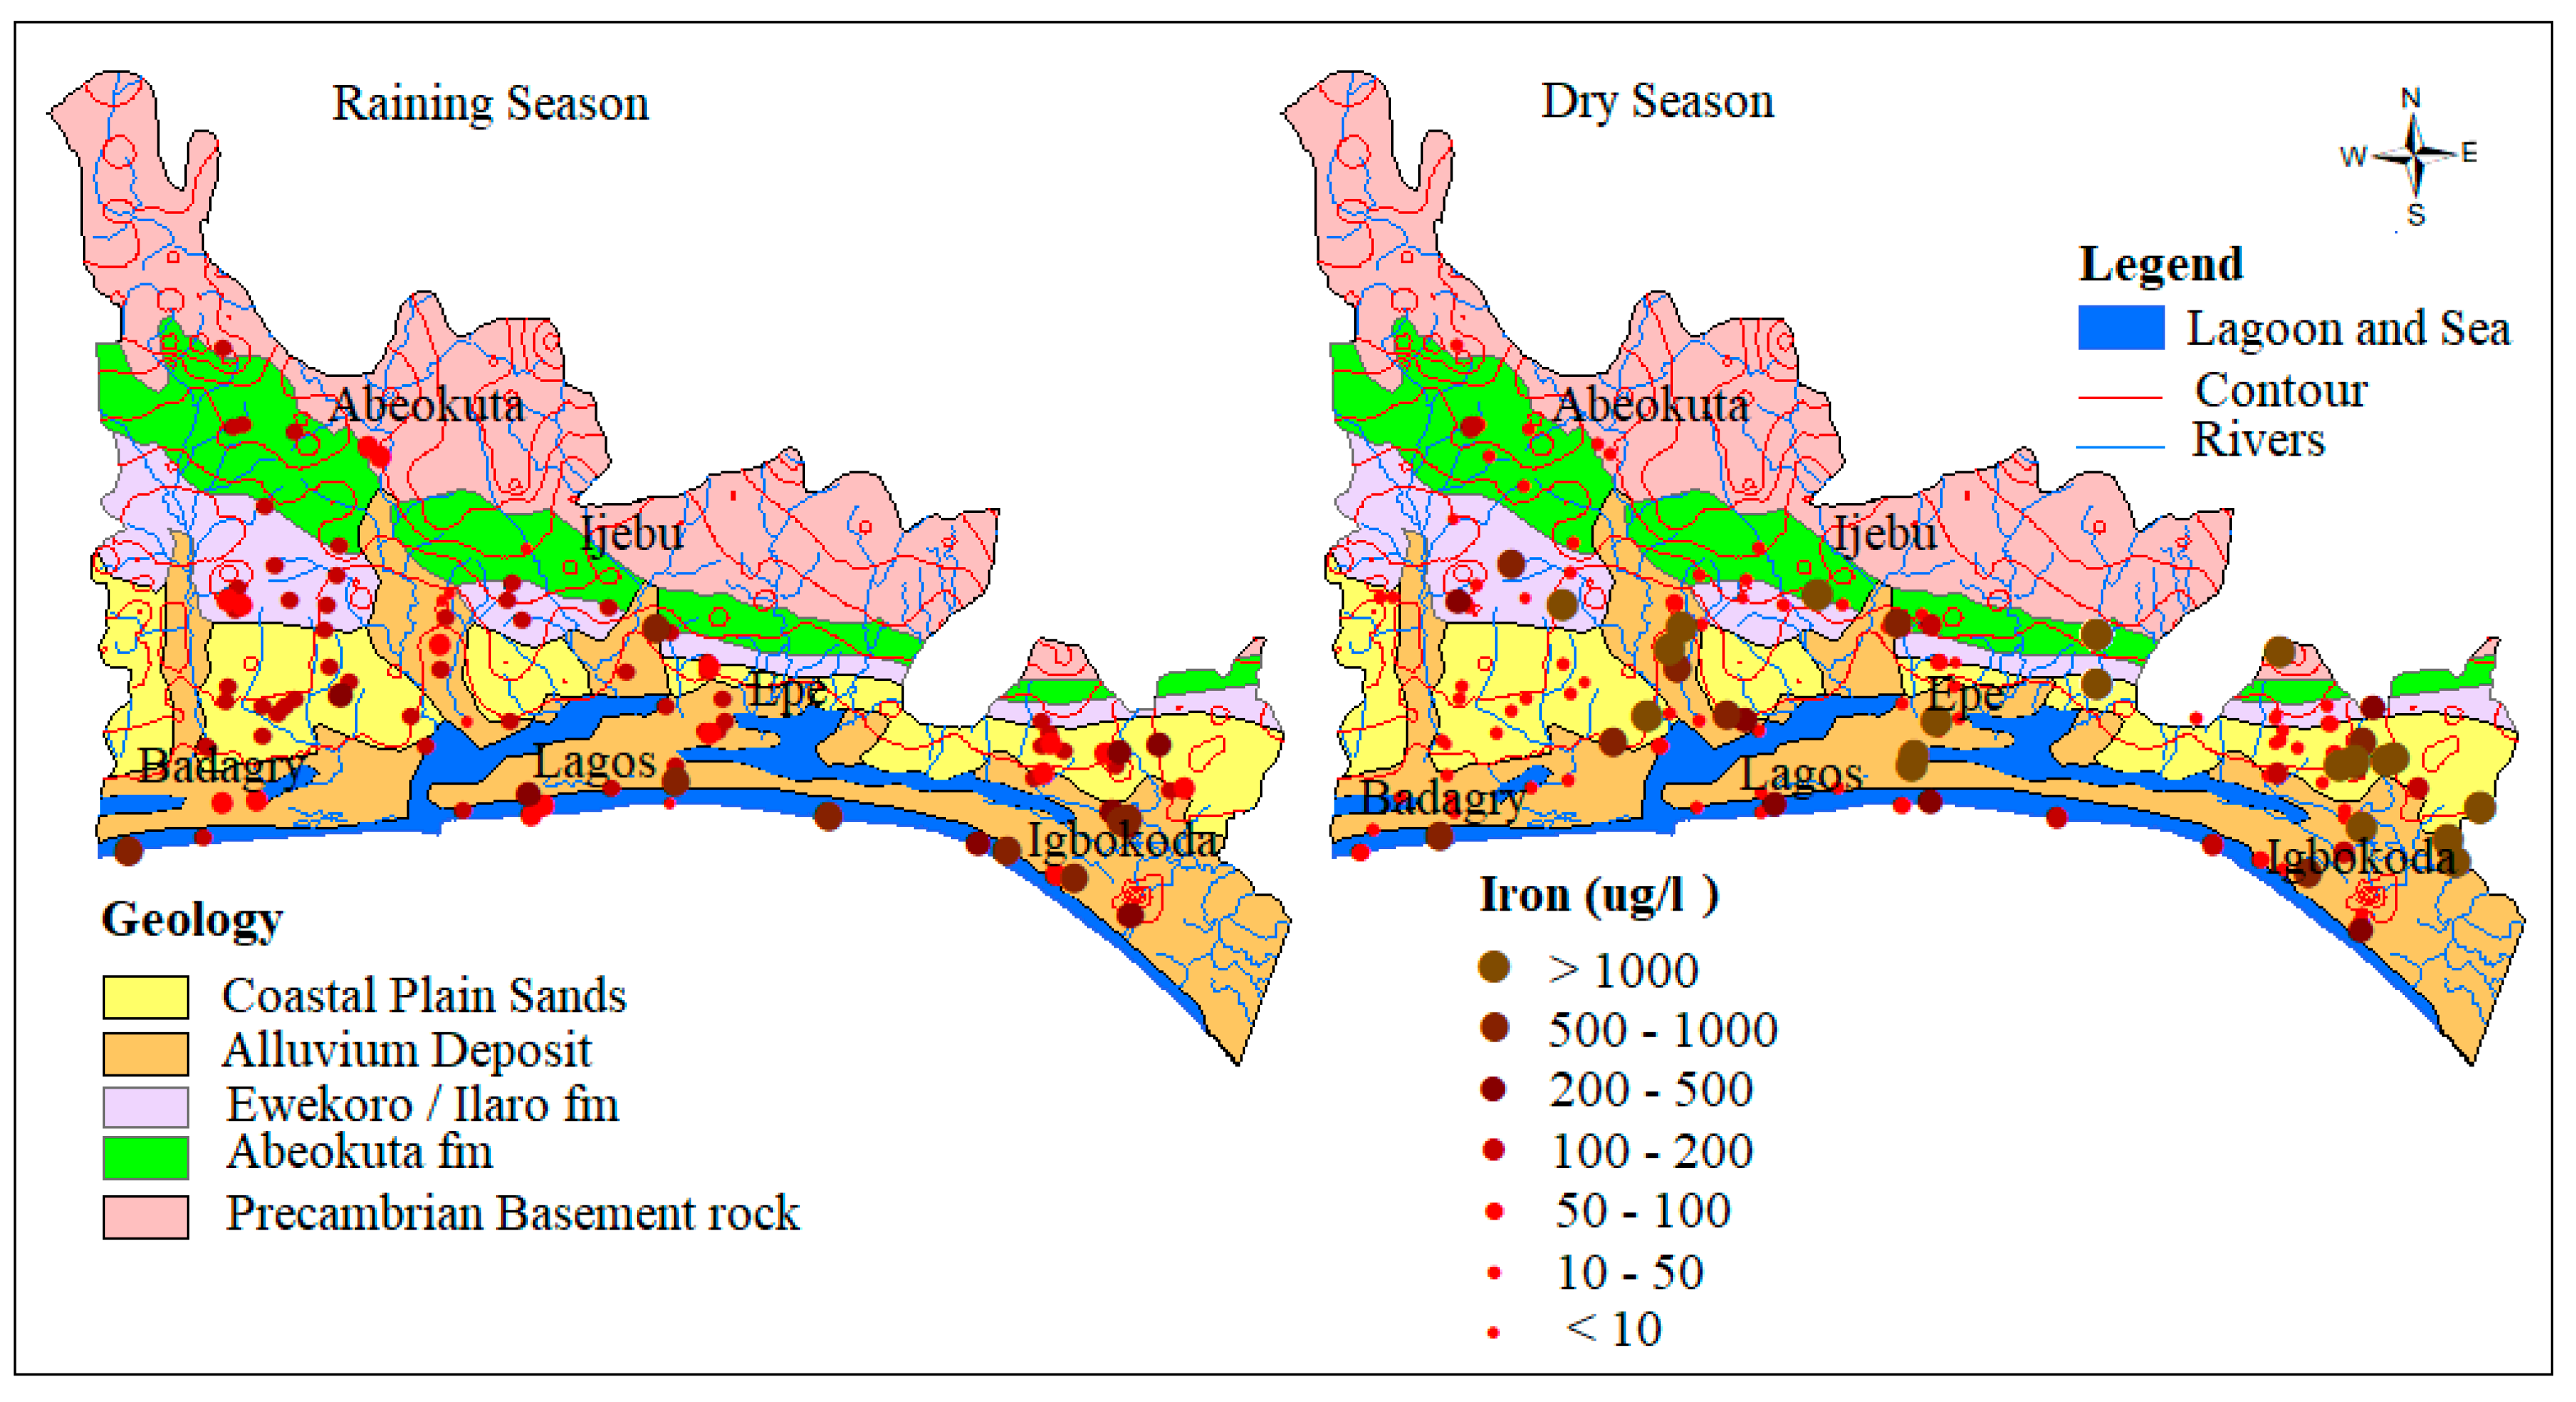
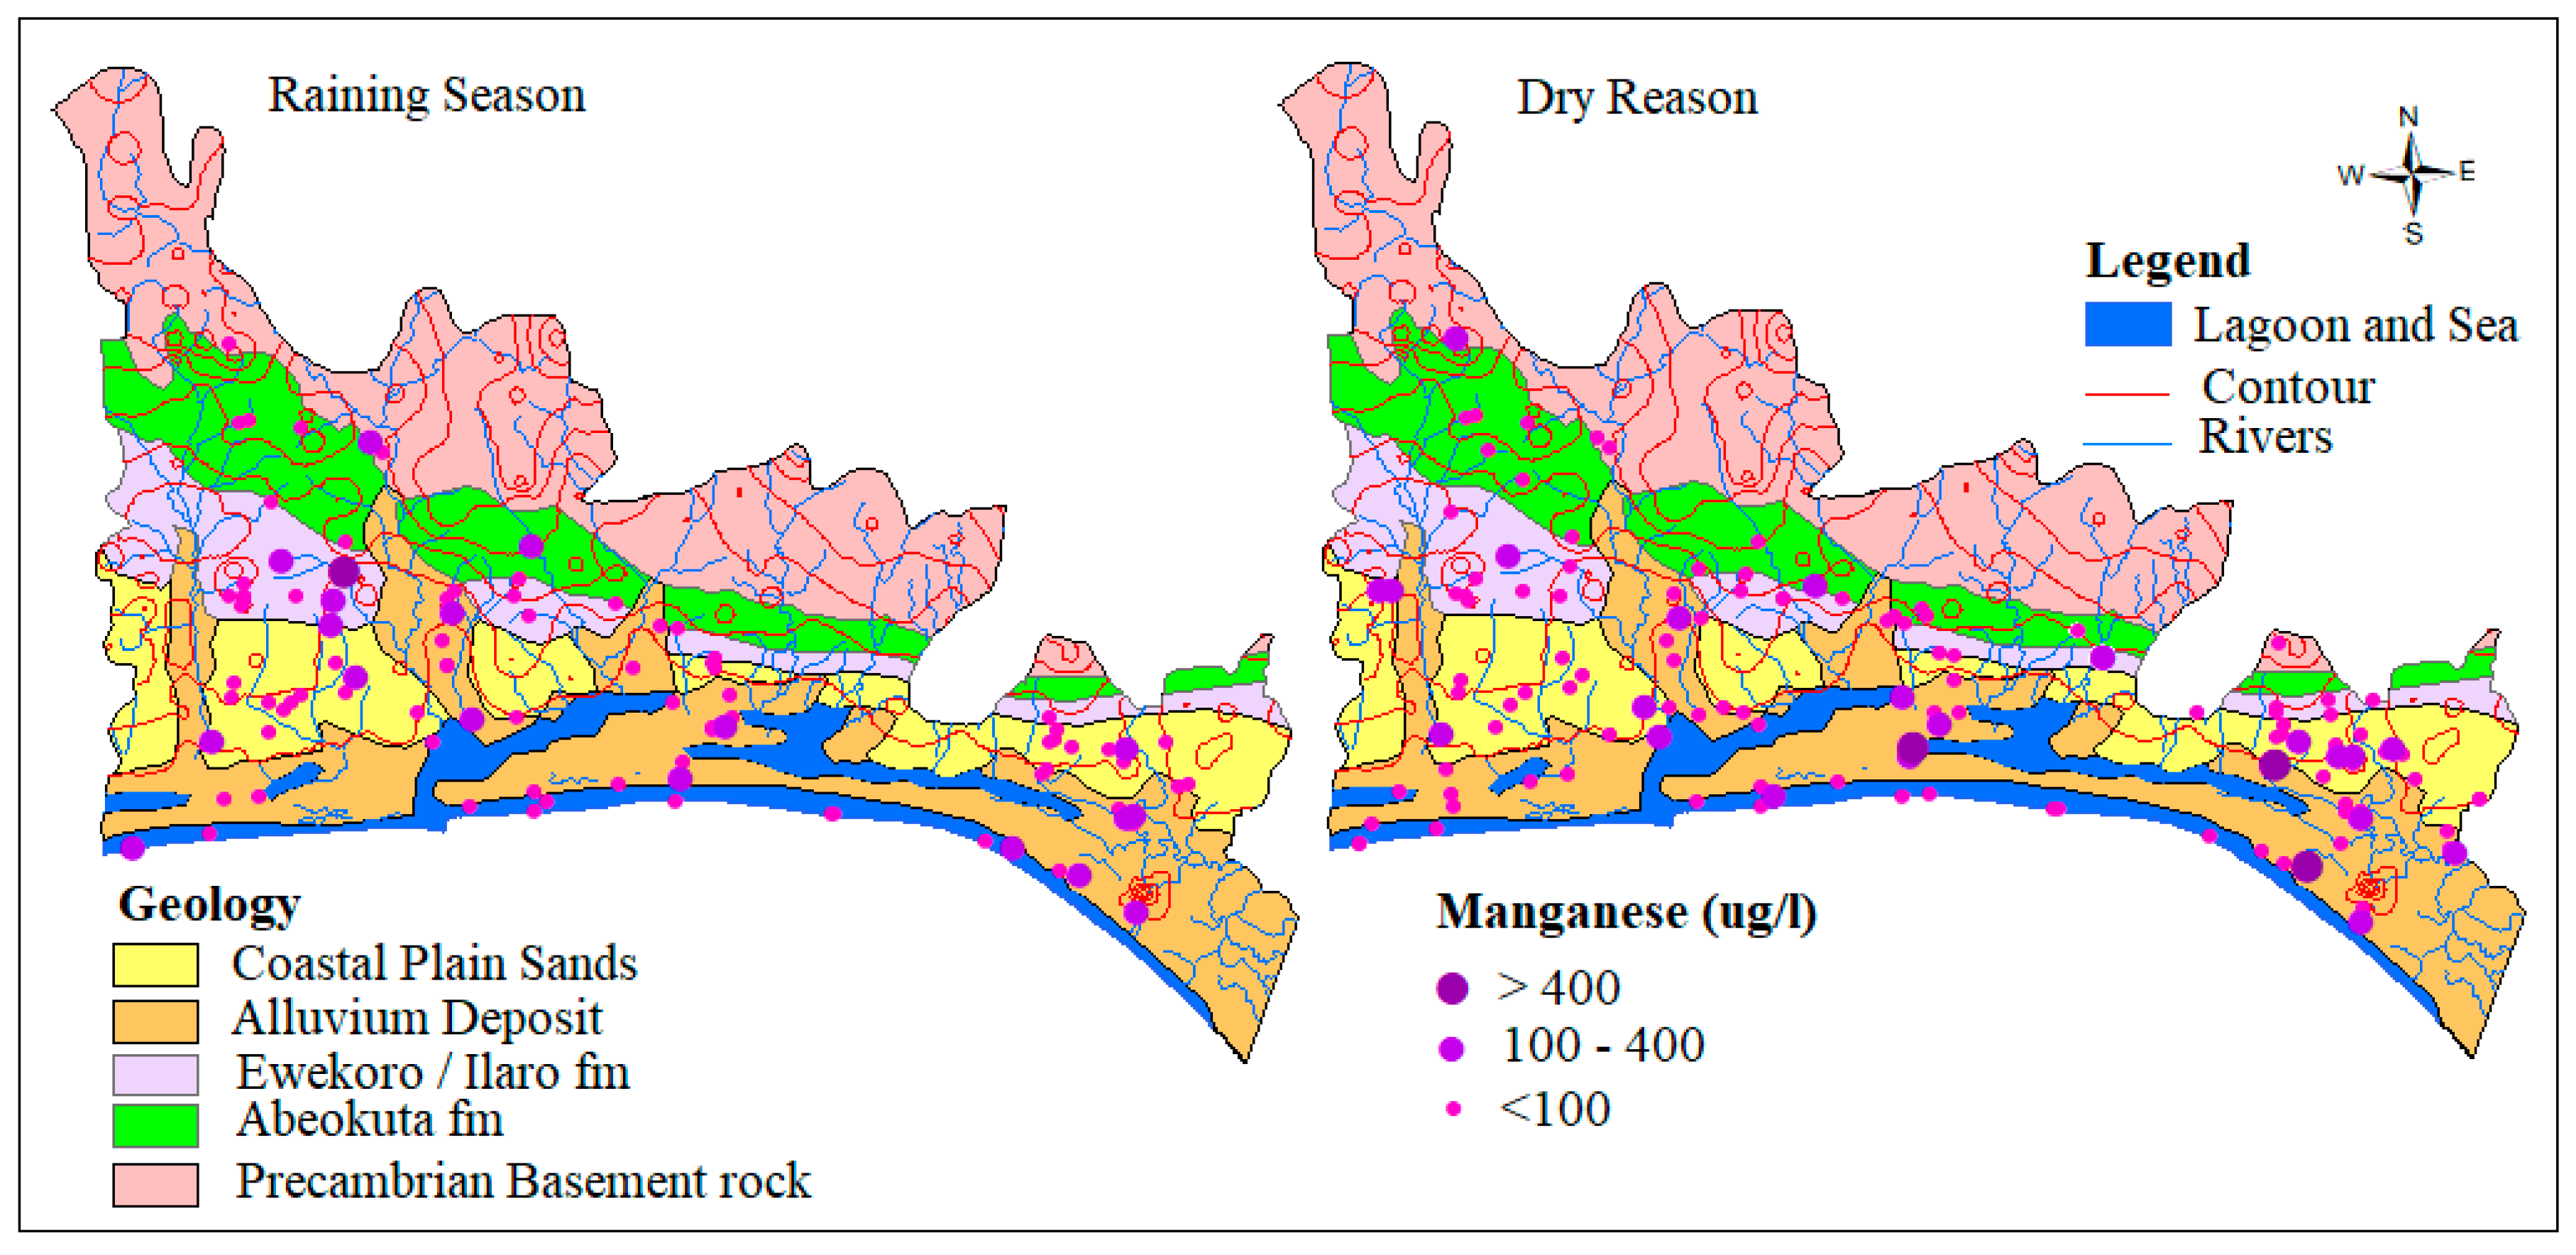
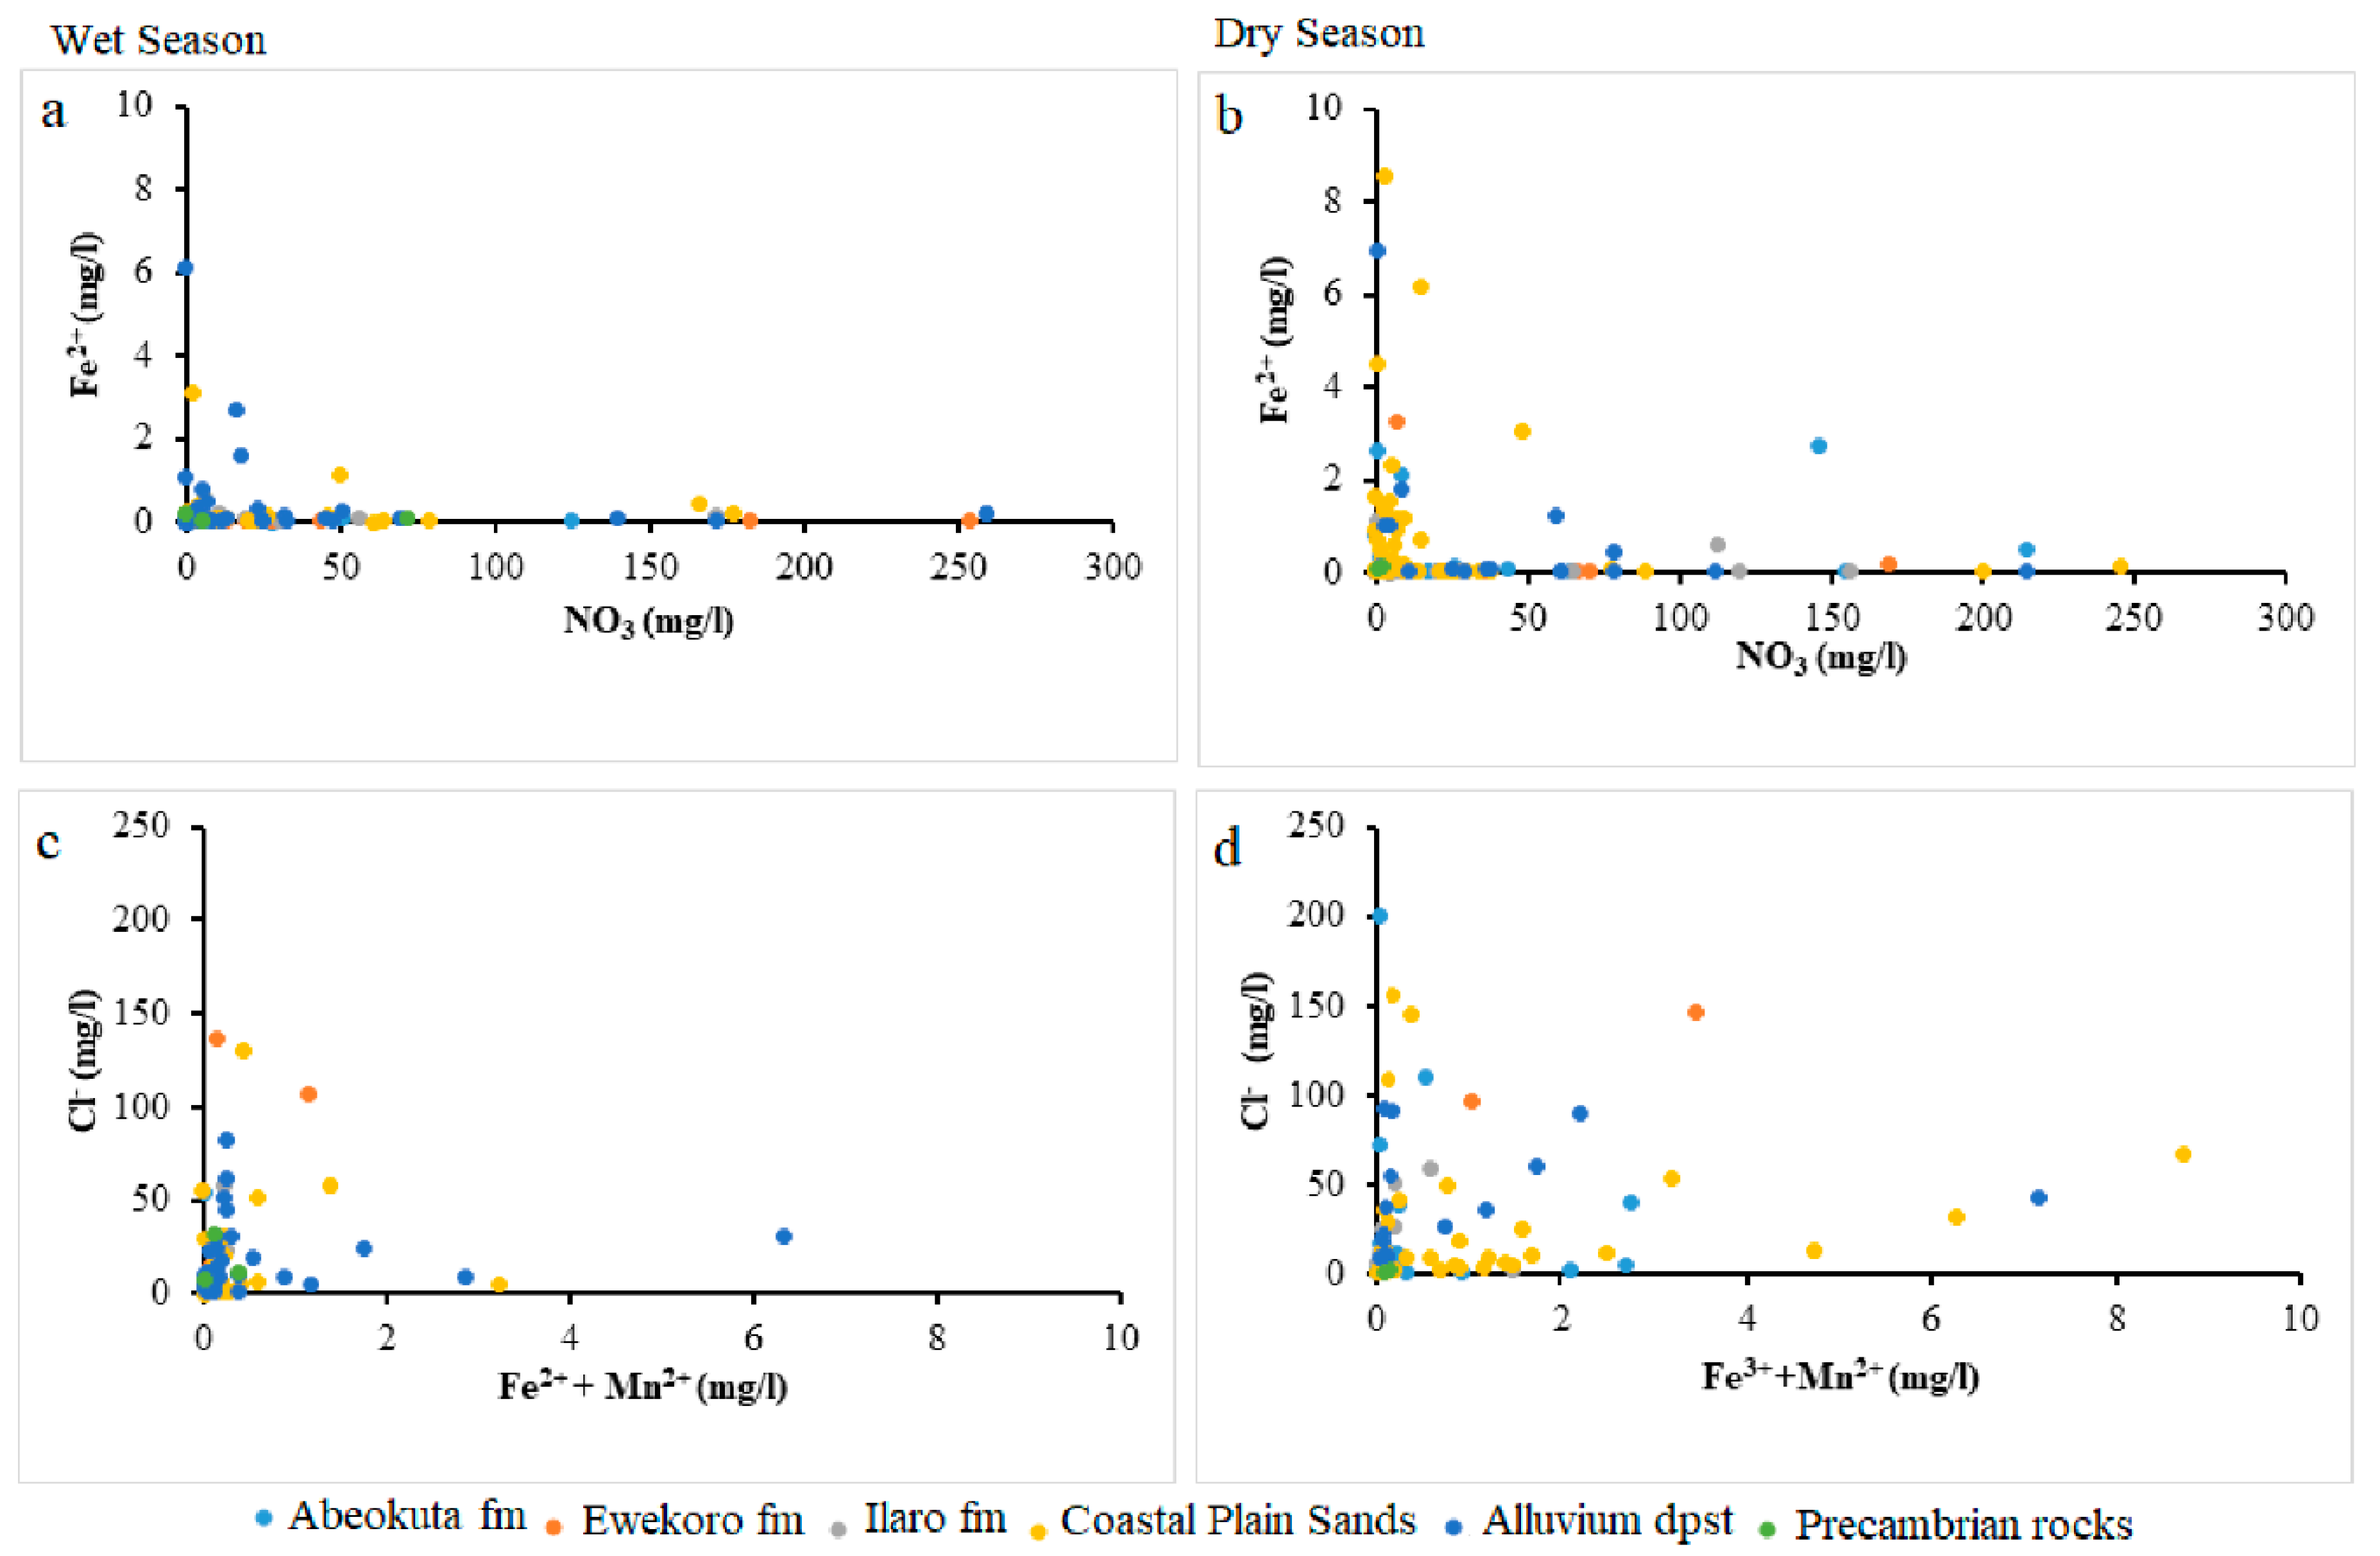
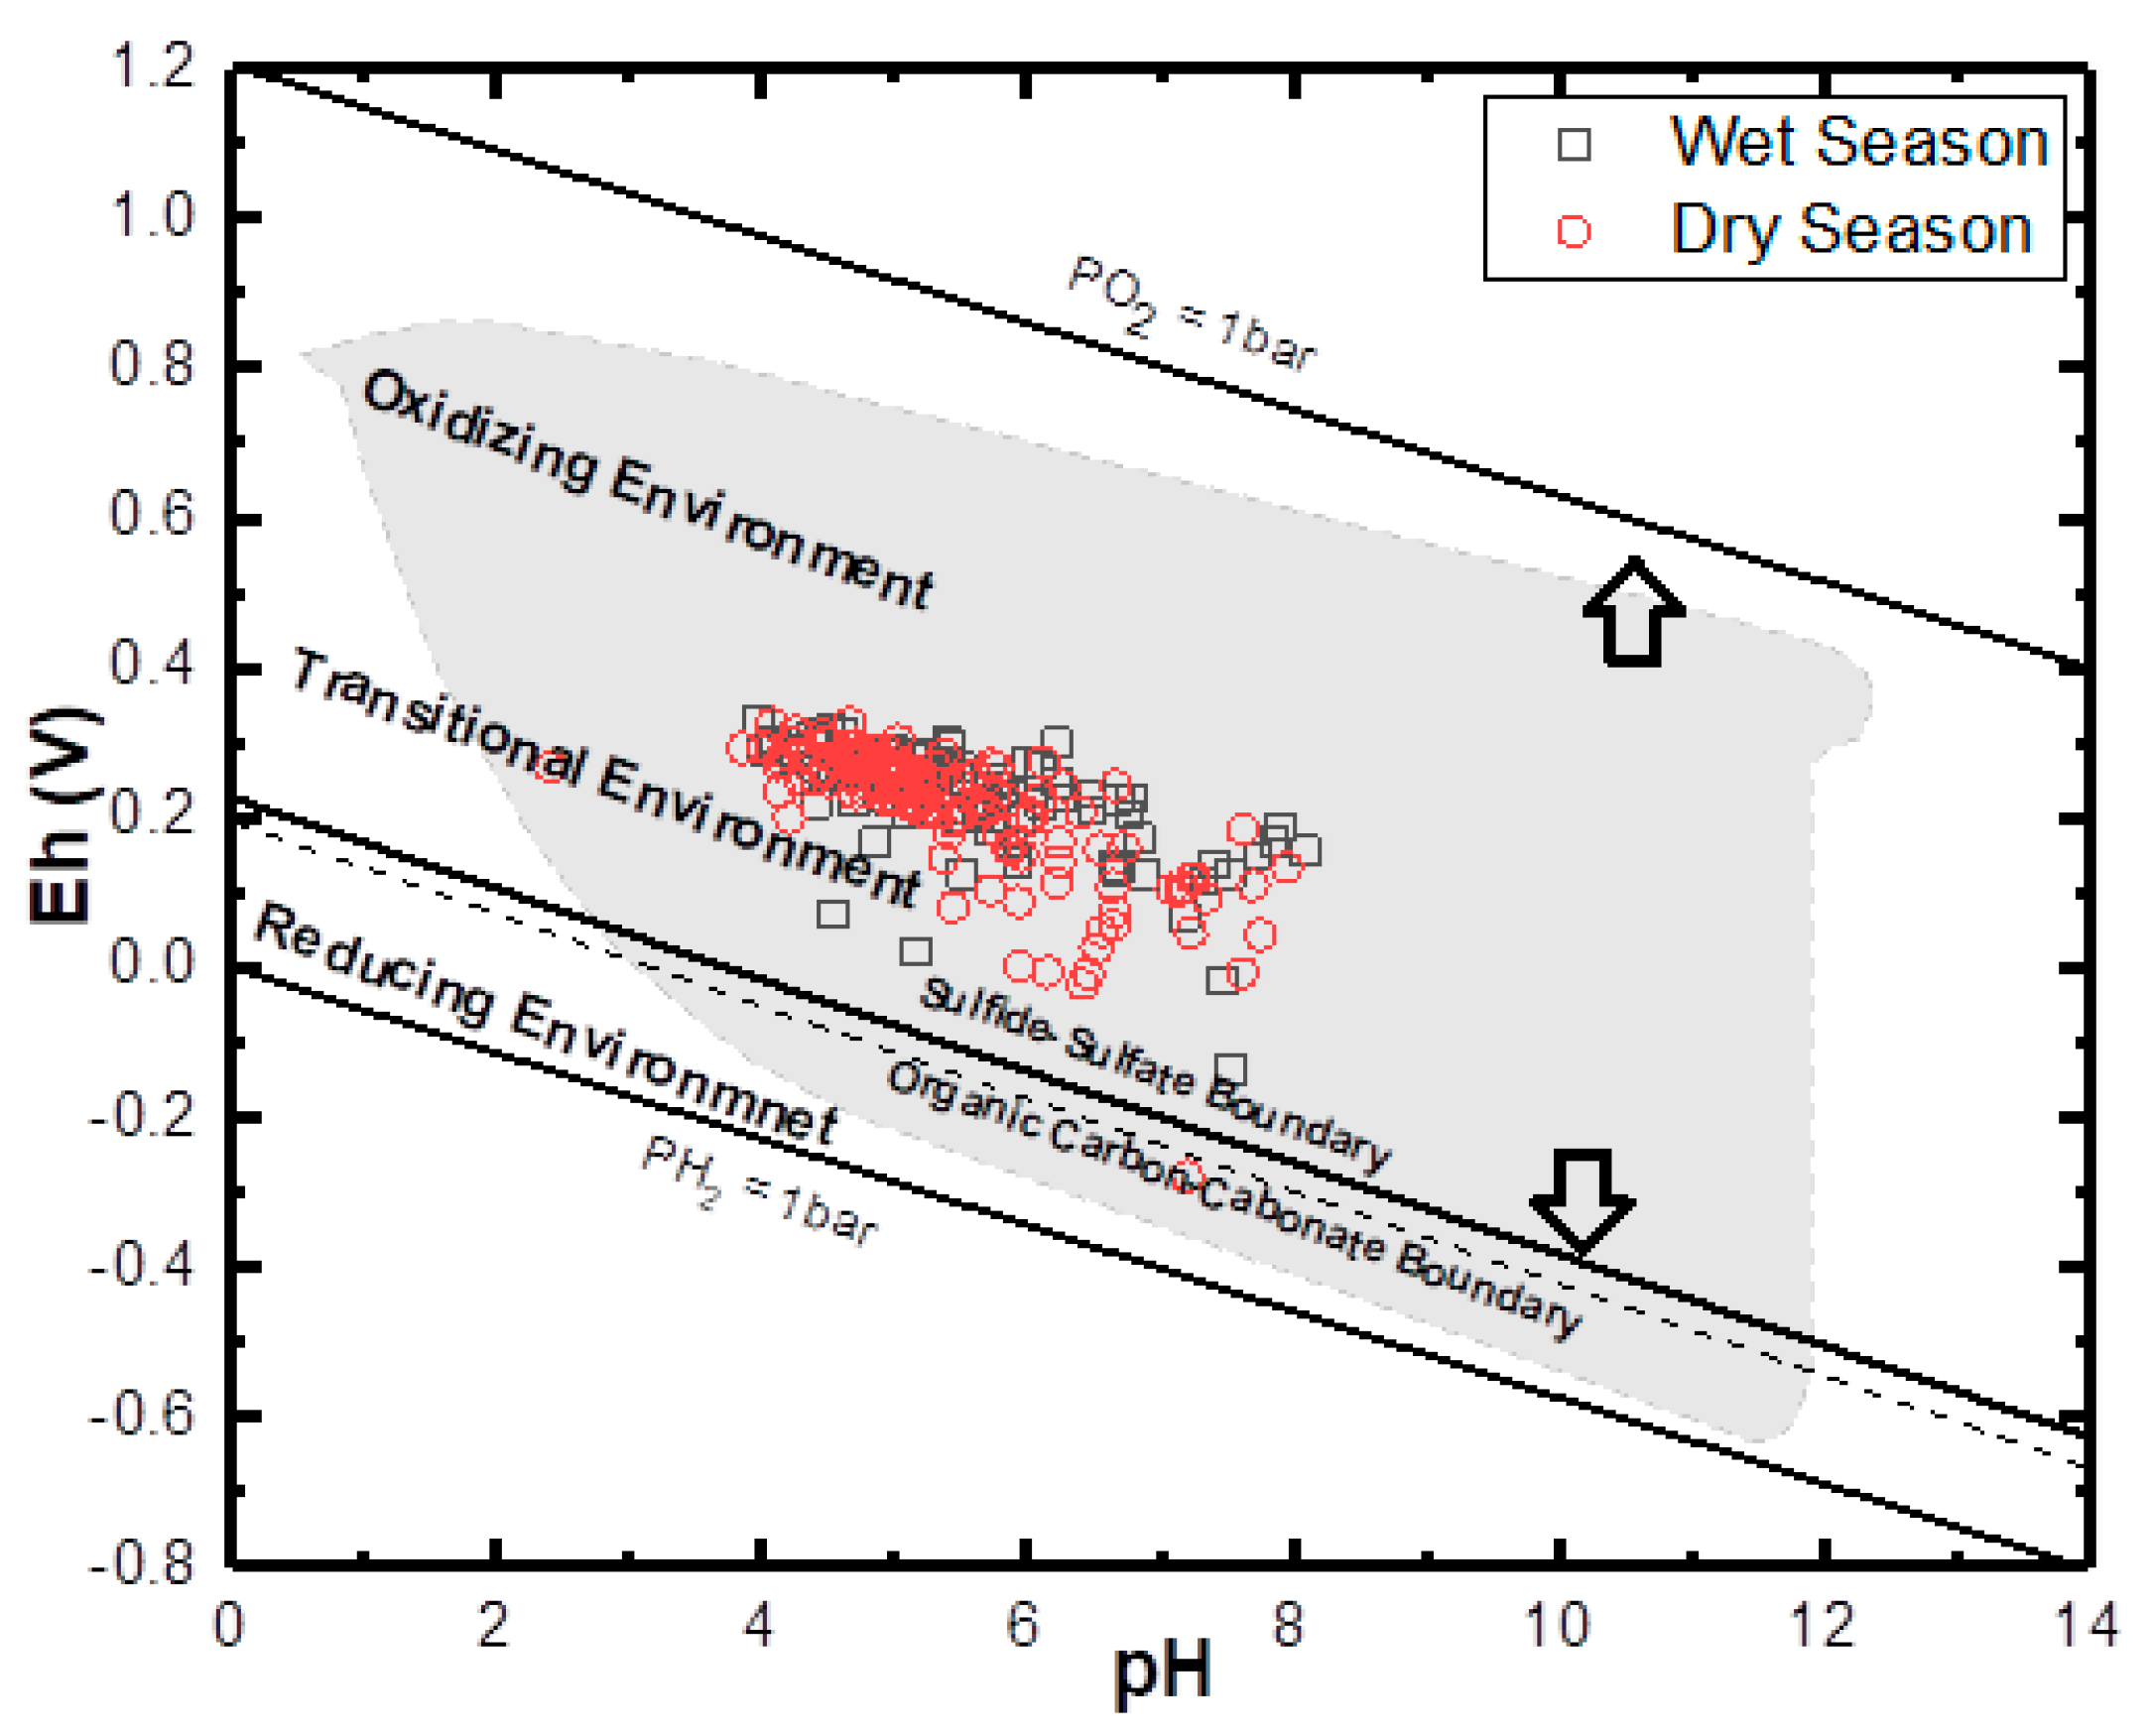
This study examined possible links between climate change and groundwater chemistry in the shallow coastal aquifers of Eastern Dahomey basin. There is evidence of chemical changes due to seasonal flooding resulting from extreme precipitation. Thus, we propose the biogeochemical processes of redox and other hydrochemical reactions, which might be influenced by future climate change. These processes are responsible for metals and ions mobilization/remobilization in surface and groundwater of this shallow coastal aquifer. Spatial distribution maps of SO42−, NO3, Fe, and Mn revealed higher concentrations within the Alluvium and Coastal Plain Sands aquifer and some wells with the river flood plains of the Basin. The generalized Eh-pH diagram revealed groundwater of the study area are within the transitional (aerobic to anaerobic) phase of the geochemical thermodynamics. It also revealed that Nitrate is a dominant species in the groundwater from both wet and dry seasons, while Iron occurrence is restricted to the alluvium and coastal plain sands aquifer. This study also revealed that the reduction in concentration and nutrient enrichment of groundwater with the increase in well depth can be attributed to the loss of aeration and possible natural attenuation by the soil and aquifer medium. The linear regression model using both Eh and pH as independent variables against other selected variables such as EC, salinity, SO42−, Cl, NO3, Fe, and Mn for both season groundwater samples established predictability for both Eh and pH. A possible indication of ions and metals enrichment in groundwater resulting from the effect of seasonal flooding. This enrichment rendered some of the sampled groundwater unsuitable for drinking as the concentration of some of the water quality parameters were above the WHO standard for drinking water. Accumulation could lead to severe contamination of surface and groundwater and render it not potable for drinking or other purposes. This study recommends policy and management enhancements for proper waste management to support SDG planning for sustainable groundwater resource management in the Eastern Dahomey Basin that limits further contamination of the coastal groundwater system in the face of seasonal flooding, especially as predictions suggest more extreme precipitation in the future resulting from climate change.

Author Contributions

J.A.A. and R.M.K. designed the research; J.A.A. wrote the original draft; R.M.K., P.S., and I.H. reviewed and edited the manuscript; R.M.K. gave critical views on the manuscript for further improvement. All authors have read and agreed to the published version of the manuscript.

Funding

This research was funded by the Petroleum Technology and Development Fund (PTDF) under the Overseas PhD scholarship scheme and supported by the Scottish Government under the Climate Justice Fund Water Futures Program, awarded to the University of Strathclyde (R.M. Kalin).

Acknowledgments

The authors would like to gratefully acknowledge Ademola Ologbe, David Akpan, Mara Knapp and Tatyana Peshkur for field and laboratory assistance.

Conflicts of Interest

The authors declare no conflict of interest.

References

  1. Omosuyi, G.O.; Oseghale, A. Groundwater vulnerability assessment in shallow aquifers using geoelectric and hydrogeologic parameters at Odigbo, Southwestern Nigeria. Am. J. Sci. Ind. Res. 2012, 501–512. [Google Scholar] [CrossRef]
  2. Adegbola, R.; Oseni, S.; Majolagbe, A. The impact assessment of oil spillage and trace metal assessment on groundwater in Baruwa, Lagos Southwest and Nigeria. Int. Sci. Investig. J. 2013, 2, 12–32. [Google Scholar]
  3. Oyelami, A.C.; Ojo, O.A.; Aladejana, .J.A.; Agbede, .O.O. Assessing the effect of a dumpsite on groundwater quality: A case study of aduramigba estate within osogbo metropolis. J. Environ. Earth Sci. 2013, 3, 120–131. [Google Scholar]
  4. Edet, A. Hydrogeology and groundwater evaluation of a shallow coastal aquifer, southern Akwa Ibom State (Nigeria). Appl. Water Sci. 2016, 7, 2397–2412. [Google Scholar] [CrossRef] [Green Version]
  5. Snyder, M.; Taillefert, M.; Ruppel, C. Redox zonation at the saline-influenced boundaries of a permeable surficial aquifer: Effects of physical forcing on the biogeochemical cycling of iron and manganese. J. Hydrol. 2004, 296, 164–178. [Google Scholar] [CrossRef]
  6. Holden, A.A.; Haque, S.E.; Mayer, K.U.; Ulrich, A.C. Biogeochemical processes controlling the mobility of major ions and trace metals in aquitard sediments beneath an oil sand tailing pond: Laboratory studies and reactive transport modeling. J. Contam. Hydrol. 2013, 151, 55–67. [Google Scholar] [CrossRef]
  7. Matiatos, I. Nitrate source identification in groundwater of multiple land-use areas by combining isotopes and multivariate statistical analysis: A case study of Asopos basin (Central Greece). Sci. Total Environ. 2016, 541, 802–814. [Google Scholar] [CrossRef]
  8. Delpla, I.; Jung, A.; Baures, E.; Clement, M.; Thomas, O. Impacts of climate change on surface water quality in relation to drinking water production. Environ. Int. 2009, 35, 1225–1233. [Google Scholar] [CrossRef]
  9. Ojolowo, S.; Wahab, B. Municipal solid waste and flooding in Lagos metropolis, Nigeria: Deconstructing the evil nexus. J. Geogr. Reg. Plan. Full 2017, 10, 174–185. [Google Scholar]
  10. Ayolabi, E.A.; Epelle, E.S.; Lucas, O.B.; Ojo, A. Geophysical and geochemical site investigation of eastern part of Lagos metropolis, southwestern Nigeria. Arab. J. Geosci. 2014, 8, 7445–7453. [Google Scholar] [CrossRef]
  11. IPCC. Climate Change 1995. The Science of Climate Cliange; The Press Syndicate of the University of Cambridge: Camebridge, UK, 1995; Volume 53. [Google Scholar]
  12. Whitehead, P.G.; Wilby, R.L.; Battarbee, R.W.; Kernan, M.; Wade, A.J. A review of the potential impacts of climate change on surface water quality a review of the potential impacts of climate change on surface water quality. Hydrol. Sci. J. ISSN 2009, 54, 101–123. [Google Scholar] [CrossRef]
  13. Guasch, H.; Serra, A.; Corcoll, N.; Bonet, B.; Leira, M. Metal ecotoxicology in fluvial biofilms: Potential influence of water scarcity. Hdb. Env. Chem. 2010, 41–53. [Google Scholar] [CrossRef]
  14. Ezekwe, C.I.; Edoghotu, M.I. Water quality and environmental health indicators in the Andoni River estuary, Eastern Niger Delta of Nigeria. Environ. Earth Sci. 2015, 74, 6123–6136. [Google Scholar] [CrossRef]
  15. Cann, K.F.; Thomas, D.; Salmon, R.; Wyn-Jones, A.; Kay, D. Extreme water-related weather events and waterborne disease. Epidemiol. Infect. 2013, 141, 671–686. [Google Scholar] [CrossRef]
  16. Kasei, R.A. Modelling Impacts of Climate Change on Water Resources in the Volta Basin, West Africa. Ph.D. Thesis, Mathematisch-Naturwissenschaftlichen Fakultät, Rheinischen Friedrich-Wilhelms-Universität Bonn, Bonn, Germany, 2009. [Google Scholar]
  17. Babanyara, Y.Y.; Usman, H.A.; Saleh, U.F. An overview of urban poverty and environmental problems in Nigeria. J. Hum. Ecol. 2010, 31, 135–143. [Google Scholar] [CrossRef]
  18. Serdeczny, O.; Adams, S.; Baarsch, F.; Coumou, D.; Robinson, A.; Hare, W.; Schaeffer, M.; Perrette, M.; Reinhardt, J. Climate change impacts in Sub-Saharan Africa: From physical changes to their social repercussions. Reg. Environ. Chang. 2016, 1–16. [Google Scholar] [CrossRef]
  19. Pfeiffer, M.; Batbayar, G.; Hahn-tomer, D.K.S. Investigating arsenic (As) occurrence and sources in ground, surface, waste and drinking water in northern Mongolia. Environ. Earth Sci. 2015, 73, 649–662. [Google Scholar] [CrossRef]
  20. Priyantha Ranjan, S.; Kazama, S.; Sawamoto, M. Effects of climate and land use changes on groundwater resources in coastal aquifers. J. Environ. Manag. 2006, 80, 25–35. [Google Scholar] [CrossRef] [Green Version]
  21. Linzey, D. Atlantic climate adaptation solutions association saltwater intrusion and climate change. 2011. Available online: http://www.gov.pe.ca/photos/original/cle_WA1.pdf (accessed on 1 January 2020).
  22. Hiyama, T.; Babiker, I.S.; Mohamed, M.A.A. Groundwater as a Key for Adaptation to Changing Climate and Society; Springer: Tokyo, Japan, 2014; ISBN 978-4-431-54967-3. [Google Scholar]
  23. Unsal, B.; Yagbasan, O.; Yazicigil, H. Assessing the impacts of climate change on sustainable management of coastal aquifers. Environ. Earth Sci. 2014, 72, 2183–2193. [Google Scholar] [CrossRef]
  24. Nistor, M.-M.; Dezsi, Ş.; Cheval, S.; Baciu, M. Climate change effects on groundwater resources: A new assessment method through climate indices and effective precipitation in Beliş district, Western Carpathians. Meteorol. Appl. 2016, 23, 554–561. [Google Scholar] [CrossRef]
  25. Ayolabi, E.A.; Folorunso, A.F.; Kayode, O.T. Integrated geophysical and geochemical methods for environmental assessment of municipal dumpsite system. Int. J. Geosci. 2013, 4, 850–862. [Google Scholar] [CrossRef] [Green Version]
  26. Hashmi, M.Z.; Yu, C.; Shen, H.; Duan, D. Concentrations and human health risk assessment of selected heavy metals in surface water of the siling reservoir watershed in Zhejiang Province, China. Pol. J. Environ. Stud. 2014, 23, 801–811. [Google Scholar]
  27. Bieroza, M.Z.; Heathwaite, A.L. Seasonal variation in phosphorus concentration—Discharge hysteresis inferred from high-frequency in situ monitoring. J. Hydrol. 2015, 524, 333–347. [Google Scholar] [CrossRef] [Green Version]
  28. Nick, H.M.; Raoof, A.; Centler, F.; Thullner, M.; Regnier, P. Reactive dispersive contaminant transport in coastal aquifers: Numerical simulation of a reactive Henry problem. J. Contam. Hydrol. 2013, 145, 90–104. [Google Scholar] [CrossRef]
  29. Offodile, M.E. The Hydrogeology of Coastal Areas of Southeastern states of Nigeria. J. Min. Geol. 1971, 14, 94–101. [Google Scholar]
  30. Adegoke, O.S.; Omatsola, M.E. Tectonic evolution and cretaceous stratigraphy of the dahomey basin. Niger. J. Min. Geol. 1981, 18, 130–137. [Google Scholar]
  31. Jones, H.A.; Hockey, R. The geology of part of southwestern Nigeria. GSN Bull. 1964, 31, 87. [Google Scholar]
  32. Kogbe, C.A. The cretaceous and paleogene sediments of Southern Nigeria. In Geology of Nigeria, 2nd ed.; Kogbe, C.A., Ed.; Rock View (Nig) Ltd.: Owerri, Nigeria, 1976; pp. 273–282. [Google Scholar]
  33. Reyment, R.A. Aspects of Geology of Nigeria; Ibadan University Press: Ibadan, Nigeria, 1965; p. 145. [Google Scholar]
  34. Longe, E.O.; Malomo, S.; Olorunniwo, M.A. Hydrogeology of Lagos metropolis. J. Afr. Earth Sci. 1987, 6, 163–174. [Google Scholar] [CrossRef]
  35. Adeoti, L.; Alile, O.M.; Uchegbulam, O. Geophysical investigation of saline water intrusion into freshwater aquifers: A case study of Oniru, Lagos State. Sci. Res. Essays 2010, 5, 248–259. [Google Scholar]
  36. Fatoba, J.O.; Omolayo, S.D.; Adigun, E.O. Using geoelectric soundings for estimation of hydraulic characteristics of aquifers in the coastal area of Lagos, southwestern Nigeria. Int. Lett. Nat. Sci. 2014, 11, 30–39. [Google Scholar] [CrossRef] [Green Version]
  37. Faleye, E.T. Olorunfemi aquifer characterization and groundwater potential assessment of the sedimentary basin of ondo state 1 2. Ife J. Sci. 2015, 17, 429–439. [Google Scholar]
  38. Offodile, M.E. Hydrogeology: Groundwater Study and Development in Nigeria, 3rd ed.; Mecon Geology and Engineering Services Ltd.: Jos, Nigeria, 2014; ISBN 978-30956-41. [Google Scholar]
  39. Adhikary, P.P.; Chandrasekharan, H.; Chakraborty, D.; Kumar, B.; Yadav, B.R. Statistical approaches for hydrogeochemical characterization of groundwater in West Delhi, India. Environ. Monit. Assess. 2009, 154, 41–52. [Google Scholar] [CrossRef] [PubMed]
  40. Wu, M.-L.; Wang, Y.-S.; Sun, C.-C.; Wang, H.; Dong, J.-D.; Yin, J.-P.; Han, S.-H. Identification of coastal water quality by statistical analysis methods in Daya Bay, South China Sea. Mar. Pollut. Bull. 2010, 60, 852–860. [Google Scholar] [CrossRef]
  41. Amangabara, G.T.; Ejenma, E. Groundwater quality assessment of Yenagoa and between 2010 and 2011. Resour. Environ. 2012, 2, 20–29. [Google Scholar] [CrossRef]
  42. Thilagavathi, R.; Chidambaram, S.; Thivya, C.; Prasanna, M.V.; Keesari, T.; Pethaperumal, S. Assessment of groundwater chemistry in layered coastal aquifers using multivariate statistical analysis. Sustain. Water Resour. Manag. 2017, 3, 55–69. [Google Scholar] [CrossRef]
  43. Boughariou, E.; Bahloul, M.; Jmal, I.; Allouche, N.; Makni, J.; Khanfir, H.; Bouri, S. Hydrochemical and statistical studies of the groundwater salinization combined with MODPATH numerical model: Case of the Sfax coastal aquifer, Southeast Tunisia. Arab. J. Geosci. 2018, 11, 69. [Google Scholar] [CrossRef]
  44. Ganiyu, S.A.; Badmus, B.S.; Olurin, O.T.; Ojekunle, Z.O. Evaluation of seasonal variation of water quality using multivariate statistical analysis and irrigation parameter indices in Ajakanga area, Ibadan, Nigeria. Appl. Water Sci. 2018, 8, 35. [Google Scholar] [CrossRef] [Green Version]
  45. White, J.K.; Beaven, R.P.; Powrie, W.; Knox, K. Leachate recirculation in a landfill: Some insights obtained from the development of a simple 1-D model. Waste Manag. 2011, 31, 1210–1221. [Google Scholar] [CrossRef]
  46. Zhang, Y.; Li, F.; Zhang, Q.; Li, J.; Liu, Q. Tracing nitrate pollution sources and transformation in surface- and ground-waters using environmental isotopes. Sci. Total Environ. 2014, 490, 213–222. [Google Scholar] [CrossRef]
  47. Larsen, G.R. Determination of Coastal Ground and Surface Water Processes and Character by Use of Hydrochemistry and Stable Isotopes, Fraser Coast, Queensland. Ph.D. Thesis, Queensland University of Technology, Brisbane City, Australia, 2012. [Google Scholar]
  48. Russak, A.; Sivan, O.; Yechieli, Y. Trace elements (Li, B, Mn and Ba) as sensitive indicators for salinization and freshening events in coastal aquifers. Chem. Geol. 2016, 441, 35–46. [Google Scholar] [CrossRef]
  49. Wu, Y.; Prulho, R.; Brigante, M.; Dong, W.; Hanna, K.; Wu, Y.; Prulho, R.; Brigante, M.; Dong, W.; Hanna, K. Activation of persulfate by Fe (III) species: Implications for 4-tert-butylphenol degradation to cite this version: HAL Id: hal-01438110. J. Hazard. Mater. 2017. [Google Scholar] [CrossRef]
  50. Capaccioni, B.; Didero, M.; Paletta, C.; Didero, L. Saline intrusion and refreshening in a multilayer coastal aquifer in the Catania Plain (Sicily, Southern Italy): Dynamics of degradation processes according to the hydrochemical characteristics of groundwaters. J. Hydrol. 2005, 307, 1–16. [Google Scholar] [CrossRef]
  51. Fan, A.M.; Steinberg, V.E. Health implications of nitrate and nitrite in drinking water: An update on methemoglobinemia occurrence and reproductive and developmental toxicity. Regul. Toxicol. Pharmacol. 1996, 23, 35–43. [Google Scholar] [CrossRef] [PubMed]
Figure 1. Schematic diagram of the biogeochemical process of some selected redox-sensitive ions in a typical coastal aquifer (Modified after [29]).
Water 12 00224 g001
Figure 2. Geology map of the Eastern Dahomey basin showing the sampling points.
Water 12 00224 g002
Figure 3. A lithological section showing the description of the vadose zone and aquifers of the southwestern coast of Nigeria.
Water 12 00224 g003
Figure 4. Spatial distribution of SO42− across the Eastern Dahomey Basin.
Water 12 00224 g004
Figure 5. Spatial distribution of NO3 in mg/L.
Water 12 00224 g005
Figure 6. Scatter plots of Fe against pH for (a) wet and (b) dry season.
Water 12 00224 g006
Figure 7. Spatial distribution of Fe3+ in µg/L.
Water 12 00224 g007
Figure 8. Spatial distribution of Mn2+ in µg/L.
Water 12 00224 g008
Figure 9. Scatter plots NO3 against Fe2+ (a) wet season (b) dry season and Fe2+ + Mn2+ against Cl (c) wet season (d) dry season.
Water 12 00224 g009
Figure 10. Scatter plots (Fe2+ + Mg2+) against Eh (a) wet season (b) dry season and NO3 against Eh (c) wet season (d) dry season.
Water 12 00224 g010
Figure 11. Scatter plots (Fe2+ + Mn2+) against well depth (a) wet season (b) dry season and NO3 against well depth (c) wet season (d) dry season.
Water 12 00224 g011
Figure 12. General Eh-Ph diagram for both wet and dry season groundwater samples. The upper and lower stability limits of water are given where PO2 and PH2 = 1 bar. The dry season shows more extensive variation in the thermodynamic phase, while both are generally plotted within the transitional phase.
Water 12 00224 g012
Figure 13. Eh-pH diagram for Iron species in the sampled groundwater (a) Wet season; (b) dry season.
Water 12 00224 g013
Figure 14. Redox plot for Nitrogen species in the sampled groundwater (a) Wet season; (b) dry season.
Water 12 00224 g014
Table 1. Statistical summary of physicochemical parameters from water samples for both seasons.
ParamWet SeasonDry Season
MinMaxAverStdevNMinMaxAverStdevN
Elev−1.00230.046.339.896−1.023048.241.5134
pH3.978.105.571.00963.858.05.50.9134
EC0.00120002951219965.5010009348995134
TDS0.008500201863962.306750232668134
ORP−1363302227496−28032620892.1134
Sal0.00500013750996145070173502134
Temp25.534.629.41.79626.637.731.21.7134
SWL0.2067.018.315.4960.312318.819.2134
Cl0.10189702181934960.9128931.6116134
SO40.10221137.9245960.357617.556.1134
NO30.0225932.254960.331230.354.4134
Br0.0040.80.464.2960.0121.70.31.9134
Fe0.006.100.30.8960.011361.511.9134
Mn0.001.110.10.1960.0027.70.32.4134
Elevation and Static water level in (m), EC in (µS/cm), Eh in (mV), TDS, salinity, and other ions and metals measured in mg/L.
Table 2. Multiple regression statistical model with dependent variables against the pH as independent variables for selected wet season hydrochemical parameters.
ParametersCoefficientStd. Errorzp-Value
pH(−1)0.27150.05165.265<0.0001***
const6.10090.90106.771<0.0001***
SO420.01920.00365.291<0.0001***
Cl−0.00220.0004−5.188<0.0001***
NO3−0.00220.0008−3.1950.0014***
Fe0.27210.08333.2690.0011***
Mn−0.00520.4067−0.012800.9898
EC7.48261 × 10−54.67708 × 10−51.6000.1096
Temp−0.07770.0287−2.7110.0067***
Table 3. Multiple regression statistical model with dependent variables against the pH as independent variables for selected dry season groundwater quality parameters.
ParametersCoefficientStd. Errorzp-Value
pH(−1)0.056210.04491.2520.2106
const4.96670.338314.68<0.0001***
Sal4.81623 × 10−50.00020.22800.8196
Temp0.01080.003013.5940.0003***
SO40.00220.00201.0760.2819
Cl0.00070.00110.60990.5419
NO3−0.00570.0019−2.9480.0032***
Fe0.01250.08270.15080.8801
Mn−0.06360.4079−0.15590.8761
SWL−0.01733350.0056−3.1000.0019***
Table 4. Multiple regression statistical model with dependent variables against the Eh as independent variables for selected wet season hydrochemical parameters.
ParametersCoefficientStd. Errorzp-Value
ORP(−1)0.31810.09893.2150.0013***
const0.47470.64210.73930.4598
Sal−0.27390.0872−3.1420.0017***
Temp5.67014.70941.2040.2286
SWL1.04810.55351.8940.0583*
SO420.43480.59580.72980.4655
Cl−0.05300.0689−0.76890.4420
NO30.14680.10041.4620.1437
Fe−22.010410.2563−2.1460.0319**
Mn−23.331431..8584−0.73230.4640
Table 5. Multiple regression statistical model with dependent variables against the Eh as independent variables for selected dry season hydrochemical parameters.
ParametersCoefficientStd. Errorzp-Value
ORPmV(−1)0.35960.0350110.27<0.0001***
const143.19711.349012.62<0.0001***
Sal−0.06240.0087−7.178<0.0001***
Temp−0.26110.1027−2.5420.0110**
SWL0.96310.20574.684<0.0001***
SO40.12940.07081.8280.0675*
Cl−0.25830.0347−7.446<0.0001***
NO30.45140.09704.655<0.0001***
Fe−2.61301.4991−1.7430.0814*
Mn−0.80531.5327−0.52540.5993
Table 6. Comparing some selected ions from the wet season with the World Health Organization (WHO) water quality highest permissible standard.
WHO Standard Classification Wet Season Groundwater Samples N = 96
ParameterspHECTDSClSO4NO3FeMn
Samples within WHO LimitsNo. of Sample1895959495789077
% Sample18.7598.9698.9697.998.9681.393.880.2
Samples above WHO Permissible LimitsNo. of Sample78112118619
% Sample81.1112.1118.86.319.8
Dry Season Groundwater Samples N = 134
Samples within WHO LimitsNo. of Sample2112312313013310810109
% Sample15.892.392.399.699.682.47.581.8
Samples above WHO Permissible LimitsNo. of Sample1131111112312325
% Sample84.27.77.70.40.417.692.518.2
WHO Permissible Std 6.5–8.5750500200200500.010.1

