Article

Unsustainability Syndrome—From Meteorological to Agricultural Drought in Arid and Semi-Arid Regions

1
Water, Energy and Environmental Engineering Research Unit, University of Oulu, 90570 Oulu, Finland
2
School of Environment, College of Engineering, University of Tehran, 141556135 Tehran, Iran
3
Department of Civil and Environmental Engineering, Shiraz University of Technology, 71555-313 Shiraz, Iran
4
Department of Geography, Najafabad Branch, Islamic Azad University, 8514143131 Najafabad, Iran
*
Author to whom correspondence should be addressed.
Water 2020, 12(3), 838; https://doi.org/10.3390/w12030838
Submission received: 18 January 2020 / Revised: 5 March 2020 / Accepted: 12 March 2020 / Published: 16 March 2020
(This article belongs to the Section Water Resources Management, Policy and Governance)

Abstract

:
Water is the most important resource for sustainable agriculture in arid and semi-arid regions, where agriculture is the mainstay for rural societies. By relating the water usage to renewable water resources, we define three stages from sustainable to unsustainable water resources: (1) sustainable, where water use is matched by renewable water capacity, ensuring sustainable water resources; (2) transitional, where water use occasionally exceeds renewable water capacity; and (3) unsustainable, with lack of water resources for agriculture, society, and the environment. Using available drought indicators (standardized precipitation index (SPI) and streamflow drought index (SDI)) and two new indices for agricultural drought (overall agricultural drought index (OADI) and agricultural drought index (ADI)), we evaluated these stages using the example of Fars province in southern Iran in the period 1977–2016. A hyper-arid climate prevailed for an average of 32% of the province’s spatio-temporal coverage during the study period. The area increased significantly from 30.6% in the first decade (1977–1986) to 44.4% in the last (2006–2015). The spatiotemporal distribution of meteorological drought showed no significant negative trends in annual precipitation during 1977–2016, but the occurrence of hydrological droughts increased significantly in the period 1997–2016. The expansion of irrigated area, with more than 60% of rainfed agriculture replaced by irrigated agriculture (especially between 1997 and 2006), exerted substantial pressure on surface water and groundwater resources. Together, climate change, reduced river flow, and significant declines in groundwater level in major aquifers led to unsustainable use of water resources, a considerable reduction in irrigated area, and unsustainability in agricultural production in the period 2006–2015. Analysis of causes and effects of meteorological, hydrological, and agricultural drought in the area identified three clear stages: before 1997 being sustainable, 1997–2006 being transitional, and after 2006 being unsustainable.

1. Introduction

Due to global climate change, the extent, intensity, and frequency of droughts in arid and semi-arid regions are increasing [1]. Droughts affect large areas and last a relatively long time compared with other natural disasters, such as floods and landslides [2]. Dryness characterizes arid and semi-arid regions, but droughts are an unexpected reduction in rain over a certain time, affecting a region [3]. As the changes in rainfall volume are extreme, droughts are a major challenge, especially in rural areas [4,5,6]. Drought has a critical impact on water resource-dependent sectors, such as agriculture, raising concerns about the capacity to meet water and food demands [7].
Drought is classified into four types—meteorological, hydrological, agricultural, and socioeconomic [8,9,10]. Meteorological drought is defined by lack of precipitation [11,12,13,14]. Hydrological drought refers to persistently decreasing discharge volume in streams and reservoirs over a period of months or years [15,16,17]. Agricultural drought is linked to depletion of groundwater and reservoir levels, due, e.g., to increasing demand for water in agriculture or to changes in weather conditions and soil moisture [18,19,20,21]. Socioeconomic drought encompasses the societal, economic, and environmental impacts of other types of drought [22,23,24,25]. A drought in arid and semi-arid climate zones often starts with a meteorological drought, which leads directly to a hydrological drought. The other two types of drought arise when use of water resources exceeds renewal of surface and groundwater, or when water demand outstrips supply.
Many drought indices have been developed to date, such as the Palmer drought severity index [26], decile index [27], standardized precipitation index (SPI) [28], streamflow drought index (SDI) [15], and standard contribution of rainfall to runoff (SCRI) [29]. Of these, SPI and SDI have been widely used in different climate zones to monitor and assess meteorological drought [30,31,32,33,34,35,36] and hydrological drought [37,38,39,40].
Although there has been considerable progress in understanding the impacts of drought in terms of engineering, economics, social science, and geography, the complex links between human and natural processes need more attention. In arid and semi-arid regions with high dependency on agriculture, these links are more complicated, as they affect the livelihoods of local people. Identification of the relationships between different types of drought could thus improve decision making on strategies for overcoming upcoming social challenges caused by drought. Interpreting the causes and effects of different types of droughts could reveal the factors determining the transition from sustainability to unsustainability in water resources and dependent systems. The main aim of the present study was thus to analyze this transition in an arid/semi-arid climate and determine when long-term shortages in available water due to human or natural processes lead to unsustainable agriculture and unsustainable societies.
The region chosen as an example for the analysis was Fars province in Iran, which experiences a range of climates but is dominated by a hyper-arid climate. Achieving a sustainable society and sustainable economic development are very dependent on agriculture and sustainable water resource exploration, since drought is one of the main restrictions on sustainable development in Fars province [29,41]. We analyzed the interlinkages between different types of droughts in the province over a 40-year period (1977–2016), in an effort to explain why a system that was resilient to drought before 1997 became a fragile system after 2006.

2. Materials and Methods

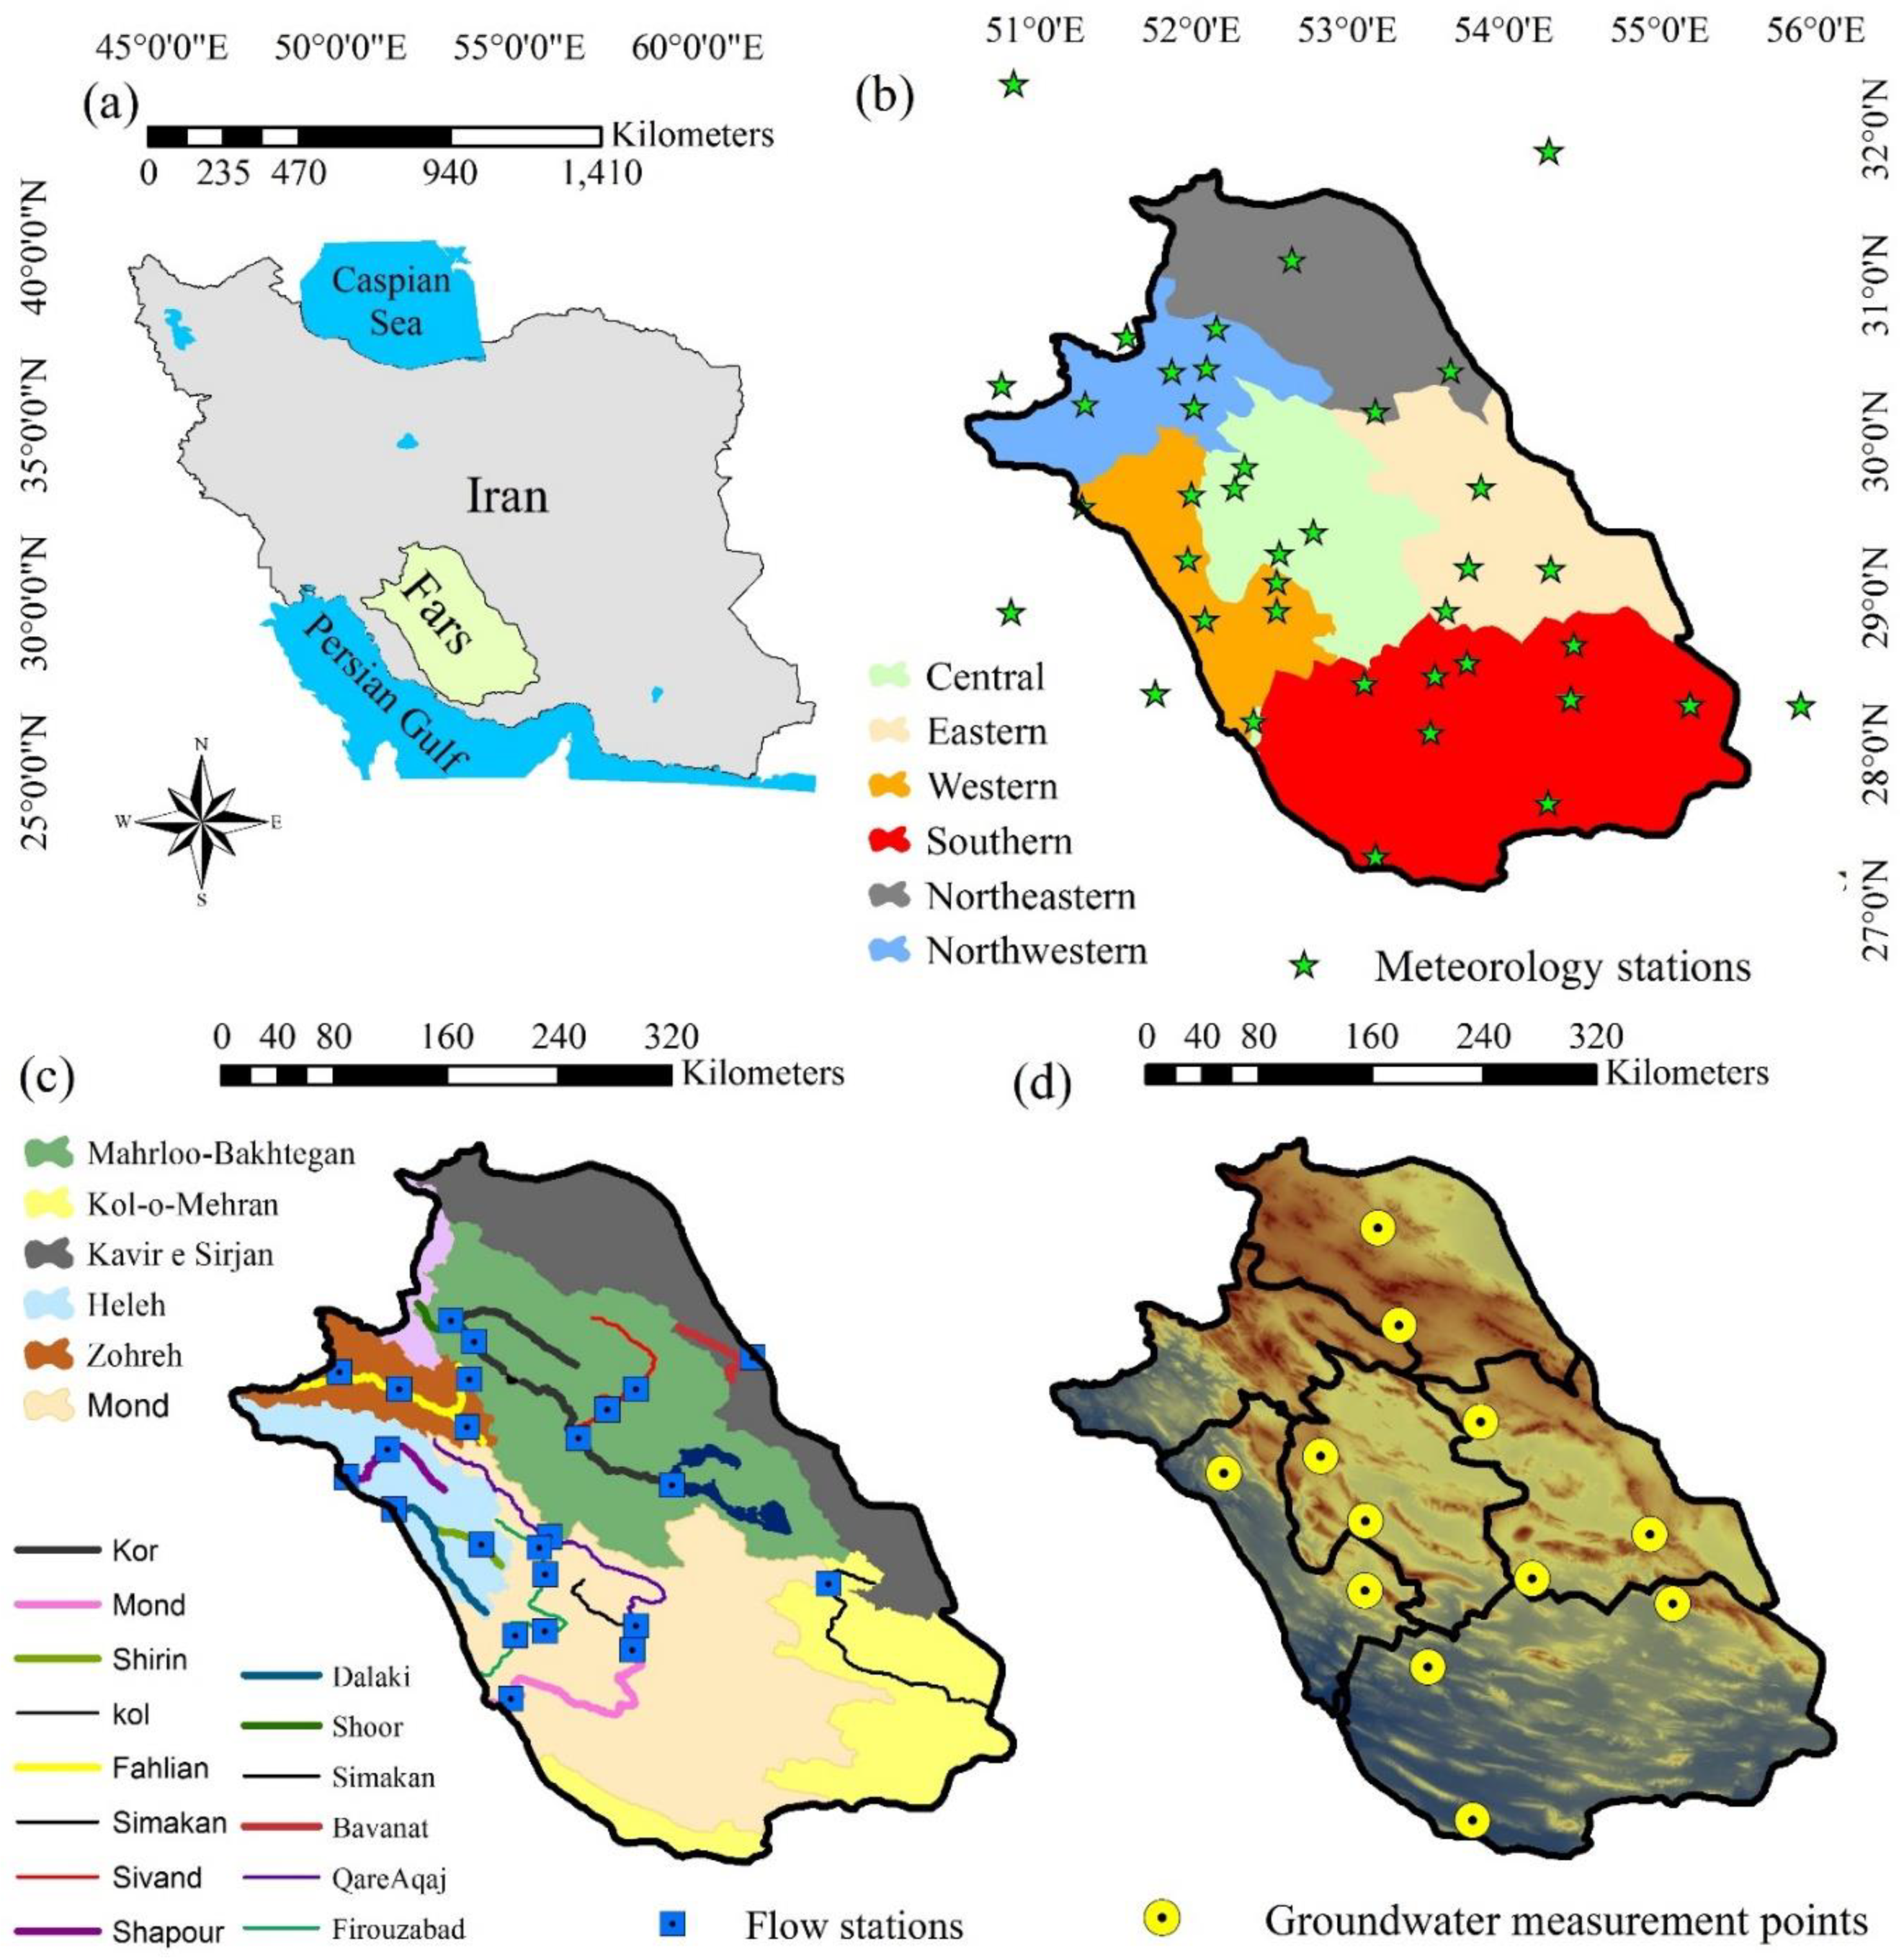
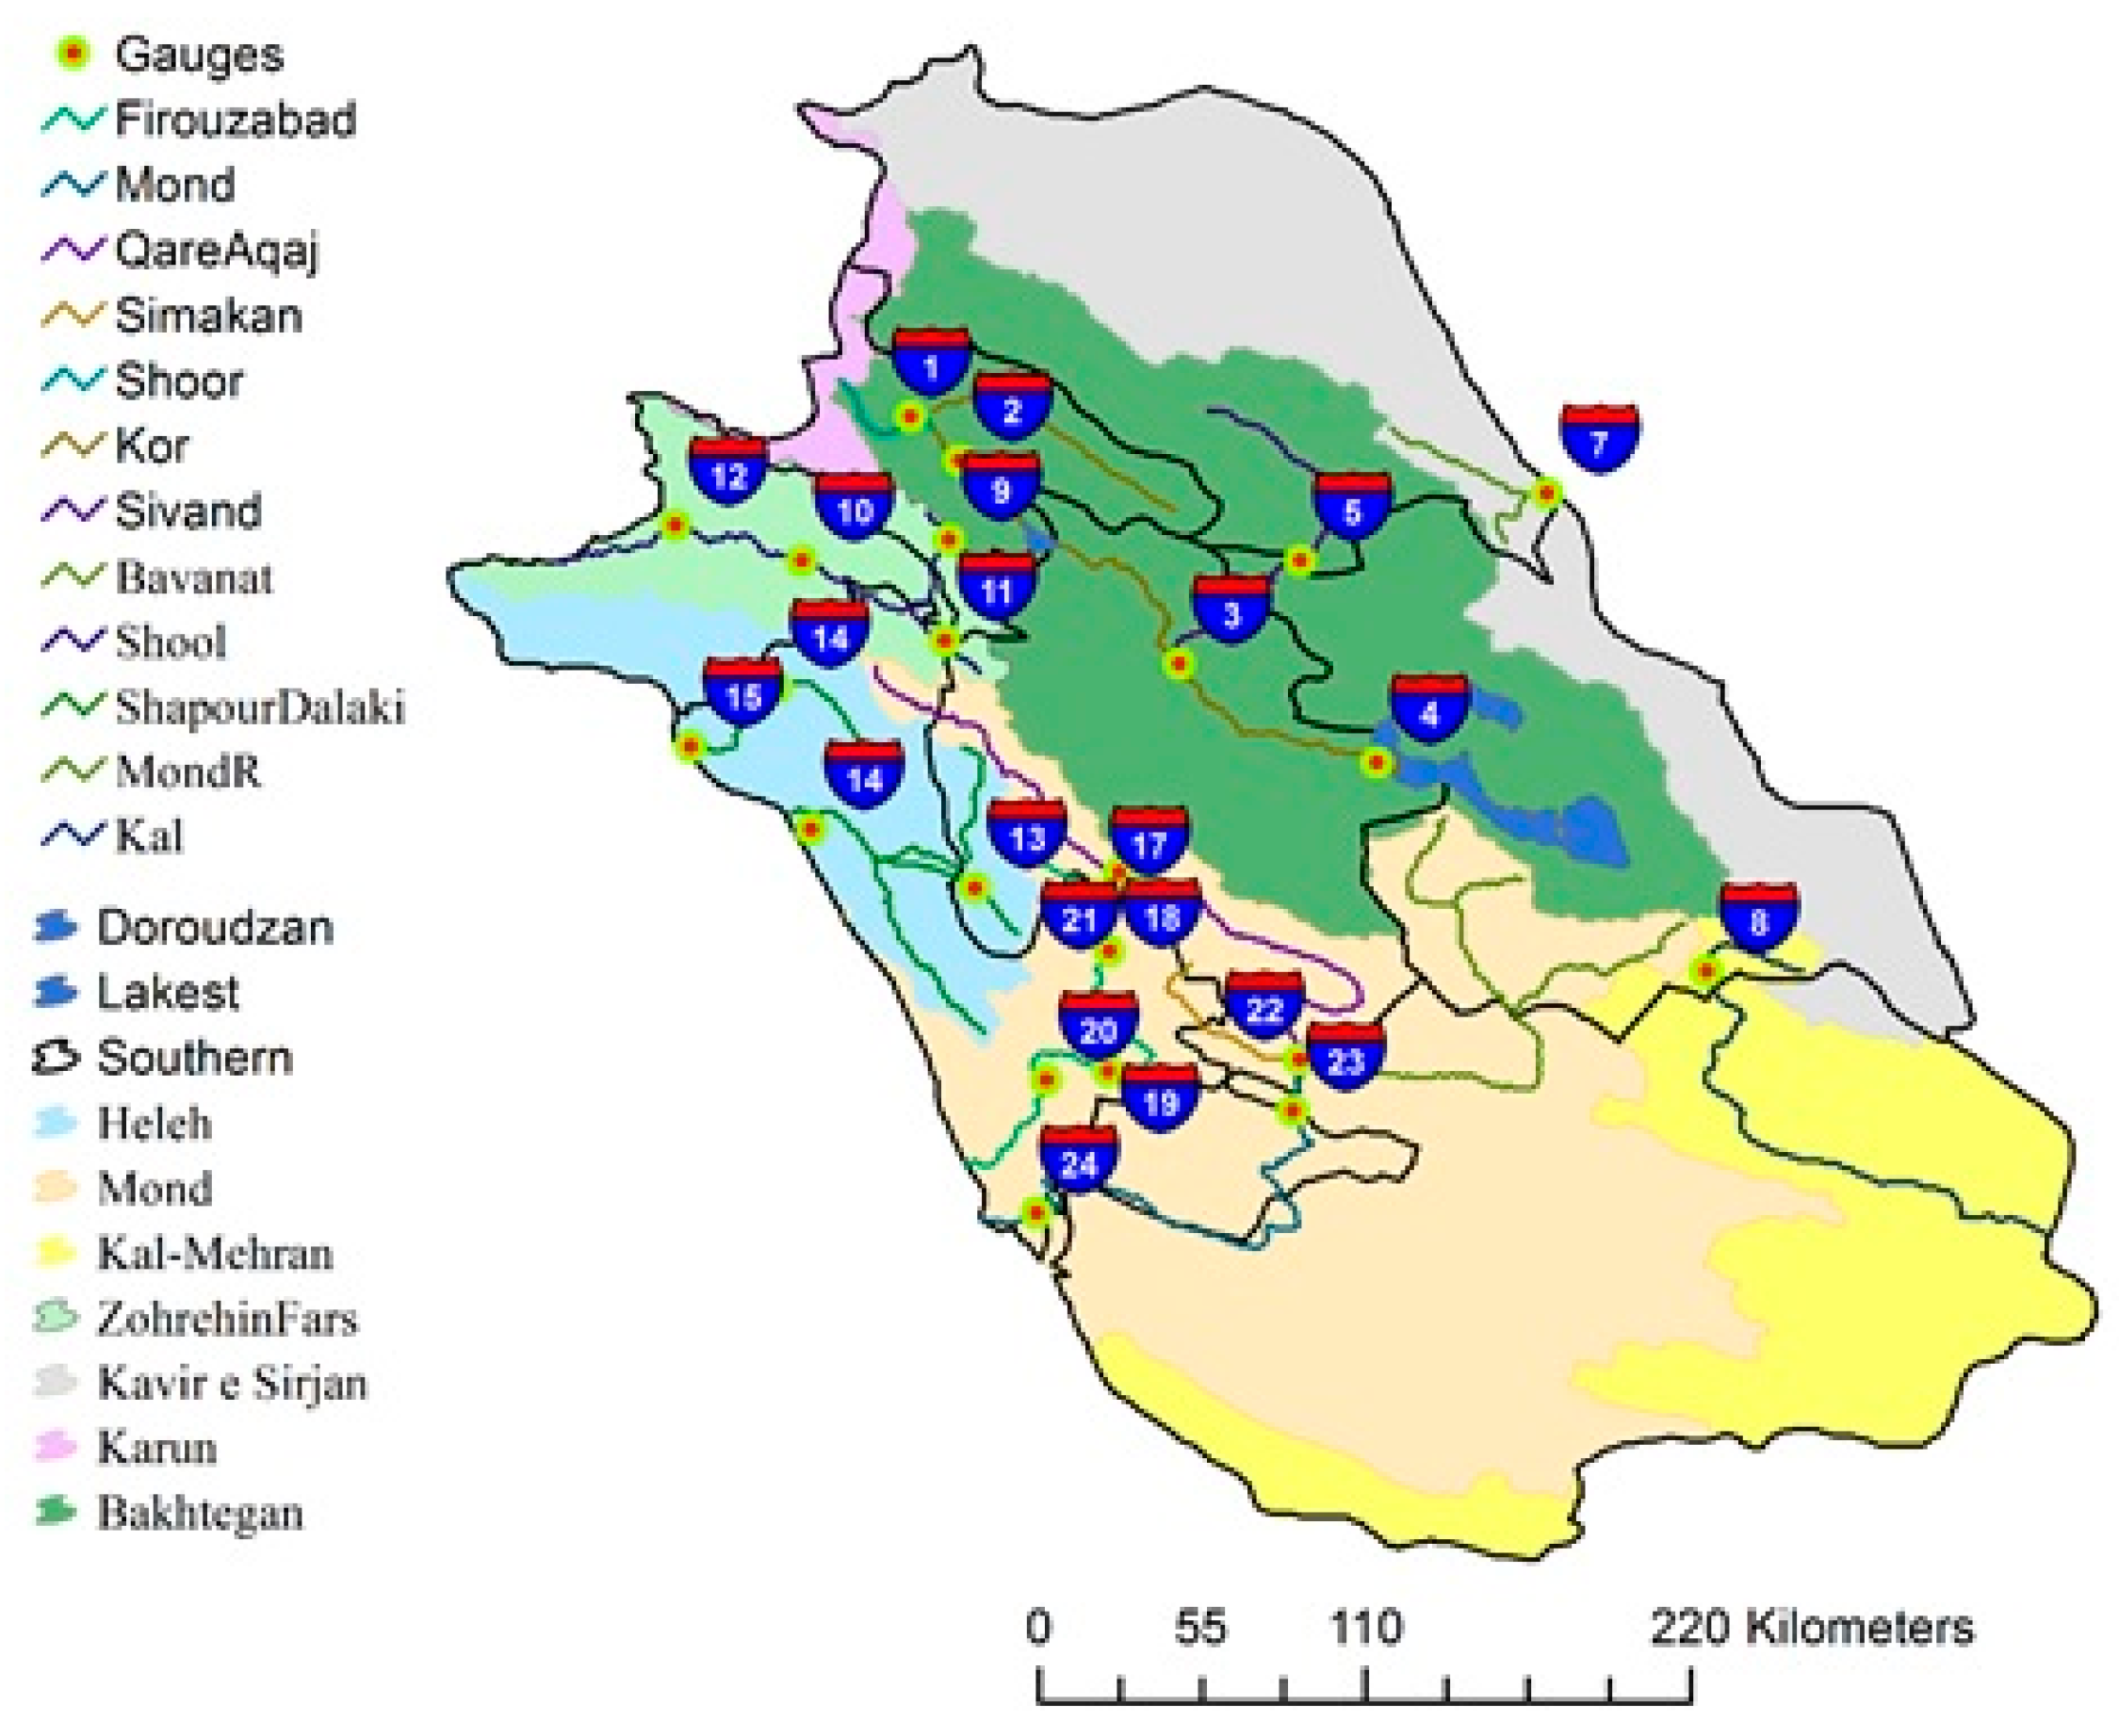
2.1. Study Area and Data Used

Fars province in southern Iran (27.02–1.43° N; 50.42–55.36° E) is the fourth largest province in Iran in terms of area, 122,608 km2, or 7.5% of Iranian territory (Figure 1a). It is larger than 52% of countries worldwide, with a population of 4.85 million and 29 cities [42]. The province contains different types of climate zones, due to its geographical configuration and position between the high Zagros Mountain in the north and west, Sirjan desert in the north and east, and Persian Gulf in the south. This variation in climate makes Fars a unique province in terms of variety of field crops such as cereals, beans, cotton, and maize. The province also produces a variety of orchard crops, such as almonds, apples, plums, and nuts in northern and central parts, and citrus fruit and palm dates in the south [43]. The agriculture sector in Fars plays a major role in the province’s food and job security, contributing 8.7% of value added in the agricultural sector in Iran [43]. Fars was the province with most cultivated area in 2005 and 2007, 1.08 and 1.06 million hectares, respectively [44]. Although several droughts have occurred in recent years, Fars is still one of the leading provinces for agricultural production. Since around 20.6% of the workforce in Fars is employed in the agriculture sector, sustainable agriculture is a key issue for the job security and livelihoods of residents [43].
Although different climates prevail in different parts of the province, the dominant climate is hyper-arid/temperate. This creates pressure on the agriculture sector, due to its high dependency on water resources. The expanding agriculture sector, river regulation, and increasing frequency of meteorological droughts have led to a reduction in available surface water in recent years [29], with major lakes in the province drying up [29,45] Thus, farmers are increasingly dependent on groundwater resources. As a result, a significant decrease in groundwater levels has been recorded [40,46], and river water levels are critically low [41,47].
For spatial analysis and to assess different types of droughts, we divided Fars province into six regions (southern, western, eastern, central, northwestern, and northeastern), based on the distribution of major cities (Figure 1b). To monitor variations in climate and meteorological drought, we obtained monthly precipitation and temperature data for the period 1977–2016 from 38 meteorological stations in Fars and a neighboring province (Figure 1b). A full list of stations is available in Appendix A, Table A1). Hydrological drought was assessed based on flow data from 24 gauging stations on 17 rivers in six main basins in Fars province (Maharloo-Bakhtegan, Sirjan desert, Mond, Heleh, Kol-o-Mehran, and Zohreh) (Figure 1c). Geographically, the main rivers are located in the central, northwestern, and western regions of the province (Table A2 in Appendix A). Of these six basins, only Maharloo-Bakhtegan falls entirely within Fars province, and its main river, the Kor, discharges to Lake Bakhtegan (Figure 1c). The rivers in the Kol-o-Mehran, Mond, Heleh, and Zohreh basins discharge to the Persian Gulf, whereas the Bavanat River in the Sirjan desert basin discharges to Kavir-e Sirjan.
To assess the consequences of hydrological and meteorological droughts and evaluate the possibility of these leading to agricultural drought, we analyzed changes in rainfed and irrigated farmland over the 40-year study period (1977–2016). We also analyzed groundwater level variations from 1995 to 2015 in 12 major aquifers in the province’s different regions (Figure 1d), as supplementary and supporting information for drought analysis. All hydro-climatological data, including river flow, groundwater levels, precipitation, and temperature, were provided by Fars Regional Water Authority. Agricultural data were obtained from the national and regional agricultural census 1972–2016 provided by the ministry of Agricultural-Jahad.

2.2. Methods

There are many methods and indices for identifying climate variability and its interrelation with water availability. Most of these methods measure drought and aridity, often linked to other related components, such as vegetation and soil moisture. The methodology for the present analysis was developed by combining Emberger climate classification, the Emberger aridity index, SPI, SDI, groundwater level fluctuation analysis, and agricultural development investigations. This helped identify agricultural development and changes in climate characteristics in the region. We applied the non-parametric Mann-Kendall test [48] for assessing trends in different types of drought in the study area.

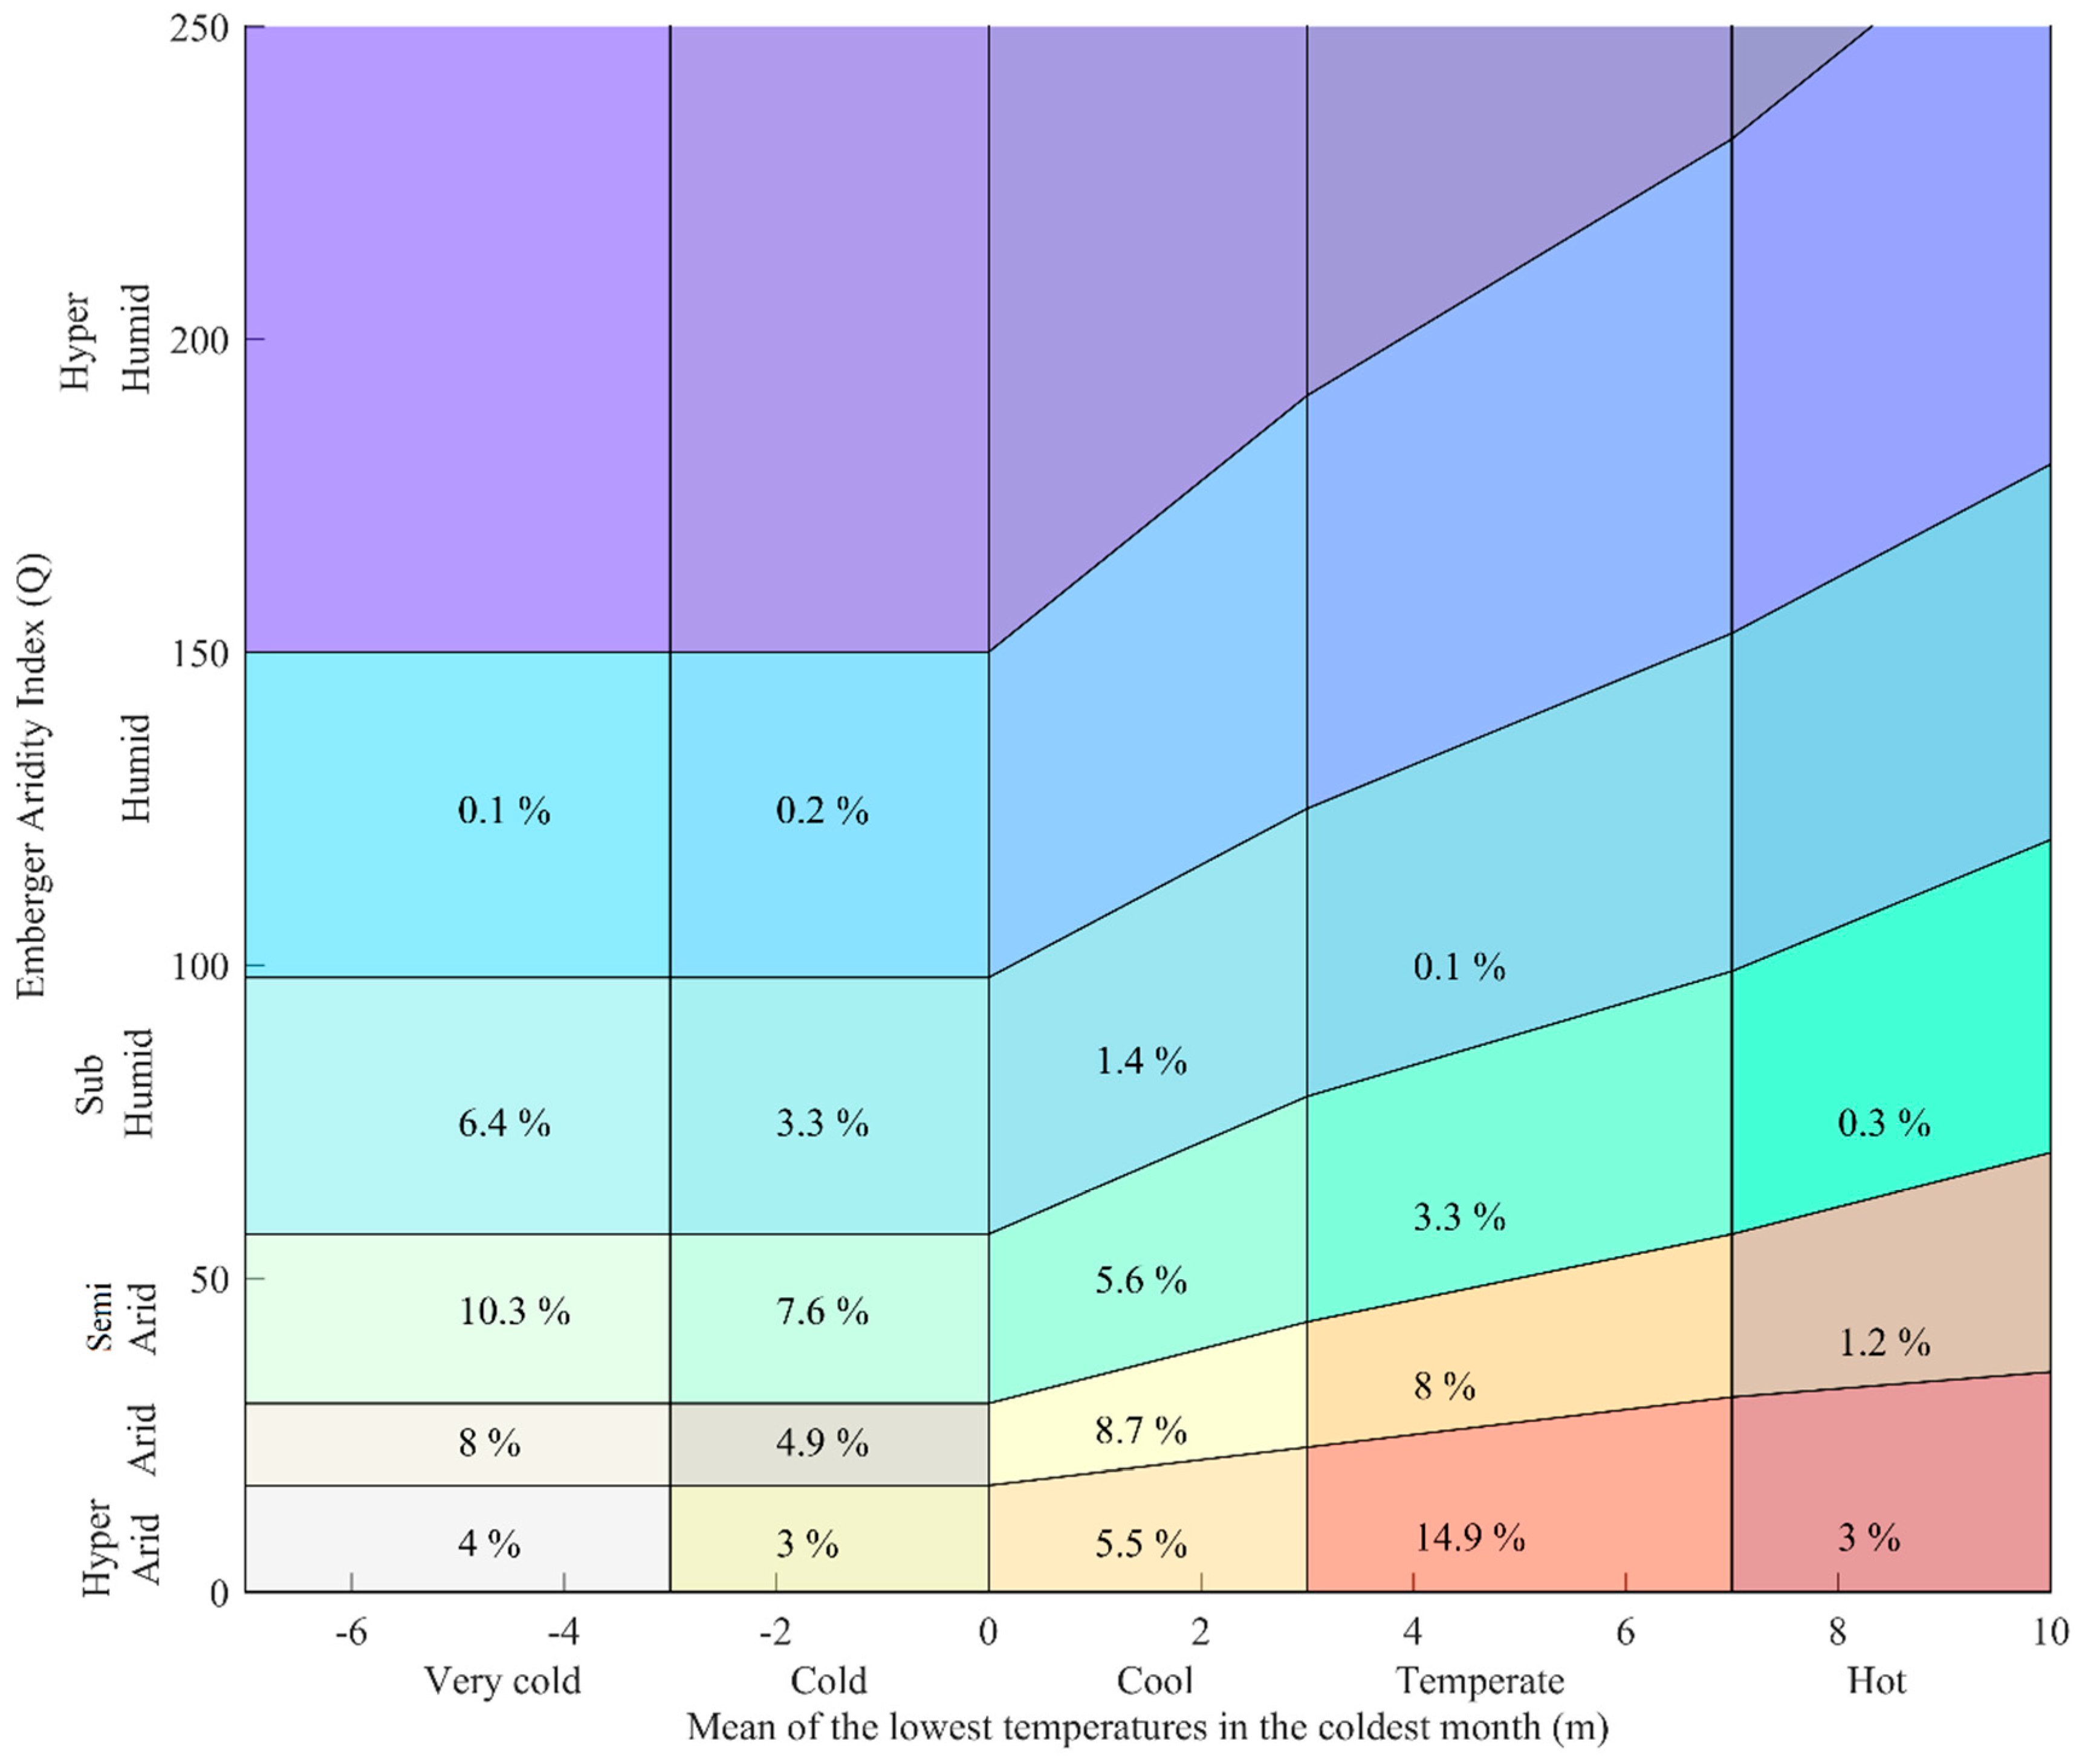
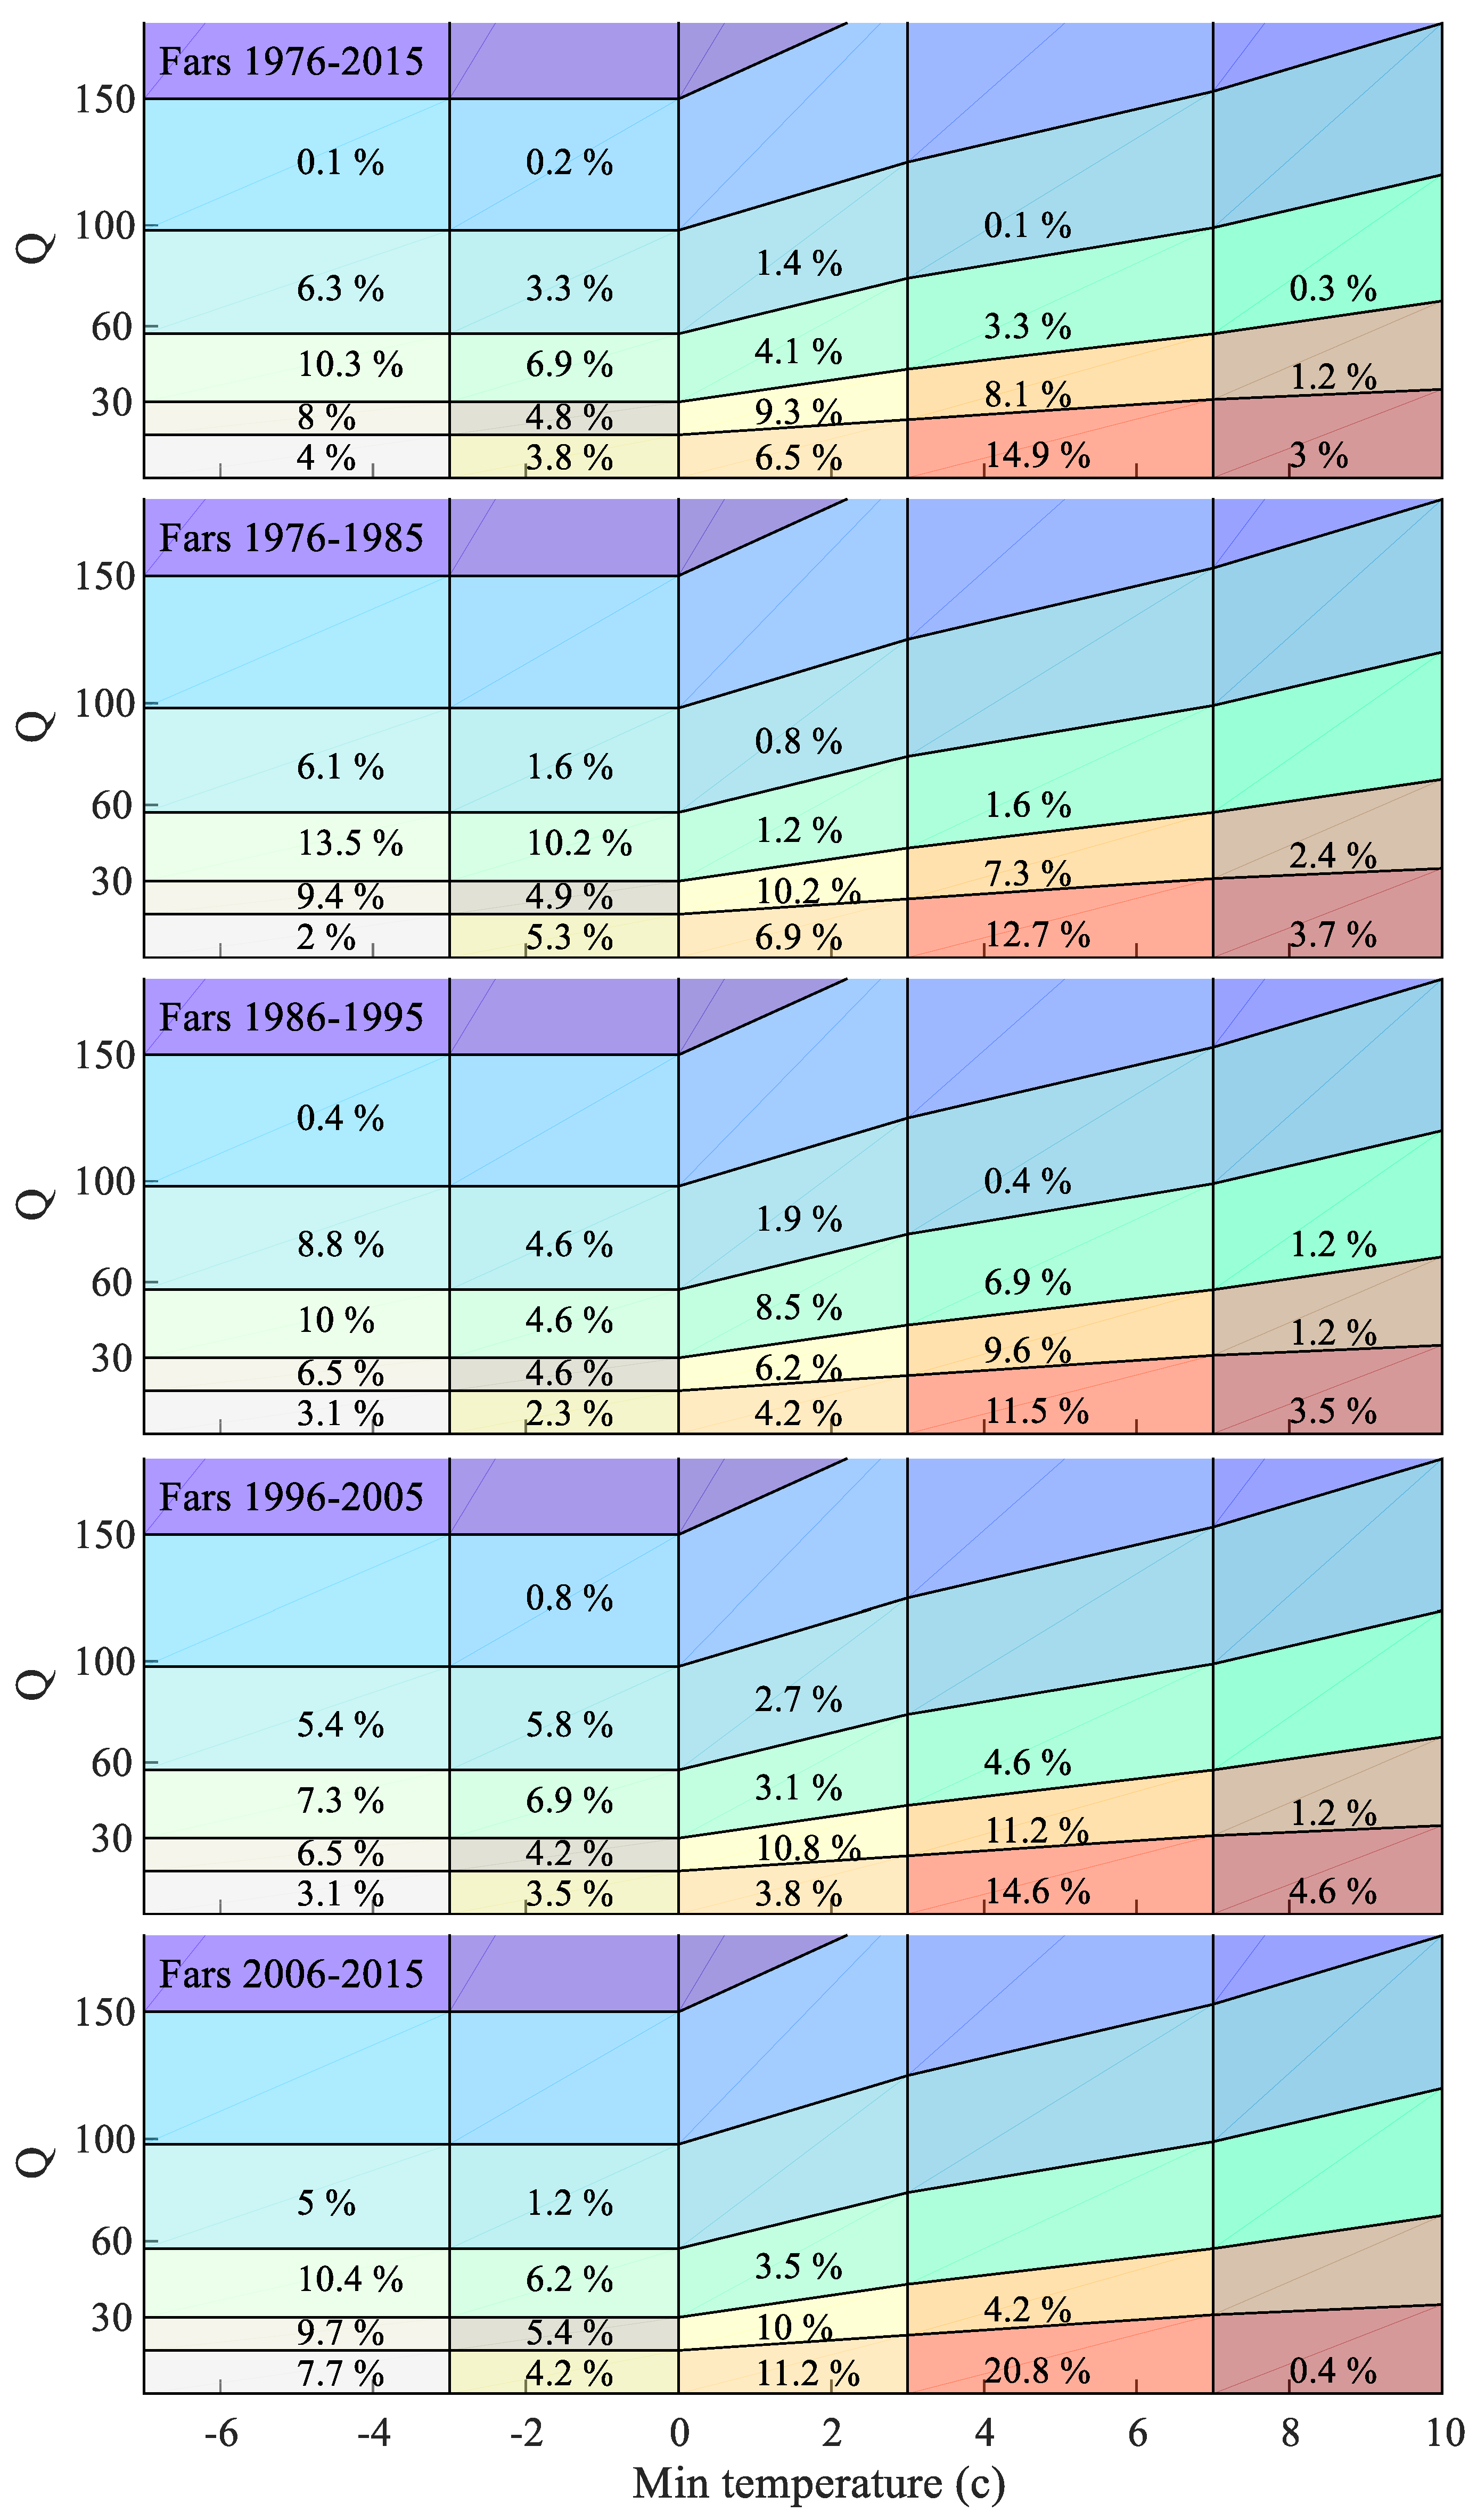
2.2.1. Climate Variability Analysis (Emberger Method)

A method designed by Emberger [49] is widely used for climate classification in climatology, hydrology, ecology, and bioclimatic analysis [50,51,52]. The method considers the two important climate parameters, precipitation and temperature:
Q = 1000 × P ( M + m 2 ) × ( M m ) = 2000 ×   P M 2   m 2
where P is annual precipitation (mm), M is mean maximum temperature in the warmest month (°K), and m is mean minimum temperature in the coldest month (°K).
Equation (1) considers the minimum temperature of the coldest month in the year, since vegetation growth is strictly related to thermal limits [49]. In addition, the rate of evaporation changes with temperature variations, so the term (M–m) represents evaporation and the continentality of a climate [50]. By varying m and Q in Equation (1), 36 different climate classes were defined and represented in the Emberger climatogram (Figure 2).
To evaluate climate variability, the Emberger aridity index was calculated annually for each station. Then, by calculating three Emberger influence factors, i.e., humidity influence factor (HIF), thermal influence factor (TIF), and climate influence factor (CIF), the dominant humidity, thermal, and climate groups were defined in each region and the whole province for different decades (1977–1986, 1987–1996, 1997–2006, and 2007–2016) and for the whole study period (1976–2016).
There are six HIFs (Equation (2)), representing the influences of different humidity groups over an area or station. These HIFs are shown on the y-axis of the Emberger climatogram (Figure 2). They comprise: HA (hyper-arid), AR (arid), SA (semi-arid), SU (sub-humid), HU (humid), and HH (hyper-humid), which are defined based on the value of Q in (Equation (1)):
HIF x = i = 1 i = n NY ( x ) i H = 1 H = 6 i = 1 n NY Hi
where HIFx is the humidity influence factor for group x (HA, AR, SA, SH, HU or SU) in a region or station, n is the number of meteorological stations in each region, NYx(i) is the number of years in which station i experienced humidity conditions of type x, and NYHi is the number of years in which station i experienced humidity conditions of type H.
There are five TIFs (Equation (3)), representing the influences of different thermal groups over an area or station. These thermal groups are shown on the x-axis of the Emberger climatogram (Figure 2). They comprise VC (very cold), CD (cold), CL (cool), TE (temperate), and HO (hot), which are defined based on the value of mean lowest temperature in the coldest month (m):
TIF y = i = 1 i = n NY ( y ) i T = 1 T = 5 i = 1 n NY Ti
where TIFy is thermal influence factor for group y (VC, CD, CL, TE, or HO) in a region or station, n is the number of meteorological stations in each region, NY(y)i is the number of years in which station i experienced thermal conditions of type y, and NYTi is the number of years in which station i experienced thermal conditions of type T.
There are 30 CIFs (Equation (4)), representing the influence of each climate group over an area or station. Each climate group has two terms, where the first term indicates humidity group (HA, AR, SA, SH, HU, SU) and the second term indicates thermal group (VC, CD, CL, TE, HO); for example, HA-VC is hyper-arid–very cold:
CIF x y = i = 1 i = n NY ( x y ) i H = 1 H = 6 T = 1 T = 5 i = 1 n NY HTi
where CIFx-y is the climate influence factor of x and y (where x is a humidity group and y is a thermal group) in a region or station, H is a humidity group (1–6 are HA, AR, SA, SH, HU, and SU, respectively), T is a thermal group (1–5 are VC, CD, CL, TE, and HO, respectively), n is the number of meteorological stations in each region, N(x-y)i is the number of years in which station i experienced climate types of x and y in the selected region, and NYHTi is the number of years in which station i experienced humidity conditions of type H and thermal conditions of type T.

2.2.2. Meteorological, Hydrological, and Agricultural Drought Analysis

The standardized precipitation index is used to indicate meteorological drought, which is caused by a deficiency of precipitation [28,53]. To calculate SPI, the long-term precipitation data were fitted to a probability distribution, which was then transformed into a standard distribution (see Appendix B). Zero means normal conditions, while positive and negative values indicate wet and dry conditions, respectively (Table 1).
The SPI is only derived from the meteorological element precipitation, without considering other important parameters for the description of drought, such as evapotranspiration or soil moisture. Therefore, a more comprehensive index should also be used for comparison.
The streamflow drought index uses standardized annual streamflow volumes to define values lower than the mean streamflow by at least one standard deviation [15]. Based on the SDI values, the state of hydrological drought is then defined (Table 2). SDI is calculated as:
S D I y = F y F ¯ S
where Fy is the annual stream flow for a given year (y), and F ¯ and S are the mean and standard deviation of cumulative streamflow for the whole study period.
We developed two additional indices, the overall agricultural drought index (OADI) and agricultural drought index (ADI), to evaluate changes in agriculture and drought in the study area:
O A D I y = A y A ¯ S
A D I y = A y A y ¯ S ( 1 y )
A 1 y ¯ = 1 y A i y
where Ay, Ai is the annual farmed area for a given year (y), A ¯ and S are the mean and standard deviation of the farmed area for the whole study period, and A 1 y ¯ (1−y) and S(1−y) are the mean and standard deviation of farmed area between the first and yth year in the study period. We calculated these indices for irrigated, rainfed, and total farmed areas in Fars province.
In addition to the indices for drought analysis, we used the non-parametric Mann–Kendall test [48] to determine the significance of a trend in rainfall, discharge, groundwater level, and farmed area. This test is widely used for assessing trends in hydrology and climatology data [29,54].

3. Results

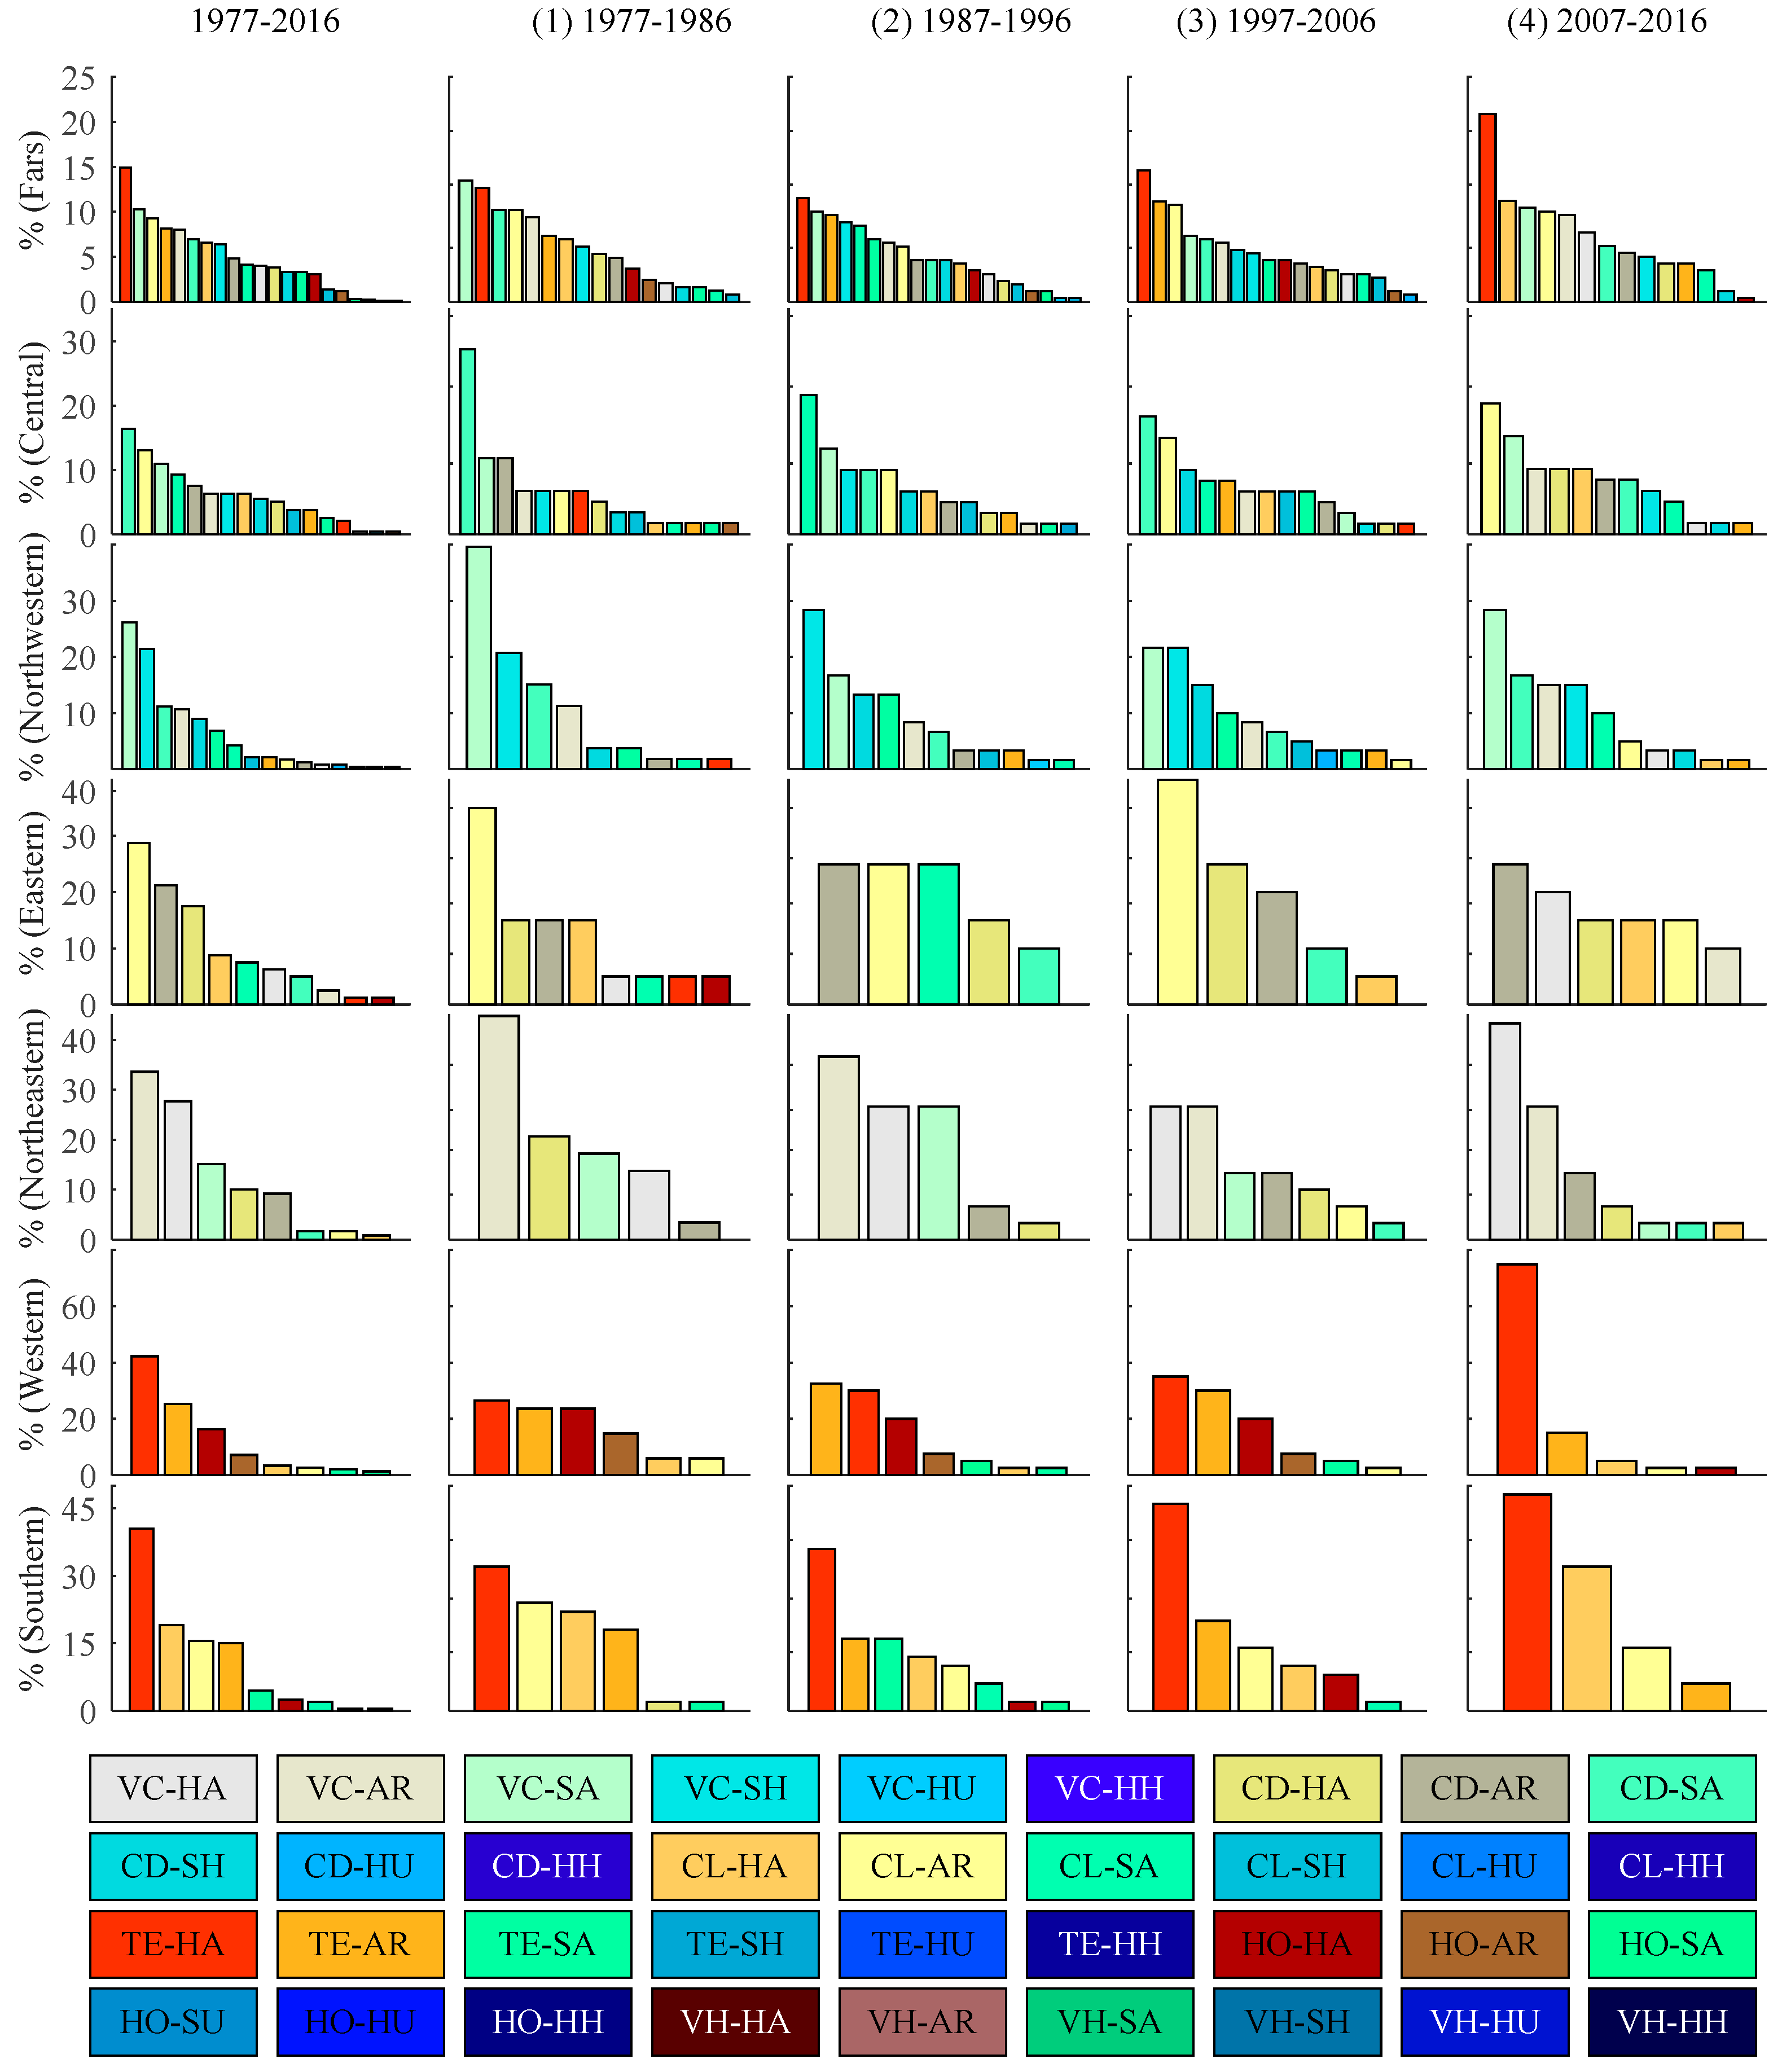
3.1. Spatiotemporal Climate Variability

Based on the Emberger index, there were 21 different climate types across Fars province in the period 1977–2016 (Figure 2 and Figure 3). The number of climate types declined over time (Figure 3) in different regions of the province (Figure A1, Figure A2, Figure A3, Figure A4 and Figure A5 in Appendix A). The most climate variety, 20 different types of climates, was observed in the period 1987–1996, while in the last period 2007–2016, the number decreased to 14 types (Figure 2, Figure A1 in Appendix A). The most variety in climate (17 types) was observed in the central region of the province, while the least was observed in the western and northeastern regions, eight types each. The dominant climate type in the province was HA-TE, hyper-arid and temperate, with a CIF value of 14.9% (Figure 2 and Figure 3). Temporal analysis showed that the CIF for HA-TE climate increased from 12.7% to 20.8% between the first (1977–1986) and last (2007–2016) decades of the study period (Figure 3, Figure A1 in Appendix A). The least common types of climate, CIF less than 0.3% (Figure A1 in Appendix A), were HU-VC (humid and very cold) and HU-CD (humid and cold), which were only observed in the northwestern region, with CIF 0.4% and 0.9% respectively (Figure A3 in Appendix A). The diversity of climate types in the northwestern, western, central, and southern regions decreased, while in eastern and northeastern regions it increased (Figure 3); for more details see Figure A2, Figure A3, Figure A4 and Figure A5 in Appendix A.
Regionally, the dominant climate type was HA-TE in the west, CIF 42.2%, and in the south, CIF 40.5%; AR-VC, arid and very cold—the northeast, CIF 33.6%; SA-CD, semi-arid and cold in the central region, CIF 16.4%; SA-VC, semi-arid and very cold in the northwest, CIF 26.2%; AR-VC, arid and very cold in the northeast, CIF 34%. The dominant climate during different periods in the whole area and in the southern region did not change, HA-TE, but in the other regions it varied during different periods (Figure 3, Figure A2, Figure A3, Figure A4 and Figure A5 in Appendix A).
Based on the HIF values obtained, the dominant climate was HA, with 32.3% spatiotemporal coverage during the study period. Its dominance significantly increased from 30.6% in the first decade (1977–1986) to 44.4% in the last (2006–2015). The next most important humidity group was AR, HIF 31.4%, followed by SA, HIF 24.9%; meanwhile SH, HIF 11.1%, and HU, HIF 0.3%, were less well represented. All these groups showed a reduction in HIF over time (Figure A1 in Appendix A). The HH type was not observed in any region. The HU type was only observed in the northwestern region, and the SH type in northwestern (HIF 32.6%) and central (16%) regions (Figure A2 and Figure A3 in Appendix A), whereas other humidity types, HA, AR, SA, and SU, were observed in all regions.
Based on the TIF values, VC, very cold, was the dominant thermal group, 28.7% and then TE 26.5%, CL 21.3%, CD 19%, and HT 4.5%. The TIF for VC and CD showed an increase over time, whereas it decreased for the remaining thermal groups (Figure 3, Figure A2, Figure A3, Figure A4 and Figure A5 in Appendix A).

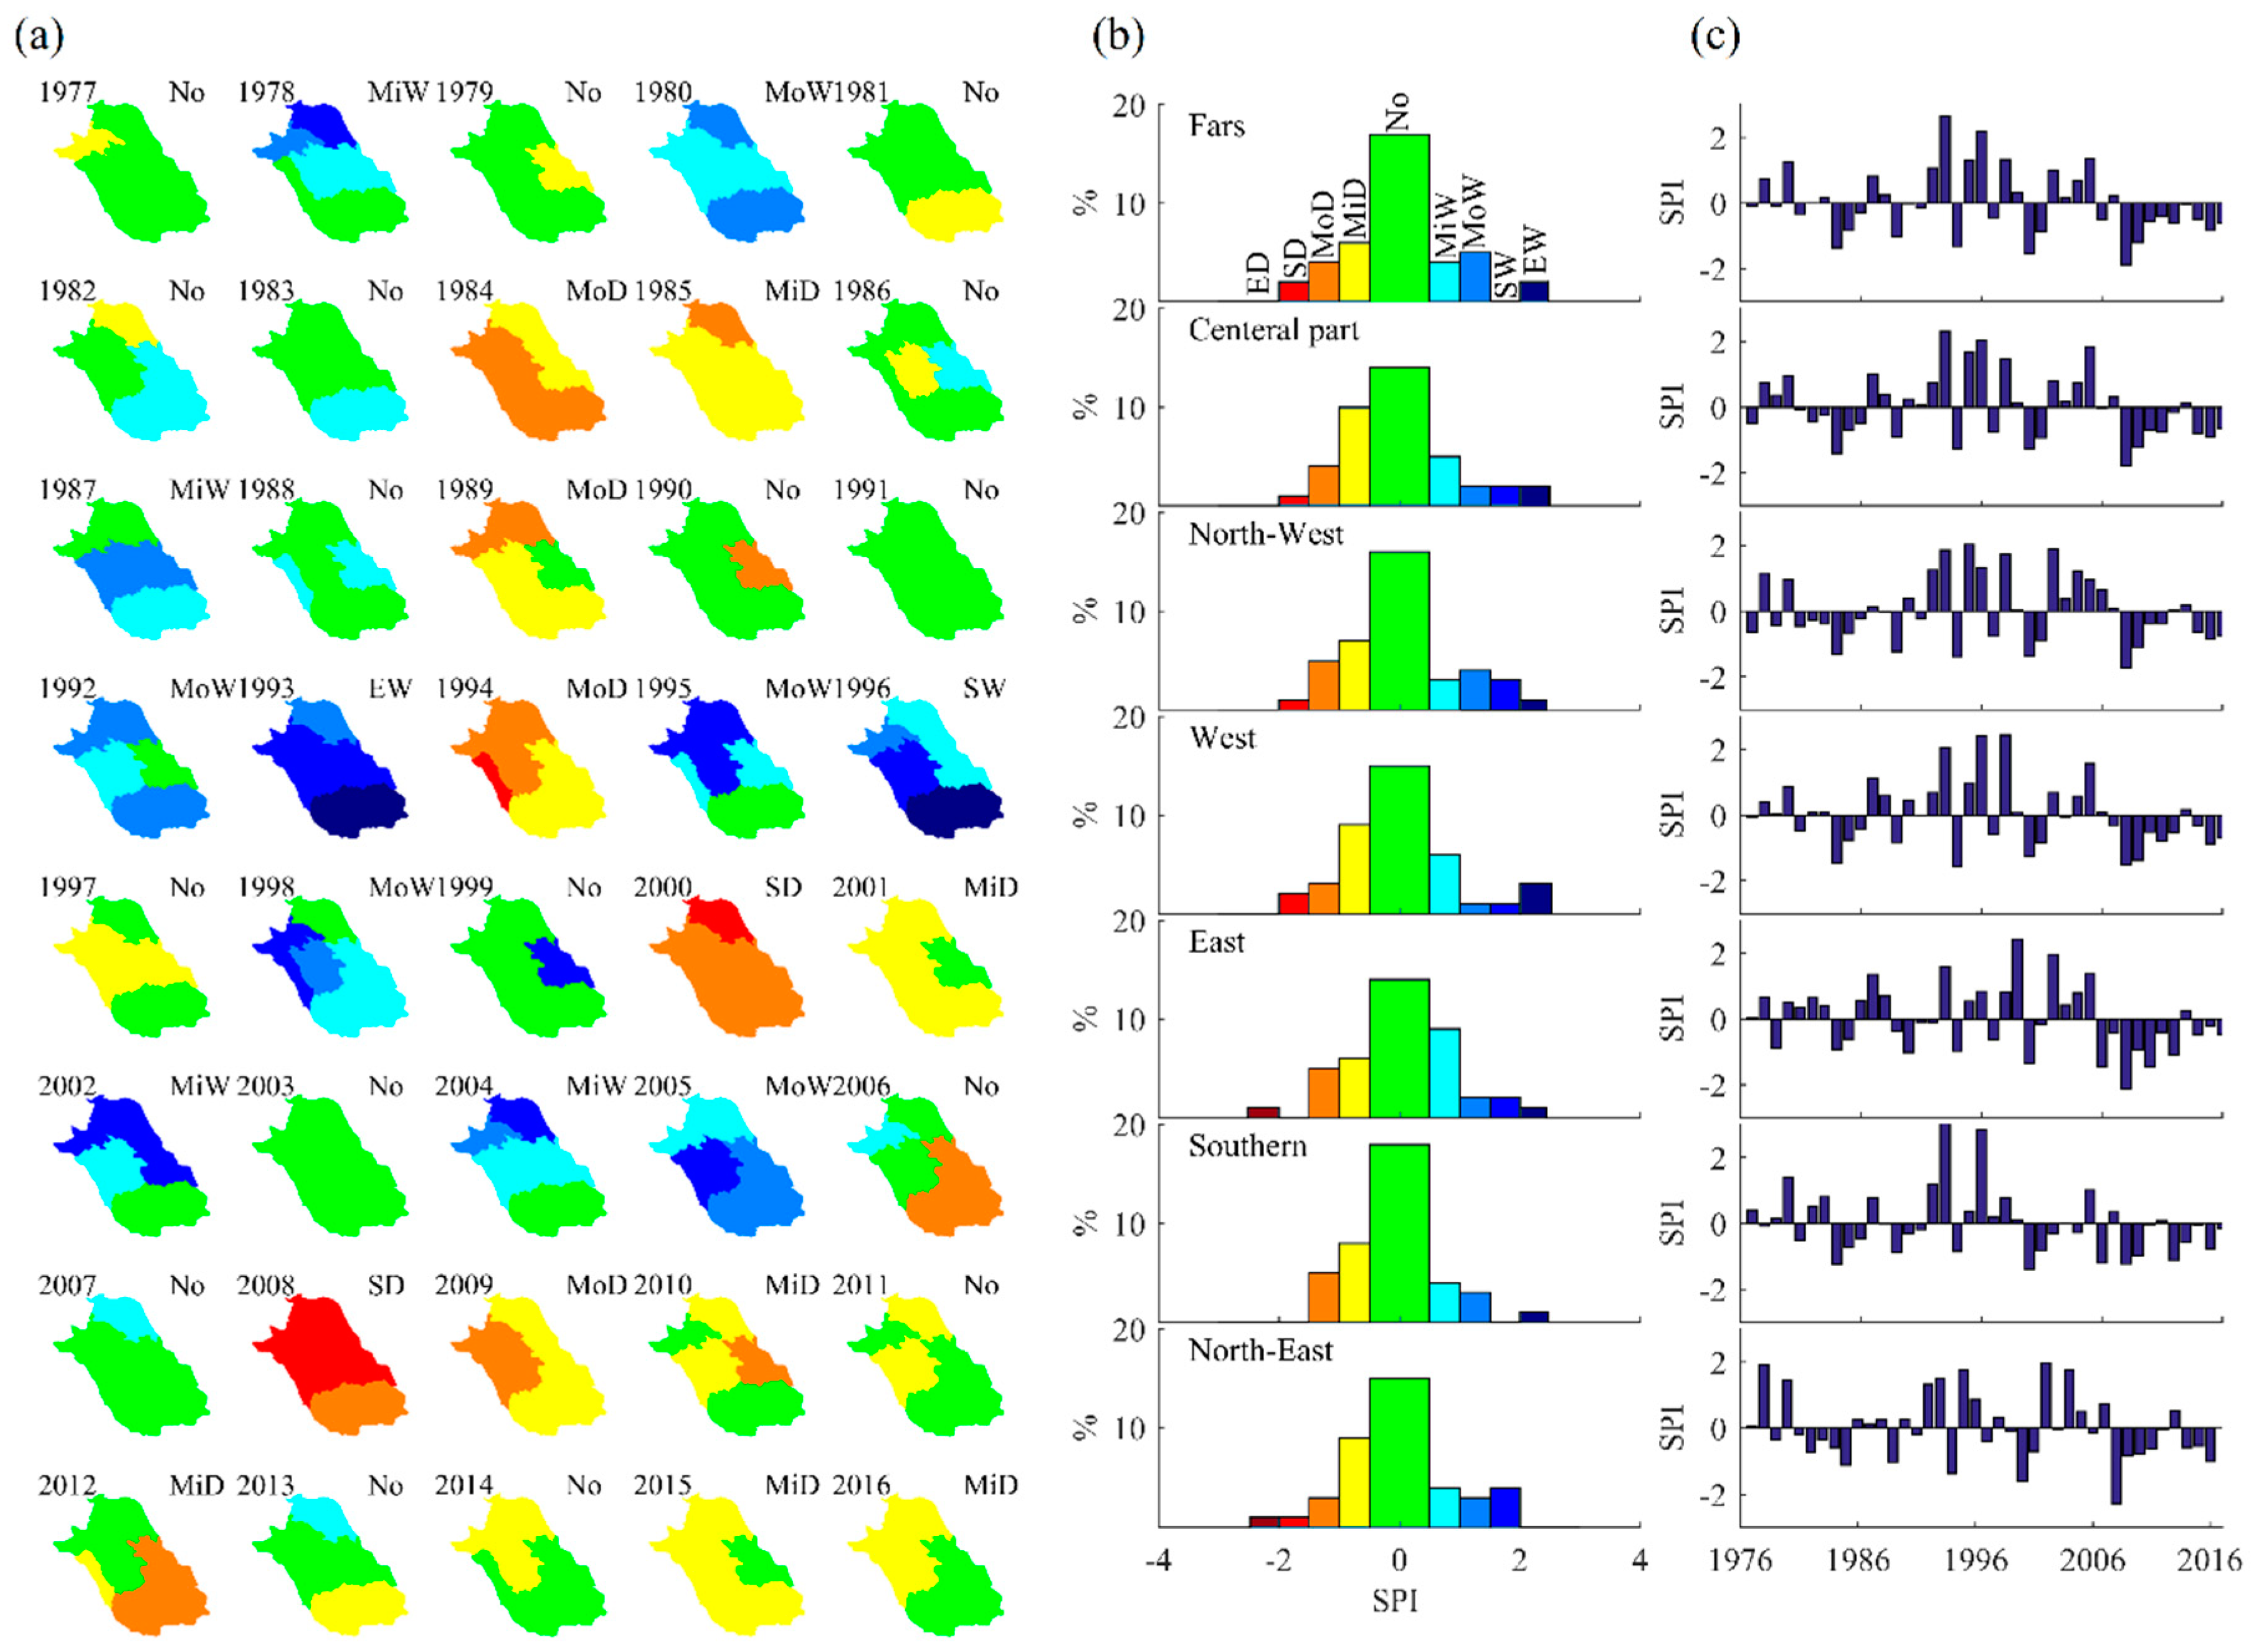
3.2. Meteorological Drought

The lowest annual value of SPI in Fars province and its regions was observed in 2008 (Figure 4a). The last decade of the study period (2007–2016) experienced the most extreme droughts in different periods (1, 2, 3, 5, and 10 years) in the different regions. The longest drought period started in 2006 in the eastern and southern regions, and in 2007 in the other regions and the province as a whole. Although the SPI value was mostly negative during latter decades in all regions (Figure 4c), there was no significant negative trend in precipitation in any region (Figure A2 in Appendix A). The wettest decade in the eastern region began in 1996, while for the whole province and other regions it began in 1990. The year 1993 was recognized as extremely wet, with the highest value of SPI in the whole province and in the southern region. In the central, northwestern, western, eastern, and northeastern regions, the highest SPI values were in 2005, 2004, 1997, 1999, and 2004, respectively (Figure 4). Before 1990, the SPI value showed more random fluctuation, but after 1990, two wet (1990–2006) and dry (2006–2016) periods were identified in all regions (Figure 4c).
The SPI distribution showed that normal conditions, with SPI values between −0.50 and 0.5, were the most common, occurring in 18% of years (Figure 4b). Based on the mean SPI values for Fars province, normal to moderately wet conditions occurred in 25% of years during the study period. This distribution shows that meteorological drought years were less common in the province than wet and normal years. The SPI distribution showed that dry years were more common in southern and eastern regions of Fars.

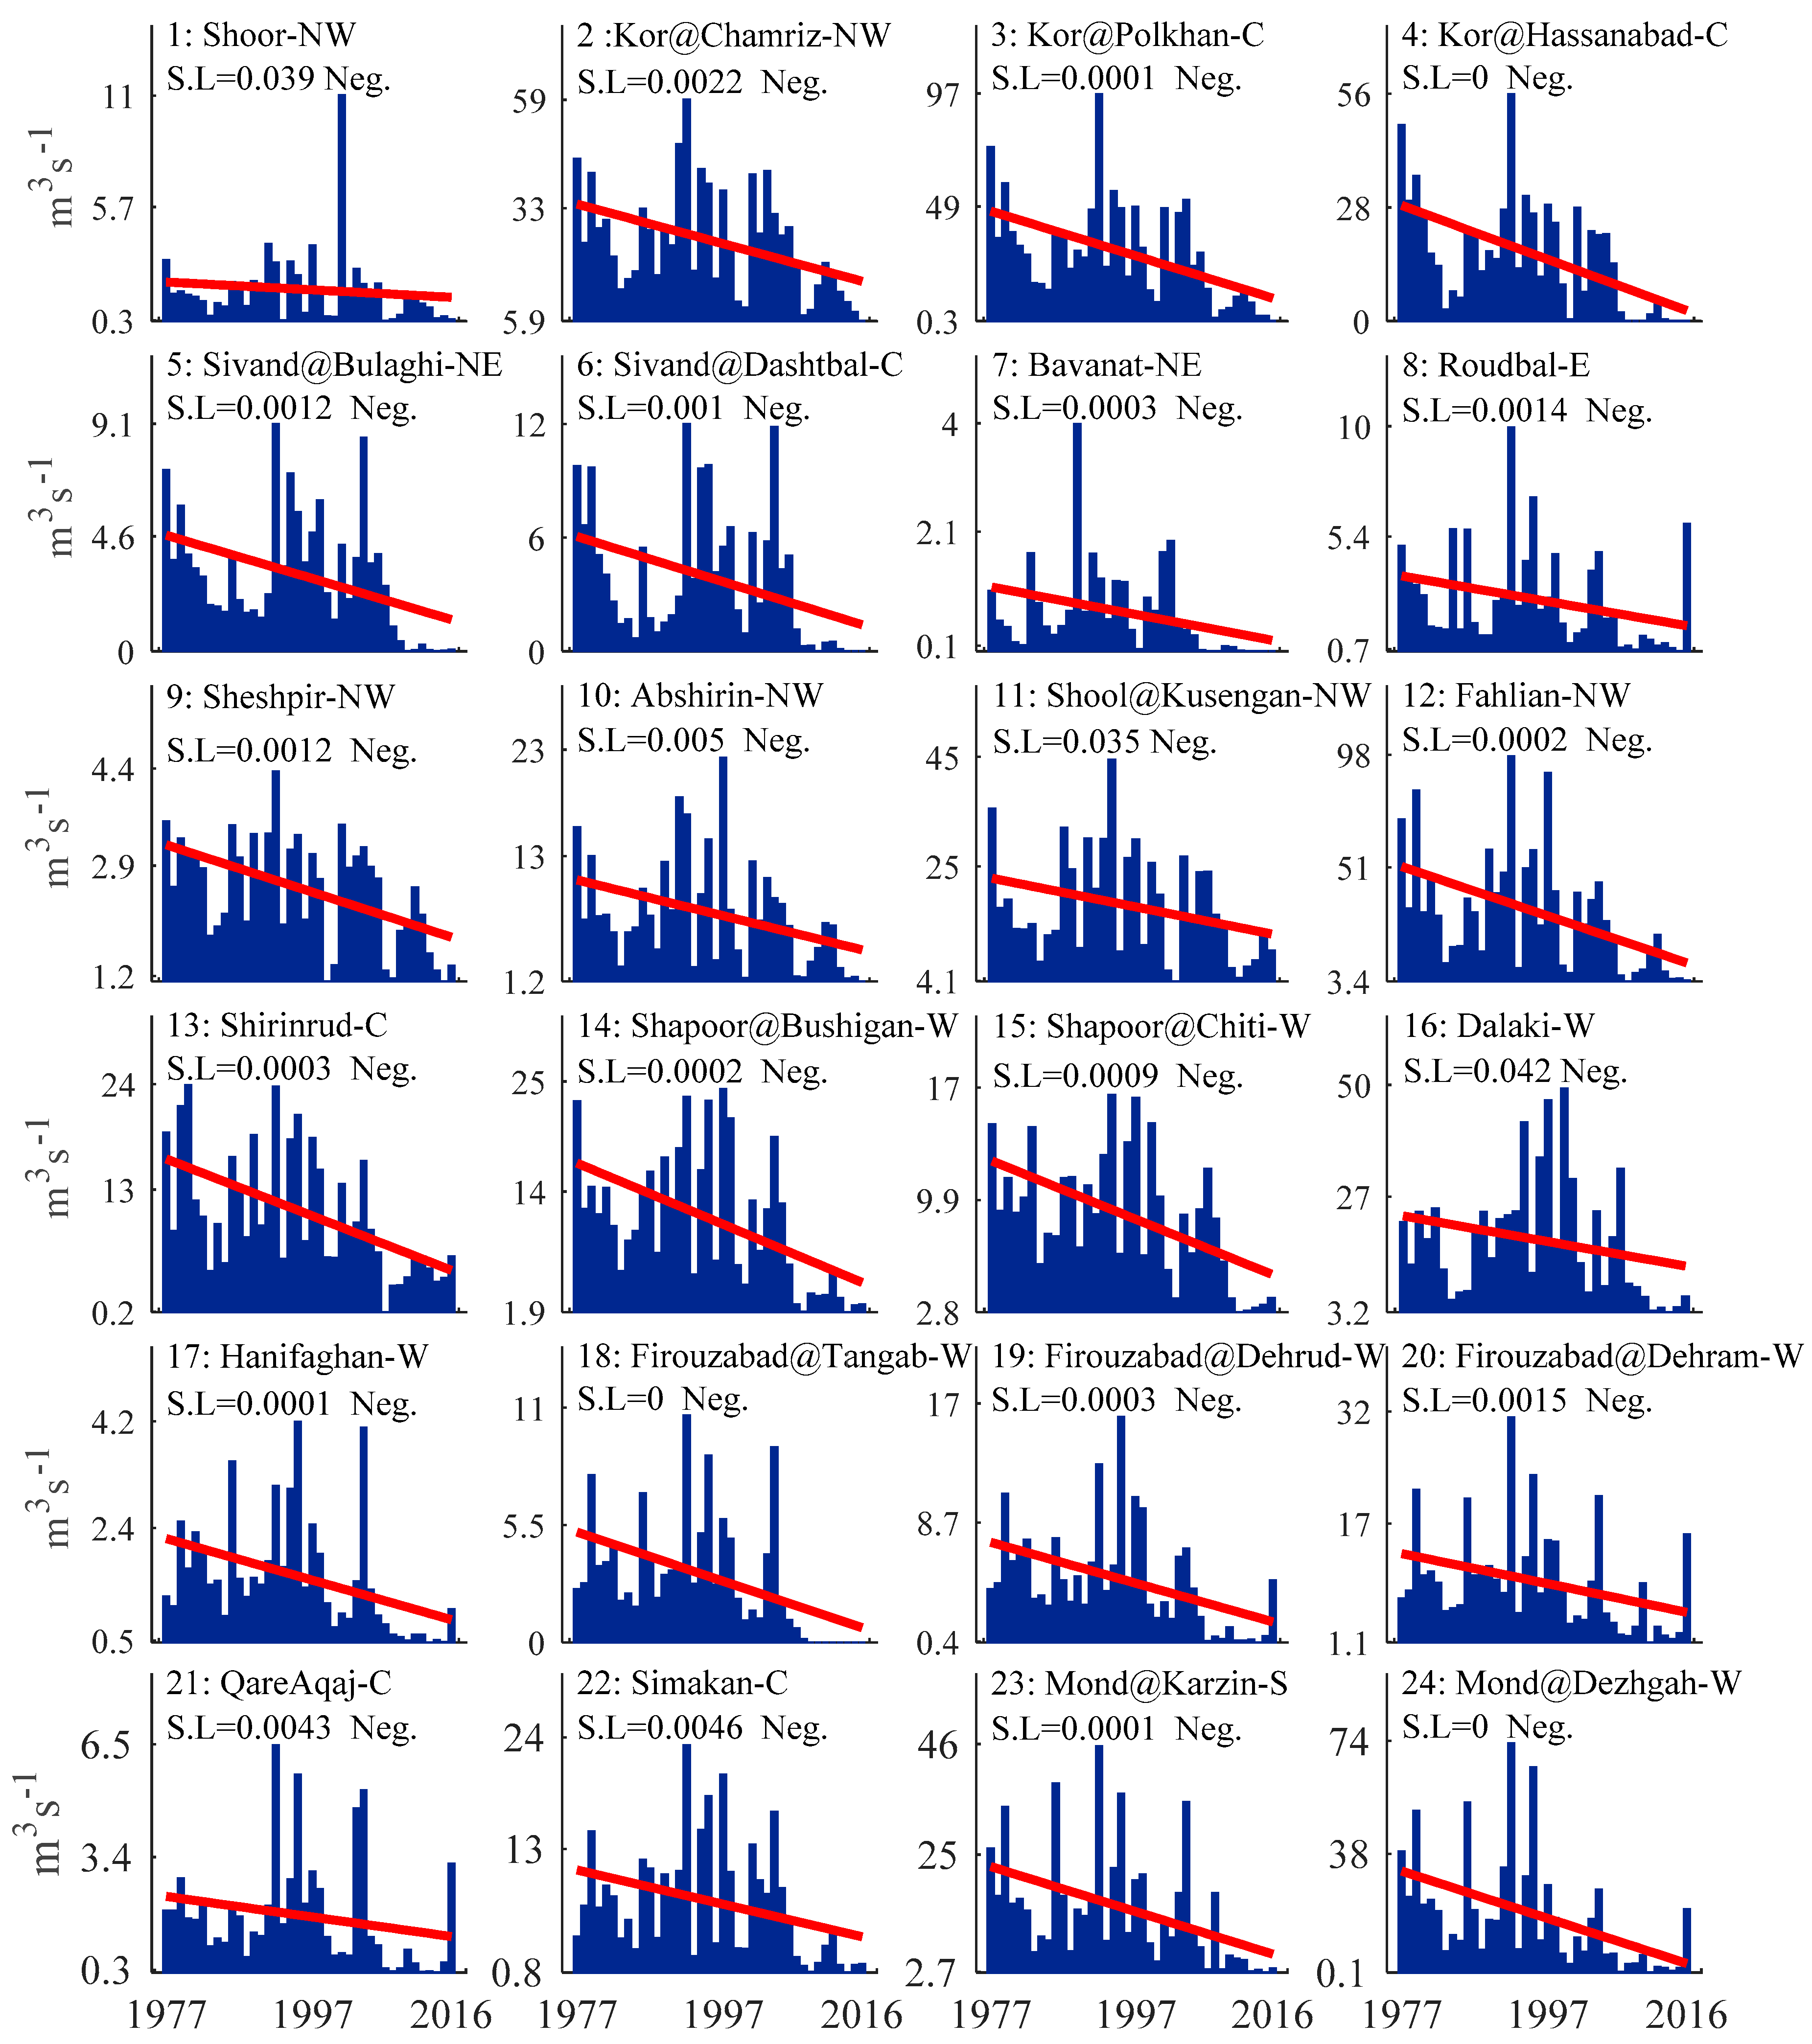
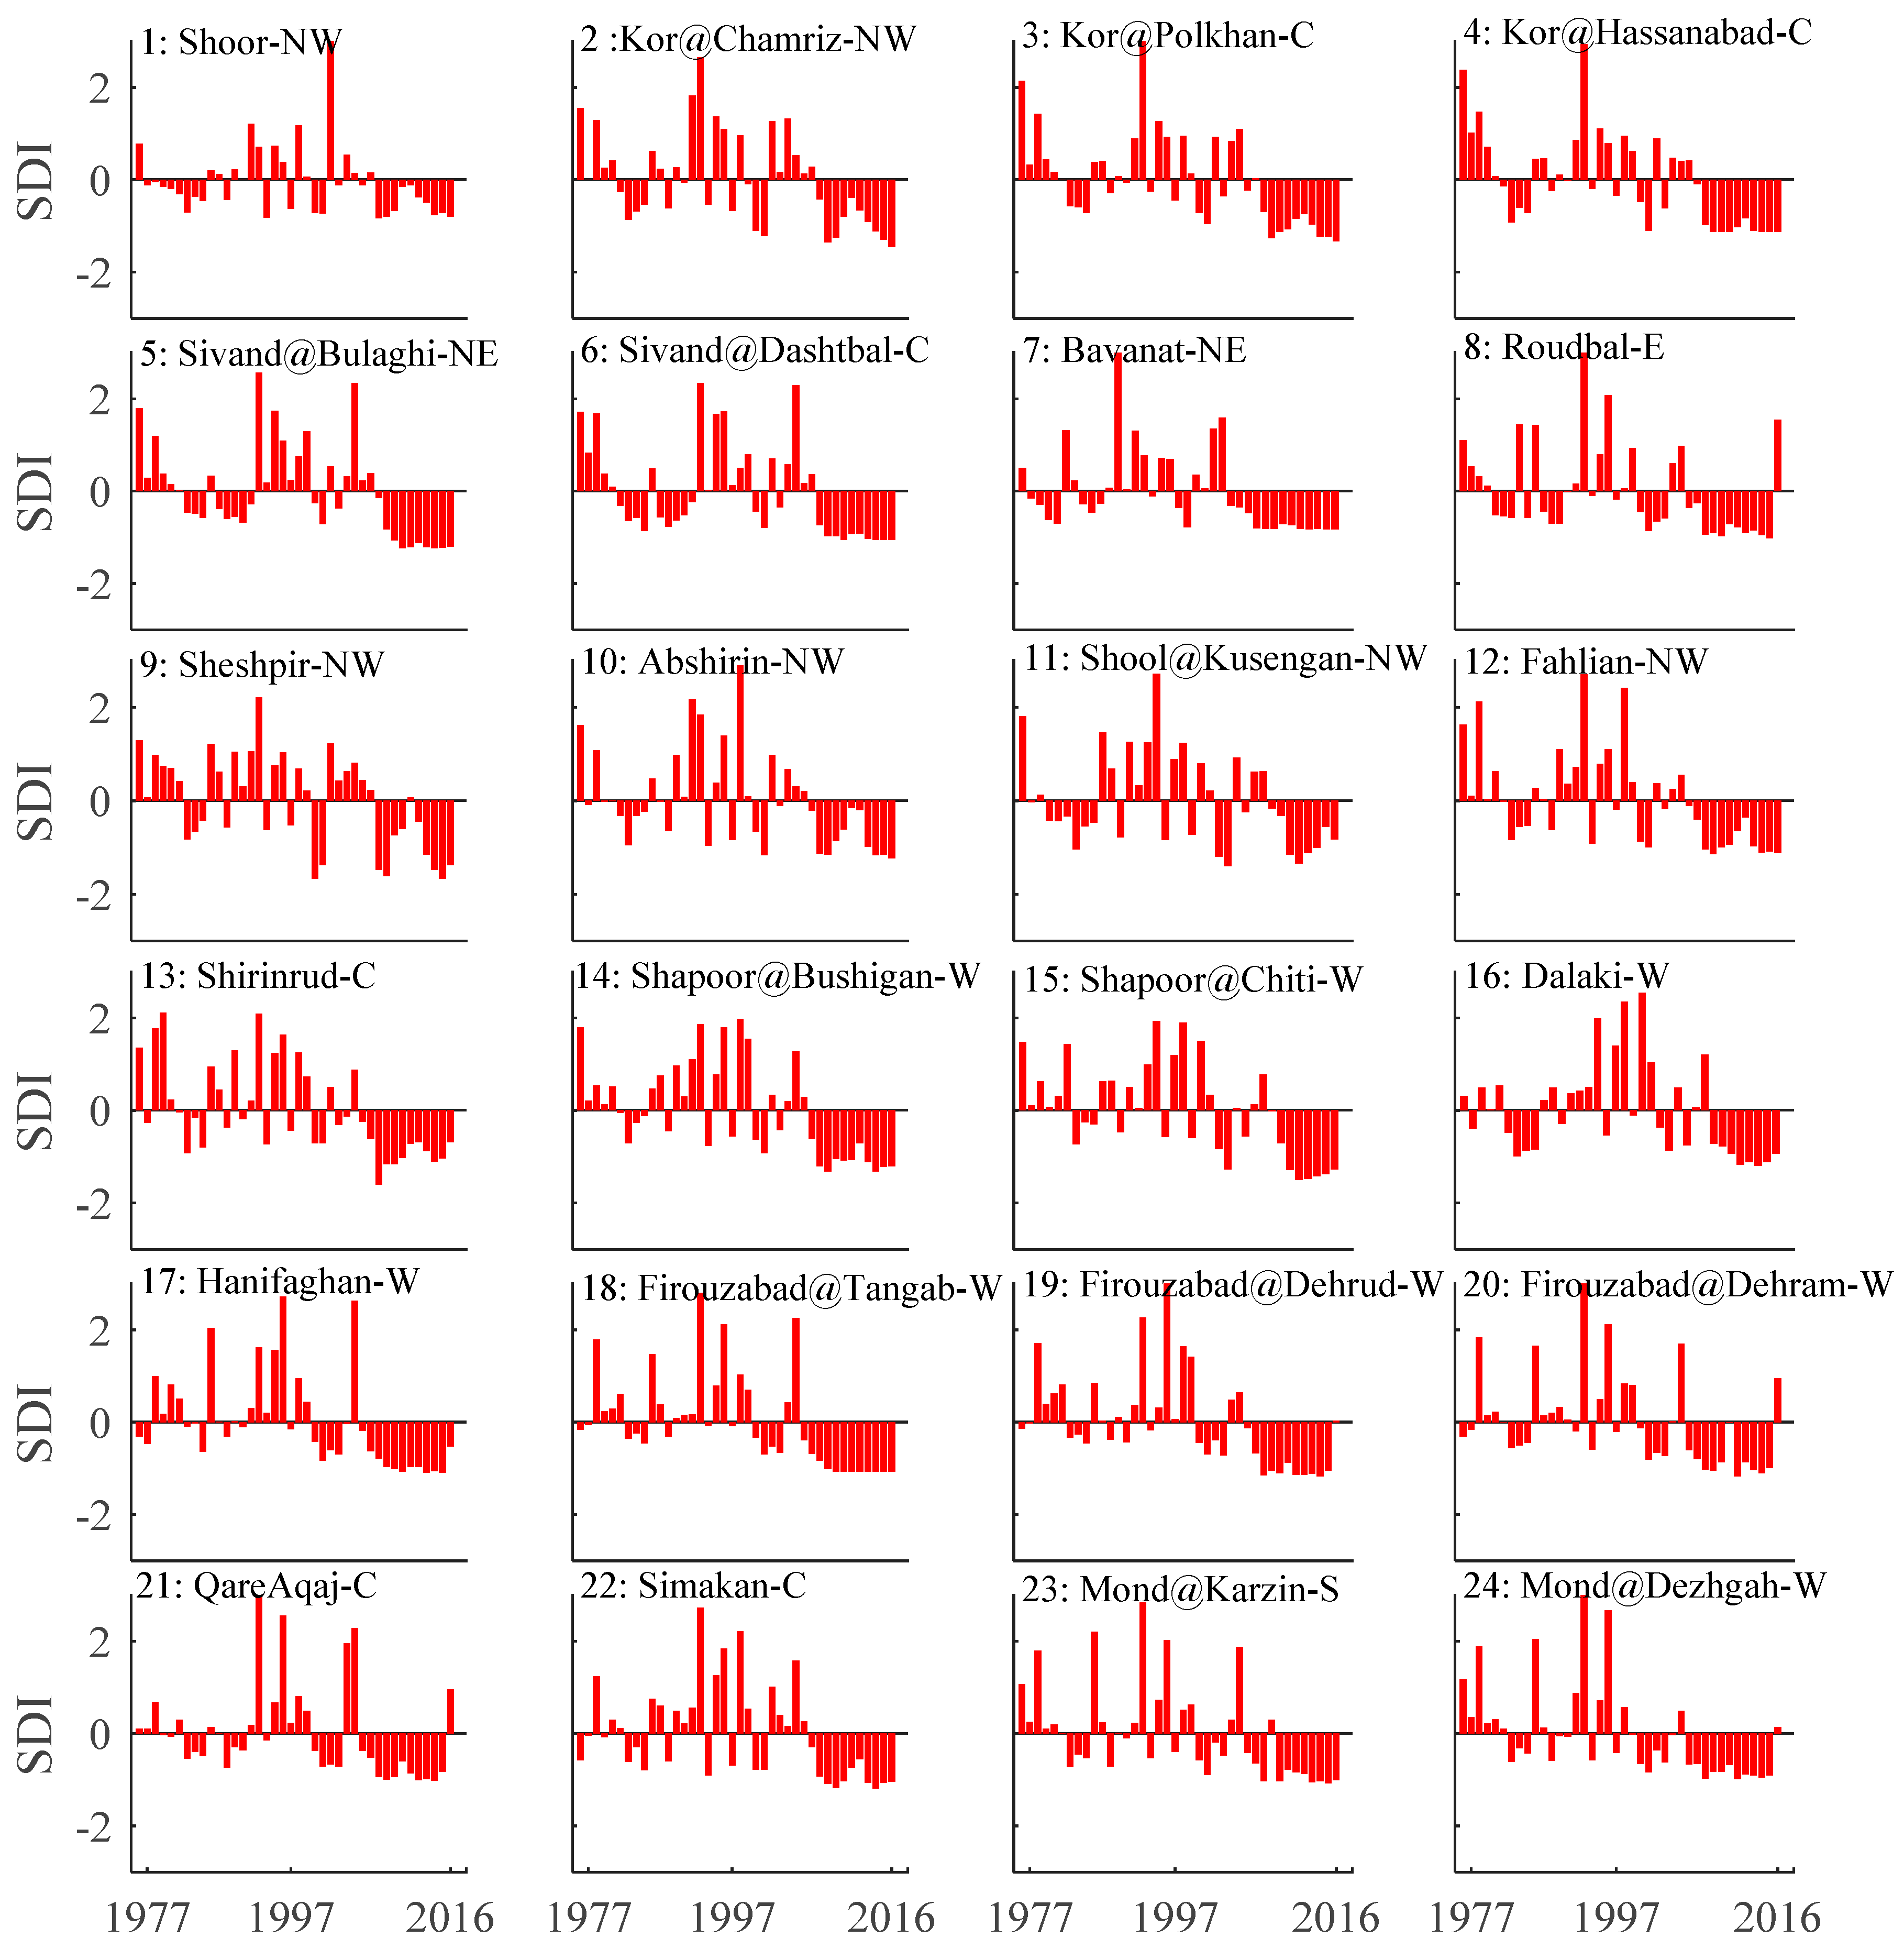
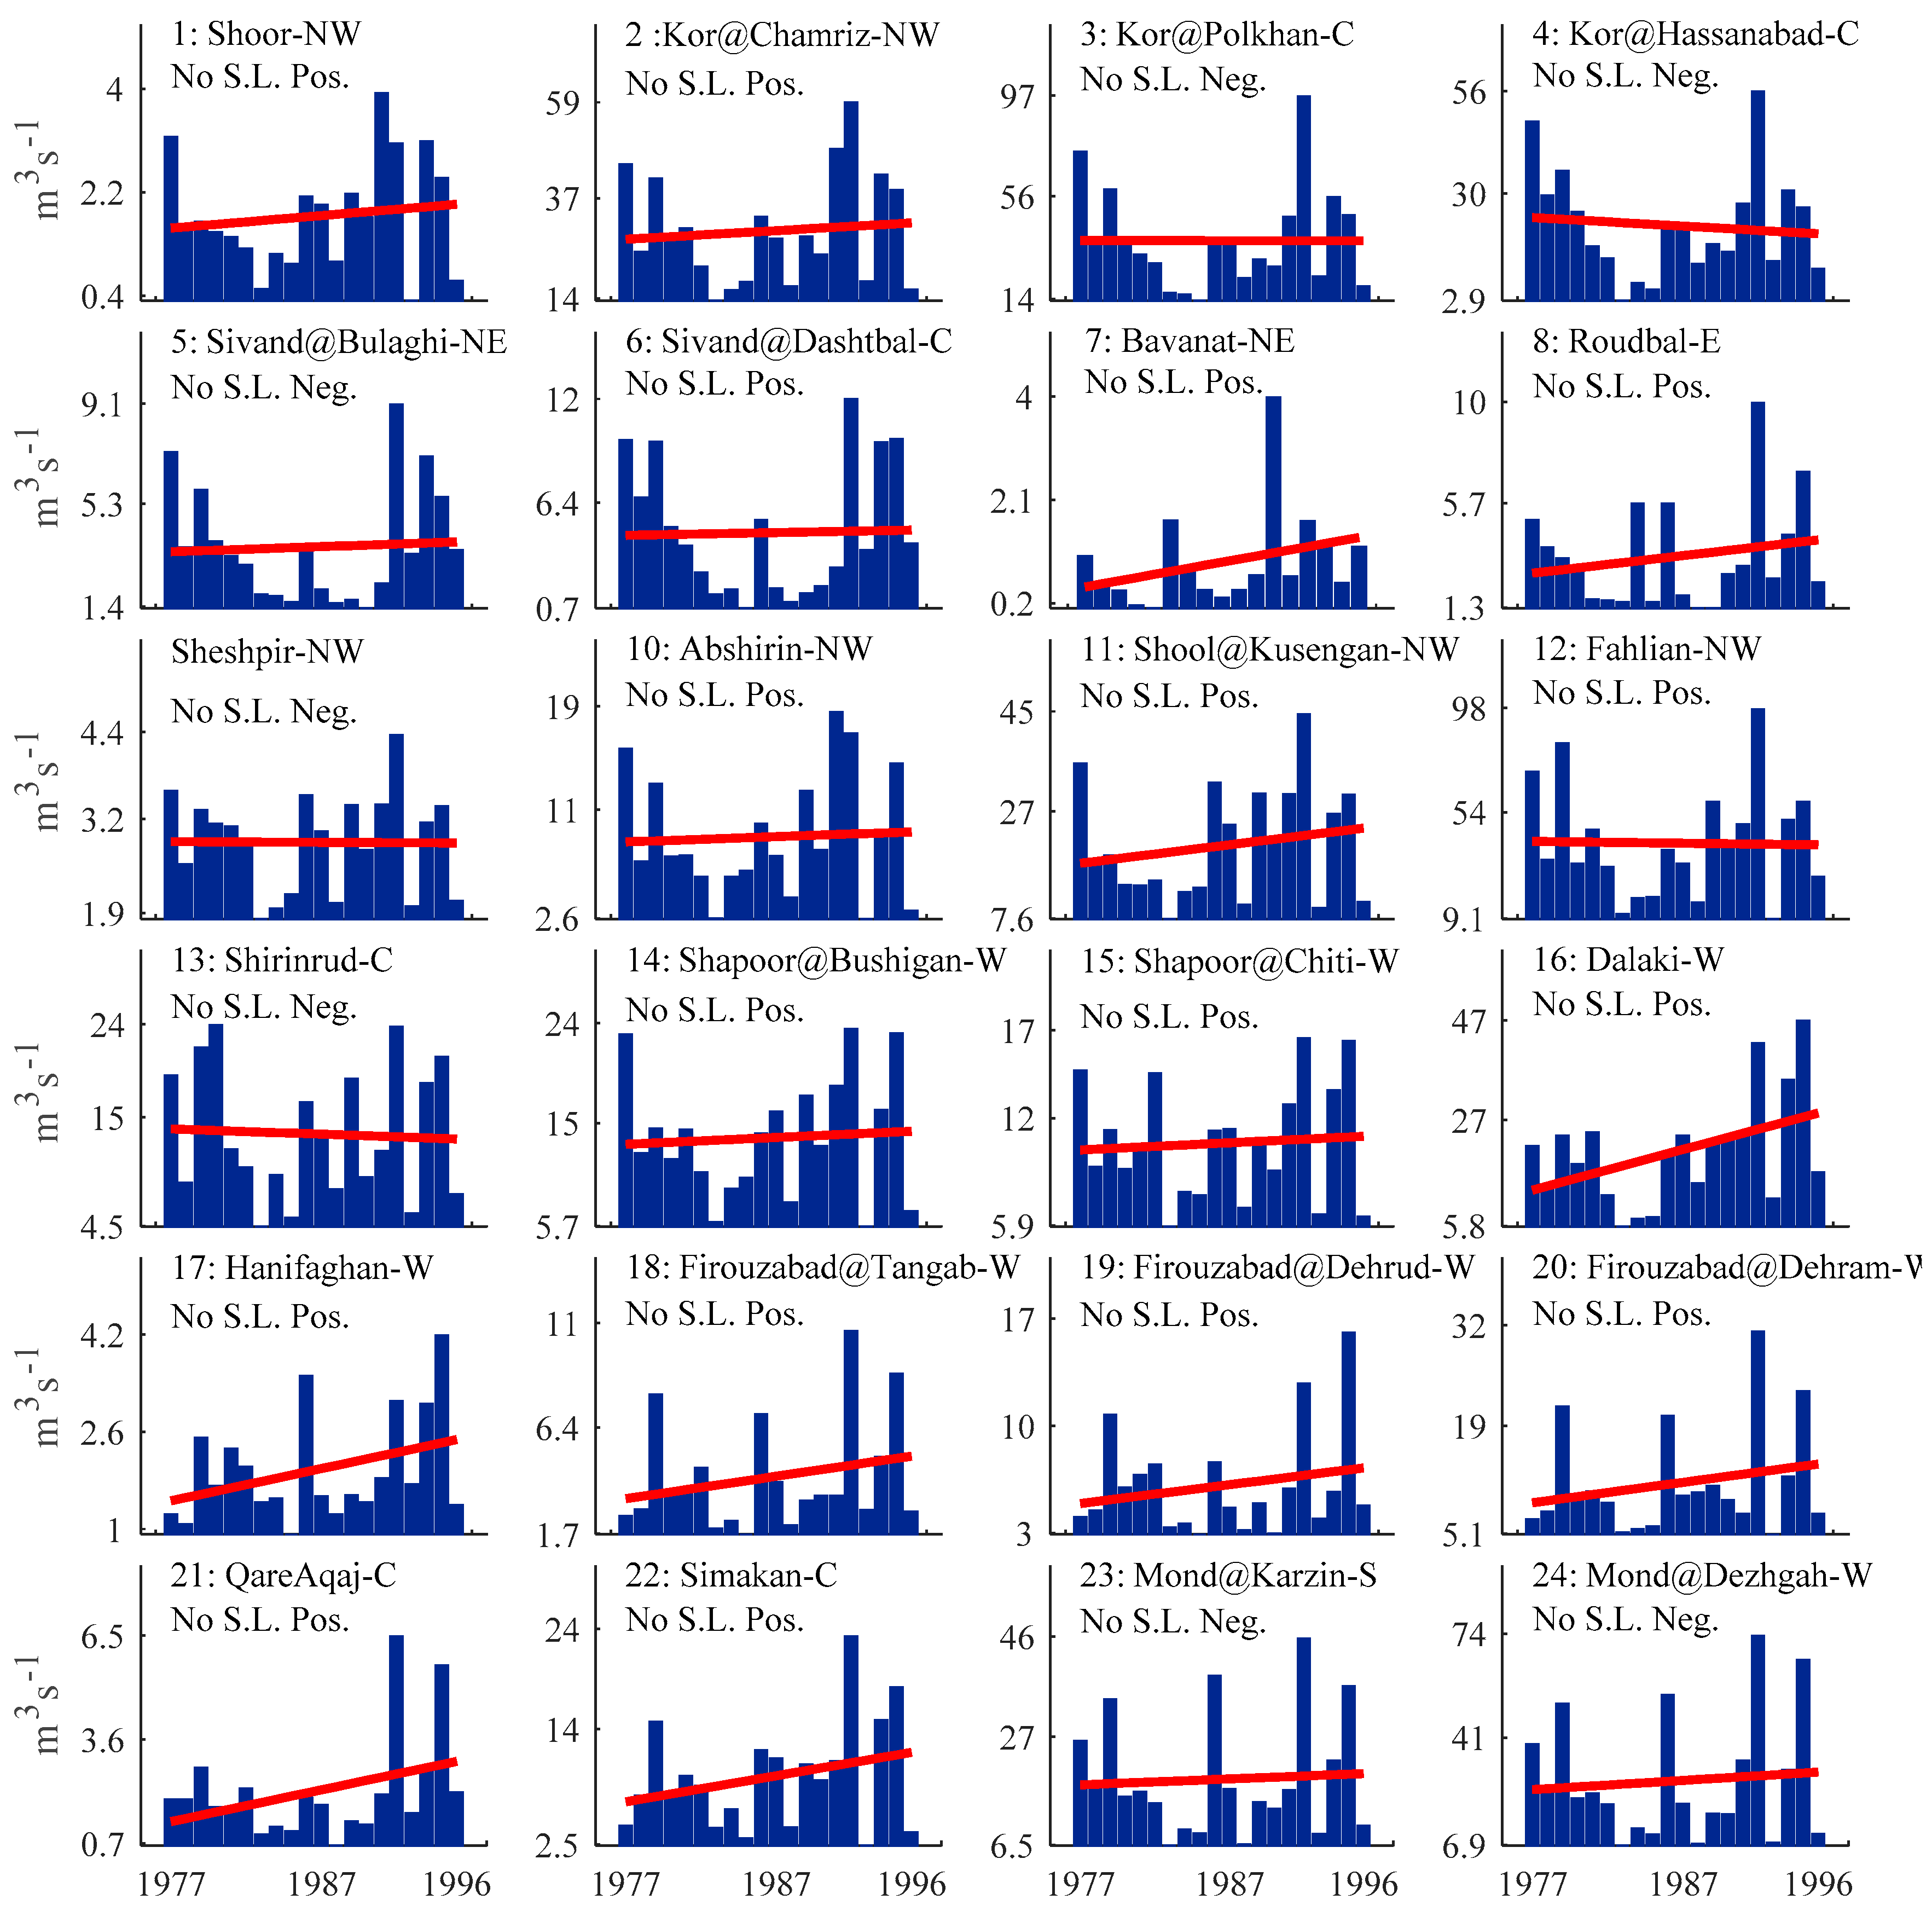
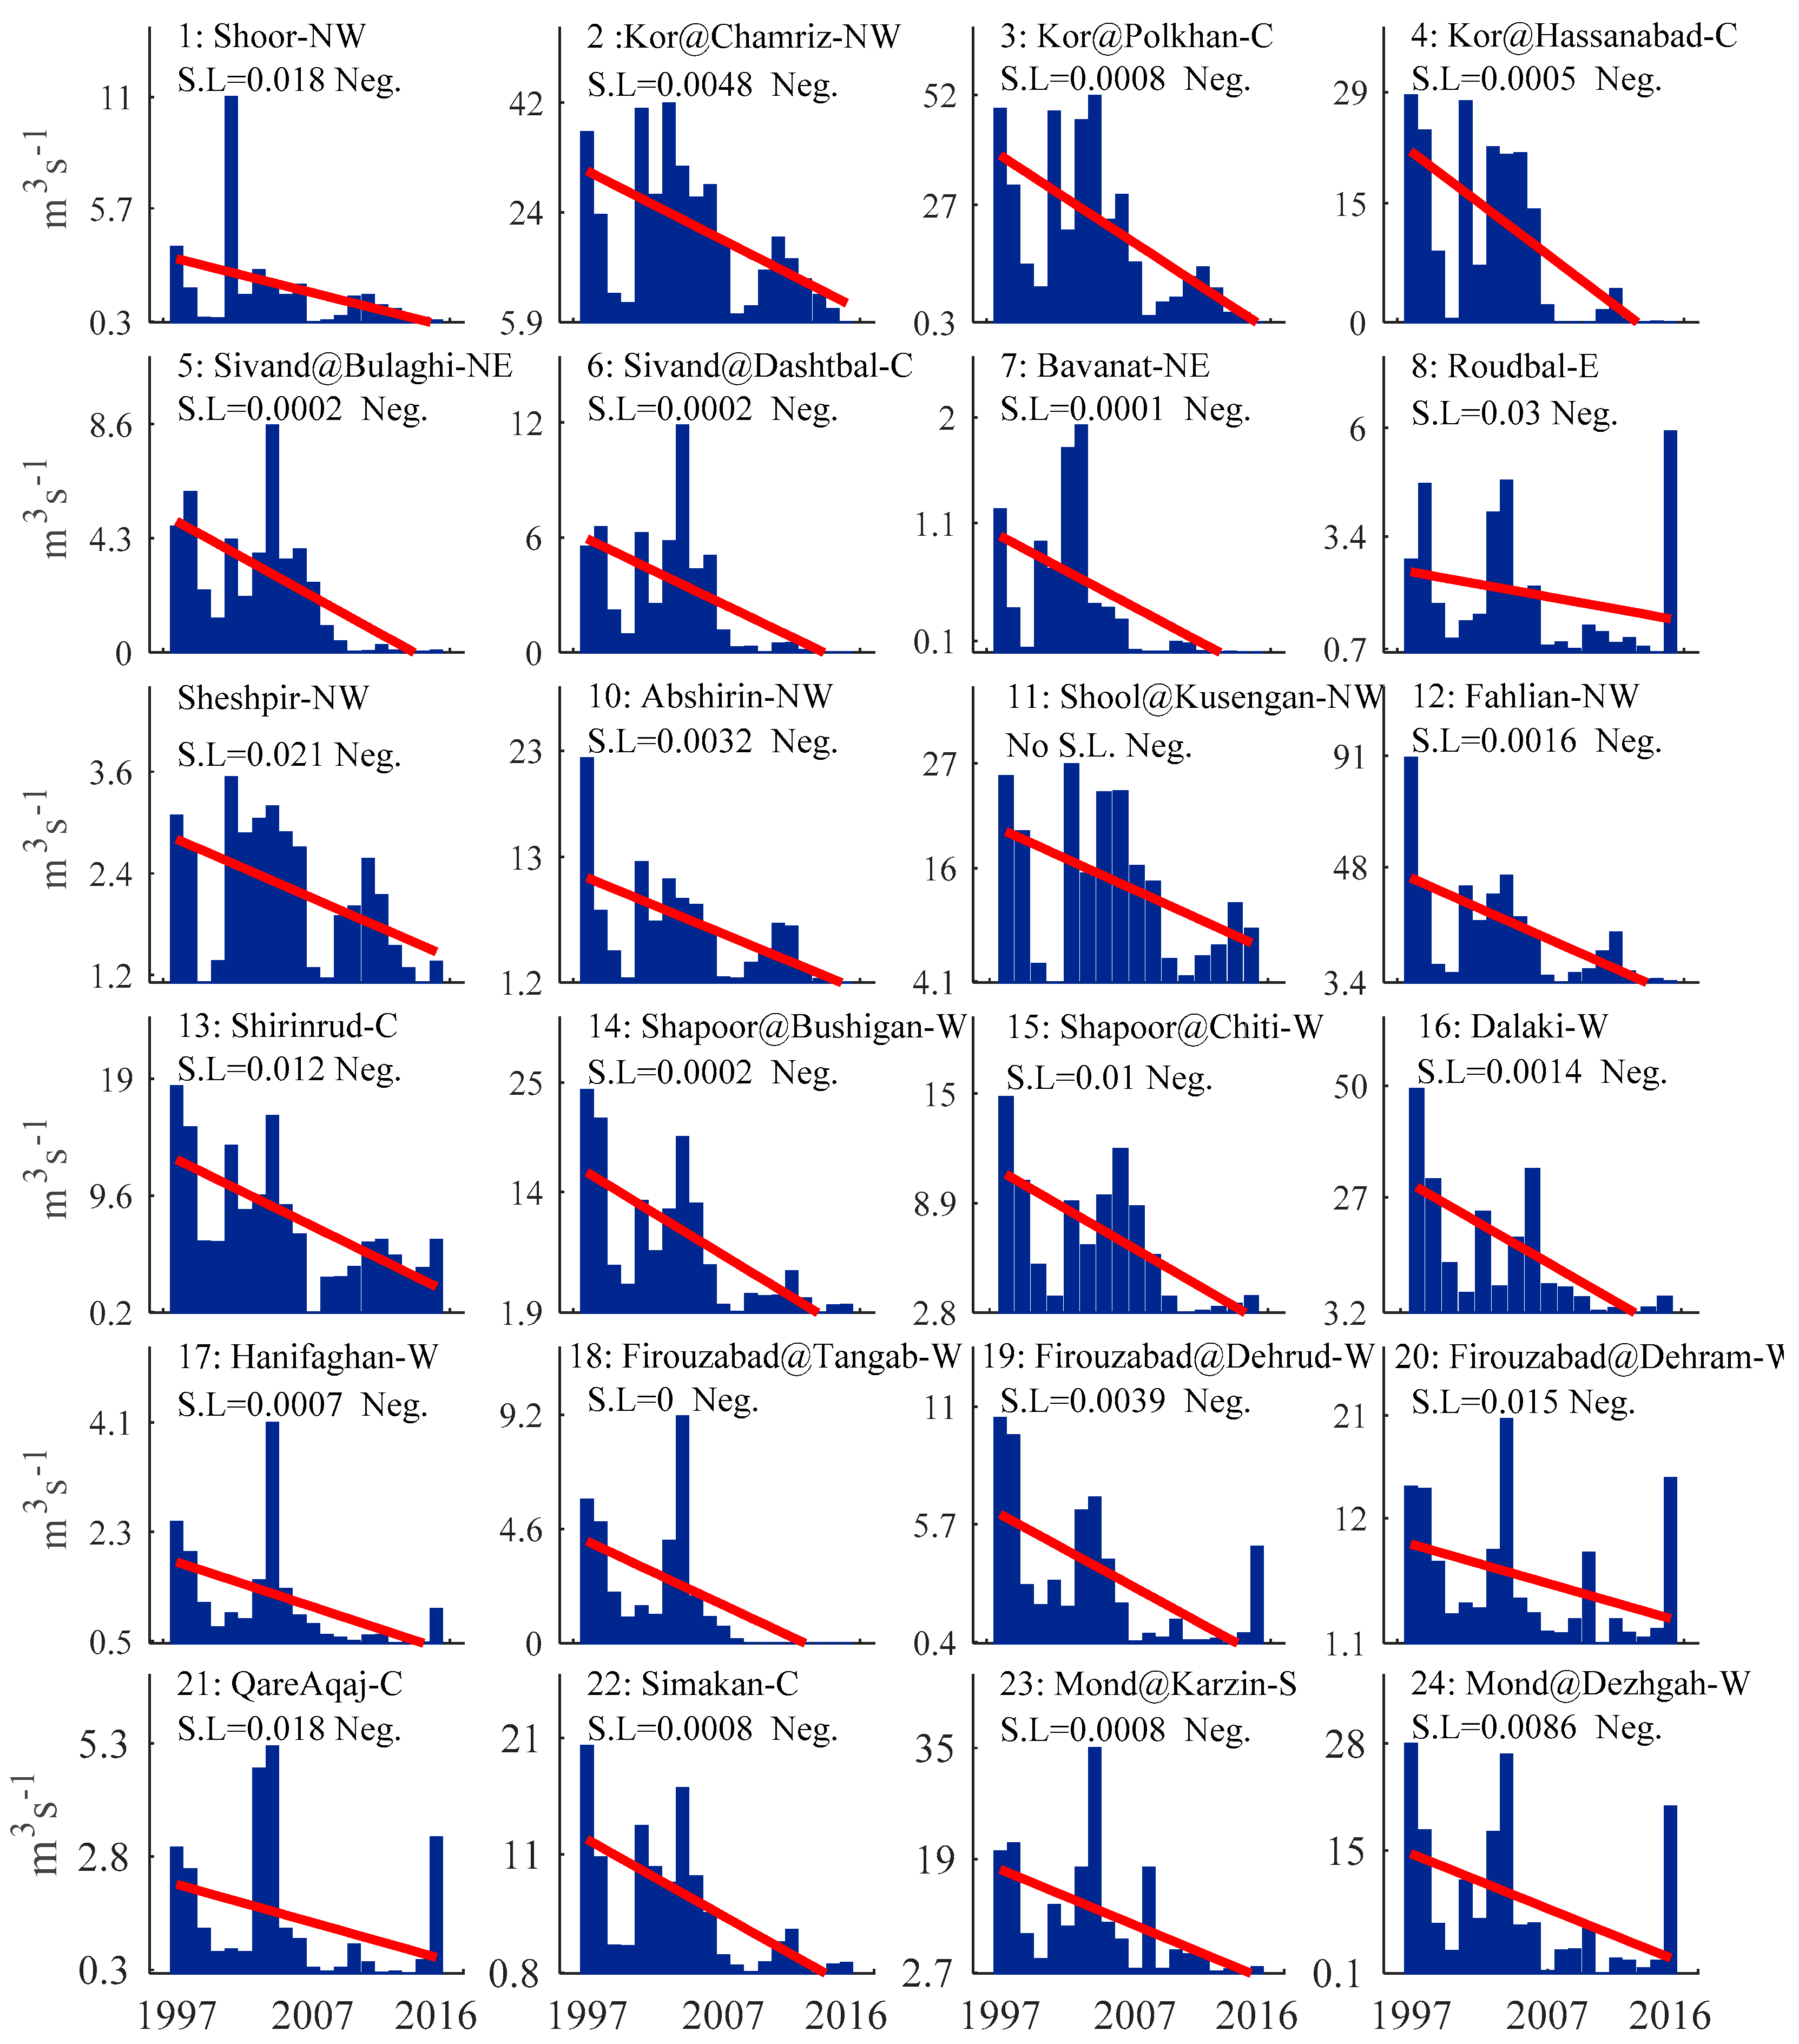
3.3. Hydrological Drought

The flow at all 24 gauging stations across Fars province (Figure 1c and Figure A3 in Appendix A) showed a significant negative trend in 1977–2016 (Figure 5), while before 1997 there was no significant trend for any gauging station (Figure A4 in Appendix A).
In the period 1977–1996, for more than 70% of stations, 17 out of 24, a positive tendency as with a non-significant trend was observed; for the remaining 30% of stations, numbers 3, 4, 5, 9, 13, 23, and 24, a non-significant negative tendency was detected (Figure A4 in Appendix A). In contrast, during the second half of the study period (1997–2016), all stations showed a significant negative trend from headwaters to downstream in the basin (Figure A5 in Appendix A). During this period, the flow rate was dramatically reduced to 0, or around 0 at several stations in latter years; for example, stations numbered 4 (Kor at Hassanabad, Inlet of Bakhtegan Lake), 5 (Sivand at Tange Bulaghi), 6 (Sivand at Dashtbal), 7 (Bavanat at Monj), and 18 (Firouzabad at Tangab below Tangab Dam) (Figure A5 in Appendix A). The mean flow reduction in the period (1997–2016) was about 42 %, but it varied from less than 2% (Jamalbyke in headwaters of Kor River, number 1) to around 70% (in Mond River at Dezhgah, number 24). Apart from the two % reduction at station number 1, the minimum reduction was 25% at all stations. These results reveal a transition from non-stationary to stationary river flow at all gauging stations between the first (1977–1996) and second (1997–2016) periods.
The results of SDI analysis confirmed an extended hydrological drought after 1997, based on the SDI definition that all years with negative values indicate hydrological drought (Figure 6). Mild hydrological drought was common for the Bavanat, Mond, and Shapur rivers in the eastern and western regions of Fars province. Around 42% of SDI values were negative during (1977–1996), increasing to 73% during (1997–2016). Regionally, the percentages of annual drought were 39.4, 35, 28.3, 27.5, 25, and 22.5 in the western, southern, central, northeastern, eastern, and northwestern regions, while at the basin level it was 37.5, 35.6, 30, 26.25, 25, and 23.3% in Heleh, Mond, Kavir, Zohreh, Kol-o-Mehran, and Bakhtegan, respectively. Hydrological drought was most common in the eastern region, 50% in the first period, and in the western region, 77.5% in the second period.

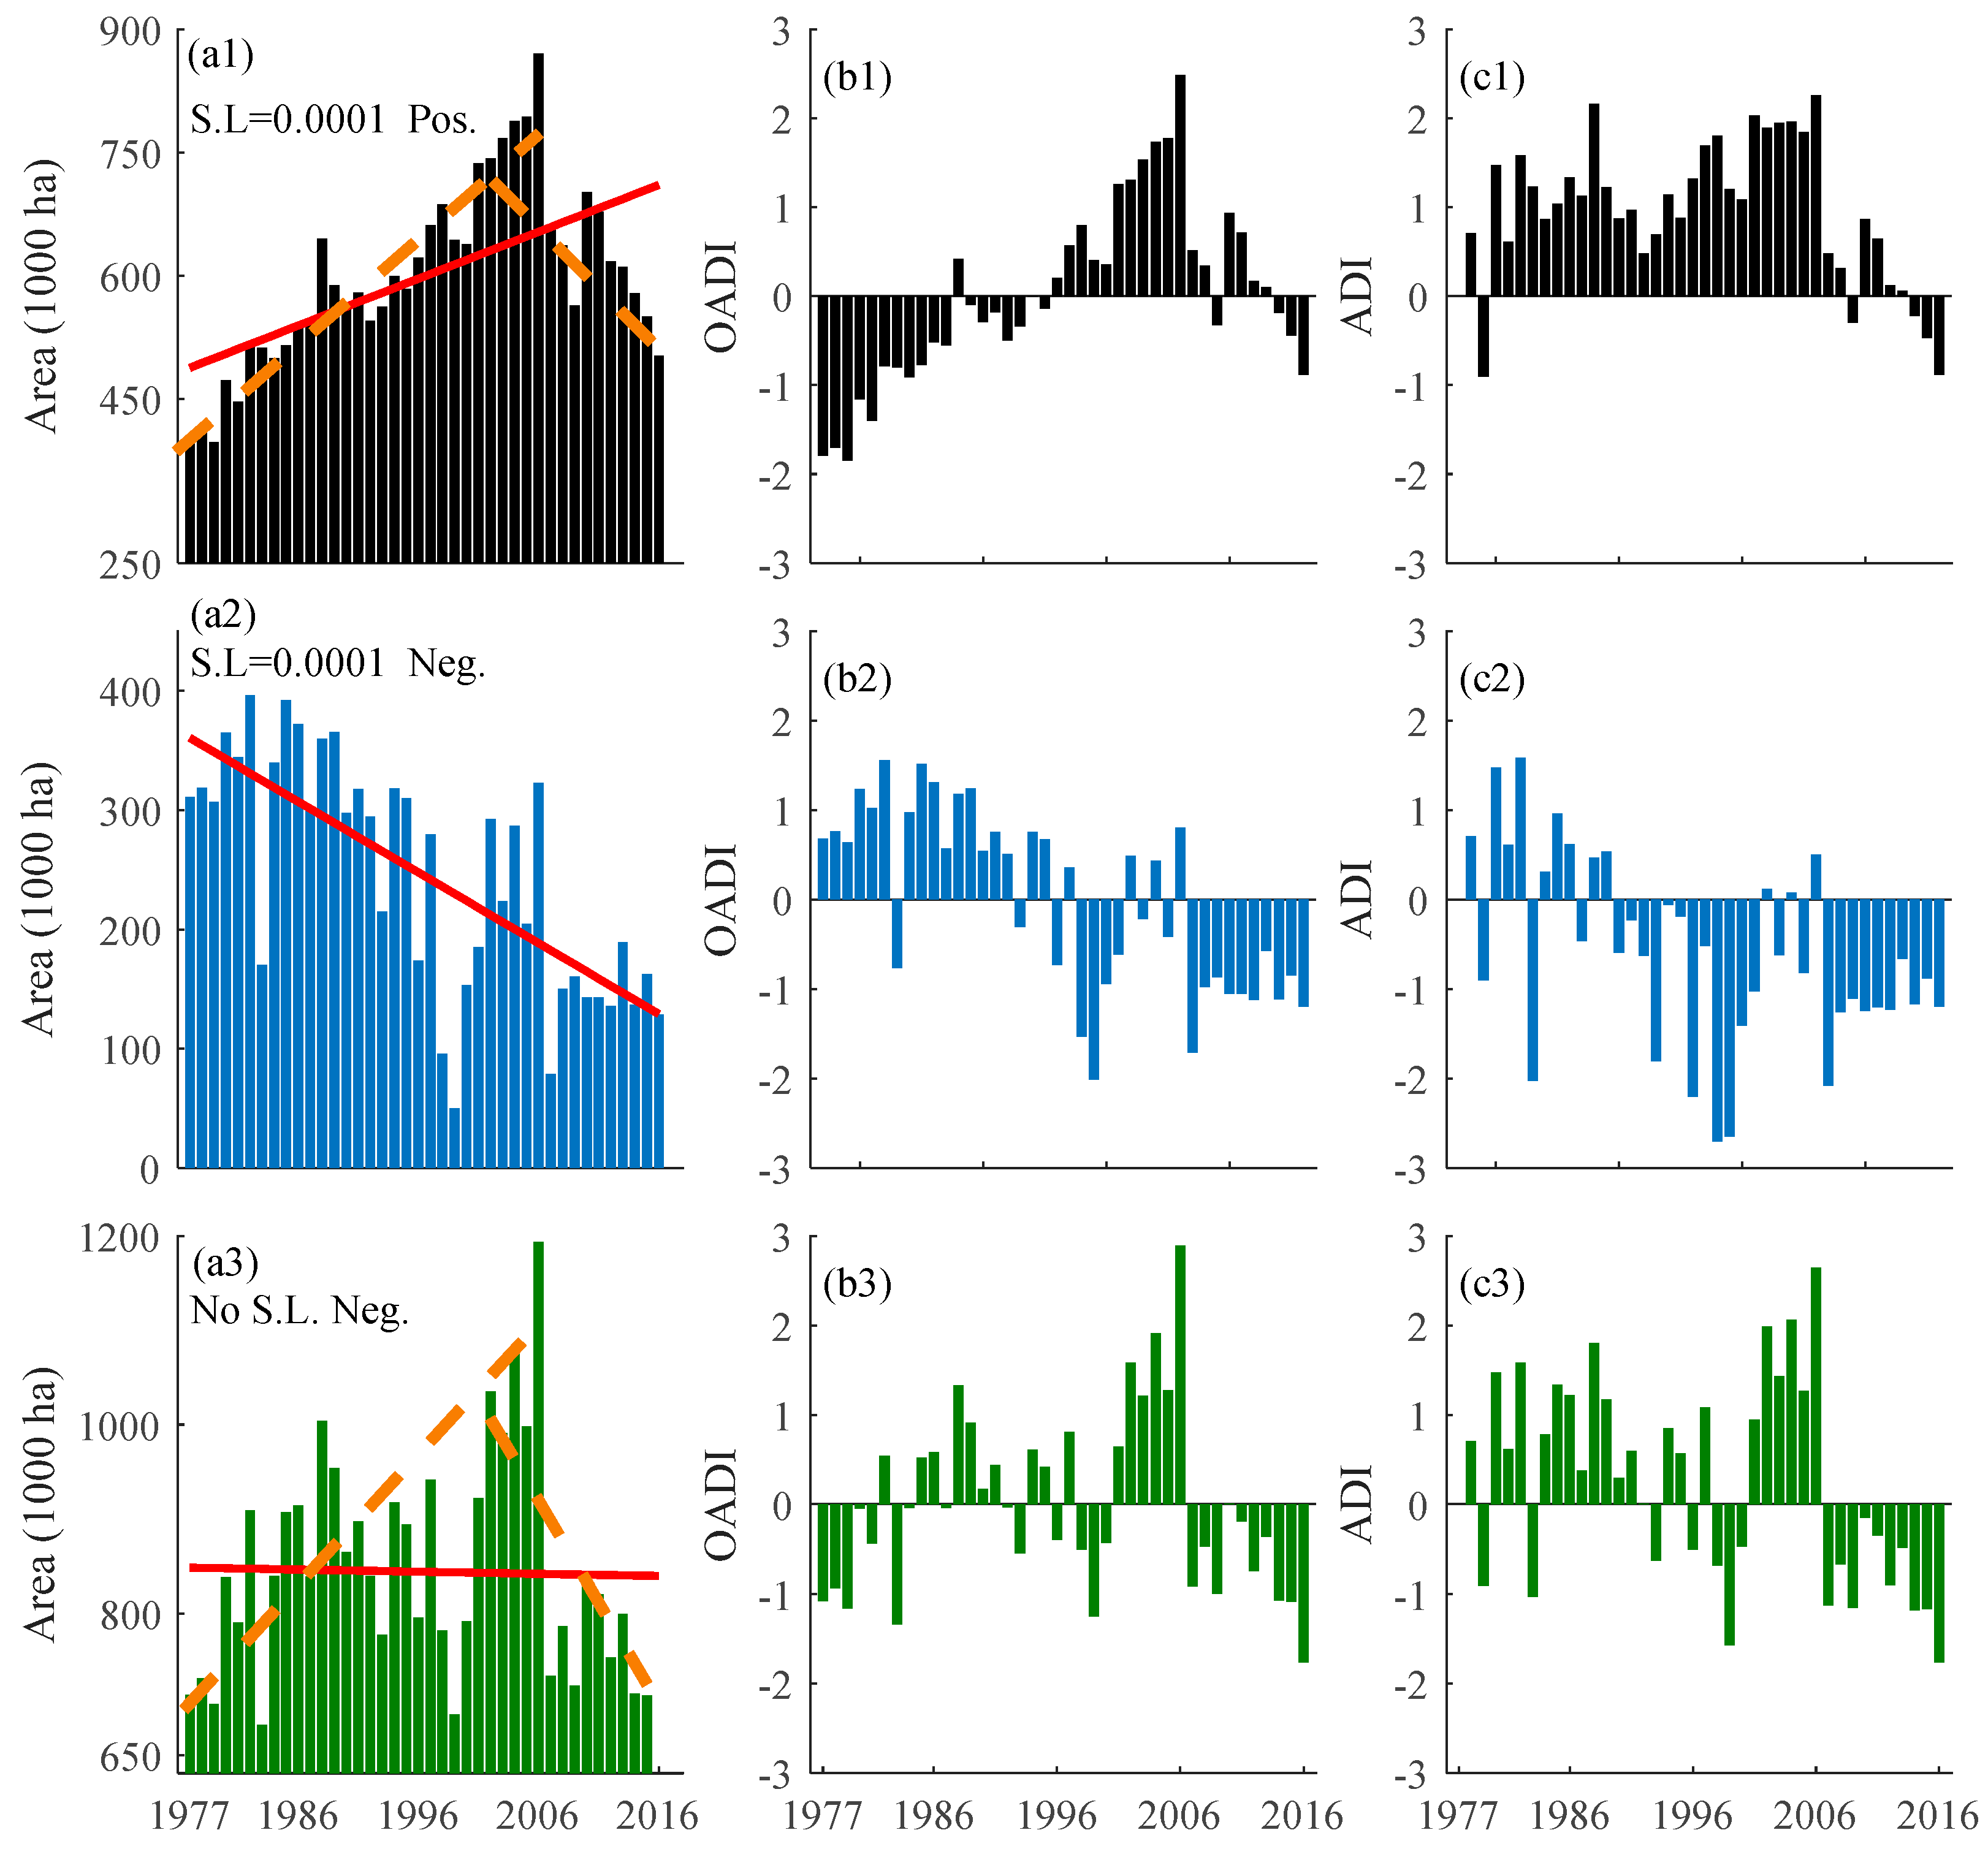
3.4. Agricultural Drought

During the study period (1977–2016), irrigated area showed a significant positive trend and rainfed area a significant negative trend, whereas total irrigation showed a non-significant negative tendency (Figure 7a1,a3). Based on the annual irrigated and rainfed cultivated area, two main periods were distinguished (i): 1977–2006 and (ii): 2007–2016. Total cultivated area increased dramatically until 2006, when it peaked at 1,193,450 ha, +11,650 ha y−1 based on 5-year moving average. It then decreased sharply, −20,310 ha y−1 based on 5-year moving average, to almost half, 631,000 ha, by 2016 (Figure 7a3).
The expansion in cultivated area in the first period (1977–2006) was only in irrigated area, 14,079 ha y−1, while the rainfed area decreased significantly, –2430 ha y−1 (Figure 7a1,a2). In the second period, both irrigated and rainfed areas showed significant decreases, −20,300 and −7260 ha y−1, respectively (Figure 7a1,a2).
Based on the OADI values, the irrigated area was below the mean, and the rainfed area was above the mean in 85% of years in 1977–1996, but 80% of years in 1997–2016 (Figure 7b2,b3). The main change in agriculture occurred from 1977 to 2006, when rainfed farmland, low water requirement, was widely replaced by irrigated area, high water requirement (Figure 7b2,b3). The irrigated area reached a maximum 870,000 ha in 2006 and then decreased to 397,000 ha in 2016 (Figure 7a). The greatest rainfed area, 396,000 ha, was in 1983, a normal year according to SPI value (Figure 4), and the least, 60,000 ha, was in 2000, a severe meteorological drought according to SPI value (Figure 4 and Figure 7b). A considerable increase in irrigated area, of around +21,000 ha y−1, occurred between 1997 and 2006, resulting in an average area of 733,000 ha (Figure 7b3). In the decades 1987–1996 and 2007–2016, the average areas were 580,000 and 610,000 ha, respectively. The contribution of rainfed irrigation to total cultivated area was 41 % during the period 1977–1986, but declined to less than 20% in the period 2007–2016, while irrigated area increased from 59 to 80% in the same period.
The ADI values revealed agricultural drought in Fars province (Figure 7c). Total farmland in most years before 2006 showed positive values of ADI, so no agricultural drought, except in years when the province was affected by extensive metrological drought (Figure 7c3). Generally, rainfall deficit is a major limiting factor for rainfed agriculture. In Fars provenience, in addition to rainfall deficit, the change in agriculture type from rainfed to irrigated farming was another reason for the decreasing ADI values for rainfed farmland in recent years (Figure 7c2). In contrast, the ADI for irrigated area was positive for most years before 2006 (Figure 7c1). This shows that metrological and hydrological droughts did not have any influence on irrigated agriculture and its development.
It can be concluded that the increase in irrigated area was mainly achieved based on groundwater exploitation, as there was a lack of available surface water according to hydrological drought analysis (SDI in Figure 6; trend analyses in Figure A4 in Appendix A). This lowered the groundwater level in the 12 major aquifers in different regions of Fars province (Figure 8). The greatest lowering was recorded in the Arsenjan aquifer in the eastern region of the province during 1995–2015 (Figure 8). The least groundwater lowering was observed in the Shiraz and Neyriz aquifers, around 10 m over 20 years (Figure 8). The groundwater lowering impact was affected by aquifer area, with small aquifers showing more depletion. For example, the Arsenjan, area 101.6 km2, showed the greatest depletion in volume, about 0.212 km3, while in Shiraz, area 207 km2, the depletion in volume was about 0.123 km3. Total, rainfed, and irrigated areas had negative values of ADI after 2006. In that period, it can be concluded that meteorological drought, SPI analysis, hydrological drought, SDI analysis, and the considerable depletion in groundwater resources display evidence of significant agricultural drought (Figure 7c).
Although soil moisture is a well-known indicator of agricultural drought [55,56,57], we developed two new indices, OADI and ADI, for agricultural development and drought, based on the change in cultivated area. These two indices complement each other in interpreting drought and changes in irrigated area, as shown in this study. The main advantage these two new indices is that they evaluate the situation based on real agricultural functions in the area. Needed data can be obtained from overall agricultural reports, and in comparison, the soil moisture data are sparsely measured and the available remote sensing data have a low resolution.

4. Discussion

There were clear signs of climate change in Fars province during the study period, with a reduction in the number of different climate types across the province. According to the Emberger index, the land area with a hyper-arid climate increased in the province over the years. This meant that availability of renewable water declined in recent decades, although, based on climate analysis, there was no significant negative trend in precipitation (Figure A2 in Appendix A). This reduction in water resources could be related to climate variability and/or meteorological drought in the latter part of the study period.
Among the different categories of drought, meteorological drought based on SPI was found to be a non-stationary stochastic phenomenon in trend analysis for the province, while hydrological drought based on flow data clearly showed a negative trend, with significant lowering of groundwater levels. After 1997, hydrological drought conditions dominated, based on SDI values. Irrigated area continued to expand until 2006, when it reached its absolute maximum in the history of the province. The lack of sufficient surface water, the dominant negative phase of SDI (Figure 6) in main rivers after 1997, could confirm that the expanding by about 400,000 ha of irrigated agriculture between 1997 and 2006 was mainly established based on groundwater exploration. It exerted more pressure on groundwater resources, as seen in groundwater level in major aquifer. A metrological drought period from 2006 onwards led to a further reduction in rainfed area, accelerated hydrological drought, reduced groundwater recharge, and increased groundwater overexploitation. Consequently, the agricultural drought period that started in 2006 resulted in a significant decrease in cultivated area. Overall, before 1997, hydrological drought was a stochastic phenomenon and almost followed the meteorological drought, whereas after 1997 it was mainly due to increasing water use in headwaters and metrological drought.
While drought is viewed locally as a force majeure event in most cases, detailed research has shown that drought is often related to human activities and could be avoided with proper management [58]. In Fars province, overexploitation of water resources, both groundwater and surface water, led to more frequent hydrological droughts after 1997. In this study, hydrological drought was observed over more than 72% of the period 1997–2016, whereas meteorological drought occurred during only 40% of that period. In contrast, in the period 1977–1996, hydrological drought was only observed for 42% of it, and more than 75% of gauging stations showed positive tendency in flow. Thus, the use of water resources and the irrigated area before 1997 were matched by the potential renewable water resources in the province, but after 1997, water consumption exceeded the renewable water available. After 1997, groundwater was the main source of water for irrigation of new cultivated areas and the groundwater resource became depleted. This led to a significant reduction in cultivated area after 2006, due to unavailability of water resources to maintain existing cultivated area in the whole province. The decreasing contribution of rainfed agriculture, from 40% to 20%, was another driver of unsustainability in the use of water resources and of increasing hydrological droughts in the period 1997–2016. Thus the 10 years after 2006 with hydrological drought resulted in agricultural drought, as reflected in decreasing cultivated area. Furthermore, Fars experienced several meteorological droughts in later years, and these undeniably contributed to water shortage. In the past, for example, before 1990, when the irrigated area was smaller and rainfed area made up a greater proportion of total cultivated area, groundwater resources were able to compensate for occasional rainfall deficits and the overall stress on water resources was minor.
The dry period particularly after 2006 and changing from rainfed to irrigated cultivated area led to a tipping point where water demand exceeded the sustainable level for water resources and potential for renewable water. The reduction in river flow and significant depletion in groundwater level confirms this unsustainability in use of water resources. In arid and semi-arid regions, groundwater is a secure source of water that should be saved for drought periods and water shortages. Basing agriculture on groundwater resources has led to agricultural droughts and has also had many socioeconomic and environmental impacts; e.g., land subsidence [59], abandonment in rural areas [60], depression, suicide of rural farmers [61,62], and household food consumption [63]. Overall, we identified three clear stages in Fars province in the 40-year study period.
The first stage (1977–1996) was a period of sustainable agriculture and water resources. There was a good ratio of rainfed to irrigated area, 40:60. Exploitation of groundwater resources occurred only during periods of insecure water supply, meteorological drought, and any groundwater depletion was compensated for in other years. During meteorological drought, cultivated rainfed area was reduced by 40%. Therefore, water usage was almost in proportion with renewable water resources, and hydrological drought was a stochastic phenomenon that occurred randomly due to meteorological drought. The sustainability of water resources was not sensitive to climate variability and meteorological drought.
The second stage (1996–2006) saw a transition from sustainability to unsustainability. It was a golden economic period for farmers, with total cultivated area reaching a maximum and the proportion of irrigated area increasing to 80%, mainly based on groundwater. The new economic conditions increased the expected water demand of local inhabitants beyond a sustainable state. This led to rapid loss of considerable groundwater resources, which altered the interaction between groundwater and surface water, reducing surface water recharge from groundwater [29]. Reduced flow in rivers and increasing frequency of hydrological droughts increased the pressure on the water resources system towards unsustainability.
The third stage from 2006 onwards was unsustainability, with a significant reduction in agricultural area being due to unavailable water resources and the overexploitation of groundwater with deeper wells and greater energy demand for pumping. Continued low flow in the rivers and recurring hydrological droughts, led to exacerbating problems in the operation of installed hydraulic structures, such as dams, on rivers [29]. Insecurity in groundwater resources and unsustainability in agriculture led to increasing internal migration and decreasing cultivated area. There were also environmental impacts, such as desiccation of lakes and wetlands, land subsidence, and desertification [64,65,66].
Overall, we cannot conclude that the whole of Fars province is in stage three, but much of it appears to be. As in other arid and semi-arid regions, the province must seek to move water usage in a sustainable and efficient direction. They must change crop patterns by using low consumption crops; and revise the water allocation policy and prioritize water for consumption. Optimize the reservoir operation and managed aquifers. Drainage control could be effective for irrigated farmland; farmers should select crops that are more suitable for the arid climate and need less water per hectare; and smallholder farms should be supplied with information on seeding and harvesting times for each crop type, for better water usage efficiency. Groundwater must be protected as a vital resource for diminishing the impact of climate variability and climate change.

5. Conclusions

In this study, we examined the transition from sustainability to unsustainability in water resource use and agriculture in an arid and semi-arid region and the temporal causes and effects of meteorological, hydrological, and agricultural droughts. We developed a new way to evaluate climate change and variability, based on two main elements of the Emberger aridity index, humidity influence factor (HIF) and climate influence factor (CIF), and considering the change in variety of climate types. We also developed two new indices for agricultural drought analysis, overall agricultural drought index (OADI) and agricultural drought index (ADI), which are based on changes in irrigated and rainfed farmed area. We demonstrated the outcomes using the example of Fars province, one of the most important agricultural regions in southern Iran. We showed that the number of climate types has decreased over time in different regions of the province, from a maximum of 20 in the period 1987–1996 to 14 in the period 2007–2016. A hyper-arid climate dominated, with on average 32% spatio-temporal coverage for the 40-year study period and a significant increase from 32.3% in 1977–1986 to 44.4 in 2006–2015. Around 75% of years between 1977 and 2016 were normal and wet in terms of meteorological conditions and uniformly distributed across the whole period, while the frequency of hydrological and agricultural droughts increased particularly in later years (2006–2015). Regarding water resources’ sustainability and resilience, we identified three clear stages during the 40-year period: (1) Sustainable use of water resources before 1997, when water demand was matched by renewable water capacity and irrigated farmland area, was small relative to rainfed area. (2) Transitional use of water resources in 1997–2006, with increasing irrigated area accompanied by hydrological drought, leading to significant groundwater depletion and reduced resilience of the water resources. (3) Unsustainable use of water resources after 2006, with a lack of water resources, particularly groundwater, together with climatological and hydrological droughts, resulting in agricultural droughts and a considerable decrease in farmland area in Fars province.

Author Contributions

Research conceptualization and methodology: A.T.H., N.A.Z., and P.M.R.; formal analysis and investigation: A.T.H., N.A.Z., and P.M.R.; research resources and data curation: A.T.H., R.N., H.S., and A.A.H.; original draft preparation: A.T.H. and N.A.Z.; reviewing and editing A.T.H., N.A.Z., P.M.R., R.N., H.S., and A.A.H.; supervision: B.K. All authors have read and agreed to the published version of the manuscript.

Funding

This research received no external funding.

Acknowledgments

The authors would like to thank the Regional water company of Fars and Fars Agricultural Organization for providing the data.

Conflicts of Interest

The authors declare no conflict of interest.

Abbreviations

HIFhumidity influence factor
TIFthermal influence factor
CIFclimate influence factor
SPIstandardized precipitation index
SDIstreamflow drought index
OADIoverall agricultural drought index
ADIagricultural drought index
VC-HAvery cold, hyper arid
VC-ARvery cold, arid
VC-SAvery cold, semi-arid
VC-SHvery cold, semi humid
VC-HUvery cold, humid
VC-HHvery cold, hyper humid
CD-HAcold, hyper arid
CD-ARcold, arid
CD-SAcold, semi-arid
CD-SHcold, semi humid
CD-HUcold, humid
CD-HHcold, hyper humid
CL-HAcontinental, hyper arid
CL-ARcontinental, arid
CL-SAcontinental, semi-arid
CL-SHcontinental semi humid
CL-HUcontinental humid
CL-HHcontinental hyper humid
TE-HAtemperate, hyper arid
TE-ARtemperate, arid
TE-SAtemperate, semi-arid
TE-SHtemperate, semi humid
TE-HUtemperate, humid
TE-HHtemperate hyper humid
HO-HAhot, hyper arid
HO-ARhot, arid
HO-SAhot, semi-arid
HO-SHhot, semi humid
HO-HUhot, humid
HO-HHhot, hyper humid
VH-HAvery hot, hyper arid
VH-ARvery hot, arid
VH-SAvery hot, semi-arid
VH-SHvery hot, semi humid
VH-HUvery hot, humid
VH-HHvery hot, hyper humid

Appendix A

Figure A1. Distribution (percentage) of climate types in Fars province in different periods.
Water 12 00838 g0a1
Figure A2. Annual rainfall variation and trend in Fars province and in its six different regions in the study period. S.L. = significance level.
Water 12 00838 g0a2
Figure A3. Layout of main basins, rivers, and location of gauging stations in Fars province.
Water 12 00838 g0a3
Figure A4. Trend of flow in selected rivers across the study area (1977–1996). The Kor, Firouzabad, and Mond rivers had more than one selected station, so station names are added. Neg. and Pos. are negative and positive trend. Regions: W: western, NW: northwestern, C: central, S: southern, E: eastern, and NE: northeastern. SL = significance level. Detailed information on all stations is provided in Table A2.
Water 12 00838 g0a4
Figure A5. Trend of flow in selected rivers across the study area (1997–2016). The Kor, Firouzabad, and Mond rivers had more than one selected station, so station names are added. Neg. and Pos. are negative and positive trend. Regions: W: western, NW: northwestern, C: central, S: southern, E: eastern, and NE: northeastern. SL = significance level. Detailed information on all stations is available in Table A2.
Water 12 00838 g0a5
Table A1. Information on meteorological stations that supplied precipitation and temperature data.
NumberStationBasinLongitudeLatitude
1Bande BahmanMond52.5729.28
2ChamrizMaharloo-Bakhtegan52.1030.47
3JahanabadMaharloo-Bakhtegan53.8629.71
4DobonehMaharloo-Bakhtegan52.7829.42
5SedehMaharloo-Bakhtegan52.1630.72
6QalatMaharloo-Bakhtegan52.3429.84
7KomehrMaharloo-Bakhtegan51.8730.44
8Madar soleymanMaharloo-Bakhtegan53.1830.19
9KarianMond53.5328.13
10LarKol- Mehran54.2827.68
11ShirazMaharloo-Bakhtegan52.2829.7
12FasaKol-o-Mehran53.6328.92
13MazijanKavire-Sirjan53.6630.45
14AbadehShomal52.6531.16
15TangabMond52.5528.92
16BatoonZohreh51.3230.24
17GovazoonKol-o-Mehran54.4528.7
18BorghanZohreh52.0230.22
19FarashbandHeleh52.0928.86
20JerehHeleh51.9829.24
21ChityHeleh51.329.58
22HanifaghanMond52.5529.1
23DasharxhanHeleh5229.66
24KarzinMond53.1128.45
25BabaarabMond53.7728.58
26DezhgahMond52.428.21
27JahromMond53.5628.5
28DogonbedanZohreh50.7930.36
29YasujKaroon51.5930.67
30BushehrHeleh50.8428.91
31YazdDesert 54.2931.86
32ZarindashtKol-o- Mehran54.4328.35
33ShonbeMond51.7728.39
34ForgKol-o- Mehran55.1928.315
35NeyrizMaharloo-Bakhtegan54.329.18
36HajiabadKol-o- Mehran55.928.31
37LamerdKol-o- Mehran53.1827.34
38RoonizMond53.7729.19
Table A2. Information on gauging stations that supplied flow data.
NoRiverStationBasinRegionLongitudeLatitudeArea km2
1ShoorJamalbykeMaharloo-BakhteganN-West51.9730.60160
2KorChamrizMaharloo-BakhteganN-West52.1030.473390
3KorPolkhanMaharloo-BakhteganCenter52.7829.856250
4KorHassanabadMaharloo-BakhteganCenter53.8629.7119245
5SivandTange BulaghiMaharloo-BakhteganN-East53.1530.184798
6SivandDashtbalMaharloo-BakhteganCenter52.9730.036100
7BavanatMonjKavir e SirjanN-East53.9030.36781
8RoudbalDarbQaleKol-o- MehranEast54.4528.70765
9SheshpirGoshneganZohrehN-West52.0730.2255
10AbshirinGoorabZohrehN-West51.6730.18510
11ShoolKusenganZohrehN-West51.6530.032179
12FahlianBatoonZohrehN-West51.3330.253764
13ShirinrudShibtangHelehCenter52.0529.27770
14ShapoorBushiganHelehWest51.5029.721390
15ShapoorChitiHelehWest51.7829.252428
16DalakiCham e ChitHelehWest51.3029.273900
17HanifaghanHanifaghanMondWest52.5529.10415
18FirouzabadTangabMondWest52.5528.921377.1
19FirouzabadDehrudMondWest52.5728.622493.5
20FirouzabadDehramMondWest52.3528.494032.7
21Qare AqajBahmanMondCenter52.5729.282410
22SimakonBerakMondCenter53.1528.65865
23MondKarzinMondSouth53.1328.4812751
24MondDezhgahMondWest52.4028.2118351

Appendix B

To calculate the SPI in a specific location, the precipitation data for a long-term period are fitted to a probability distribution and then converted into a normal distribution. Estimating the SPI involves describing the frequency distribution of precipitation, using a gamma probability density function (Equation (A1)):
P ( x ) = 1 β α Γ ( α ) x α 1 e x / β   w h e r e   x   > 0
where x is precipitation amount, α is a shape parameter, β is a scale parameter, and the gamma function is expressed as:
Γ ( α ) = 0 x α 1 e x d x
The maximum likelihood method is used to estimate the optimal values of α and β.
α ^ = 1 4 A ( 1 + 1 + 4 A 3   )
β ^ = x ¯ α ^
A = ln ( x ¯ ) ln ( x ) n
where n is the number of precipitation records and x is average precipitation amount. The cumulative probability for a given month then can be obtained from:
G = 0 x g ( x ) d x = 1 β ^ α ^ Γ ( α ^ ) 0 x x α ^ 1 e x / β ^ d x
Setting t = X β ^ , the incomplete gamma function can be obtained from:
G ( x ) = 1 Γ ( α ^ ) 0 x t α ^ ^ 1 e t   d t
It is possible to have several zero values in a sample set. In order to account for zero values, the cumulative probability function for gamma distribution is modified as:
H = q = ( 1 q ) G ( x )
where q and (1−q) denote the probability of zero and non-zero precipitation, respectively. The SPI is then derived from the cumulative probability:
for   0.5 < H < 1 :   SPI = + ( k c 0 + c 1 × k + c 2 × k 2 1 + d 1 × k + d 2 × k 2 + d 3 × k 3 )   ,       k = l n ( 1 ( 1 H 2 ) )
for   0 < H < 0.5 :   SPI = ( k c 0 + c 1 × k + c 2 × k 2 1 + d 1 × k + d 2 × k 2 + d 3 × k 3 )   ,       k = ln ( 1 ( H 2 ) )
where c0 = 2.515517, c1 = 0.802853, c2 = 0.010328, d1 = 1.432788, d2 = 0.189269, and d3 = 0.001308 [67].

References

  1. Sheffield, J.; Andreadis, K.M.; Wood, E.F.; Lettenmaier, D.P. Global and continental drought in the second half of the twentieth century: Severity–area–duration analysis and temporal variability of large-scale events. J. Clim. 2009, 22, 1962–1981. [Google Scholar] [CrossRef]
  2. Nafarzadegan, A.R.; Zadeh, M.R.; Kherad, M.; Ahani, H.; Gharehkhani, A.; Karampoor, M.A.; Kousari, M.R. Drought area monitoring during the past three decades in Fars province, Iran. Quat. Int. 2012, 250, 27–36. [Google Scholar] [CrossRef]
  3. Warren, A.; Khogali, M. Assessment of desertification and drought in the Sudano-Sahelian Region, 1985–1991. U. N. Sudano-Sahelian Off. 1991. [Google Scholar] [CrossRef]
  4. Moradi, H.R.; Rajabi, M.; Faragzadeh, M. Investigation of meteorological drought characteristics in Fars province, Iran. Catena 2011, 84, 35–46. [Google Scholar] [CrossRef]
  5. Joshi, K. The impact of drought on human capital in rural India. Environ. Dev. Econ. 2019, 24, 413–436. [Google Scholar] [CrossRef]
  6. Khatibi, S.A.; Golkarian, A.; Mosaedi, A.; Sojasi Qeidari, H. Assessment of Resilience to Drought of Rural Communities in Iran. J. Soc. Serv. Res. 2019, 45, 151–165. [Google Scholar] [CrossRef]
  7. Karami, E.; Keshavarz, M. Sociology of sustainable agriculture. Sociol. Org. Farming Clim. Chang. Soil Sci. 2010, 19–40. [Google Scholar] [CrossRef]
  8. Mishra, A.K.; Singh, V.P. A review of drought concepts. J. Hydrol. 2010, 391, 202–216. [Google Scholar] [CrossRef]
  9. Dai, A. Drought under global garming: A review. Wiley Interdiscip. Rev. Clim. Chang. 2011, 2, 45–65. [Google Scholar] [CrossRef] [Green Version]
  10. Hameed, M.; Ahmadalipour, A.; Moradkhani, H. Drought and food security in the Middle East: An analytical framework. Agric. For. Meteorol. 2020, 281, 107816. [Google Scholar] [CrossRef]
  11. Olukayode Oladipo, E. A comparative performance analysis of three meteorological drought indices. J. Climatol. 1985, 5, 655–664. [Google Scholar] [CrossRef]
  12. Mihajlovic, D. Monitoring the 2003–2004 meteorological drought over Pannonian part of Croatia. J. Climatol. 2006, 26, 2213–2225. [Google Scholar] [CrossRef]
  13. Xu, H.; Wang, X.; Zhao, C.; Yang, X. Diverse responses of vegetation growth to meteorological drought across climate zones and land biomes in northern China from 1981 to 2014. Agric. For. Meteorol. 2018, 262, 1–13. [Google Scholar] [CrossRef]
  14. Nabaei, S.; Sharafati, A.; Yaseen, Z.M.; Shahid, S. Copula based assessment of meteorological drought characteristics: Regional investigation of Iran. Agric. For. Meteorol. 2019, 276–277. [Google Scholar] [CrossRef]
  15. Nalbantis, I.; Tsakiris, G. Assessment of hydrological drought revisited. Water Resour. Manag. 2009, 23, 881–897. [Google Scholar] [CrossRef]
  16. Van Loon, A.F.; Laaha, G. Hydrological drought severity explained by climate and catchment characteristics. J. Hydrol. 2015, 526, 3–14. [Google Scholar] [CrossRef] [Green Version]
  17. Abdi, O.; Shirvani, Z.; Buchroithner, M.F. Forest drought-induced diversity of Hyrcanian individual-tree mortality affected by meteorological and hydrological droughts by analyzing moderate resolution imaging spectroradiometer products and spatial autoregressive models over northeast Iran. Agric. For. Meteorol. 2019, 275, 265–276. [Google Scholar] [CrossRef]
  18. Narasimhan, B.; Srinivasan, R. Development and evaluation of Soil Moisture Deficit Index (SMDI) and Evapotranspiration Deficit Index (ETDI) for agricultural drought monitoring. Agric. For. Meteorol. 2005, 133, 69–88. [Google Scholar] [CrossRef]
  19. Vergni, L.; Todisco, F. Spatio-temporal variability of precipitation, temperature and agricultural drought indices in Central Italy. Agric. For. Meteorol. 2011, 151, 301–313. [Google Scholar] [CrossRef]
  20. Huang, S.; Huang, Q.; Chang, J.; Leng, G.; Xing, L. The response of agricultural drought to meteorological drought and the influencing factors: A case study in the Wei River Basin, China. Agric. Water Manag. 2015, 159, 45–54. [Google Scholar] [CrossRef]
  21. Potopová, V.; Štepánek, P.; Možný, M.; Türkott, L.; Soukup, J. Performance of the standardised precipitation evapotranspiration index at various lags for agricultural drought risk assessment in the Czech Republic. Agric. For. Meteorol. 2015, 202, 26–38. [Google Scholar] [CrossRef]
  22. Mehran, A.; Mazdiyasni, O.; AghaKouchak, A. A hybrid framework for assessing socioeconomic drought: Linking climate variability, local resilience, and demand. J. Geophys. Res. Atmos. 2015, 120, 7520–7533. [Google Scholar] [CrossRef]
  23. Shi, H.; Chen, J.; Wang, K.; Niu, J. A new method and a new index for identifying socioeconomic drought events under climate change: A case study of the East River basin in China. Sci. Total Environ. 2018, 616–617, 363–375. [Google Scholar] [CrossRef] [Green Version]
  24. Tu, X.; Wu, H.; Singh, V.P.; Chen, X.; Lin, K.; Xie, Y. Multivariate design of socioeconomic drought and impact of water reservoirs. J. Hydrol. 2018, 566, 192–204. [Google Scholar] [CrossRef]
  25. Guo, Y.; Huang, S.; Huang, Q.; Wang, H.; Wang, L.; Fang, W. Copulas-based bivariate socioeconomic drought dynamic risk assessment in a changing environment. J. Hydrol. 2019, 575, 1052–1064. [Google Scholar] [CrossRef]
  26. Palmer, W.C. Meteorological drought. Research Paper No. 45. Washington, DC: US Department of Commerce. Weather Bur. 1965, 59. [Google Scholar] [CrossRef] [Green Version]
  27. Gibbs, W.J.; Maher, J.V. Rainfall Deciles as Drought Indicators; Bulletin No. 48; Bureau of Meteorology: Melbourne, Australia, 1967; 39p. [Google Scholar]
  28. McKee, T.B.; Doesken, N.J.; Kleist, J. The relationship of drought frequency and duration to time scales. In Proceedings of the 8th Conference on Applied Climatology, Anaheim, CA, USA, 17–22 January 1993; pp. 179–184. [Google Scholar]
  29. Torabi Haghighi, A.; Sadegh, M.; Behrooz-Koohenjani, S.; Hekmatzadeh, A.A.; Karimi, A.; Kløve, B. The mirage water concept and an index-based approach to quantify causes of hydrological changes in semi-arid regions. Hydrol. Sci. J. 2020, 65, 311–324. [Google Scholar] [CrossRef]
  30. Hayes, M.J.; Svoboda, M.D.; Wiihite, D.A.; Vanyarkho, O.V. Monitoring the 1996 drought using the standardized precipitation index. Bull. Am. Meteorol. Soc. 1999, 80, 429–438. [Google Scholar] [CrossRef] [Green Version]
  31. Rouault, M.; Richard, Y. Intensity and spatial extension of drought in South Africa at different time scales. Water SA 2003, 29, 489–500. [Google Scholar] [CrossRef] [Green Version]
  32. Irannezhad, M.; Torabi Haghighi, A.; Chen, D.; Kløve, B. Variability in dryness and wetness in central Finland and the role of teleconnection patterns. Theor. Appl. Climatol. 2015, 122, 471–486. [Google Scholar] [CrossRef]
  33. Chaito, T.; Khamkong, M.; Murnta, P. Appropriate transformation techniques to determine a modified standardized precipitation index for the ping river in Northern Thailand. EnvironmentAsia 2019, 12, 32–42. [Google Scholar]
  34. Yeh, H.F.; Chang, C.F. Using Standardized Groundwater Index and Standardized Precipitation Index to Assess Drought Characteristics of the Kaoping River Basin, Taiwan. Water Resour. 2019, 46, 670–678. [Google Scholar] [CrossRef]
  35. Jamro, S.; Dars, G.H.; Ansari, K.; Krakauer, N.Y. Spatio-temporal variability of drought in Pakistan using standardized precipitation evapotranspiration index. Appl. Sci. 2019, 9, 4588. [Google Scholar] [CrossRef] [Green Version]
  36. Diani, K.; Kacimi, I.; Zemzami, M.; Torabi Haghighi, A. Evaluation of meteorological drought using the Standardized Precipitation Index (SPI) in the High Ziz River basin, Morocco. Limnol. Rev. 2019, 19, 125–135. [Google Scholar] [CrossRef] [Green Version]
  37. Adib, A.; Tavancheh, F. Relationship Between Hydrologic and Metrological Droughts Using the Streamflow Drought Indices and Standardized Precipitation Indices in the Dez Watershed of Iran. Int. J. Civ. Eng. 2019, 17, 1171–1181. [Google Scholar] [CrossRef]
  38. Kang, L.; Jiang, S. Bivariate frequency analysis of hydrological drought using a nonstationary standardized streamflow index in the Yangtze River. J. Hydrol. Eng. 2018, 24. [Google Scholar] [CrossRef]
  39. Malik, A.; Kumar, A.; Singh, R.P. Application of Heuristic Approaches for Prediction of Hydrological Drought Using Multi-scalar Streamflow Drought Index. Water Resour. Manag. 2019, 33, 3985–4006. [Google Scholar] [CrossRef]
  40. Torabi Haghighi, A.; Darabi, H.; Shahedi, K.; Solaimani, K.; Kløve, B. A Scenario-Based Approach for Assessing the Hydrological Impacts of Land Use and Climate Change in the Marboreh Watershed, Iran. Environ. Model. Assess. 2019, 1–17. [Google Scholar] [CrossRef] [Green Version]
  41. Abou Zaki, N.; Torabi Haghighi, A.; Rossi, P.M.; J Tourian, M.; Kløve, B. Monitoring Groundwater Storage Depletion Using Gravity Recovery and Climate Experiment (GRACE) Data in Bakhtegan Catchment, Iran. Water 2019, 11, 1456. [Google Scholar] [CrossRef] [Green Version]
  42. Census; Statistical Center of Iran. 2016. Available online: https://www.amar.org.ir/english/Population-and-Housing-Censuses/Census-2016-General-Results (accessed on 20 August 2019).
  43. Pishkar, A.R. Fars Agriculture Census; Agricultural Organization of Fars. 2015. Available online: http://fajo.ir/site/images/article/amar/amarnameh94.pdf (accessed on 29 September 2019).
  44. Ahmadi, K.; Hoseinpour, R.E.; Gholizadeh, H.; Hatami, F.; Mohammadnia Afrouzi, S.; Abdshah, H. Evaluation of 36 years cultivation in Iran 1978–2013. Minist. Agric. Jahad 2015. Available online: https://www.maj.ir/dorsapax/userfiles/file/barasiSH.pdf (accessed on 29 September 2019).
  45. Torabi Haghighi, A.; Fazel, N.; Hekmatzadeh, A.A.; Klöve, B. Analysis of Effective Environmental Flow Release Strategies for Lake Urmia Restoration. Water Resour. Manag. 2018, 32, 3595–3609. [Google Scholar] [CrossRef] [Green Version]
  46. Yaraghi, N.; Ronkanen, A.; Darabi, H.; Kløve, B.; Torabi Haghighi, A. Impact of managed aquifer recharge structure on river flow regimes in arid and semi-arid climates. Sci. Total Environ. 2019, 675, 429–438. [Google Scholar] [CrossRef]
  47. Haghighi, A.T.; Keshtkaran, P. Methods of facing with drought in Fars province, Iran. In Proceedings of the 24th Conference of the Danubian Countries on Hydrological Forecasting and Hydrological Bases of Water Management, Bled, Slovenia, 2–4 June 2008. [Google Scholar]
  48. Gilbert, R.O. Statistical Methods for Environmental Pollution Monitoring; Van Nostrand Reinhold Company: New York, NY, USA, 1987. [Google Scholar] [CrossRef] [Green Version]
  49. Emberger, L. Sur une formule climatique et ses applications en botanique. La Meteorologie 1932, 92, 423–432. [Google Scholar]
  50. Caloiero, T.; Callegari, G.; Cantasano, N.; Coletta, V.; Pellicone, G.; Veltri, A. Bioclimatic analysis in a region of southern Italy (Calabria). Plant Biosyst. 2016, 150, 1282–1295. [Google Scholar] [CrossRef]
  51. Khatibi, R.; Soltani, S.; Khodagholi, M. Bioclimatic classification of Central Iran using multivariate statistical methods. Appl. Ecol. Environ. Res. 2016, 14, 191–231. [Google Scholar] [CrossRef]
  52. Yaghmaei, L.; Soltani, S.; Khodagholi, M. Bioclimatic classification of Isfahan province using multivariate statistical methods. J. R. Meteorol. Soc. 2009, 29, 1850–1861. [Google Scholar] [CrossRef]
  53. McKee, T.B.; Doesken, N.J.; Kleist, J. Drought monitoring with multiple time scales. In Proceedings of the 9th Conference on Applied Climatology, Dallas, TX, USA, 15–20 January 1995; pp. 233–236. [Google Scholar]
  54. Pirnia, A.; Darabi, H.; Choubin, B.; Omidvar, E.; Onyutha, C.; Haghighi, A.T. Contribution of climatic variability and human activities to stream flow changes in the Haraz River basin, northern Iran. J. Hydro-Environ. Res. 2019, 25, 12–24. [Google Scholar] [CrossRef]
  55. Baik, J.; Zohaib, M.; Kim, U.; Aadil, M.; Choi, M. Agricultural drought assessment based on multiple soil moisture products. J. Arid Environ. 2019, 167, 43–55. [Google Scholar] [CrossRef]
  56. Krueger, E.S.; Ochsner, T.E.; Quiring, S.M. Development and evaluation of soil moisture-based indices for agricultural drought monitoring. Agron. J. 2019, 111, 1392–1406. [Google Scholar] [CrossRef]
  57. Martínez-Fernández, J.; González-Zamora, A.; Sánchez, N.; Gumuzzio, A.; Herrero-Jiménez, C.M. Satellite soil moisture for agricultural drought monitoring: Assessment of the SMOS derived Soil Water Deficit Index. Remote Sens. Environ. 2016, 177, 277–286. [Google Scholar] [CrossRef]
  58. Hervás-Gámez, C.; Delgado-Ramos, F. Drought Management Planning Policy: From Europe to Spain. Sustainability 2019, 11, 1862. [Google Scholar] [CrossRef] [Green Version]
  59. Jeanne, P.; Farr, T.G.; Rutqvist, J.; Vasco, D.W. Role of agricultural activity on land subsidence in the San Joaquin Valley, California. J. Hydrol. 2019, 569, 462–469. [Google Scholar] [CrossRef] [Green Version]
  60. Maleki, S.; Koupaei, S.S.; Soffianian, A.; Saatchi, S.; Pourmanafi, S.; Rahdari, V. Human and climate effects on the Hamoun wetlands. Weather Clim. Soc. 2019, 11, 609–622. [Google Scholar] [CrossRef]
  61. Menon, V. Depression, suicidal ideation, and resilience among rural drought-affected farmers: Methodological issues. J. Neurosci. Rural Pract. 2019, 10, 176–177. [Google Scholar] [CrossRef]
  62. Viswanathan, D.; Veerakumar, A.; Kumarasamy, H. Depression, suicidal ideation, and resilience among rural farmers in a drought-affected area of Trichy District, Tamil Nadu. J. Neurosci. Rural Pract. 2019, 10, 238–244. [Google Scholar] [CrossRef] [Green Version]
  63. Carpena, F. How do droughts impact household food consumption and nutritional intake? A study of rural India. World Dev. 2019, 122, 349–369. [Google Scholar] [CrossRef]
  64. Abou Zaki, N.; Torabi Haghighi, A.; Rossi, P.; Xenarios, S.; Kløve, B. An Index-Based Approach to Assess the Water Availability for Irrigated Agriculture in Sub-Saharan Africa. Water 2018, 10, 896. [Google Scholar] [CrossRef] [Green Version]
  65. Fazel, N.; Torabi Haghighi, A.; Kløve, B. Analysis of land use and climate change impacts by comparing river flow records for headwaters and lowland reaches. Glob. Planet Chang. 2017, 158, 47–56. [Google Scholar] [CrossRef] [Green Version]
  66. Haghighi, A.T.; Kløve, B. Design of environmental flow regimes to maintain lakes and wetlands in regions with high seasonal irrigation demand. Ecol. Eng. 2017, 100, 120–129. [Google Scholar] [CrossRef] [Green Version]
  67. Lloyd-Hughes, B.; Saunders, M.A. A drought climatology for Europe. Int. J. Climatol. J. R. Meteorol. Soc. 2002, 22, 1571–1592. [Google Scholar] [CrossRef]
Figure 1. Maps showing (a) the location of the study area—Fars province in Iran; (b) its six regions with 38 meteorological stations; (c) major basins and rivers with 24 hydrological stations; and (d) topography and 12 groundwater measurement points. For more details of measurement points, see Appendix A.
Water 12 00838 g001
Figure 2. Emberger climatogram and percentage area covered by different climate types at 26 meteorological stations across Fars province (1976–2015).
Water 12 00838 g002
Figure 3. Climate variations in different periods in the six regions of Fars province, according to the Emberger climate classification. The y-axis shows percentages of occurrence of different climate types.
Water 12 00838 g003
Figure 4. (a) Spatio-temporal distribution of meteorological drought (standardized precipitation index, SPI) in the six regions of Fars province, (1977–2016). (b) Histogram of SPI classes and (c) annual variation in SPI in Fars and its regions. SPI classification: EW: extremely wet, SW: severely wet, MoW: moderately wet, MiW: mildly wet, No: normal conditions, MiD: Mildly dry, MoD: moderately dry, SD: severely dry, ED: extremely dry.
Water 12 00838 g004
Figure 5. Trend in flow in selected rivers across the study area (1977–2016). The Kor, Firouzabad, and Mond rivers had more than one selected station, so station names are added. Neg. and Pos. are negative and positive trends. Regions: W: western, NW: northwestern, C: central, S: southern, E: eastern, NE: northeastern. SL: significance level. Detailed information on all stations is available in Table A2 in Appendix A.
Water 12 00838 g005
Figure 6. Variation in streamflow drought index (SDI) at 24 gauging stations in the study area. The Kor, Firouzabad, and Mond rivers had more than one selected station, so station names are added. Regions: W: western, NW: northwestern, C: central, S: southern, E: eastern, NE: northeastern. Detailed information on all stations is available in Table A2 in Appendix A.
Water 12 00838 g006
Figure 7. Change in cultivated area and agricultural drought index in Fars province (1977–2016). Diagrams 1–3 show irrigated, rainfed, and total cultivated areas; diagrams (ac) show the change in area. OADI = overall agricultural drought index, ADI = agricultural drought index.
Water 12 00838 g007
Figure 8. Cumulative average groundwater level (C.A.GWL) fluctuations in 12 aquifers in different regions of Fars province, 1995–2016. Regions: W: western, NW: northwestern, C: central, S: southern, E: eastern, and NE: northeastern.
Water 12 00838 g008
Table 1. Standardized precipitation index (SPI) classification [29].
Range of SPIDescription of State
SPI ≥ 2.00Extremely wet (EW)
1.50 ≤ SPI < 1.99Severely wet (SW)
1.00 ≤ SPI < 1.50Moderately wet (MoW)
0.50 ≤ SPI < 0.99Mildly wet (Miw)
−0.5 ≤ SPI < 0.50Normal (No)
−0.99 ≤ SPI < −0.50Mildly dry (MiD)
−1.49 ≤ SPI < −1.00Moderately dry (MoD)
−1.99 ≤ SPI < −1.50Severely dry (SD)
SPI < −2.00Extremely dry (ED)
Table 2. Definition of states of hydrological drought with the streamflow drought index (SDI) [15].
CriterionDescription of State
SDI ≥ 0.0No Drought
−1.0 ≤ SDI < 0.0Mild Drought
−1.5 ≤ SDI < −1.0Moderate Drought
−2.0 ≤ SDI < −1.5Severe Drought
SDI < −2.0Extreme Drought

