Article

Evaluating Impacts of Irrigation and Drought on River, Groundwater and a Terminal Wetland in the Zayanderud Basin, Iran

1
Water, Energy and Environmental Engineering Research Unit, University of Oulu, 90570 Oulu, Finland
2
Institute of Geodesy, Universität Stuttgart, Keplerstraße 7, 70174 Stuttgart, Germany
3
Department of Civil, Chemical, Environmental and Material Engineering, University of Bologna, 40126 Bologna, Italy
*
Author to whom correspondence should be addressed.
Water 2020, 12(5), 1302; https://doi.org/10.3390/w12051302
Submission received: 12 April 2020 / Revised: 1 May 2020 / Accepted: 3 May 2020 / Published: 5 May 2020
(This article belongs to the Section Water Resources Management, Policy and Governance)

Abstract

:
The Zayanderud Basin is an important agricultural area in central Iran. In the Basin, irrigation consumes more than 90 percent of the water used, which threatens both the downstream historical city of Isfahan and the Gavkhuni Wetland reserve—the final recipient of the river water. To analyze impacts of land use changes and the occurrence of metrological and hydrological drought, we used groundwater data from 30 wells, the standardized precipitation index (SPI) and the streamflow drought index (SDI). Changes in the wetland were analyzed using normalized difference water index (NDWI) values and water mass depletion in the Basin was also assessed with gravity recovery and climate experiment (GRACE)-derived data. The results show that in 45 out of studied 50 years, the climate can be considered as normal in respect to mean precipitation amount, but hydrological droughts exist in more than half of the recorded years. The hydrological drought occurrence increased after the 1970s when large irrigation schemes were introduced. In recent decades, the flow rate reached zero in the downstream part of the Zayanderud River. NDWI values confirmed the severe drying of the Gavkhuni Wetland on several occasions, when compared to in situ data. The water mass depletion rate in the Basin is estimated to be 30 (±5) mm annually; groundwater exploitation has reached an average of 365 Mm3 annually, with a constant annual drop of 1 to 2.5 meters in the groundwater level annually. The results demonstrate the connection between groundwater and surface water resources management and highlight that groundwater depletion and the repeated occurrence of the Zayanderud River hydrological drought are directly related to human activities. The results can be used to assess sustainability of water management in the Basin.

1. Introduction

Arid and semi-arid climatic regions are important agricultural zones, as they host 41.3 percent of the world’s population [1]. Today, 14.7 percent of the farmed areas are irrigated in arid and semi-arid climatic zones, an important contributor in crop production [2]. As fully irrigated areas have two to three times higher crop yields than the rainfed areas, fully irrigated areas are increasing in dry regions [3]. The introduction of irrigation has increased agricultural drought occurrence since the mid-20th century [4] and stream flow depletion has led to wetlands loss [5]. Due to irrigation, the annual global groundwater depletion is estimated to be 283 (±40) km3 [6].
Recently, in some arid regions, actions have been taken to reduce the water consumption and depletion [7,8,9,10]. For example, the groundwater abstraction in the Jordan River Basin has been lowered to 150,000 m3 annually in attempts to reduce the annual depletion from 40 to 5 Mm3 [11]. The South African government is revitalizing the small-holders farms into large irrigation schemes in order to decrease the water depletion in the Olifants Basin [12]. Maintaining a central irrigation control system in the Lerma Chapala Basin, Mexico, has not only increased the water usage efficiency, but also increased the water volume of the Lake Chapala from 1330 Mm3 to 4250 Mm3 [13]. New regulation in the Yellow River Basin in China has been implemented to decrease the high pollution rate in the river due to industrial and agricultural residue [14]. Indian agricultural ministry is supporting less water demanding crops and rainfed agriculture in an attempt to face the water depletion in the Krishna and Bharani water Basins in the south [15,16]. Similar attempts are underway in other major basins in the arid and semi-arid zones, like in the Tunisian Mediterranean Basin and the Great Ruaha River Basin in Tanzania [17,18].
The objective of the present study is to assess consequences of agriculture in an arid river basin in Iran and to outline ways to improve future water management. The Zayanderud Basin in Iran has doubled its irrigated areas in the last fifty years which has led to the depletion of the river flow [19]. This affects the cultural heritage and image of the Isfahan city with its strong reliance on water and ancient bridges, etc. The loss of water also influences the main wetland in the region, the Gavkhuni Wetland and its biodiversity and function [19]. In this study, we aim to better document the case and analyze the effect of irrigation using remotely sensed data and in situ data to monitor the water loss and its consequences. The approach builds on change detection using multitemporal imagery, which has previously been applied to analyze changes in agricultural lands, forests, urban areas and water bodies [20]. We also use data from gravity recovery and climate experiment (GRACE) for water storage monitoring to assess temporal and spatial records [21,22,23,24,25,26,27,28,29]. In this study we use: (i) satellite images to estimate the surface area changes of the Gavkhuni Wetland and (ii) GRACE data to estimate the water mass fluctuation in the Basin. We analyze the drought frequency in the Basin from 1963 to 2012 to understand what the human factor of the drought occurrences is, and to discuss sustainable use scenarios for the Basin.

2. Materials and Methods

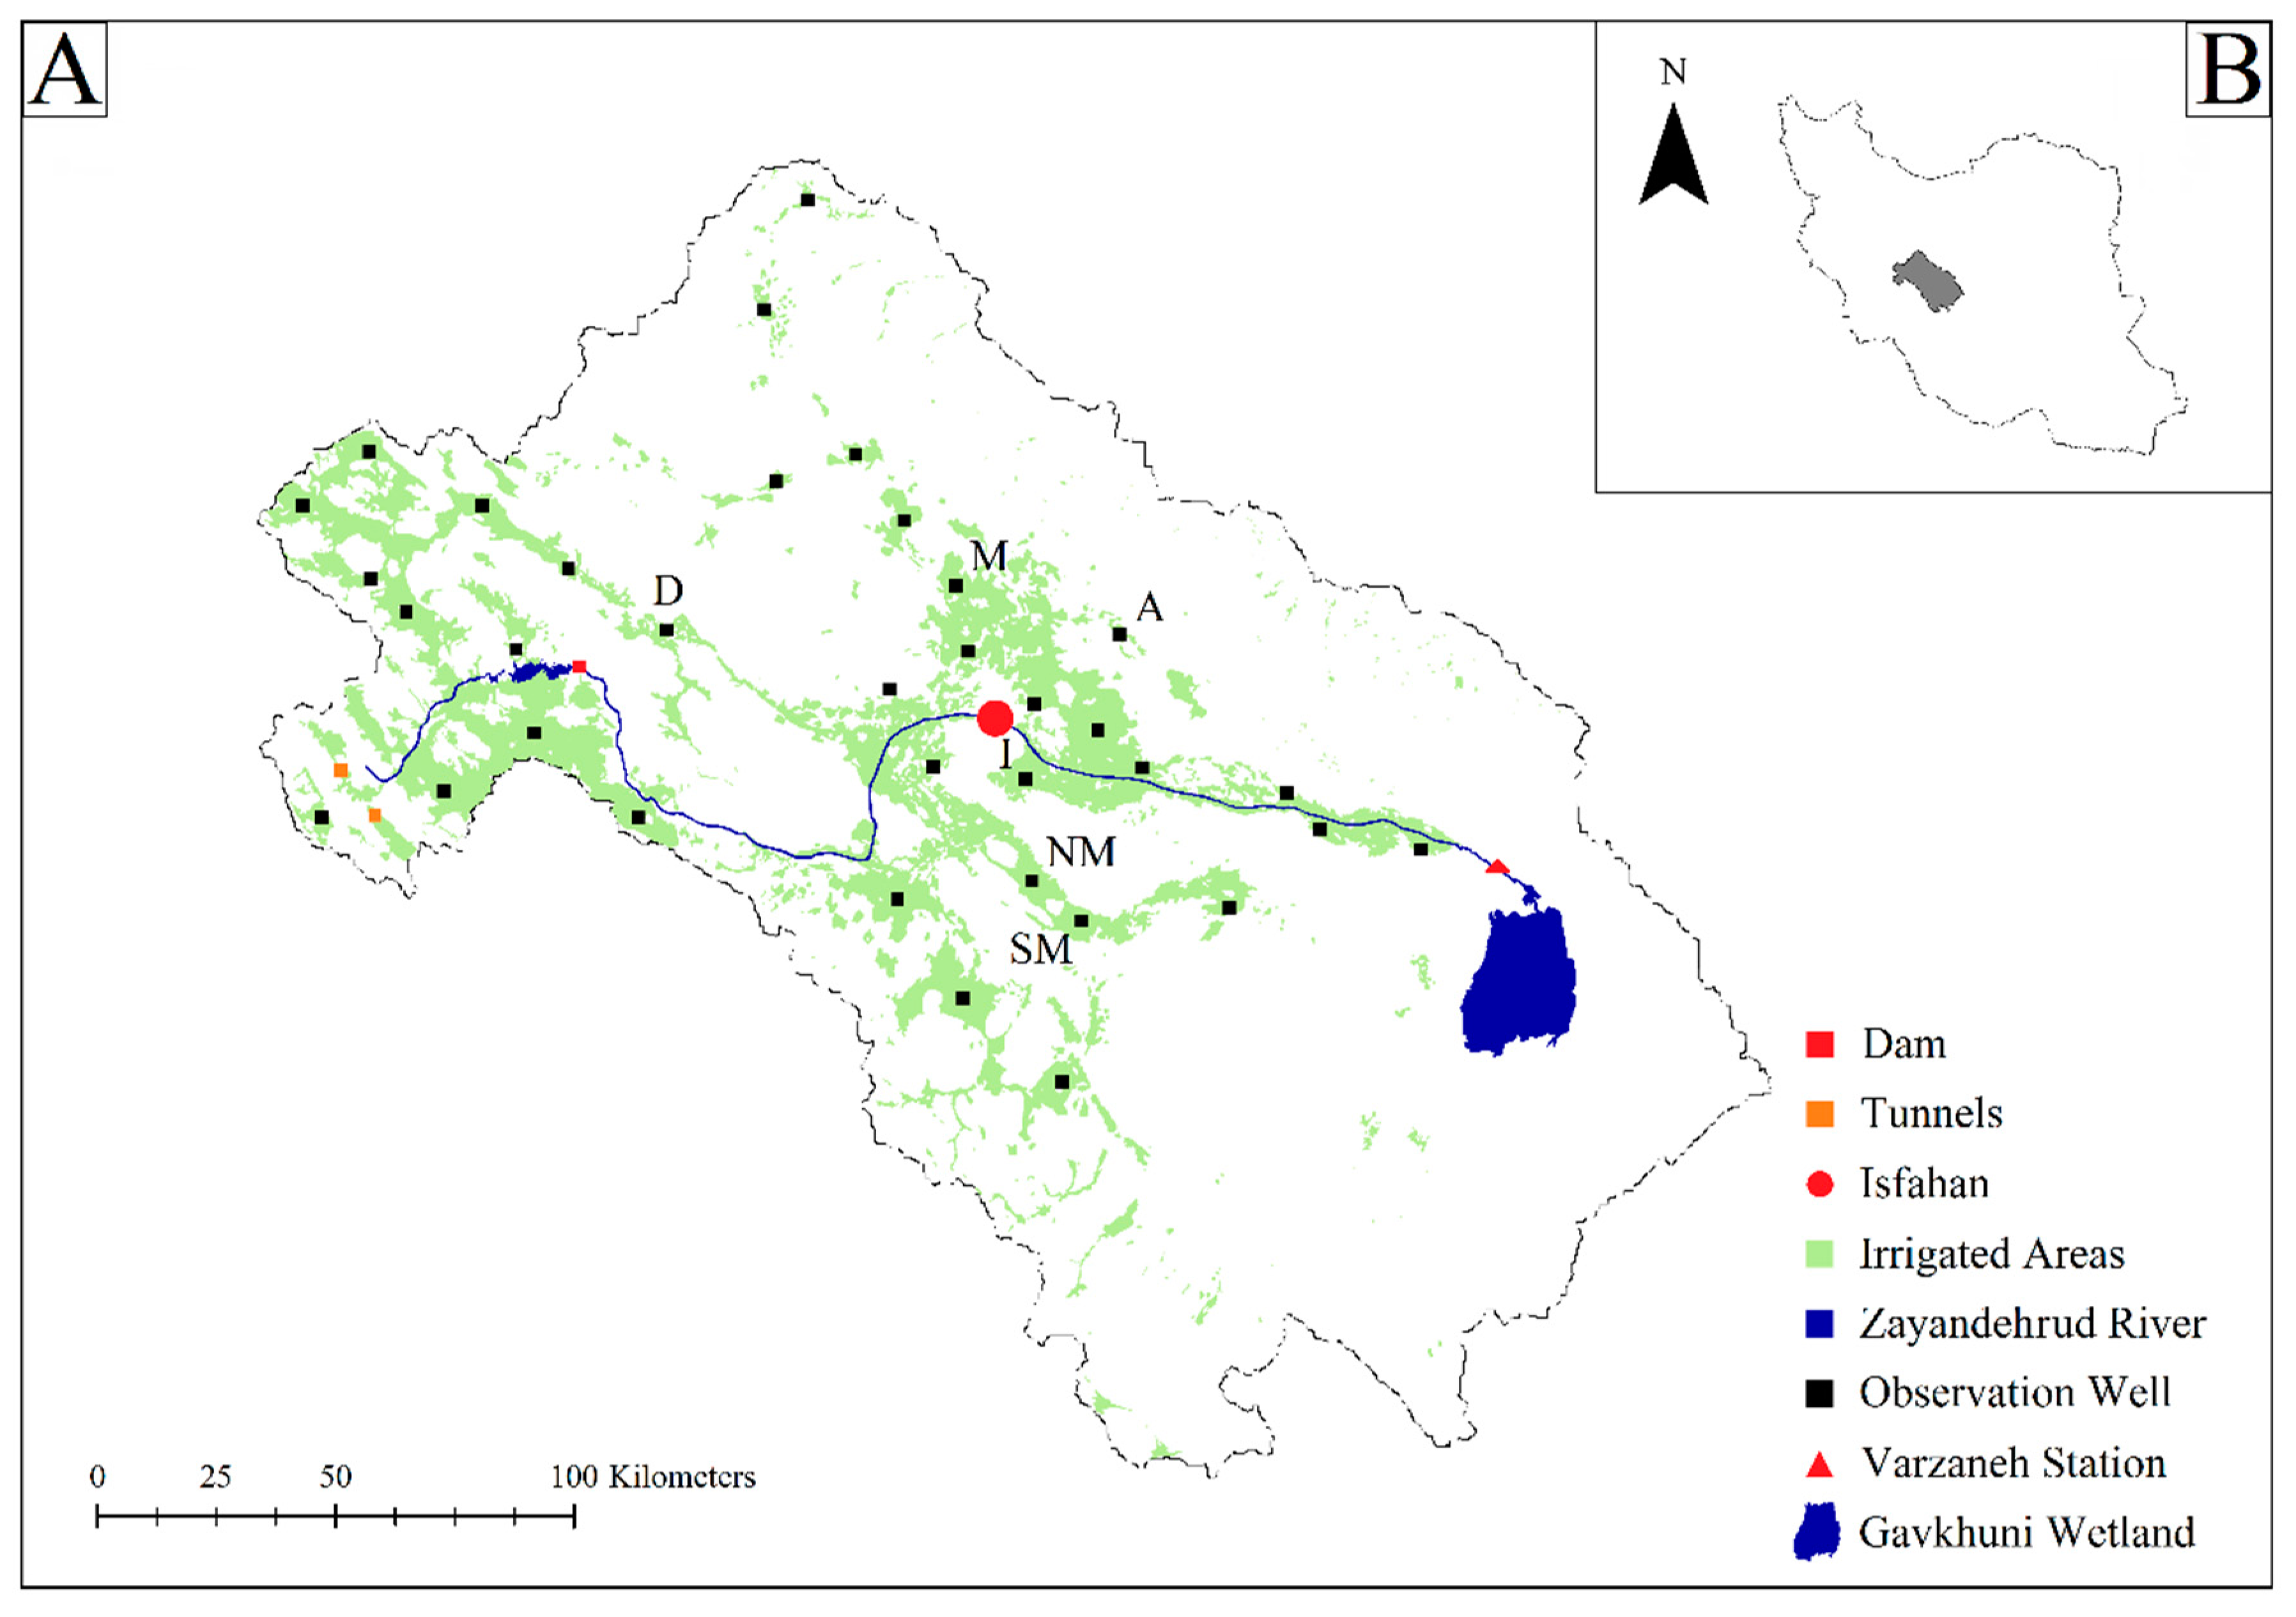
2.1. Study Area and Data

The Zayanderud River is the largest river in central Iran and forms one of the most important agricultural, industrial and urban zones of Iran [30]. The Zayanderud River originates from the Zagros Mountains and ends in the Gavkhuni Wetland (Figure 1). The Gavkhuni Wetland is one of the most important aquatic ecosystems in Iran; it is registered in the Ramsar convention of 1975. The Basin has an area of 41,524 km2 with elevation range of 1470 to 3974 meters above sea level with precipitation ranges from 50 to 1500 millimeters (mm), with an annual average of 130 mm [31]. The average temperature ranges between 3 and 30 degrees Celsius (°C). The annual potential evapotranspiration is 1500 mm [30].
The Zayanderud River length is 350 km; more than 4 million residents inhabit its basin. The existence of deep and fertile soils, consisting of silts and clay loams, has provided a basis for intensive agriculture along the river [32], making agriculture the largest single water user in the Basin. With low precipitation rate in central and eastern areas of the Basin, irrigation is essential for the crop cultivation, especially to compensate water shortage in drought times and uses 90 percent of the total consumed water [33]. About 260,000 hectares (ha) are farmed in the Basin, mostly for cultivating wheat, barley, silage plants, potatoes and cotton [34]. Until 1952 water resources development in the Basin was confined to small diversion structures that provided irrigation water for irrigation systems. Irrigation water is derived from springs, underground canals (qanats) and snowmelt, with minimal number of full irrigation systems [35]. The major hydraulic structure, the Zayanderud Dam, was constructed in 1972 with a capacity of 1500 Mm3 [36]. Three transbasin diversion tunnels were constructed in 1985, 2004 and 2007. These transbasin diversion tunnels transferred 152 Mm3 annually to cities in Zayanderud facing water stress [30].
The study includes in situ data collected from the Basin and data derived from satellite image processing and modeling. The precipitation, evapotranspiration and temperature daily data for a period of 50 years from January 1963 to December 2012 are from the Iranian Meteorological Organization [37]. The groundwater monthly levels of 35 observation wells (Figure 1) were used for the period from January 1981 to December 2015, which were provided by Iranian Water Resources Management Company [38]. The Zayanderud River daily flow discharge is obtained from the gauge station at Varzaneh, for the period from January 1963 to December 2012. Varzaneh station is where the Zayanderud River flows into the Gavkhuni Wetland, giving the accurate monthly inflow volume to the wetland. Monthly GRACE datasets for total water mass storage variations from the period of April 2002 to December 2015 were processed to examine the total water mass variation in the Zayanderud Basin. The data consist of monthly snapshots, which when analyzed reveal monthly anomalies in total water storage. The GRACE data were provided by the German Research Center for Geosciences (GFZ).
Analysis of data over a long-time interval is important for several reasons. The 50 years precipitation and stream flow data (1963–2012), helps in monitoring the meteorological and hydrological droughts on a longer scale. In addition, it monitors any occurrence frequency change of the meteorological and hydrological drought in the 1980 s, the period when the irrigated areas widely expanded. The surface and groundwater data availability from 1985 until 2015, helps monitor the relationship between irrigated areas expansion and depletion of water resources. The GRACE data availability from 2002 till 2015 is limited to the monthly snapshot availability.

2.2. Monitoring the Meteorological and Hydrological Drought in the Zayanderud Basin

The standardized precipitation index (SPI) is widely used for defining and monitoring meteorological droughts [39,40,41]. The positive SPI values reflect wet conditions, while the negative values indicate meteorological drought. The detailed state definition is given in Table 1 as suggested by Mckee [42]. The gamma distribution of the monthly precipitation time series is calculated as suggested by Lloyd and Saunders [43]:
SPI = ( t   c 0 +   c 1 t +   c 2 t 2 1 +   d 1 t +   d 2 t 2 +   d 3 t 3 )     for   0 < H ( x ) 0.5
SPI   = + ( t   c 0 +   c 1 t +   c 2 t 2 1 +   d 1 t +   d 2 t 2 +   d 3 t 3 )     for   0.5 < H ( x ) < 1
where c0 = 2.515517, c1 = 0.802853, c2 = 0.010328, d1 = 1.432788, d2 = 0.189269 and d3 = 0.001308. H(x) is the cumulative probability function for gamma distribution, and t is average precipitation per the scale parameter. The SPI calculation is performed using the SPI Generator application provided by the National Drought Mitigation Center (University of Nebraska, Lincoln, NE, USA) [44]
The hydrological drought index (SDI) uses standardized annual streamflow volumes to define values lower than the mean streamflow by at least one standard deviation value. Based on SDI values, the state of hydrological droughts is defined, which is close to that of SPI (Table 2). Nalbantis and Tsakiris [45] suggested that the SDI can be calculated using the following:
SDI ( i ) = F i F ¯ S σ
Where Fi is the annual stream flow for a given period (i), F ¯ and S σ are the mean and the standard deviation of the cumulative streamflow for the whole study period.

2.3. Monitoring Water Mass Depletion in the Zayanderud Basin

GRACE provides monthly terrestrial water storage anomalies, from observing Earth’s time dependent gravity field. The data represent monthly anomalies in total water storage, stored in the terrestrial environment either as soil moisture, groundwater, snow or surface water. Monthly snapshots from April 2002 to December 2015 were used to examine the total water mass variation in the Zayanderud Basin. The GRACE water mass change is often represented in the form of equivalent water height in mm. In order to identify water storage changes from the spherical harmonic coefficients provided by (GFZ), technical suggestions of Cheng, Sweson, Wahr and Tourian were followed [46,47,48,49,50,51]. These technical notes suggest methods to remove the errors and calibrate the data, image destriping filters were used in order to reach the total water mass variation volume in the Basin.

2.4. Using Normalized Difference Water Index (NDWI) to Monitor the Gavkhuni Wetland Water Mass Fluctuation

Monthly Landsat surface reflectance images for the Gavkhuni Wetland were downloaded for the period from January 1985 to December 2015. Most of selected images were cloud-free or nearly cloud-free, meaning the cloud cover is less than 10 percent of the snapshot area. The snapshots had been georeferenced with the topographic maps. In the electromagnetic spectrum, water absorbs almost all of incident radiation in the near and mid-infrared bands, while shows a strong reflectance in visible bands. Based on the spectral analysis, NDWI is used to extract the water body by [52]. It is a band ratio index between the green and near infrared (NIR) spectral bands, which would not only enhance water features, but also depress vegetation, bare lands and other environmental information [53]. NDWI is defined as:
NDWI = R Green   R Nir R Green +   R Nir
Where RGreen is the top of atmospheric reflectance of the green band and RNir represents that of the near-infrared band, which corresponds to band 2 and band 4, respectively, in Landsat surface reflectance. The NDWI value ranges from −1 to 1. McFeeters [52] set zero as the threshold, where the cover type is water if NDWI > 0 and it is non-water if NDWI ≤ 0. In order to indicate the best NDWI value reflecting the Gavkhuni Wetland surface area, 365 are defined with values 0.1, 0.2, 0.3, 0.4, 0.5, 0.6, 0.7, 0.8 and 0.9, respectively, for the positive NDWI values. The higher NDWI value, the higher the reflection rate is, indicating higher aquatic bodies’ probability. For different sub-threshold values, the corresponding wetland area was obtained by image processing using a MATLAB code. The wetland volume monthly variation is calculated for each sub-threshold from the water balance equation:
ΔV = Vi − Vi−1 = Ai(Pi − Ei) + QiΔt
Where Ai is surface area equivalent to ( A n +   A n 1 2 ) where n is any given month and is expressed in km2. Pi, Ei and QiΔt are the monthly precipitation, evapotranspiration and inflow volume, respectively. Both Pi and Ei are in mm, Ai(Pi – Ei) in m3 and QiΔt is in m3 per month. Using Equation (5) with every sub-threshold, nine different values of ΔV are calculated for each value of Ai.
The monthly variation of the wetland water level can be expressed as:
Δ H = Δ V A i
Again, using Equation (5) with every sub-threshold, nine different values of ΔV are calculated for each value of Ai. ΔH and can also be expressed as:
Δ H = ( P i E i ) + Q i Δ t A i
having the values of ΔH, Pi, Ei and Ai calculated, the value of Q i Δ t A i in Equation (5) can be expressed in mm for the nine different values of Ai. Having the real time value of QiΔt measured from the gauge station, it is compared with the nine different QiΔt values calculated. This can be done by using the coefficient of determination as follows:
R 2 = { n ( Q i Δ t obs × Q i Δ t mod ) ( Q i Δ t obs ) ( y ) [ n ( Q i Δ t ) obs 2 ( Q i Δ t obs ) 2 ] [ n ( Q i Δ t ) mod 2 ( Q i Δ t mod ) 2 ]   } 2
where n is the number of observations, QiΔt obs is the real time monthly flow volume and QiΔt mod is the flow volume calculated from Equation (4). The coefficient of determination R2 ranges from 0 to 1, with 0 meaning that the calculated QiΔt is totally independent from the measured QiΔt and 1 meaning both values are related without errors. The sub-thresholds with the highest value here means that its area best fits the flow data available. This sub-threshold area is thus considered the most identical area to the real time wetland surface area. From the obtained data, an area (Ai) versus volume (ΔV) relation can be obtained. This mathematical relation will help fill in the missed wetland area data. Data availability was restricted by climatic reasons, such as clouds and fogs and the blurriness of images downloaded.

3. Results

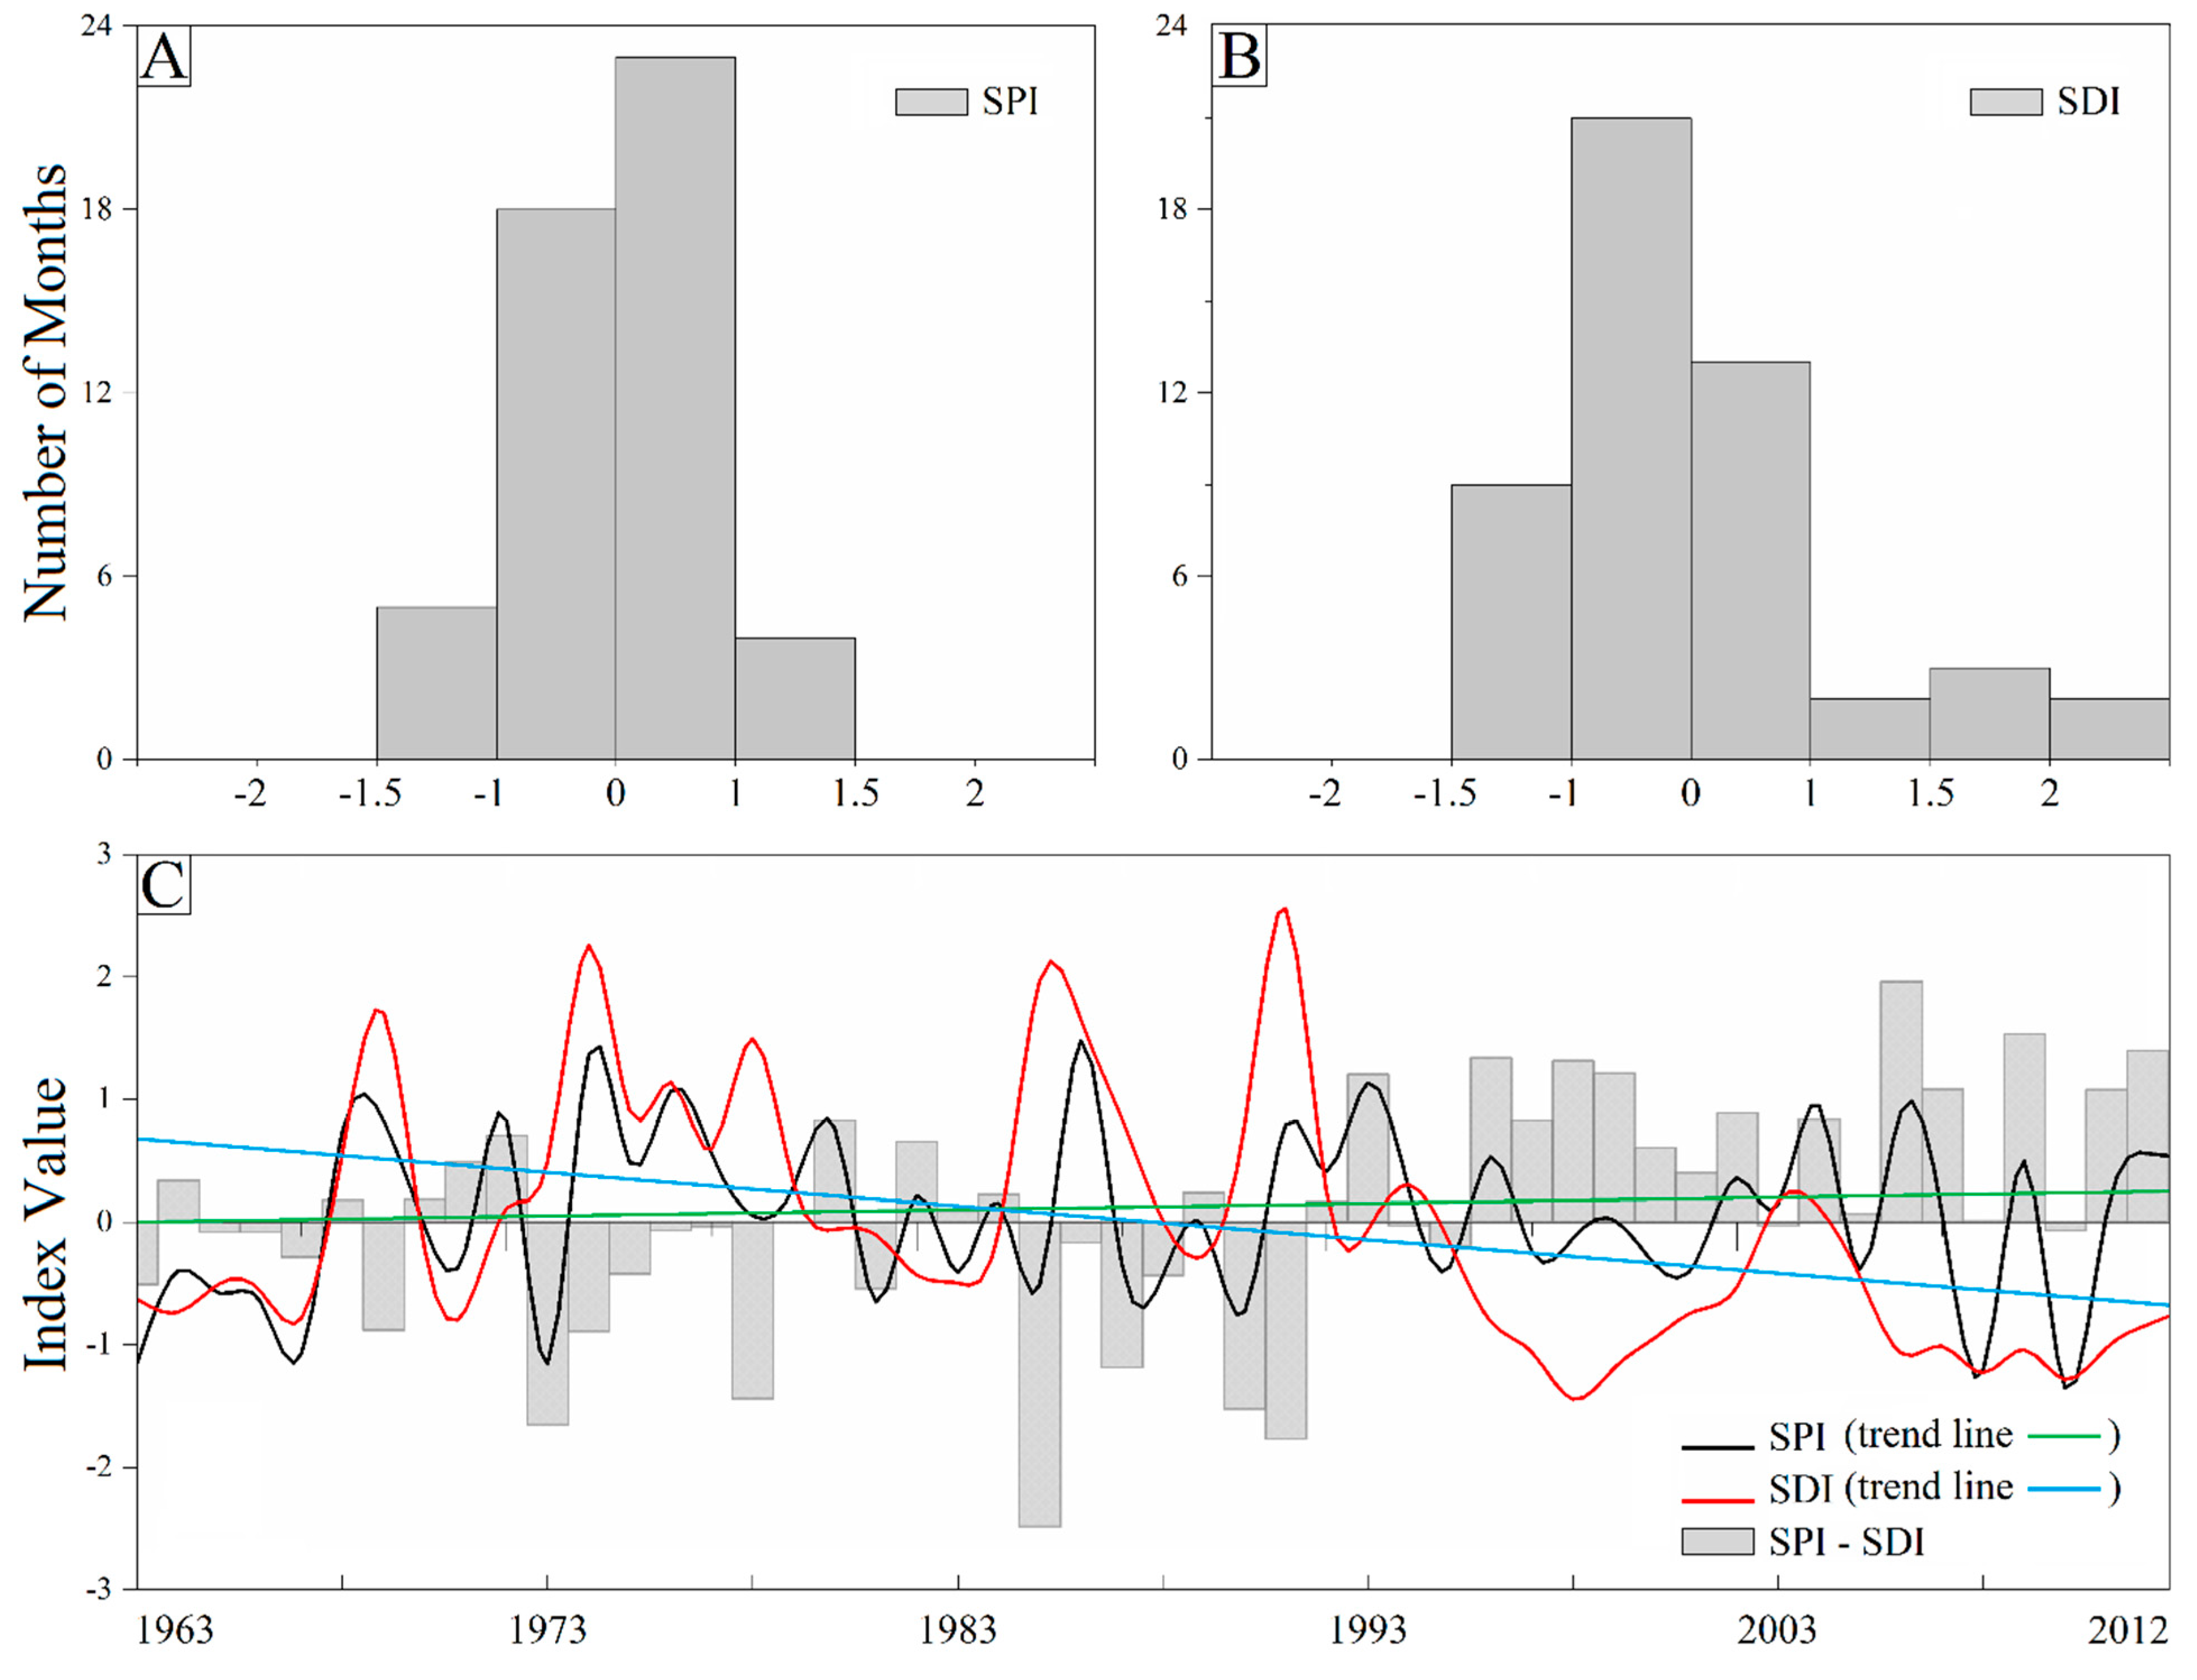
3.1. Meteorological and Hydrological Drought Occurrence Frequencies in the Zayanderud Basin

The occurrence of meteorological droughts is rare in the Zayanderud Basin and less frequent than the stream flow droughts. The SPI calculations show that in more than half of the years, 54 percent of the occurrence, the climate conditions are considered wet, with SPI higher than 0 (Figure 2A). The “normal dry” years, with SPI value between −1 and 0, occur in 36 percent of the years between 1963 and 2012. Normally dry years are not considered drought years. Moderately drought years with SPI value between −1.5 and −1 occur in only 10 percent of the years. None of the years in the study period was recorded to be “severely or extremely” dry. For the period of 50 years, SPI values showed a statistically insignificant positive trend, meaning that the wet and dry years are statistically distributed throughout the study period. On the other hand, due to irrigation and reduced river flow, hydrological drought was recorded in 60% of the year in the Zayanderud River flow, SDI value less than 0.
The intensity and frequency of the hydrological drought increased in the 1980s. For the periods between 1980 and 2012, the occurrence of the hydrological drought was recorded in 75 percent of the years, compared to 35 percent before the years 1980 (Figure 2B). Overall, over the 50 years, the SDI values showed a negative trend, with a constant decrease in the Zayanderud River flow volume. This is directly corelated to the overexploitation of the surface water resources, as irrigated areas increased from 25,000 to 40,000 hectares [19]. Statistically, the hydrological droughts before the 1980s were directly related to the precipitation volume, (Figure 2C), as their occurrence was restricted to the years that are considered dry. Figure 2C, shows clearly that the (SPI–SDI) value has a constant positive value in the 1990s and 2000s. The positive value of the (SPI–SDI) value indicates the occurrence of hydrological droughts in years that are considered to be either wet or normally dry. Examples on these can be seen for year 1993, which is one of the most wet years in the study period, witnessed a mild hydrological drought. In addition, while the years 1998 and 1999 are the years with the most severe hydrological drought during the study period, they were normally wet and dry years on the SPI scale.

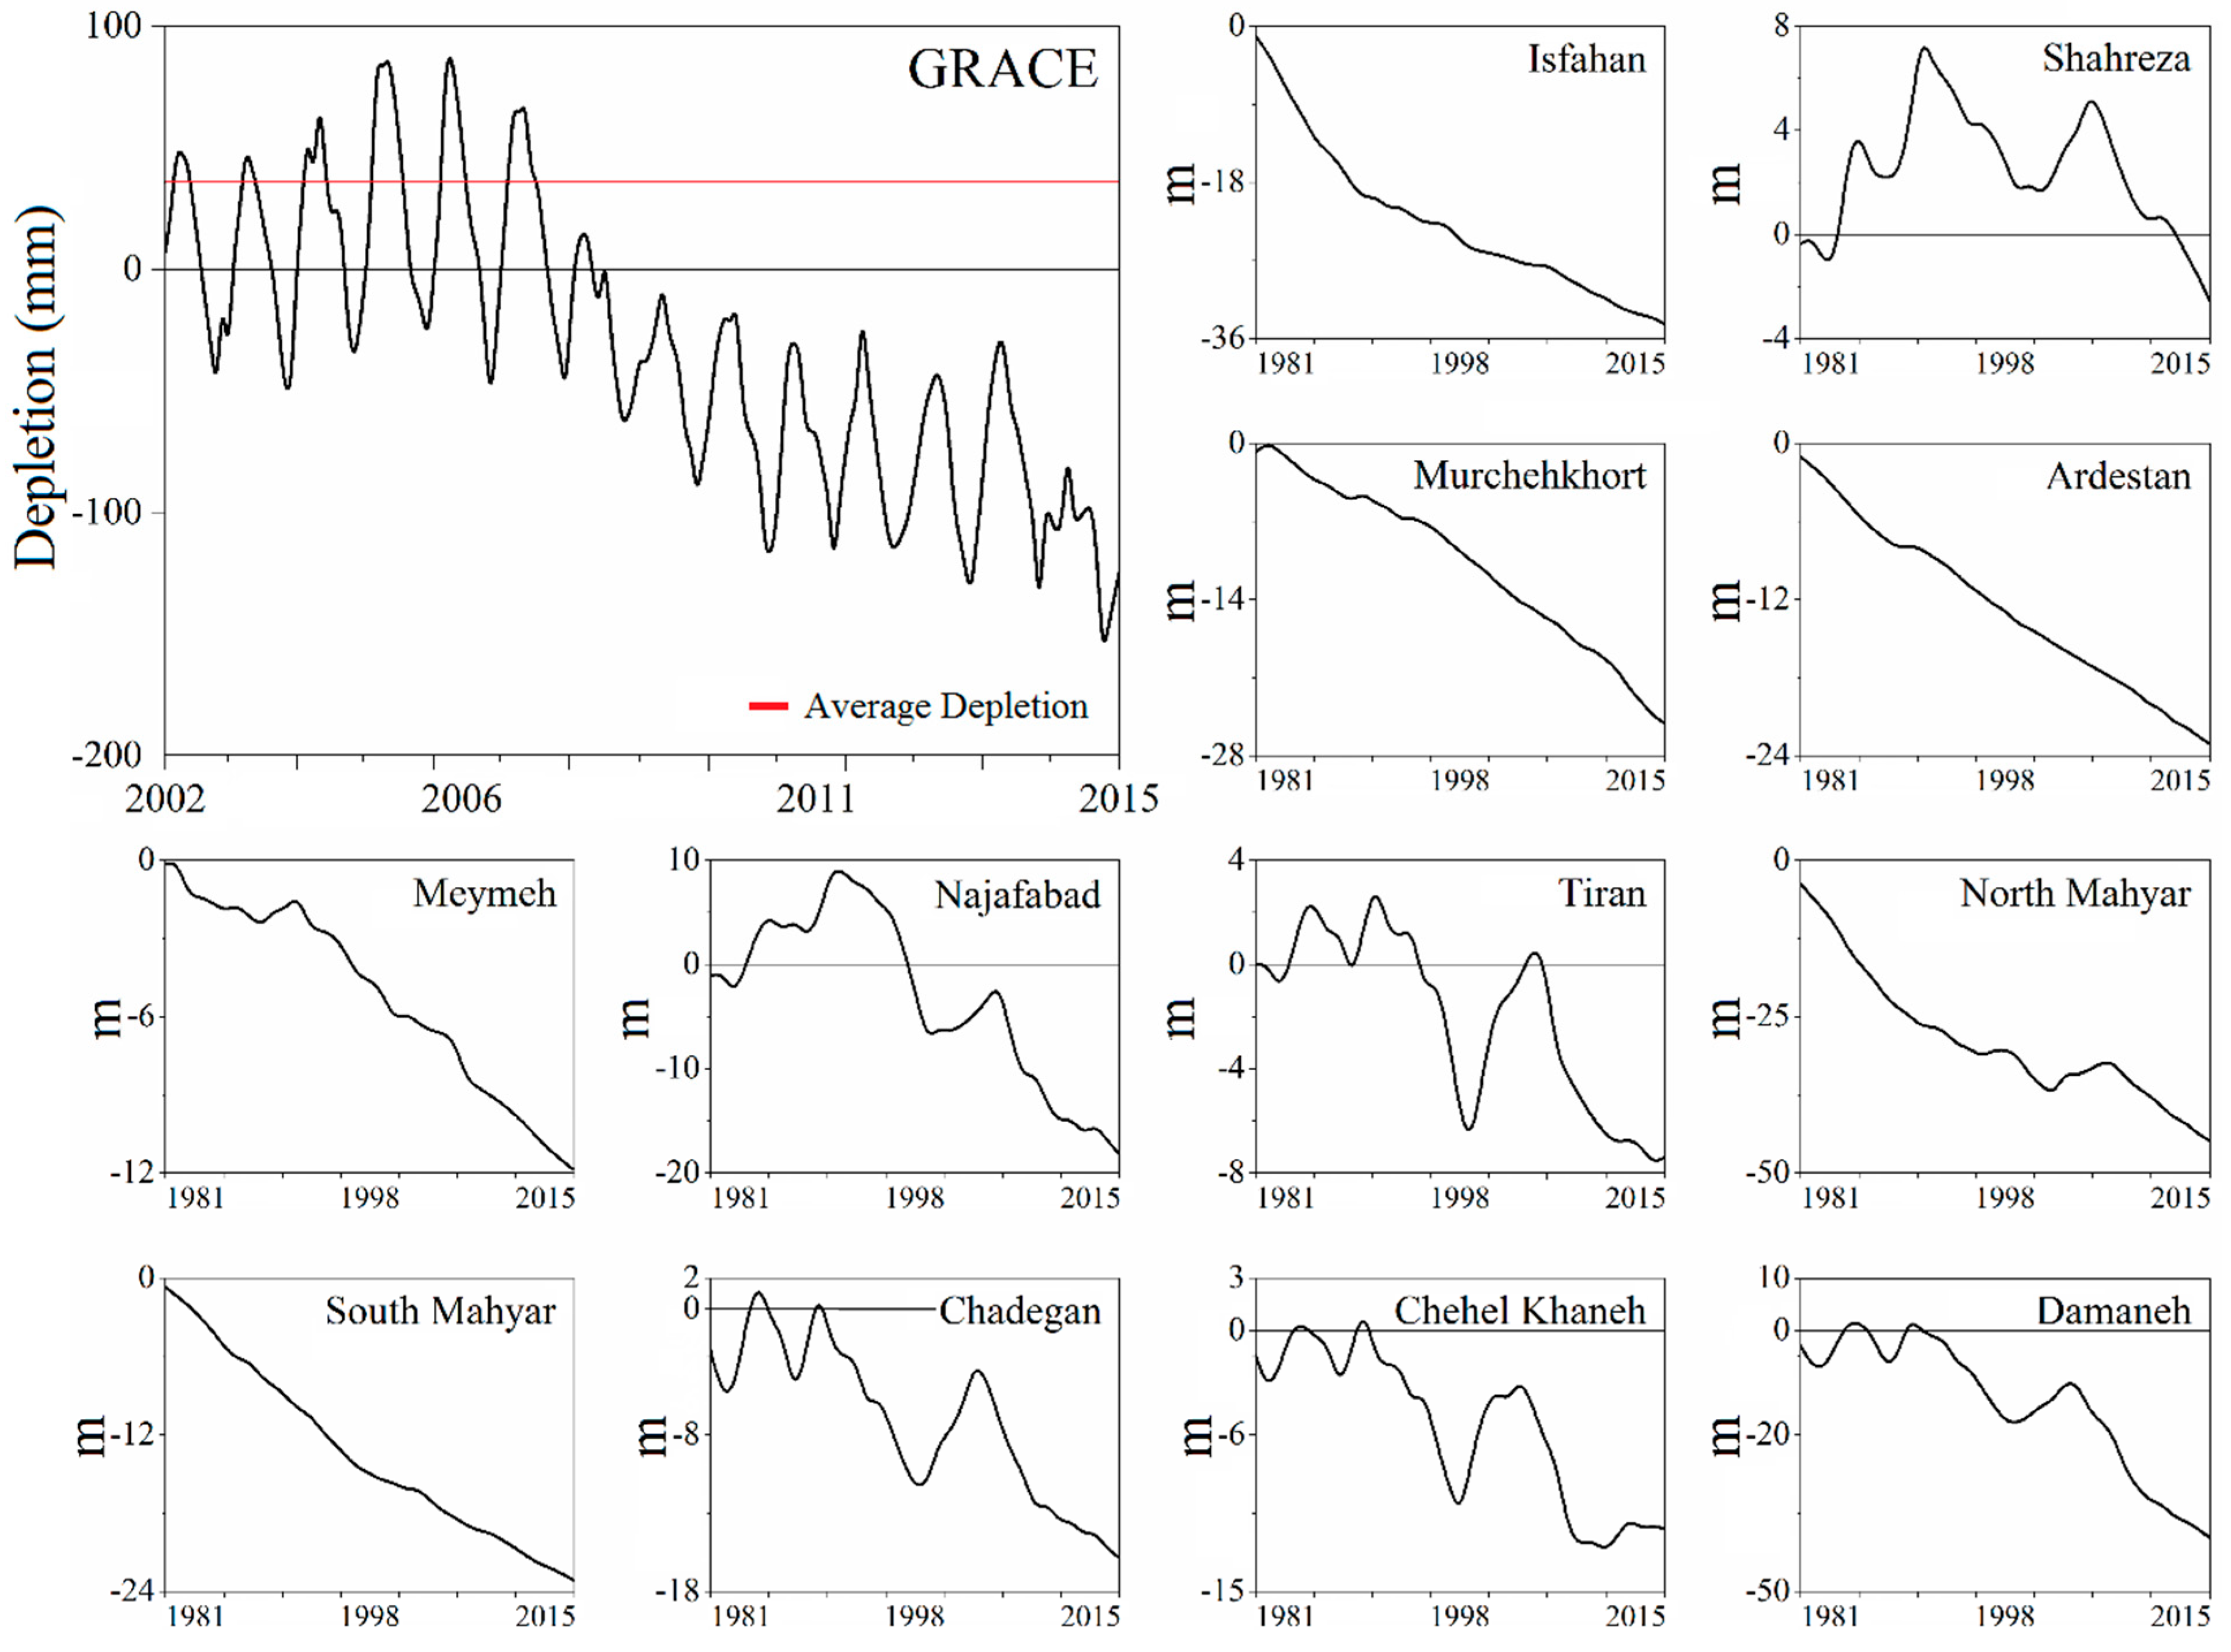
3.2. Water Mass and Groundwater Depletion in the Zayanderud Basin

The GRACE derived data shows that for the period between 2002 and 2015, the annual water mass depletion height in the Zayanderud Basin is 32.6 mm (Figure 3). The average water mass depletion volume in this period is 1350 Mm3 annually. This includes surface and groundwater exploitation volume and evapotranspiration rate. It is observed that the water mass volume is at a constant depletion after the year 2007 even that those years are considered to be normally wet years based on precipitation volume.
Figure 3 also shows the groundwater level depletion in 12 major aquifers for the period between 1981 and 2015, the in situ data shows that the average annual groundwater depletion volume is 365 Mm3, of which 90 percent is for irrigation, and the average decrease in the groundwater table is 0.6 meters annually, contributing in total water mass depletion in the Basin. This indicates that the groundwater exploitation is unsustainable. The most sever groundwater level depletion is recorded in North and South Mahyar, Damaneh, Isfahan, Murchehkhort and Ardestan (Figure 1). All these areas are considered major agricultural zones, where groundwater is the main water sources for irrigation [38]. On average each irrigated hectare needs 5200 m3 of water annually [38]. Even with some recharge rate in the years 1986, 1993 and 2004, as these years are considered the most wet years, all aquifers witnessed constant decrease in the groundwater table level. The major depletion period occurs in the 1990s and 2000s and is aligned with hydrological drought recorded in the area for the same period (Figure 2). It is also noticed that in the years that are considered dry and moderately dry, the groundwater exploitation increases to match the evapotranspiration rate.

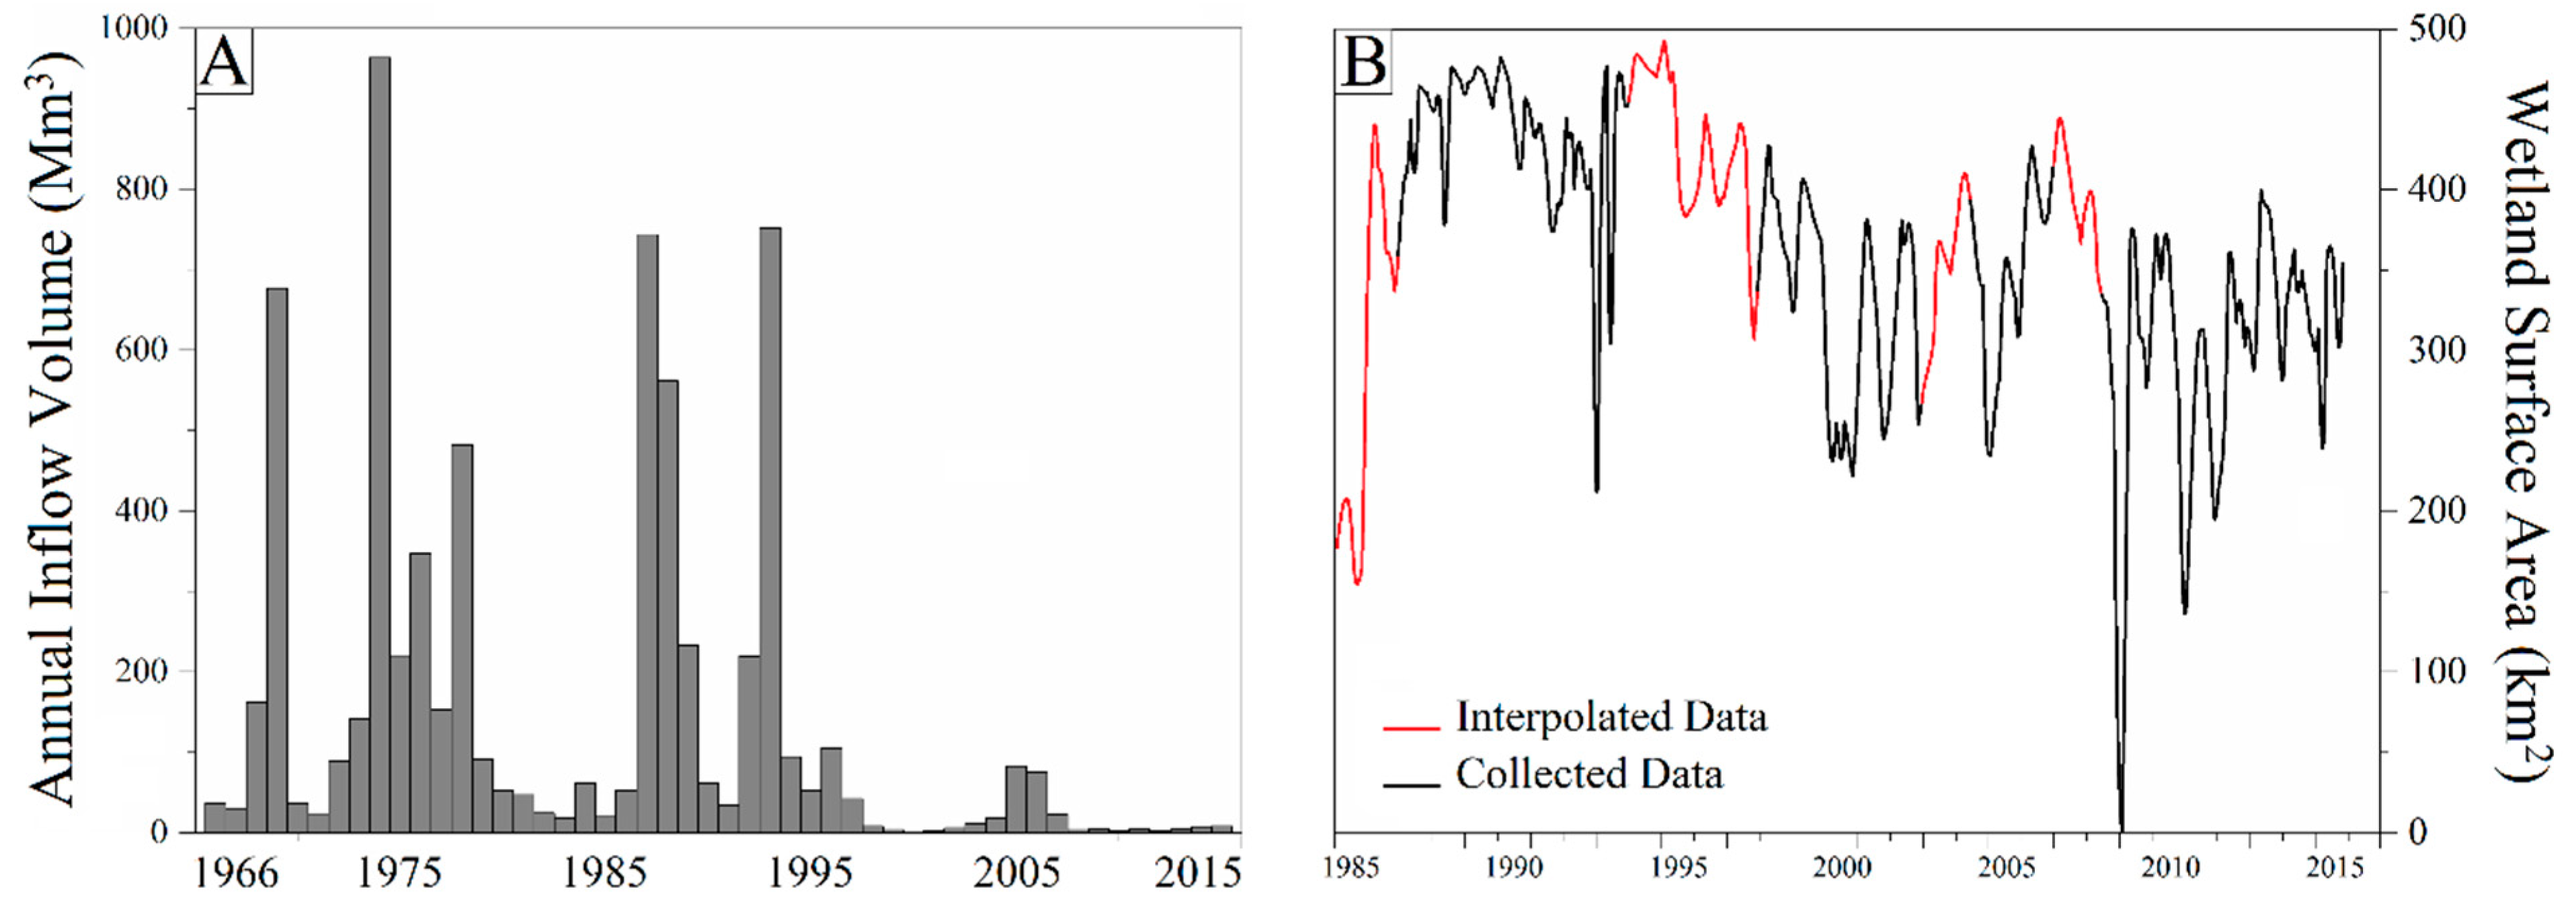
3.3. Gavkhuni Wetland Water Mass Fluctuation

The results show that the Gavkhuni Wetland water surface area is directly related to the inflow rate from the Zayanderud River. The river inflow rate is usually affected by the precipitation rate in winter and the snowmelt in spring. With the increase in the Zayanderud River water exploitation, the flow decreased alarmingly. By comparing the in situ flow volume changes and the area retrieved from the NDWI calculations, results show that threshold (0.5) derived surface area had the highest coefficient of determination (0.75) with the real time in situ flow data. This indicates that the threshold (0.5) derived area data are congruent in 75 percent of the times with the real wetland area.
During the study period from 1985 to 2015, the area of the Gavkhuni Wetland fluctuated significantly. Using the water balance equation (Equation (5)), the missing surface area data of the Gavkhuni Wetland is interpolated (Figure 4B). The missing surface area here indicates images that could not be obtained, due to blurring or unavailability. This result shows that the NDWI derived data along with the inflow volume data can identify the surface water bodies’ area change. Results show that in the study period, 1985 till 2015, the wetland area changed rapidly and can be related to variation in the amount of precipitation. The highest wetland area, of average 480 km2, was recorded in the years 1993 and 1994. This is related to the high precipitation in year 1993 (145 mm) (Figure 5). In the years 1988 and 1989 the wetland area was also high with an average area of 350 km2, as the precipitation in this year was 218 mm. The wetland recorded its lowest area during the study period of an area of 30 km2 in late 2008 (Figure 5). The precipitation rate in 2008 was the lowest recorded, with 24 mm of precipitation. In the Gavkhuni case, the precipitation rate change is not the only indicator for area change. Confirming this, (Figure 4A) shows the flow volume in million cubic meters into the Gavkhuni Wetland annually. Even with SPI confirming that 90 percent of the years in the period between 1963 and 2012 are wet, results show a depletion in the inflow rate. The average inflow is reduced from 226 Mm3 in the 1960s to 5 Mm3 in 2010. The major volume depletion happened in the 1980s and afterwards, as the average depletion volume reached 100 Mm3 each decade.

4. Discussion

Since the introduction of irrigation in the 1970s and 1980s, the river discharge and groundwater levels in Zayanderud Basin has decreased considerably. From the water source of Zargos Mountains, the flow decreased into the Zayanderud River, and on many occasions, the flow does not reach the downstream Gavkhuni Wetland. As the inflow reached zero, the Gavkhuni Wetland dried severely, and a minimum area was recorded in the winter of 2008/2009. The average water mass depletion derived from GRACE, in the river Basin is estimated 1350 Mm3 annually. The demand, which is largely generated by the expansion of the irrigation schemes, always exceeded the supply despite the water brought by reservoir and inter-basins transfer. An inter-basin transfer of 590 Mm3 of water is currently diverted from the Kuhrang River to the Zayanderud Basin [54]. The completion of the Behesht-Abad tunnel will bring additional 700 Mm3 downstream from the Chadgen Dam [55]. However, so far, the increase in the water availability has also increased the water demand, resulting in increased drying of the river and the wetland, e.g., increasing the irrigation efficiency, will lead to increase the irrigation in other parts of the Basin.
Large irrigation systems were constructed in the Zayanderud Basin in the 1970s and 1990s and were designed to cover an area of 200,000 hectares [54]. The irrigated areas in Zayanderud Basin are currently estimated to be 41,500 hectares, as lack of water resources limited the irrigation expansion. This expansion in the irrigated areas had a direct impact in increasing the hydrological drought intensity values. The hydrological drought occurrence increased 40 percent after the year 1980. Negative (SPI–SDI) values which indicate a stream flow higher than the precipitation volume, increased 40 percent in the 1970s and 20 percent in the 1980s. The hydrological drought occurred in 60 percent of the study years, and its intensity increased to 72 percent after the year 1980. Hydrological droughts have both environmental and ecological impacts.
The expansion in the agricultural areas has increased the stress significantly on groundwater, as irrigated schemes developed focused on groundwater extraction rather than formerly used underground canals (qanats). The groundwater exploitation increased as the well permits are granted by central administration, with limited knowledge of local hydrology. Data from the past 40 years have shown that the groundwater levels are dropping in all areas, and in some areas, they are dropping dramatically. The most severe groundwater depletion was recorded in Najafabad, because of large conversion of undeveloped lands which increased the groundwater depletion to 2.5 meters annually. In Isfahan, North Mayhar and Damaneh, the annual depletion is recorded to be between 1 and 1.5 meters. Annually in situ data shows that 365 Mm3 of groundwater resources are pumped to provide water for irrigation. This shows that the aquifers have a crucial role in compensating the deficiency of the surface water. The groundwater role can be maintained if the aquifers are replenished annually with renewable water resources. The constant depletion in the groundwater level, and the over exploitation rate will result in water scarcity in all major aquifers in the Basin.
The normalized difference water index proved to be a reliable tool for calculating the surface water body’s area. Threshold (0.5) was congruent in 75 percent of the times with the real inflow data, helping in creating a monthly area variation of the wetland for the period of 30 years. The results show that even with the wetland having a maximum area of 480 km2, the average area was 350 km2 in the period of 30 years. As most of the Zayanderud River water is used along the stream flow, minimum water is reaching the wetland located in the downstream. According to latter indicator—and involving the evaporation rate—the volume of the water requirements of the Gavkhuni Wetland is estimated to be 244 Mm3 annually [56]. The Varanze hydrometric station located on the entrance of the Gavkhuni Wetland shows that for the study period between 1985 and 2015, the average inflow to the wetland is 117 Mm3 annually. As a result, the Gavkhuni swamp, which is considered an important wetland for migratory birds and registered as a Ramsar site, became degraded. On average the swamp area has been constantly decreasing and was totally dry in 2009.
The main lesson learnt from this study is that even in arid and semi-arid climatic zones, the water scarcity currently observed is related mainly to human related activities rather than climatic reasons. Zayanderud Basin is a good example of basins facing total “water bankruptcy” as outlined by Klein [57], due to resources overexploitation. Similar observation were made in different basins, for example: the Urmia and Bakhtegan Basins on local level [27,58] and the Colorado and Tucson Basins in the United States [59,60], the Heihe Basin in China [61] and the Lancing–Mekong Basin in Cambodia [62]. All these basins share the fact that the water demand in the basins is high compared to resources that are available, and careful planning is needed for the agricultural sector. It is recommended in such climatic areas, water should be better allocated to agriculture contributing to high-value crops, or/and crops with higher yield per cubic meter, so that agriculture can compete against other water using economic sectors. Even with irrigated crops having higher yields, the rainfed crops, such as wheat, maize and other cereals must be encouraged as their water requirement is minimal. The groundwater resources usage must be restricted to a certain volume per well, as recharge volume is much less than the pumped volume.
Definitely the highest priority is providing potable water in rural areas. The other industrial and agricultural sector water consumption must be ranked from highest to least important in the field of water consumption. As more water availability from basin transfer means more water usage, sustainability must be the key factor in such a basin. Water productivity improvement will have greater impact on small and medium sized farms than increasing the water use efficiency. Usually recovering the water flow in the river is a great challenge for the arid and semi-arid basins. For example, despite water diversion into the Zayanderud Basin, the river flow has been reduced, and so water efficiency and water saving is important. Promoting water management techniques at the farm level should be made in ways to benefit farmers economical and improve the agricultural sustainability. In the region, water management should also consider issues with salinization, water quality, etc. Recent studies show that collaboration between farmers could lead to a more sustainable use of water in similar regions [63].

5. Conclusions

Zayanderud water resources are declining due to overexploitation of the surface and groundwater resources mainly due to expanding agricultural land. The constant reoccurrence of the hydrological droughts is directly related to the human activities in the Basin. After the 1980s and due to expanding the irrigated areas, hydrological drought became more frequent, even that 90 percent of the study years are considered normal in the means of precipitation volume. The hydrological drought occurrence frequency increased to 75 percent of the years in the Zayanderud River and there have been almost no flow to the Gavkhuni Wetland, especially in the summer month when the water demand is the highest for agriculture. The groundwater depletion, due to overexploitation, limited the surface groundwater interaction, thus reducing the wetland recharge. With a constant depletion of 0.6 meters annually, the decrease in the groundwater table level reached 50 meter in some aquifers. It can be said that the water mass depletion in Zayanderud is directly related to human activities rather than climatic changes. A basin-level survey is required to know the total number of wells and their depth, quality and drilling date. These data will help optimize combining the usage of surface and groundwater, and the current detailed groundwater situation. Wells that reached alarming levels or quality must be closed—especially in drought years. Information must be given to farmers on means of crop, land and water management under different circumstances, especially farmers with access to poor water quality decreasing their yield rate and increasing soil salinity. As April is usually the month with the highest flow rate, water annual allowance calendars must be set, depending on the precipitation rate in the previous months and expected evapotranspiration rate in summer. Water allowance must decrease in drought years. In drought years deficit irrigation must be applied only to overcome the drought direct effects on crops. Water institutes must classify the water priorities in the time of drought between different economic sectors. In closed basins, like the Zayanderud, all the renewable water resources are easily used. Transbasin water transition is seen as a solution today for water scarcity in the Basin, but this has not improved the water flow in Isfahan city or the Gavkhuni Wetland.

Author Contributions

Research conceptualization and methodology: N.A.Z., A.T.H. and P.M.R.; formal analysis and investigation: N.A.Z., A.T.H. and P.M.R.; research resources and data curation: N.A.Z., A.T.H. and M.J.T.; original draft preparation: N.A.Z.; reviewing and editing A.T.H., P.M.R., M.J.T., A.B. and B.K. supervision: B.K. All authors have read and agreed to the published version of the manuscript.

Funding

This research was funded MAA-Ja Vesitekniikan Tuki R.Y. (MVTT), Grant Number 38849.

Conflicts of Interest

The authors declare no conflict of interest. The funders had no role in the design of the study; in the collection, analyses or interpretation of data; in the writing of the manuscript or in the decision to publish the results.

References

  1. World Atlas of Desertification. 2020. Available online: www.wad.jrc.ec.europa.eu (accessed on 26 April 2020).
  2. Manap, N.; Ismail, N. Land Irrigation and Food Production in Dry-Land Developing Countries. Int. J. Agric. For. Plant. 2017, 5, 7–14. [Google Scholar]
  3. Deryng, D.; Sacks, W.J.; Barford, C.C.; Ramankutty, N. Simulating the effects of climate and agricultural management practices on global crop yield. Global Biogeochem. Cycles. 2011, 25, 2. [Google Scholar] [CrossRef]
  4. Leng, G.; Tang, Q.; Rayburg, S. Climate change impacts on meteorological, agricultural and hydrological droughts in China. Global Planet. Change 2015, 126, 23–34. [Google Scholar] [CrossRef]
  5. Orimoloye, I.R.; Kalumba, A.M.; Mazinyo, S.P.; Nel, W. Geospatial analysis of wetland dynamics: Wetland depletion and biodiversity conservation of Isimangaliso Wetland, South Africa. J. King Saud Univ.-Sci. 2018. [Google Scholar] [CrossRef]
  6. Wada, Y.; Van Beek, L.P.; Van Kempen, C.M.; Reckman, J.W.; Vasak, S.; Bierkens, M.F. Global depletion of groundwater resources. Geophys. Res. Lett. 2010, 37. [Google Scholar] [CrossRef] [Green Version]
  7. Fazel, N.; Torabi Haghighi, A.; Kløve, B. Analysis of land use and climate change impacts by comparing river flow records in headwater and lowland streams of lake Urmia basin, Iran. Glob. Planet. Chang. 2017, 158, 47–56. [Google Scholar] [CrossRef] [Green Version]
  8. Haghighi, A.T.; Kløve, B. Design of environmental flow regimes to maintain lakes and wetlands in regions with high seasonal irrigation demand. Ecol. Eng. 2017, 100, 120–129. [Google Scholar] [CrossRef] [Green Version]
  9. Abou Zaki, N.; Torabi Haghighi, A.; Rossi, P.; Xenarios, S.; Kløve, B. An Index-Based Approach to Assess the Water Availability for Irrigated Agriculture in Sub-Saharan Africa. Water 2018, 10, 896. [Google Scholar] [CrossRef] [Green Version]
  10. Akbari, M.; Torabi Haghighi, A.; Aghayi, M.M.; Javadian, M.; Tajrishy, M.; Kløve, B. Assimilation of satellite-based data for hydrological mapping of precipitation and direct runoff coefficient for the Lake Urmia Basin in Iran. Water 2019, 11, 1624. [Google Scholar] [CrossRef] [Green Version]
  11. Hoff, H.; Bonzi, C.; Joyce, B.; Tielbörger, K. A water resources planning tool for the Jordan River Basin. Water 2011, 3, 3–718. [Google Scholar] [CrossRef]
  12. Gyamfi, C.; Ndambuki, J.M.; Salim, R.W. Hydrological responses to land use/cover changes in the Olifants Basin, South Africa. Water 2016, 8, 588. [Google Scholar] [CrossRef]
  13. Godinez-Madrigal, J.; Van Cauwenbergh, N.; Van der Zaag, P. Production of competing water knowledge in the face of water crises: Revisiting the IWRM success story of the Lerma-Chapala Basin, Mexico. Geoforum 2019, 103, 3–15. [Google Scholar] [CrossRef]
  14. Enouist, P.; Zhou, Y.; Wensley, D.; Lewis, A. Ecological planning practices of the yellow river national wetland park in Jinan section. Landsc. Archit. Front. 2019, 7, 88–99. [Google Scholar] [CrossRef]
  15. Mahajan, D.R.; Dodamani, B.M. Trend analysis of drought events over upper Krishna basin in Maharashtra. Aquat. Procedia 2015, 4, 1250–1257. [Google Scholar] [CrossRef]
  16. Darvishi, E.; Mehraban, A.; Fanaei, H. Investigate the effects of water deficit stress on seed yield and wheat yield components under the influence of different amounts of super absorbent polymer. Int. J. Farming Allied Sci. 2014. Available online: http://ijfas.com/wp-content/uploads/2014/03/268-273.pdf (accessed on 20 January 2020).
  17. Rosenthal, G.G. The Mediterranean Basin: Its Political Economy and Changing International Relations; Elsevier: New York, NY, USA, 2013. [Google Scholar]
  18. Richards, N. Water Users Associations in Tanzania: Local Governance for Whom? Water 2019, 11, 2178. [Google Scholar] [CrossRef] [Green Version]
  19. Hekmatpanah, M.; Nasri, M.; Sardu, F.S. Effect of industrial and agricultural pollutants on the sustainability of Gavkhuni lagoon wetland ecosystem. Afr. J. Agric. Res. 2012, 7, 3049–3059. [Google Scholar] [CrossRef]
  20. Soffianian, A.; Madanian, M. Monitoring land cover changes in Isfahan Province, Iran using Landsat satellite data. Environ. Monit. Assess. 2015, 187, 543. [Google Scholar] [CrossRef]
  21. Famiglietti, J.S.; Lo, M.; Ho, S.L.; Bethune, J.; Anderson, K.J.; Syed, T.H.; Swenson, S.C.; De Linage, C.R.; Rodell, M. Satellites measure recent rates of groundwater depletion in California’s Central Valley. Geophys. Res. Lett. 2011, 38. [Google Scholar] [CrossRef] [Green Version]
  22. Feng, W.; Zhong, M.; Lemoine, J.M.; Biancale, R.; Hsu, H.T.; Xia, J. Evaluation of groundwater depletion in North China using the Gravity Recovery and Climate Experiment (GRACE) data and ground-based measurements. Water Resour. Res. 2013, 49, 2110–2118. [Google Scholar] [CrossRef]
  23. Voss, K.A.; Famiglietti, J.S.; Lo, M.; De Linage, C.; Rodell, M.; Swenson, S.C. Groundwater depletion in the Middle East from GRACE with implications for transboundary water management in the Tigris-Euphrates-Western Iran region. Water Resour. Res. 2013, 49, 904–914. [Google Scholar] [CrossRef] [PubMed] [Green Version]
  24. Jia, K.; Liang, S.; Wei, X.; Yao, Y.; Su, Y.; Jiang, B.; Wang, X. Land cover classification of Landsat data with phenological features extracted from time series MODIS NDVI data. Remote Sens. 2014, 6, 11518–11532. [Google Scholar] [CrossRef] [Green Version]
  25. Shao, Y.; Lunetta, R.S.; Wheeler, B.; Iiames, J.S.; Campbell, J.B. An evaluation of time-series smoothing algorithms for land-cover classifications using MODIS-NDVI multi-temporal data. Remote Sens. Environ. 2016, 174, 258–265. [Google Scholar] [CrossRef]
  26. Tourian, M.J.; Reager, J.T.; Sneeuw, N. The total drainable water storage of the Amazon River Basin: A first estimate using GRACE. Water Resour. Res. 2018, 54, 3290–3312. [Google Scholar] [CrossRef]
  27. Abou Zaki, N.; Torabi Haghighi, A.; Rossi, P.M.J.; Tourian, M.; Kløve, B. Monitoring Groundwater Storage Depletion Using Gravity Recovery and Climate Experiment (GRACE) Data in Bakhtegan Catchment, Iran. Water 2019, 11, 1456. [Google Scholar] [CrossRef] [Green Version]
  28. Zhang, G.; Yao, T.; Shum, C.K.; Yi, S.; Yang, K.; Xie, H.; Feng, W.; Bolch, T.; Wang, L.; Behrangi, A.; et al. Lake volume and groundwater storage variations in Tibetan Plateau’s endorheic basin. Geophys. Res. Lett. 2017, 44, 5550–5560. [Google Scholar] [CrossRef]
  29. Xiang, L.; Wang, H.; Steffen, H.; Wu, P.; Jia, L.; Jiang, L.; Shen, Q. Groundwater storage changes in the Tibetan Plateau and adjacent areas revealed from GRACE satellite gravity data. Earth Planet. Sci. Lett. 2016, 449, 228–239. [Google Scholar] [CrossRef] [Green Version]
  30. Madani, K.; Mariño, M.A. System dynamics analysis for managing Iran’s Zayandeh-Rud river basin. Water Resour. Manage. 2009, 23, 2163–2187. [Google Scholar] [CrossRef]
  31. Akbari, M.; Toomanian, N.; Droogers, P.; Bastiaanssen, W.; Gieske, A. Monitoring irrigation performance in Esfahan, Iran, using NOAA satellite imagery. Agric. Water Manage. 2007, 88, 99–109. [Google Scholar] [CrossRef]
  32. Molle, F.; Ghazi, I.; Murray-Rust, H. Buying respite: Esfahan and the Zayandeh-Rud river basin, Iran. River Basin Traject. Soc. Environ. Dev. 2009, 196. [Google Scholar] [CrossRef] [Green Version]
  33. Bijani, M.; Hayati, D. Farmers’ Perceptions toward Agricultural Water Conflict: The Case of Doroodzan Dam Irrigation Network, Iran. J. Agric. Sci. Technol. 2015, 17, 561–575. [Google Scholar]
  34. Madani Larijani, K. A system dynamics approach, case study: Zayandeh-Rud River Basin, Iran. Watershed Manag. Sustain. 2005. [Google Scholar] [CrossRef]
  35. Harandi, M.F.; De Vries, M.J. An appraisal of the qualifying role of hydraulic heritage systems: A case study of Qanats in central Iran. Water Sci. Technol. Water Supply 2014, 14, 1124–1132. [Google Scholar] [CrossRef] [Green Version]
  36. Gohari, A.; Eslamian, S.; Abedi-Koupaei, J.; Bavani, A.M.; Wang, D.; Madani, K. Climate change impacts on crop production in Iran’s Zayandeh-Rud River Basin. Sci. Total Environ. 2013, 442, 405–419. [Google Scholar] [CrossRef] [PubMed]
  37. Iranian Metrological Organization. 2016. Available online: www.irimo.ir (accessed on 20 January 2020).
  38. Iranian Water Resources Management Company. 2016. Available online: www.wrm.ir (accessed on 20 January 2020).
  39. Irannezhad, M.; Haghighi, A.T.; Chen, D.; Kløve, B. Variability in dryness and wetness in central Finland and the role of teleconnection patterns. Theor. Appl. Climatol. 2015, 122, 471–486. [Google Scholar] [CrossRef]
  40. Diani, K.; Kacimi, I.; Zemzami, M.; Torabi Haghighi, A. Evaluation of meteorological drought using the Standardized Precipitation Index (SPI) in the High Ziz River basin, Morocco. Limnol. Rev. 2019, 19, 125–135. [Google Scholar] [CrossRef] [Green Version]
  41. Torabi Haghighi, A.; Abou Zaki, N.; Rossi, P.M.; Noori, R.; Hekmatzadeh, A.A.; Saremi, H.; Kløve, B. Unsustainability Syndrome - From Meteorological to Agricultural Drought in Arid and Semi-Arid Regions. Water 2020, 12, 838. [Google Scholar] [CrossRef] [Green Version]
  42. McKee, T.B.; Doesken, N.J.; Kleist, J. The relationship of drought frequency and duration to time scales. In Proceedings of the 8th Conference on Applied Climatology, Boston, MA, USA, 17–22 January 1993; 1993. [Google Scholar]
  43. Lloyd-Hughes, B.; Saunders, M.A. A drought climatology for Europe. Int. J. Climatl. J. R. Meteorolog. Soc. 2002, 22, 1571–1592. [Google Scholar] [CrossRef]
  44. National Drought Management Center. SPI Generator. 2018. Available online: https://drought.unl.edu/droughtmonitoring/SPI/SPIProgram.aspx. (accessed on 20 February 2020).
  45. Nalbantis, I.; Tsakiris, G. Assessment of hydrological drought revisited. Water Resour. Manag. 2009, 23, 881–897. [Google Scholar] [CrossRef]
  46. Cheng, M.; Taple, B.D.; Ries, J.C. Deceleration in the earth’s oblateness. J. Geophys. Res. 2013, 118, 740–747. [Google Scholar] [CrossRef]
  47. Swenson, S.; Chambers, D.; Wahr, J. Estimating geocenter variations from a combination of GRACE and ocean model output. J. Geophys. Res. 2008, 113. [Google Scholar] [CrossRef] [Green Version]
  48. Tourian, M.J. Application of Spaceborne Geodetic Sensors for Hydrology. Ph.D. Thesis, University if Stuttgart, Stuttgart, Germany, 2013. [Google Scholar]
  49. Wahr, J.; Zhong, S. Computations of the viscoelastic response of a 3-D compressible Earth to surface loading: An application to Glacial Isostatic Adjustment in Antarctica and Canada. Geophys. J. Int. 2012, 192, 557–572. [Google Scholar] [CrossRef]
  50. Swenson, S.; Wahr, J. Estimating large-scale precipitation minus evapotranspiration from GRACE satellite gravity measurements. J. Hydrometeorol. 2006, 7, 252–270. [Google Scholar] [CrossRef] [Green Version]
  51. Vishwakarma, B.D.; Horwath, M.; Devaraju, B.; Groh, A.; Sneeuw, N. A data driven approach for repairing the hydrological catchment signal damage due to filtering of GRACE products. Water Resour. Res. 2017, 53, 9824–9844. [Google Scholar] [CrossRef]
  52. McFeeters, S.K. The use of the Normalized Difference Water Index (NDWI) in the delineation of open water features. Int. J. Remote Sens. 1996, 17, 1425–1432. [Google Scholar] [CrossRef]
  53. Xu, H. Modification of normalised difference water index (NDWI) to enhance open water features in remotely sensed imagery. Int. J. Remote Sens. 2006, 27, 3025–3033. [Google Scholar] [CrossRef]
  54. Abrishamchi, A.; Tajrishy, M. Interbasin water transfers in Iran. National Academy of Sciences. Water Conservation, Reuse, and Recycling. Proc. Iran. Am. Workshop 2002, 252–274. [Google Scholar] [CrossRef]
  55. Doostmohammadi, M.; Jafari, A.; Asghari, O. Geostatistical modeling of uniaxial compressive strength along the axis of the Behesht-Abad tunnel in Central Iran. Bull. Eng. Geol. Environ. 2015, 74, 789–802. [Google Scholar] [CrossRef]
  56. Sarhadi, A.; Soltani, S. Determination of water requirements of the Gavkhuni wetland, Iran: A hydrological approach. J. Arid Environ. 2013, 98, 27–40. [Google Scholar] [CrossRef]
  57. Klein, C.A. Water Bankruptcy. Minnesota Law Rev. 2012, 97, 560. [Google Scholar]
  58. Oftadeh, E.; Shourian, M.; Saghafian, B. Evaluation of the Bankruptcy Approach for Water Resources Allocation Conflict Resolution at Basin Scale, Iran’s Lake Urmia Experience. Water Resour. Manag. 2016, 30, 10–3519. [Google Scholar] [CrossRef]
  59. Larson, R.; Kennedy, K. Bankrupt Rivers. UCDL Rev. 2015, 49, 1335. [Google Scholar]
  60. Schneier-Madanes, G.; Valdes, J.B.; Curley, E.F.; Maddock, T.; Marsh, S.; Hartfield, K.A. Water and urban development challenges in the Tucson metropolitan area: An interdisciplinary perspective. Water Bankruptcy Land Plenty 2017, 141–157. [Google Scholar] [CrossRef]
  61. Li, M.; Guo, P. A coupled random fuzzy two-stage programming model for crop area optimization—A case study of the middle Heihe River basin, China. Agric. Water Manag. 2015, 155, 53–66. [Google Scholar] [CrossRef]
  62. Yuan, L.; He, W.; Degefu, D.M.; Liao, Z.; Wu, X. Water allocation model in the Lancing-Mekong River basin based on bankruptcy theory and bargaining game. World Environ. Water Resour. Congr. 2017, 78–92. [Google Scholar] [CrossRef]
  63. Ghadimi, S.; Ketabchi, H. Possibility of cooperative management in groundwater resources using an evolutionary hydro-economic simulation-optimization model. J. Hydrol. 2019, 578, 124094. [Google Scholar] [CrossRef]
Figure 1. (A) Zayanderud River Basin with layout of the irrigated areas, groundwater aquifers observation wells, tunnels, Varzaneh station and the location of the Gavkhuni Wetland. (B) The location of the Zayanderud Basin in Iran. The figure also shows the position of observation wells with the highest depletion rate: NM: North Mahyar, SM: South Mahyar, D: Damaneh, I: Isfahan, M: Murchehkhort and A: Ardestan.
Water 12 01302 g001
Figure 2. Time series of index values over the interval from 1963 to 2012, in the Zayanderud Basin. (A): the standardized precipitation index (SPI), annual values distribution. (B): the streamflow drought index (SDI) annual value distribution. (C): The annual SPI, SDI and SPI–SDI values between 1963 and 2012.
Water 12 01302 g002
Figure 3. The water mass depletion in the Zayanderud Basin based on data derived from the gravity recovery and climate experiment (GRACE) mission. Figure 3 also shows the groundwater depletion rate in meters in the 12 biggest aquifers in the Basin. Y Axis: GRACE depletion in (mm), groundwater depletion level in (m).
Water 12 01302 g003
Figure 4. Wetland Gavkhuni. (A): The annual inflow volume to the Gavkhuni Wetland, in (Mm3) for 1966–2015. (B): the wetland area fluctuation (km2) for 1985–2015, missing or uninterpretable were interpolated and are shown in red in (B).
Water 12 01302 g004
Figure 5. Satellite images showing the Gavkhuni Wetland during different years. (A): 1988 (high inflow), (B): 1993 (high inflow), (C): 2008 (low inflow) and (D): 2010 (low inflow) (Source Google Earth). (E): the Zayanderud River totally dry under the historical Allahverdi Khan Bridge in Isfahan (Source: AP Photography—Vahid Salemi 2018).
Water 12 01302 g005
Table 1. Definition of states of meteorological drought with SPI.
CriterionDescription of State
SPI ≥ 2.0Extremely Wet
1.5 ≤ SPI < 2.0Severely Wet
1.0 ≤ SPI < 1.5Moderately Wet
0 ≤ SPI < 1.0Normally Wet
−1.0 ≤ SPI < 0Normally Dry
−1.5 ≤ SPI < −1.0Moderately Dry
−2.0 ≤ SPI < −1.5Severely Dry
SPI < −2.0Extremely Dry
Table 2. Definition of states of hydrological drought with SDI.
CriterionDescription of State
SDI ≥ 0.0No Drought
−1.0 ≤ SDI < 0.0Mild Drought
−1.5 ≤ SDI < −1.0Moderate Drought
−2.0 ≤ SDI < −1.5Severe Drought
SDI < −2.0Extreme Drought

