Urbanization—Its Hidden Impact on Water Losses: Prądnik River Basin, Lesser Poland
by
 , , , ,
Tomáš Lepeška
1,* ,
,
Jakub Wojkowski
2,
Andrzej Wałęga
3,
Dariusz Młyński
3,
Artur Radecki-Pawlik
4 and
Branislav Olah
1 1
Department of Applied Ecology, Technical University in Zvolen, 960-01 Zvolen, Slovakia
2
Department of Ecology, Climatology and Air Protection, University of Agriculture in Cracow, 30-059 Krakow, Poland
3
Department of Sanitary Engineering and Water Management, University of Agriculture in Cracow, 30-059 Krakow, Poland
4
Division of Structural Mechanics and Material Mechanics, Cracow University of Technology, 31-155 Krakow, Poland
*
Author to whom correspondence should be addressed.
Water 2020, 12(7), 1958; https://doi.org/10.3390/w12071958
Submission received: 9 June 2020
/
Revised: 7 July 2020
/
Accepted: 8 July 2020
/
Published: 10 July 2020
(This article belongs to the Special Issue Hydrological Impacts of Climate Change and Land Use)
Abstract
:Urban development causes multiple water losses. Some of them may be ignored but some could have a huge influence on the whole catchment, including soil drought. As urban sprawl rises, space for unaffected infiltration and retention is increasingly limited. The objective of this study was to backcast and to estimate water-retention loss due to urbanization during the period of 1990–2018. We used landcover data, meteorological and hydrological data and data on soil water-holding capacity. Water-retention loss was expressed as soil water retention capacity loss, net precipitation loss and total sum of precipitation loss. Historical change in urban extension has led to large impacts on the hydrological cycle of the study area. Progressive urban development caused water-retention losses which range from 3.380 to 14.182 millions of cubic meters—depending on the methodology used. Hydrological analysis showed the lack of a significant trend (decrease trend) of low flow which is caused by the high percentage of natural land use in the upper part of catchment. Our results show that backcasting of water retention change using CLC data (a) brings new and plausible data on retention loss, (b) is possible to replicate and (c) data used are common and easy-to-get.
1. Introduction
Water resources are characterized by spatial and temporal variability. Changing availability, quantity and quality of water, leads to problems which mankind has faced for centuries. Floods and droughts occur irregularly, but with major impact on countries across Europe [1,2,3]. River deterioration, the legacy of decades of scarce water management, demonstrates itself in the decreased water quality detected in most streams [1]. The mentioned problems are largely the consequence of climate and land use changes (amplified by the absence or non-observation with, environmental legislation; [4]). Consequently, numerous struggles over water resources are increasing.
To reverse or mitigate this trend is the object of many adaptation strategies. In Poland, policy arrangements have been implemented to reduce discharge from both unaffected and artificial, man-made running water since the 1960’s. These actions were intended to store runoff in pools and terrain hollows and to support the retention of rainfall in soil environment and aquifers. These arrangements are called “small retention” contrary to water storage in large reservoirs and barrages [5,6]. Technical solutions of traditional water retention make such arrangements cost-ineffective [7], and moreover, cause considerable environmental [8] and health impacts [9].
Land use/landcover is the crucial landscape characteristic transformed by man in the most significant way and therefore modifies runoff and the resulting landscapes’ hydric potential (LHP) [10,11,12]. Land use can subvert the hydrologic balance and the dividing of rainfall into evapotranspiration, runoff and groundwater flow [13]. Outflow and stream discharge increase when natural ecosystems (particularly forests) are cleared [14,15]. Landcover alteration can considerably alter maximum flows in river basins [16], especially within the areas where most of the outflow is formed on sites with fast runoff generation [17]. Landcover change is often related to several categories of drought: meteorological, hydrological, agricultural and socioeconomic droughts [18]. Once subsurface water systems are affected by droughts, foremost groundwater recharge, subsequently groundwater levels and groundwater discharge reduce. Groundwater droughts usually observe on a timescale of weeks to years [19]. Droughts impact both surface and underground water resources. Moreover, decreased water supply, worsened water condition, harvest failure, reduced electricity generation, disrupted aquatic ecosystems, as well as postponed recreation or leisure activities are linked with drought [20].
One of the prevalent risks related to land use change and LHP is rapid urban extension [21]. Urbanization comes with a variety of environmental problems for both the local and downstream ecosystems [22]. These environmental challenges are a direct consequence of the physical, chemical and biologic changes to hydrological systems [23,24]. The reduction of permeable surfaces reduces the infiltration into soil [25]; the application of artificial drainage alters or substitutes natural pathways. Impervious surfaces elevate the dangers of augmented discharge and lower infiltration rate. The hydrological response results in the reduction of baseflow and groundwater recharge and more frequently induces the low flow of urban streams. Replacing vegetated areas with impervious surfaces causes more rapid precipitation flows into adjacent streams [26]. As a consequence, the volume and frequency of floods, as well as the peak discharge, increase in nearby streams. Impervious surface cover is positively correlated with flashiness, particularly for small catchment gauges [27]. As the impermeable surface cover rises to 10–20%, runoff increases two-fold; 35–50% impervious surface cover increases runoff three-fold compared to forested catchment [23]. Transformation of natural, semi-natural and suburban landscape to impermeable surfaces, can cause a variety of unfavorable aftermaths [28]. Land use/landcover is the important factor that affects the infiltration and holding of a considerable volume of rainfall. At the same time, there is a high threat of discharge resulting in a faster response [29] and a greater magnitude of stream flow [30], which are associated with deluges from intra-urban waters [21].
The goal of this study is to detect whether a high extent of urban growth upon formerly rural landscape has resulted to serious decreases of water retention. This will be completed through four sequential steps. Foremost, records from hydro-meteorological observing are utilized to characterize the amount of precipitation and evapotranspiration. Next, the retention capabilities of soil systems will be analyzed. Further, the temporal and spatial change in the urban expansion is surveyed for each time lapse. Finally, we will explore how the urbanization and related impervious surfaces have affected the water retention over the surveyed period of urban expansion. The observations and modeling are focusing on the Prądnik river basin, Lesser Poland. The outcomes of this study are discussed to provide information on the effects of urban growth on the water retention (hydric) potential of the river basin.
2. Materials and Methods
2.1. Study Area
To show the temporal and spatial change of water retention we chose the Prądnik river basin, close to Kraków, Poland. The city of Kraków and its vicinity have long-lasting problems with water quality, repeated deluges or droughts [31]. The Prądnik river discharge has changed considerably. In the 1960s the mean annual discharge was 0.490 m3∙s−1 and towards the beginning of the 21st century it fell down to 0.330 m3∙s−1. Such a change results from both natural and human influences. Situated in the headspring part of the Prądnik river basin, significant yield water sources have been turned into water intakes planned for economic use that directly reduced the discharge by more than 0.1 m3∙s−1 [32]. The Prądnik river, is important for relevant for Kraków. It has a direct influence on the water related issues of the built-up area such as deluges, sediment loads and pollution. Significant flood threat is distinctive particularly in the urbanized part of the study area. This part of the study area has a dense storm sewage system and is typical of the impervious cover [33].
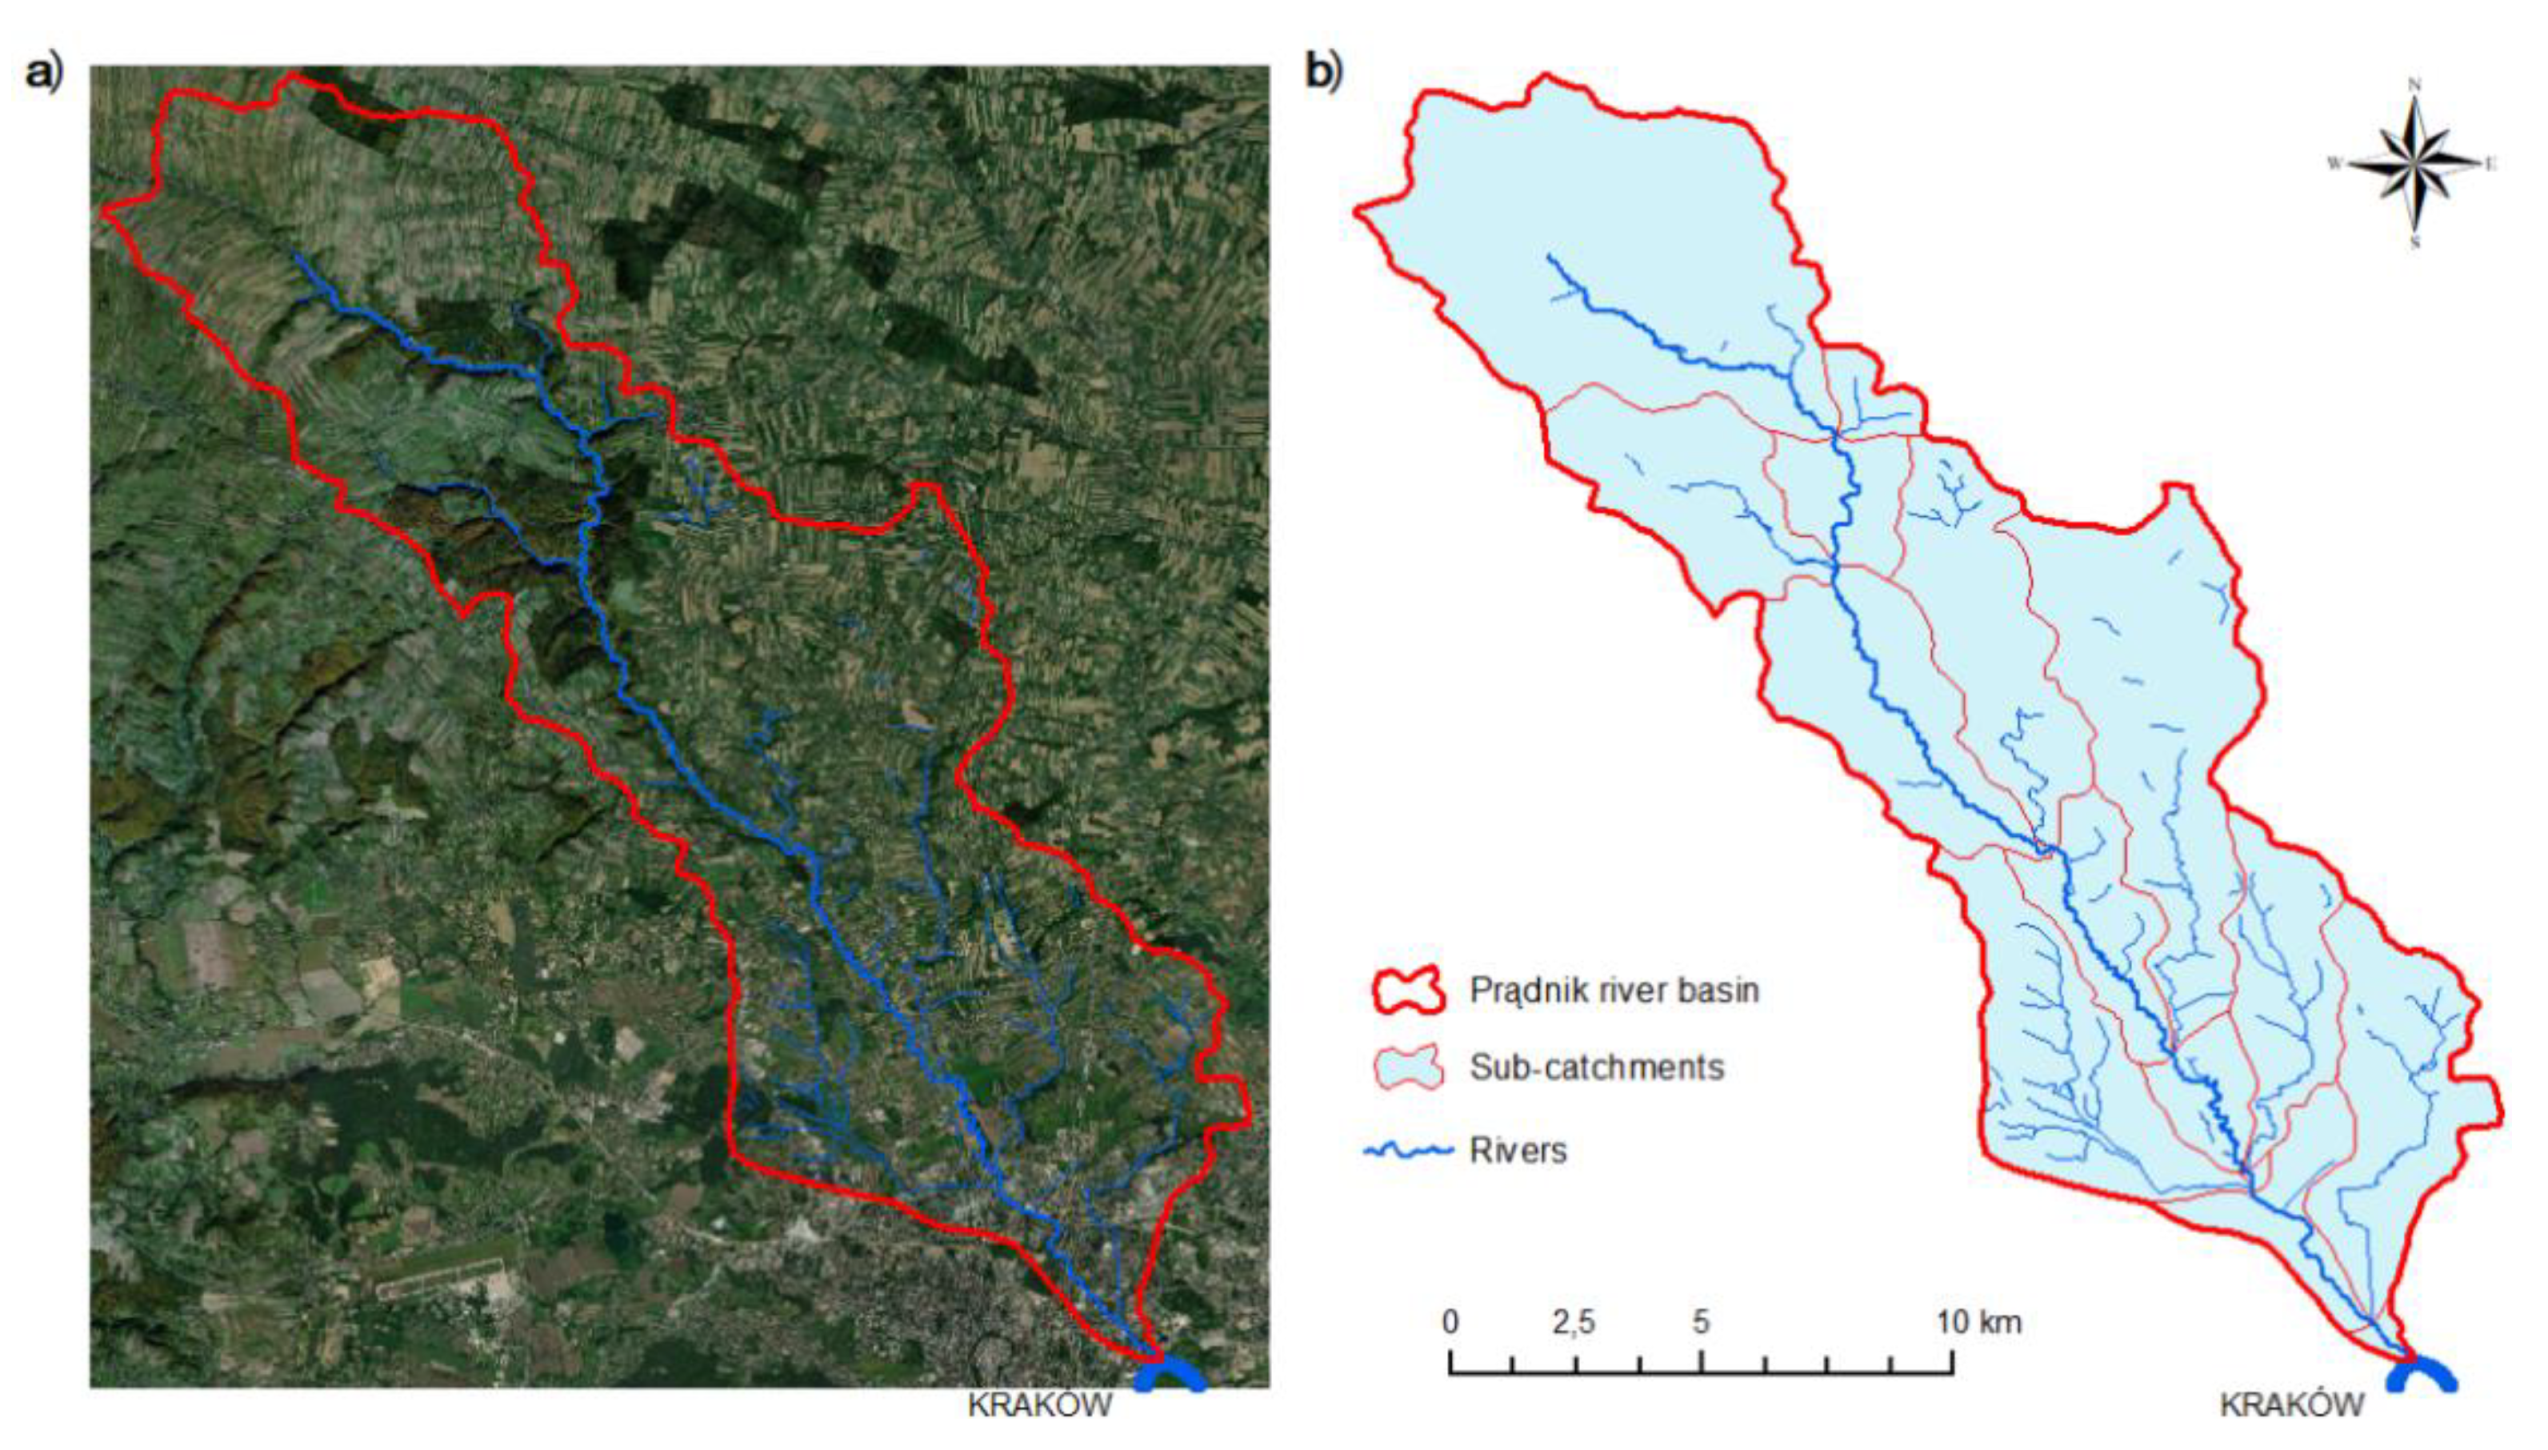
The Prądnik river basin (Figure 1) includes rural, suburban, heavily urbanized and natural landscape. The study area is drained primarily by the Prądnik river. It is a left-bank tributary of the Vistula River. The spring area of the river is found near the Sułoszowa village at an altitude of 450 m ASL; the river is 33.4 km long. The Prądnik river basin is situated in the south-eastern part of the Kraków–Częstochowska Upland and covers an area of 193.1 km2. The basin is typical of agricultural landscape with 55% of its area. The rest is covered by urbanized areas (20.1%) and forests (13.7%) and other types of land use/landcover (LU/LC).
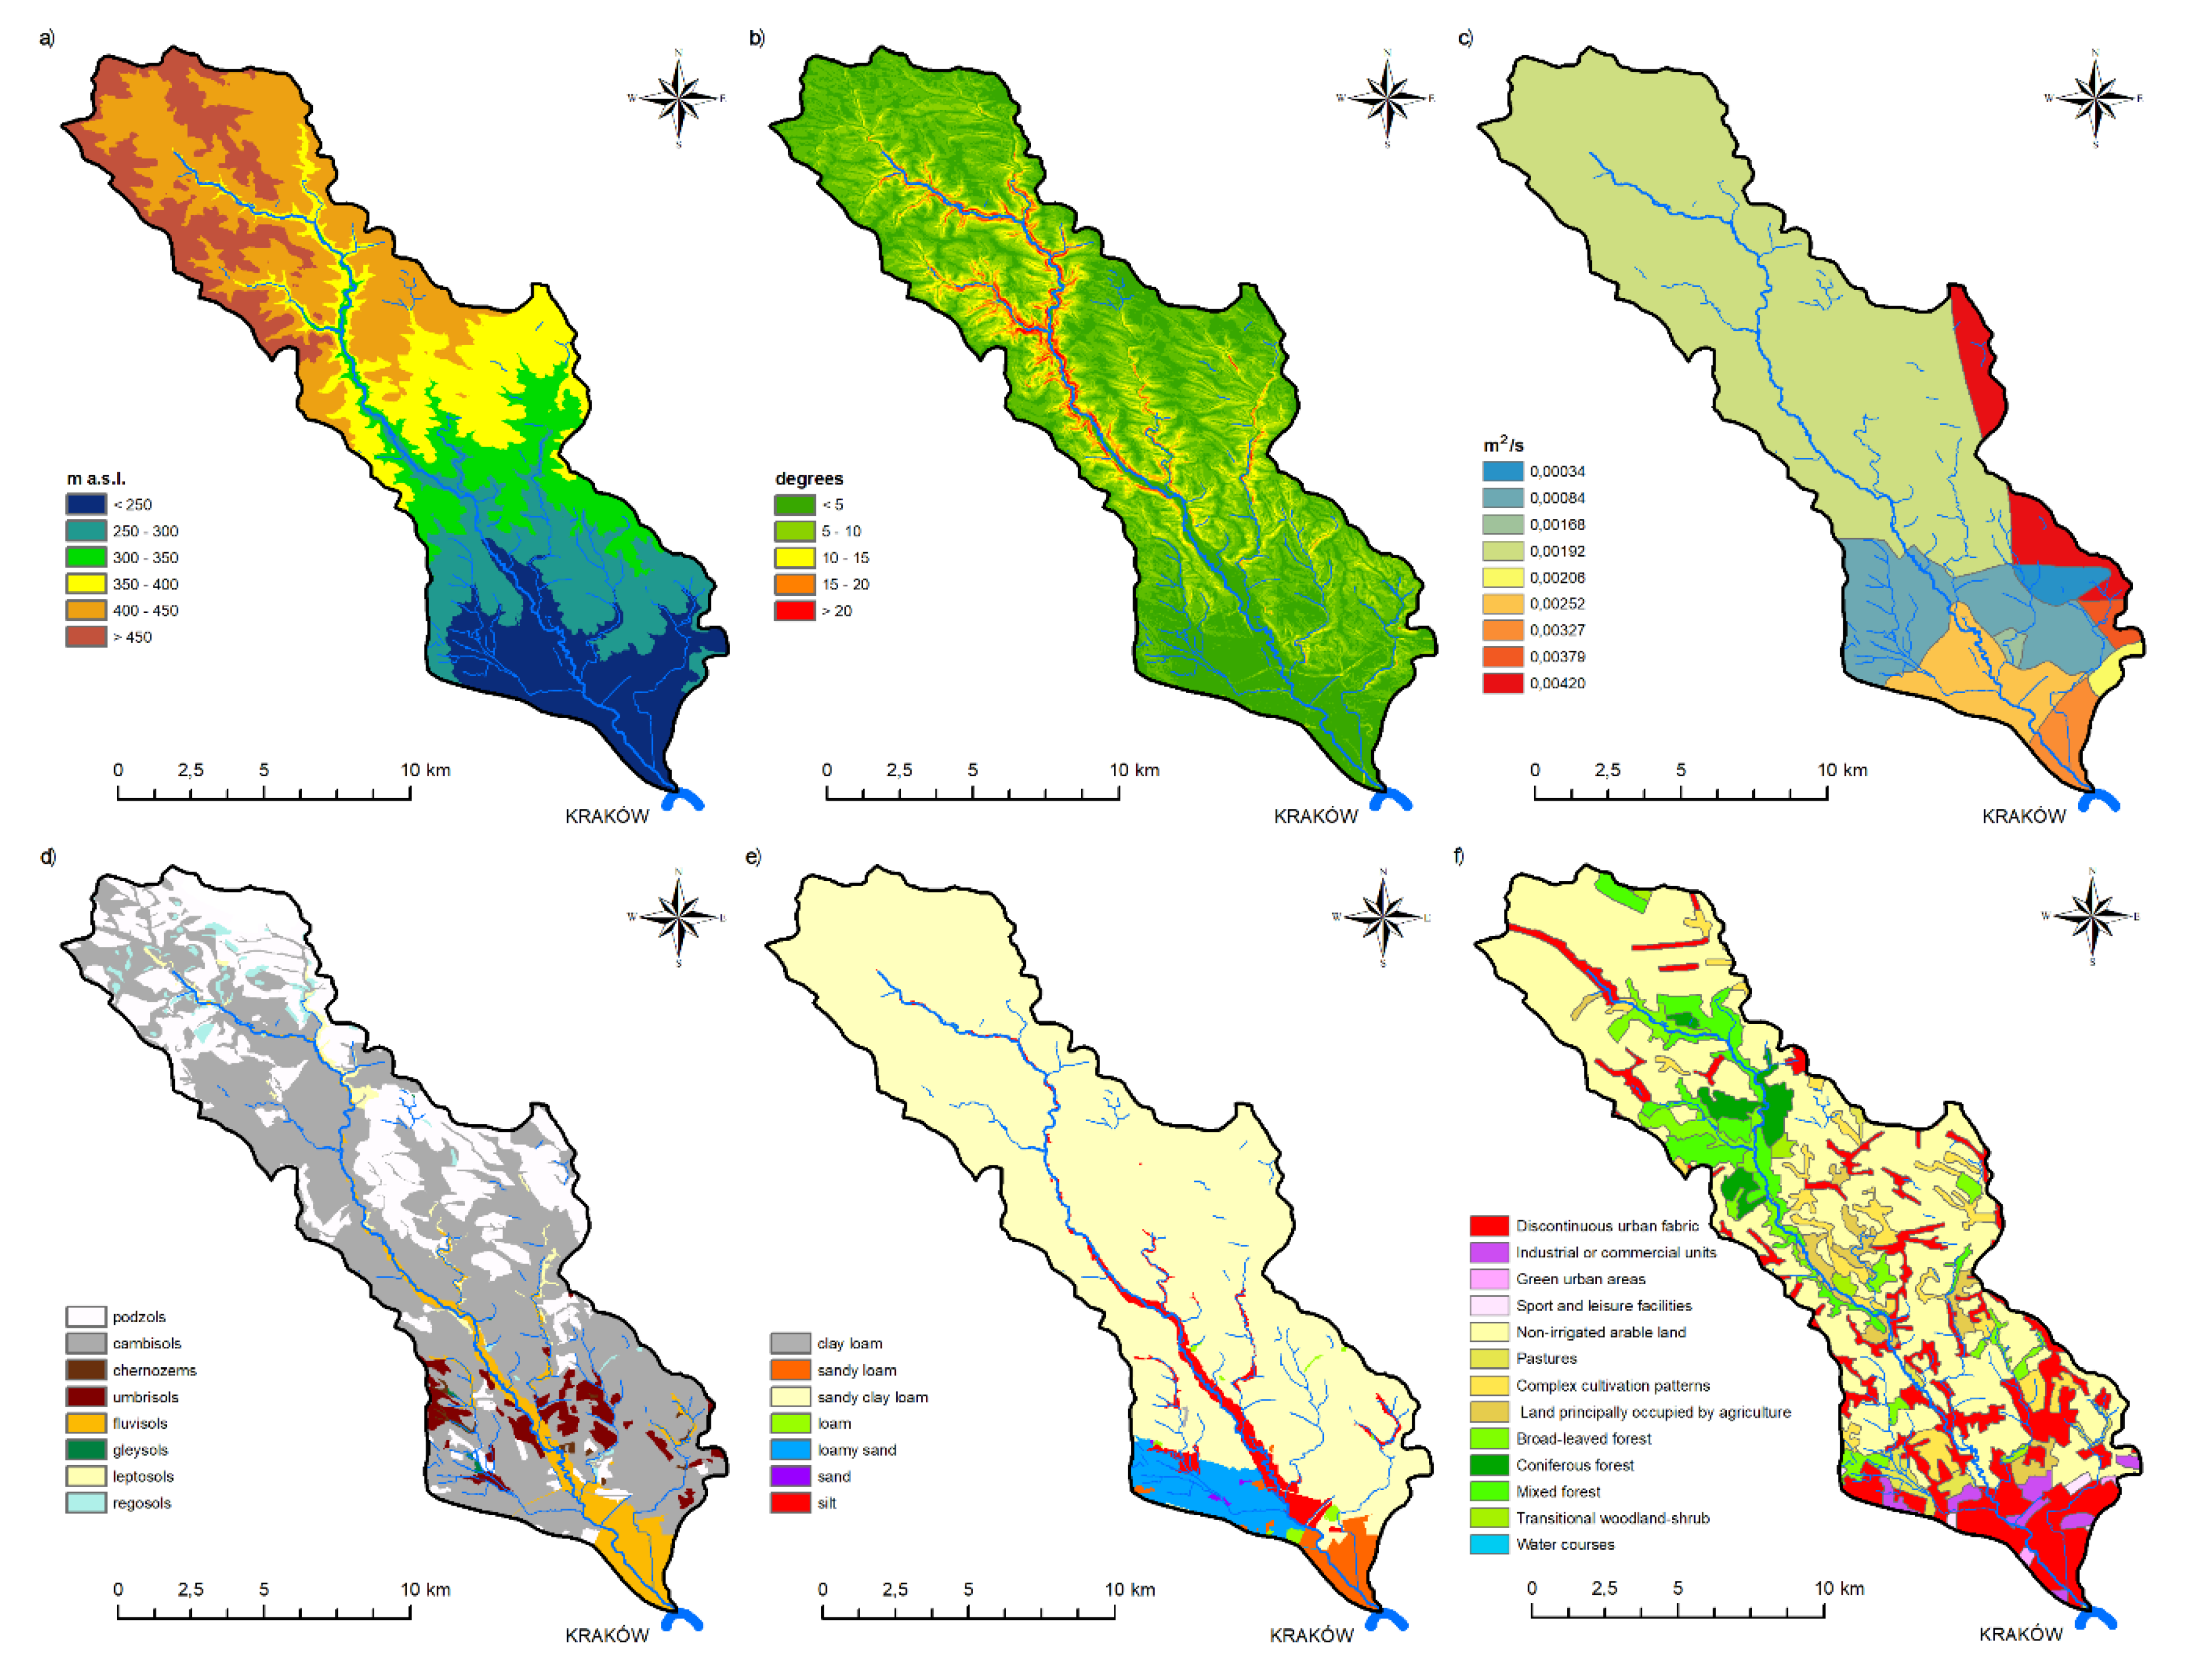
The Prądnik river basin is formed typically by loess, limestone and river deposits with favorable water transmissivity (0.001–0.01 m2∙s−1). On these substrates are formed cambisols (61.0%), podzols (24.8%) and fluvisols (7.3%). Sandy loams (90.1%) dominate together with silt (4.7%) and loamy sands (4.7%). The Prądnik river basin is situated at an altitude of 220–481 m ASL. with an average annual air temperature of +7.5 °C. The average annual precipitation is 580 mm in the eastern parts and 760 mm in the north-west. The average annual potential evapotranspiration ranges from 300–320 mm in the valleys to more than 400 mm in the plateau region of Ojców. Further data on landscape characteristics are shown below (Figure 2).
2.2. Data and Methods
The historical change in urban extent and impervious cover was analyzed from CORINE landcover (CLC) inventory in the years 1990, 2000, 2006, 2012 and 2018 [34]. Artificial surfaces were considered as impermeable. Impervious cover included the following CLC classes: 111—continuous urban fabric; 112—discontinuous urban fabric; 121—industrial or commercial units; 122 roads and rail networks and associated land; 123—port areas; 124—airports; 131—mineral extraction sites; 133—construction areas and 142—sport and leisure facilities. The area of artificial man-made surfaces within listed CLC classes cannot be considered as 100% impervious. To estimate exact data on impervious cover we determined the correction factor (cf) based on the weighted average of imperviousness degree for each CLC class. The imperviousness degree was obtained from IMD status layer with 100 m pixel size for the reference year 2006 [35] and the correction factor was determined as follows: CLC 112—cf 0.56, CLC 121—cf 0.74, CLC 133—cf 0.52 and CLC 142—cf 0.46.
The soil-retention potential of the study area was estimated according to the total available (holding) capacity. Water-holding capacity is primarily controlled by soil texture. A review of water-holding capacity of the main soil texture groups is shown in Table 1. Data are averages and vary with structure and organic matter differences. We used data on water-holding capacity according to Kutílek and Nielsen [36].
Water-retention loss due to urbanization was described in three ways; (i) soil water-holding capacity (SWHC) loss, (ii) volume of average annual climatic water balance—an expression of net precipitation which could be retained under natural conditions (potential water loss—PWL) and (iii) volume of mean annual precipitation falling on the total impervious cover of the study area (total water loss—TWL).
Slope inclination was derived from a digital elevation model (DEM). The DEM was created after analyzing photogrammetric stereoscopic air images at a scale of 1:26,000. It was prepared on the basis of a height points network with a 20 m resolution. A soil vector map was used to determine soil type and texture. The DEM and the soil-agronomic vector map were obtained from the Provincial Center for Geodesic and Cartographic Documentation. CORINE Landcover 1990, 2000, 2006, 2012 and 2018 data in 100 m resolution [34], were used to acquire data about the landscape structure of the study area. Data on imperviousness degree in 100 m resolution were obtained from the IMD status layer for the reference year 2006 [35]. The spatial analysis, data processing, synthesis and evaluation of individual sub-basins were realized by ArcGIS 10.3 software.
Data from 32 meteorological stations from the period of 1971–2000 were used to estimate the spatial distribution of mean annual precipitation, mean annual potential evapotranspiration and climatic water balance. The hydrological data from the period of 2002–2017 and meteorological data from the period of 1990–2017 from the station in Ojców were used for drought phenomenon detection. The hydrometeorological data (daily precipitation, daily temperature and daily discharges) were obtained from the Institute of Meteorology and Water Management of the National Research Institute in Warsaw.
Climatological analyses of precipitation time series were performed. The relative precipitation index (RPI) was utilized as one of the widely used descriptors of meteorological drought. The RPI index is calculated by dividing actual precipitation by normal precipitation for the time being considered and multiplied by 100 according to the equation:
where:
- P—actual precipitation [mm];
- PN—normal precipitation [mm].
Analyses using the RPI index are very effective when used for a single region or a single season. It can be calculated for a variety of time scales, including monthly, seasonal or annual. The pluvial characteristics were based on the Kaczorowska [41] classification the RPI index, which propose two comparative criteria: one related to monthly sums of precipitation and the other related to the sum of precipitation in longer periods (Table 2).
Additional, hydrological analysis trends of low flow time series were performed. The low flow was used as one of the descriptors of hydrological drought. This hydrological characteristic is significant for human impact as LU/LC change or water take. The hydrological analysis covers the determination of descriptive statistics and verification of the significance of the trend for low-flows time series for the Prądnik basin. The trend of low flow data were analyzed for Ojców gauge station (catchment area equal 67.5 km2) for the 2002–2017 period. The low flows characteristic was assumed due to the fact that it is one of the drought hydrological indicators. Descriptive statistics included the following measures: location (minimum, maximum, average, median), dispersion (standard deviation, coefficient of variation) and measures of distribution shapes (skewness coefficient, kurtosis). Additionally, the trend signification was verified; three tests were used: Mann-Kendall, Pettitt and Kruskal–Wallis. The calculations were carried out for the significance level α = 0.05.
The significance of the trend of the low flow time–series, was carried out using the Mann–Kendall (MK) test. The null hypothesis H0 of the test assumed no monotonic data trend, while an alternative stated that such a trend exists. The calculations were carried out for the significance level α = 0.05. The S Mann–Kendall statistics were determined based on the equation [42,43]:
where:
- n—number of elements of the time series.
Normalized statistics Z were calculated according to the equation:
where:
- Var(S)—variance S, determined from the equation:
The main premise of the MK test used is the lack of autocorrelation in a series of data. In the case of the analysis time series such relations could arise. When autocorrelation is found, this phenomenon leads to an underestimation of the Var(S) variance. Therefore, an adjustment for correction of variance has been included, calculated only for data with significant partial autocorrelation [44]:
where:
- —effective number of observations calculated as:
- k—shift;
- ρk—value of the next significant autocorrelation coefficient.
The Pettitt test allows the detection of a single shift at an unknown time t. The null hypothesis assumed no change in the distribution of a sequence of random variables. The test is based on formulas [45]:
where:
- xi, xj—random variables with xi following xj in time.
The test statistics Ut,T depends on Dij and is calculated as:
The test statistics is assessed for all random variables from 1 to T. The most significant change point is selected where the value of |Ut,T| is the largest:
KT = max1≤T|Ut,T|
A change point occurs at time t when the statistic KT is significantly different from zero at a given level.
The Kruskal–Wallis test allows the detection of statistical homogeneity. The inference involved assigning rank to the ordered elements of all samples and determination of rank sum for each sample. The test statistics H is calculated as [46]:
where:
- N—total number,
- Ri—the total sum of ranks in the i–th group,
- ni—the number in the i–th group.
When differences between the analyzed sums are small, the null hypothesis (H0) assuming that all samples originate from the same general population (are homogeneous) is true. A critical region was defined by Pearson’s statistic χ2 with n − 1 degrees of freedom [47].
3. Results and Discussion
The presented study provides a novel perspective on the nature of the urban development–water relationship. This section is organized to provide the outcomes from: (i) pluvial conditions and trends of low flow, (ii) determining the water retention potential of the Prądnik river basin, (iii) mapping any historical change of urban extent and associated impervious cover within the Prądnik river basin and (iv) backcasting of water-retention loss using historical levels of impervious areas. Results are discussed in relation to urban extent and how urban growth has changed the retention potential of the study area.
3.1. Pluvial Conditions
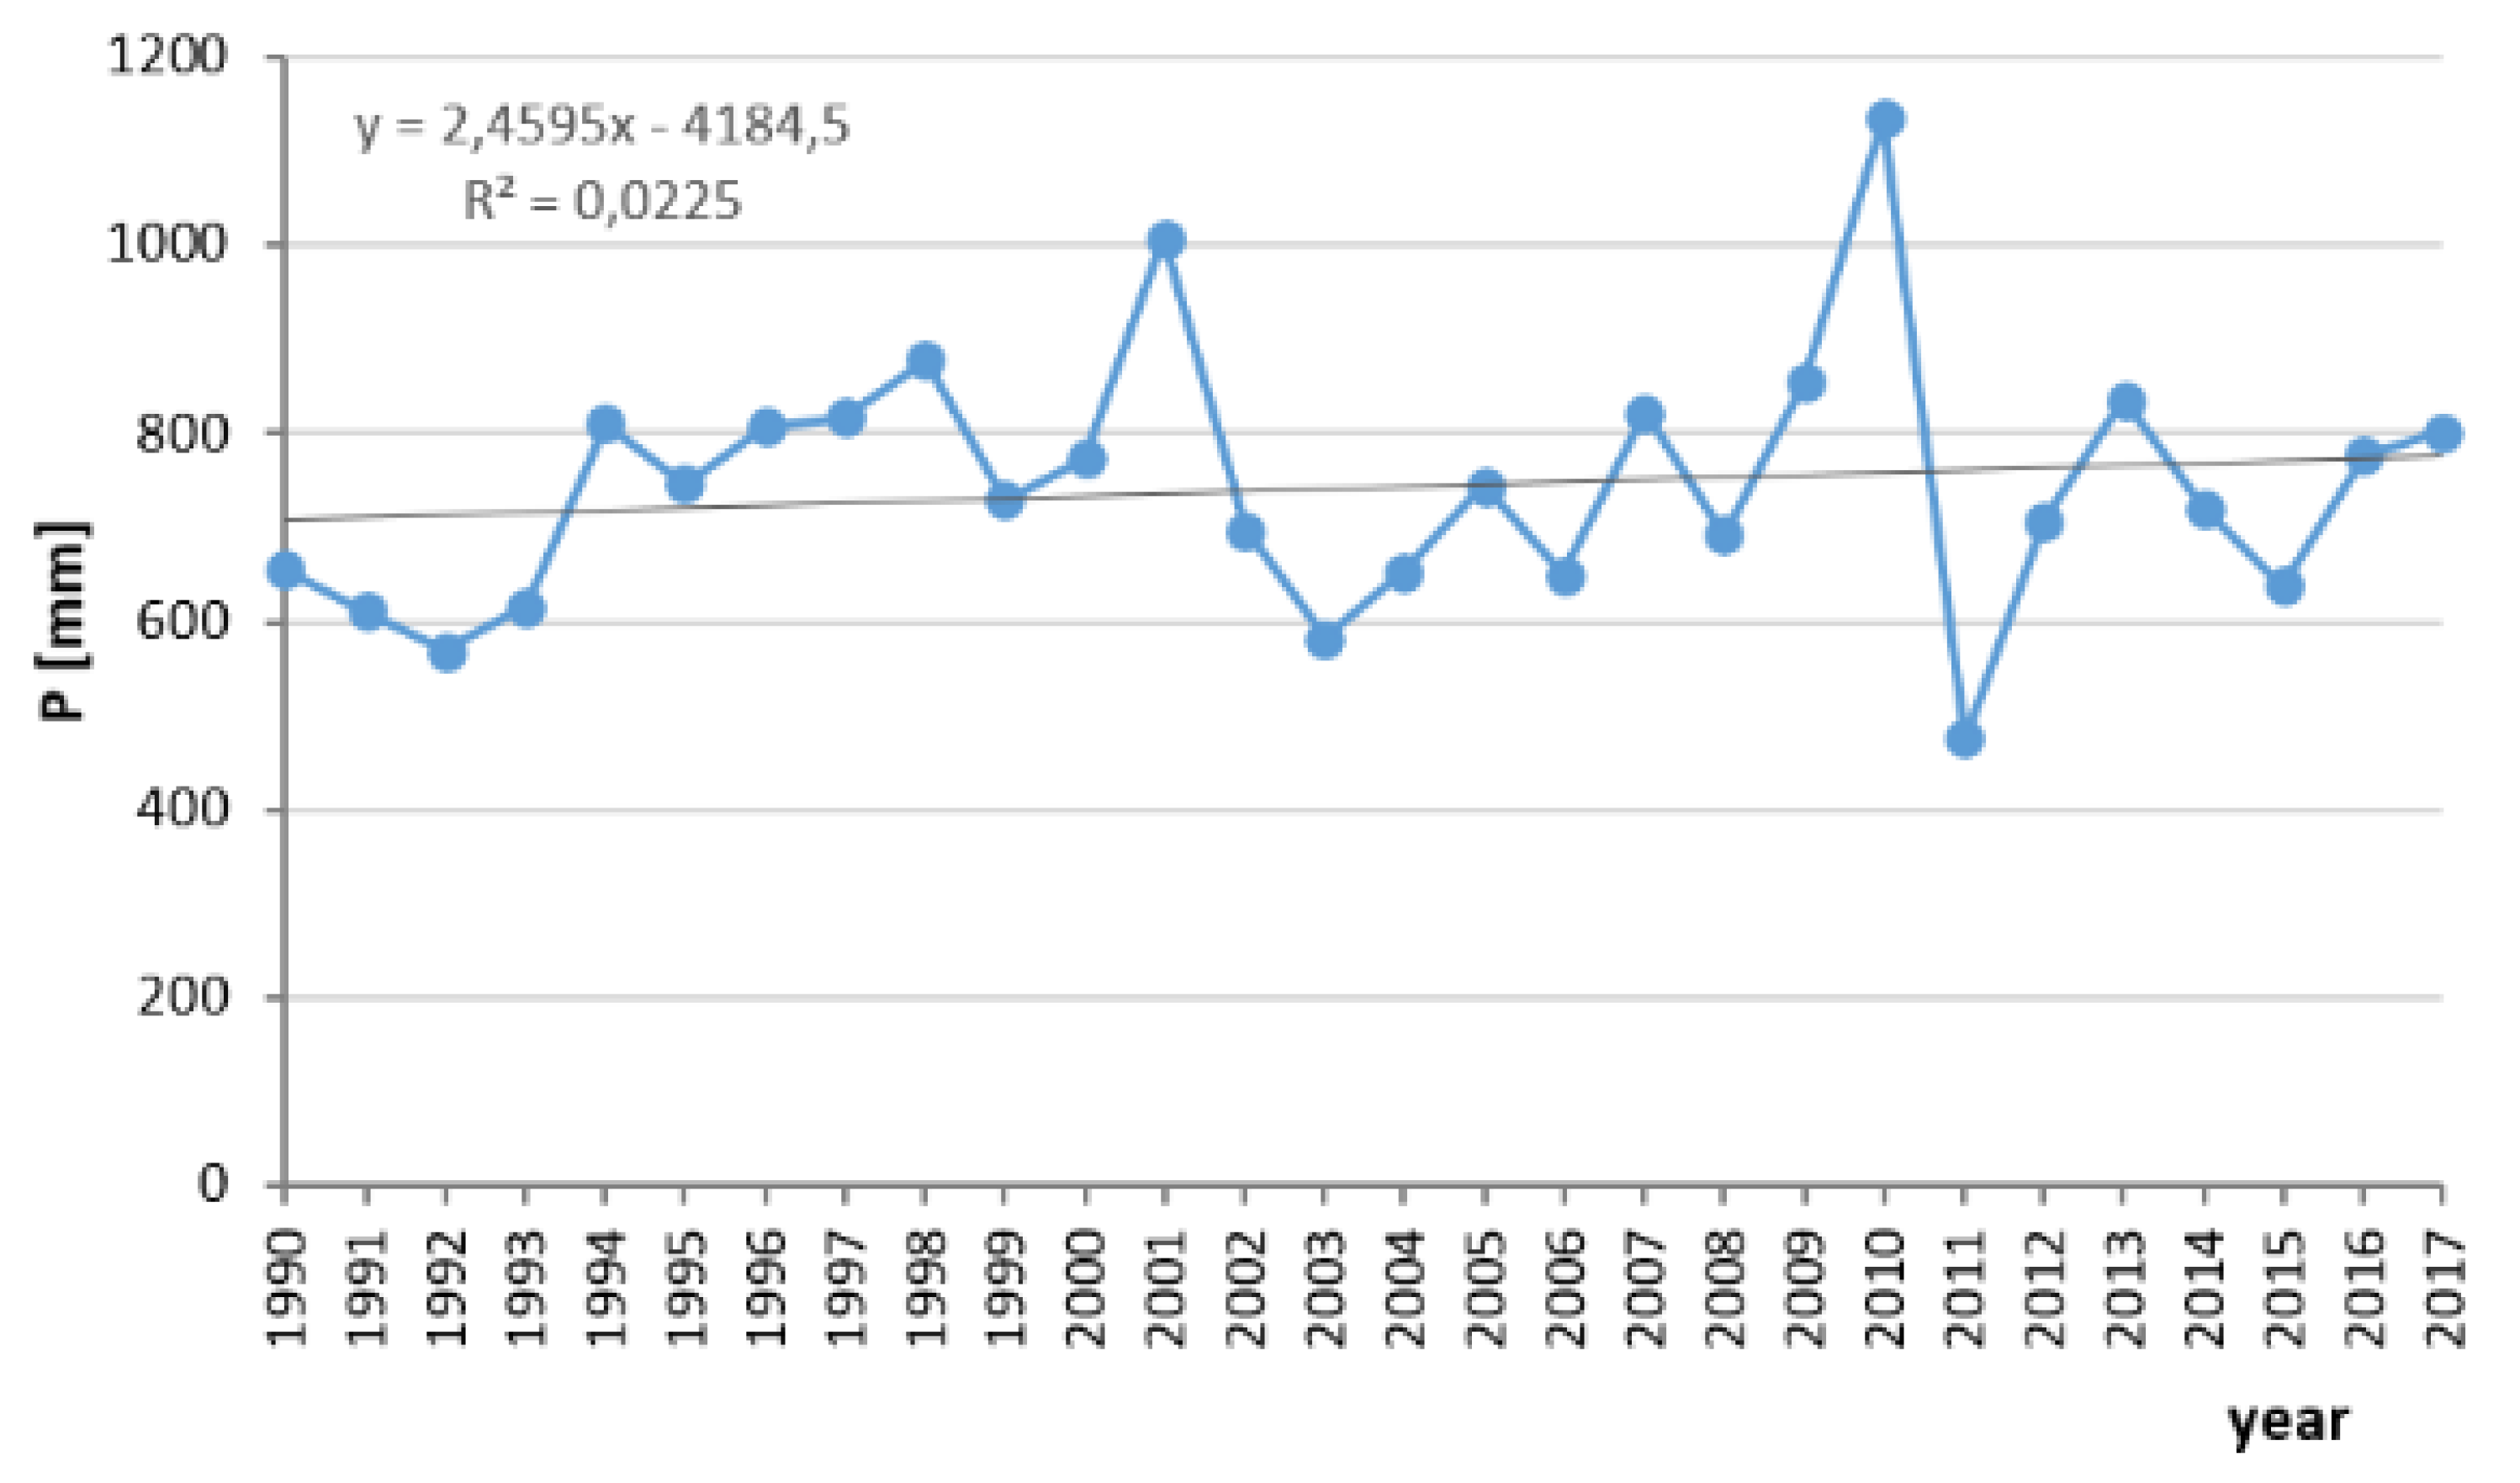
The annual precipitation in the period 1990–2017 for the Prądnik basin was 743 mm and was higher than the normal precipitation for Poland. According to Czarnecka and Lencewicz [48] the annual normal precipitation in Poland for the period 1951–2000 was 594 mm. Higher precipitation in the Prądnik basin results from the location of the catchment area on the higher part of the Krakowsko–Częstochowska Upland. The longtime course of the precipitation is characterized by a significant fluctuation of the values. However, the statistical trend has not been significant (Figure 3).
The instability of precipitation in the Prądnik basin is evidenced by considerable monthly and annual precipitation. The calculated values of the RPI index (Table 3) demonstrate the high variability of the precipitation. The indicator shows the atmospheric precipitation deficiencies and excesses and may be useful for risk assessment of drought or higher river flow.
Extremely dry years did not occur in the analysis period (1990–2017); only one very dry year was observed (2011) in which the precipitation amounted to only 64% of the normal precipitation. There were also eight dry years (1990–1993, 2003, 2004, 2006 and 2015). In the whole analysis period, extremely dry months occurred 14 times, very dry 49 times and dry 77 times and were most common in autumn and winter. The extremely dry months, very dry and dry represented 42% of the analysis period of 1990–2017. Similar results were observed in other parts of Poland [49,50].
3.2. Trends of Low Flow
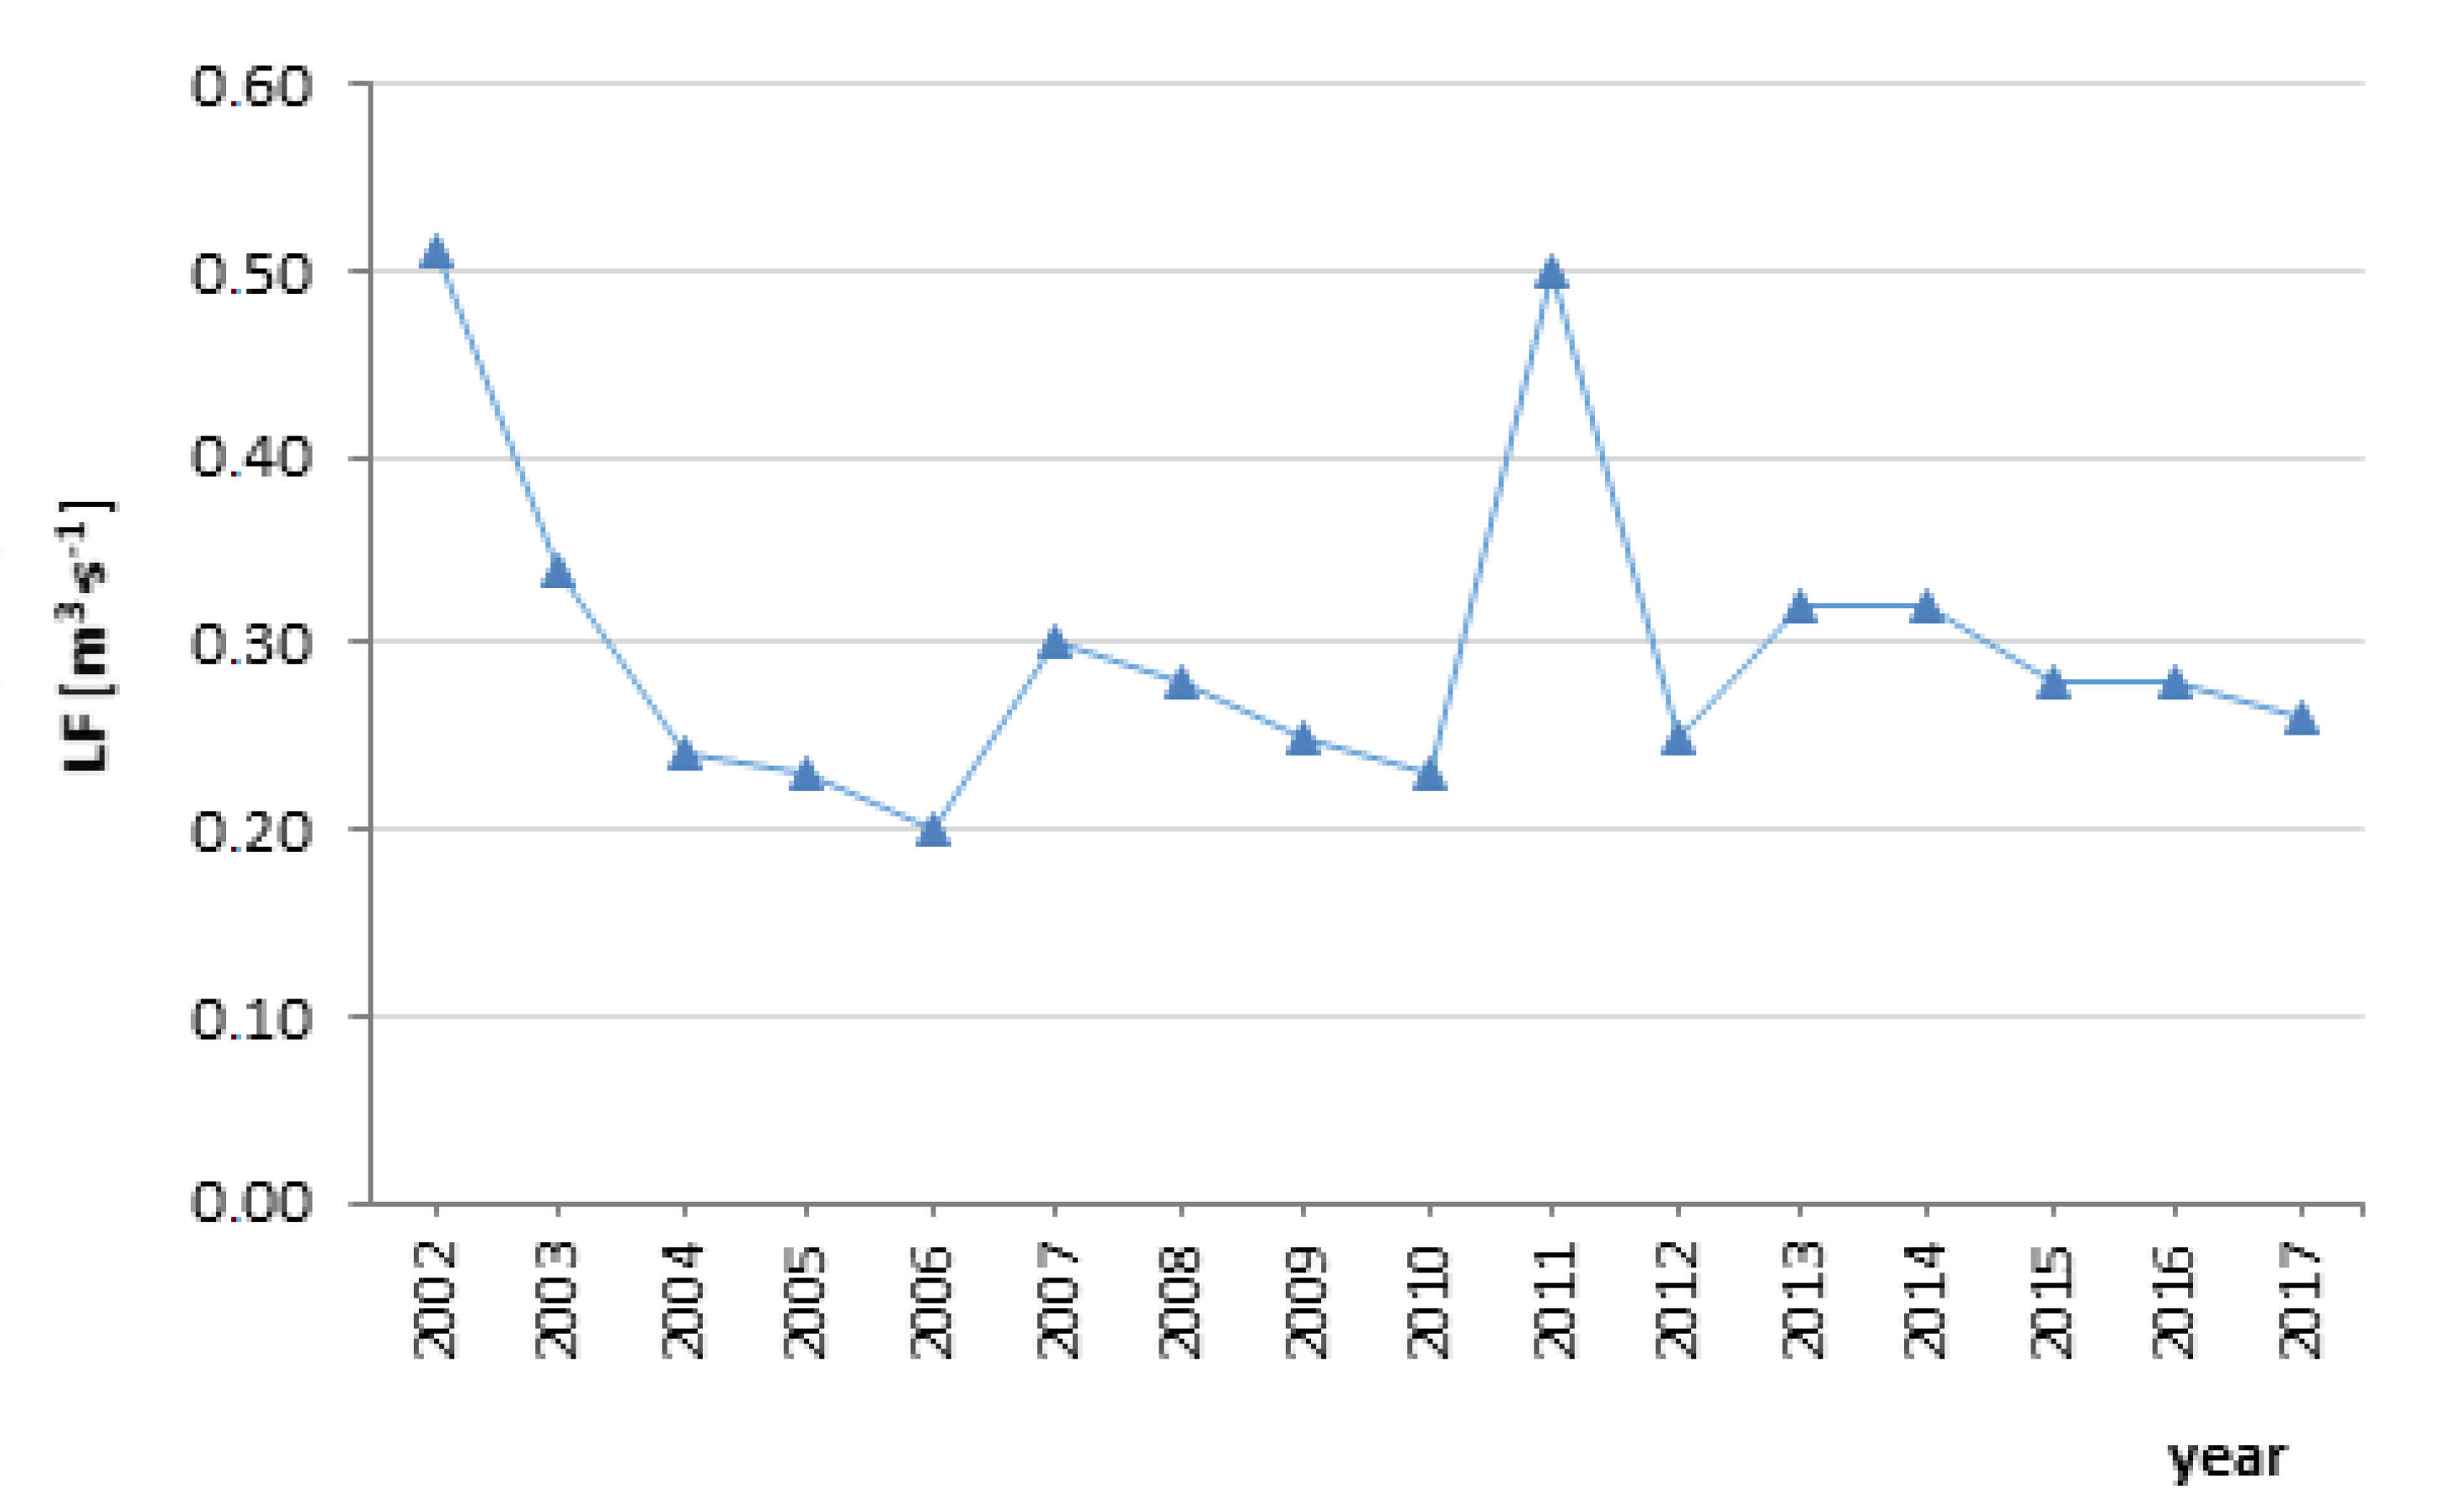
As part of the initial data analysis, basic descriptive statistics were determined for the low flow time–series. Figure 4 shows the course of low flows in the analyzed period: 2002–2017. The results of the calculations are summarized in Table 4.
Based on the results summarized in Table 4 it was found that the difference between minimum and maximum observed low flows values was 29%. The dynamics of changes in the low flows remained at an average level. This is evidenced by the coefficient of variation whose value was almost 30%. This variation coefficient can be explained by the stationary conditions of factors affecting the course of low flows in the analyzed period (meteorological factors, human activities). Analyzing the values of the skewness coefficient, it was shown that it is greater than 0. Therefore, right-sided asymmetry of the empirical distribution of random variables was found. This is due to the fact that in the analyzed time–series most observations are smaller than their average value. Therefore, the average value is greater than the median. In turn, the kurtosis values for time–series indicated the leptokurtic (positive value) empirical distribution of the studied random variables. The analyses of the significance of low flows trend were conducted using the Mann–Kendall, Pettitt and Kruskal–Wallis tests. The results of this analysis are summarized in Table 5.
Based on the results summarized in Table 5 it was found that, for the analyzed period, there has not been a significant statistical trend of low flows in the Prądnik basin, but a decreasing of low flow is visible over the 2002–2017 period. This is confirmed by the values of the probability p for obtained test statistics. In each case the probability p was lower than significant level (α = 0.05). The lack of statistically significant trends means that the investigated random variables derive from the same general population. Thus, in the analyzed multiyear period, no factor appeared to be significantly affecting the processes that shape low flows. The similar results of trend analysis for low flows, in other river basins of the upper Vistula basin were obtained by Młyński et al. [51]. The results obtained from the research can be related to the outcomes regarding the trend analysis of the factors significantly affecting the flow of waters in the river basins of the Upper Vistula water region. Results brought by Niedźwiedź et al. [52] presented no significant trends concerning the indicators describing daily precipitation. Analyses carried out by Falarz [53] confirmed the lack of significant trends for the duration of snow cover remaining in mountainous catchments. The supply of rivers in the Upper Vistula water region comes primarily from snowmelt runoff and from precipitation—hence it is assumed that the rhythm of effluents is repeated by the low flows. The lack of significant trend of low flow in the Prądnik river basin is caused by the high percentage of natural land use in the upper part of the catchment and the positive value of climatic water balance. In result, the upper part of the Prądnik river basin has a higher water storage potential that moderately affects the impact of climatic conditions on flow regime. Higher water storage potential in the upper part of the study area is linked with the higher value of LHP compared to rest of the river basin [11].
3.3. Water Retention Potential of the Prądnik River Basin
The capability of soil environment to control water resources is an essential ecosystem service. Infiltrated precipitation through soil is filtered, accumulated for vegetal utilization and distributed through flow pathways to groundwater and surface water bodies. Hence, the sustainability of water resources (both amount and quality) is inherently affected by soil [54]. Based on the variability of spatial soil texture data (Figure 2) and SWHC data [36], we estimated a mean soil water-holding capacity of the Prądnik river basin 29.221 mil. m3 (maximum estimated soil water-holding capacity is 67.831 mil. m3).
3.4. Historical Change in Urban Extent and Impervious Cover
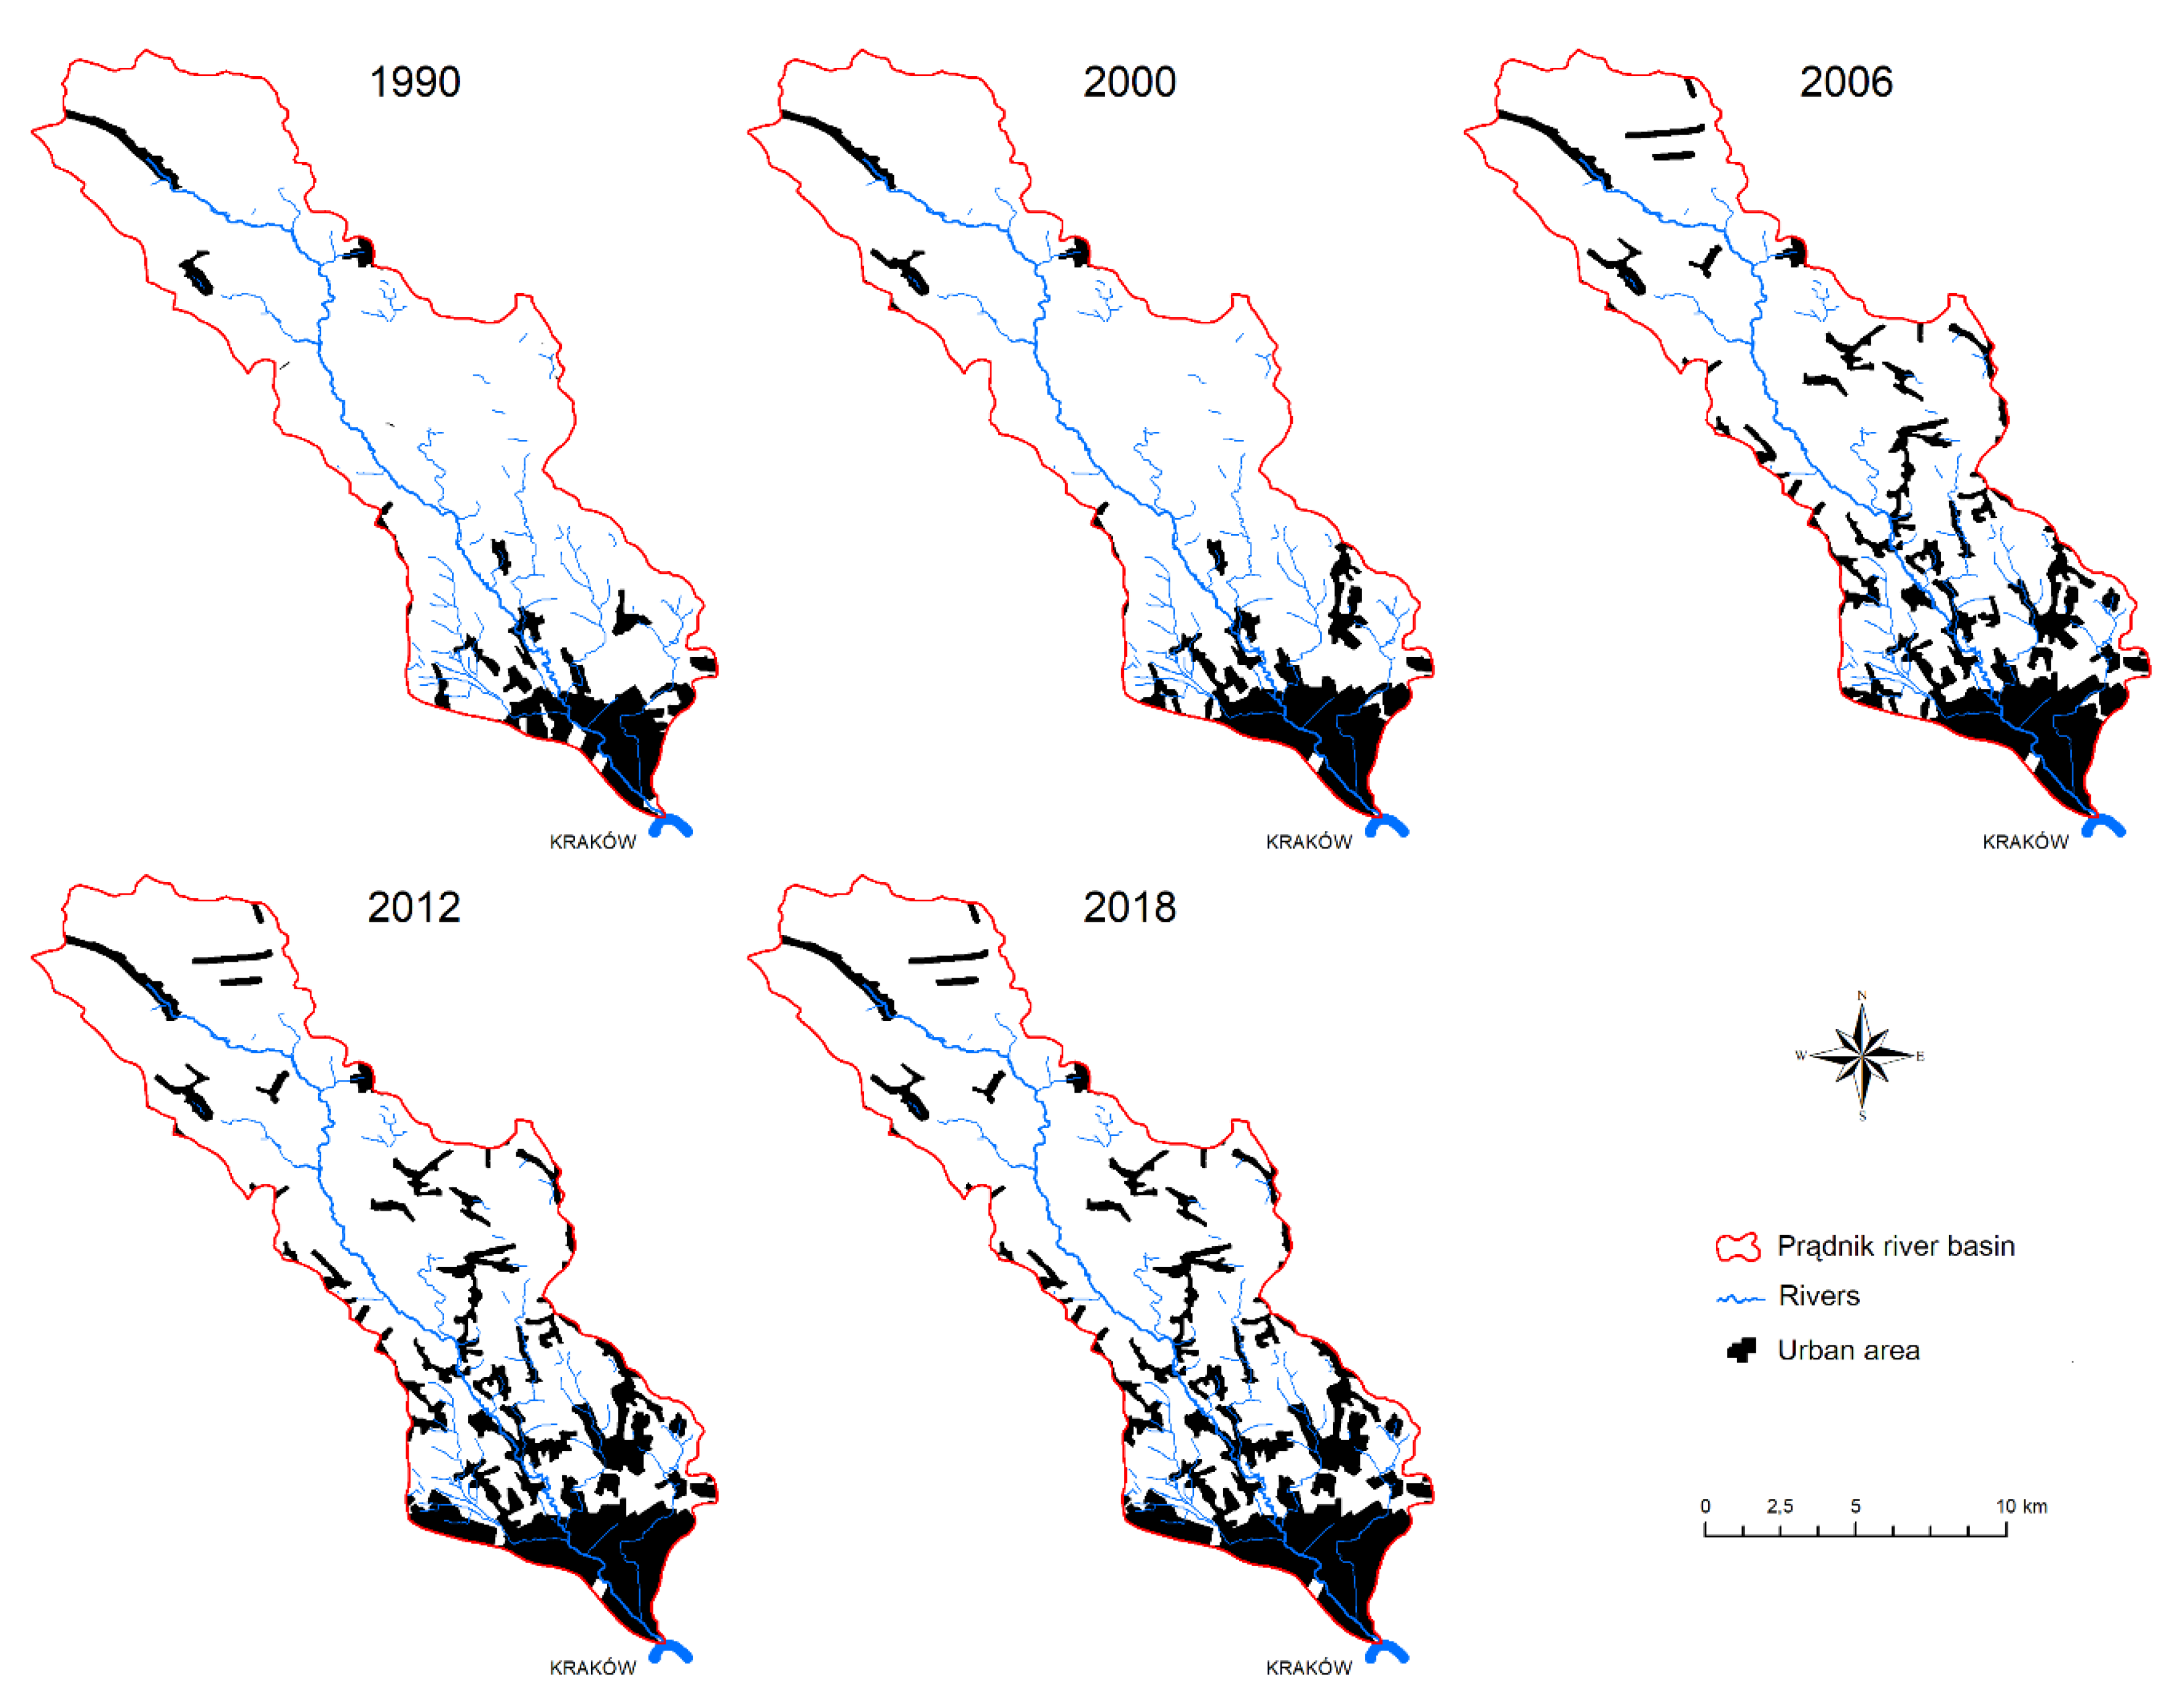
Mapping the change in urban extent across the Prądnik river basin from CORINE Landcover inventory over the period from the 1990’s to 2018 confirmed that the study area has undergone a significant increase of the impervious areas (Figure 5). The historical change in urban development and related impervious cover illustrates the quantitative influence of the urbanization across the study river basin over the period 1990–2018. Within the Prądnik river basin, the impervious cover rose considerably from 6.7% to 11.5%, with the greatest development seen in 2006 and 2012. For further data on the change of impervious cover see Table 6; the presented area of impervious surfaces is after correction factor (cf) was used. With all estimates of historical urban extension and related impervious cover, there is some associated uncertainty. As seen from Table 6 there is uncertainty of CLC 2000 data. Compared to CLC 1990, there is a deficiency of 234 ha within the CLC class 112—discontinuous urban fabric. The total reliability of CLC 2000 is 87.0% ± 0.8%; within the class 112, there is the highest class reliability >95.0% [55].
3.5. Backcasting the Water Retention Change of Progressive Urban Development
The mapping of urban development provided the basis for estimating historical values of impervious cover. The backcasting of the water-retention loss using a mean annual precipitation, climatic water balance (CWB), soil water-holding capacity (SWHC) and the extent of impervious surfaces (IS) change enables a comparison for every year (1990, 2000, 2006, 2012 and 2018). Results are summarized in Table 7. An increase in total impervious cover within the Prądnik river basin from 1297 ha in the 1990´s to 2230 ha in 2018, has led to a substantial/consequential water loss from 8.122 mil. m3 to 14.182 mil·m3. An increase of almost 75% was reached only in 28 years. A comparison of total annual water retention potential of the Prądnik river basin (29.221 mil·m3 resp. 67.831 mil·m3) and total water-retention loss due to urbanization (14.182 mil·m3) describes how impervious areas affect the hydrologic cycle. It is noticeable that impervious areas covering only 11.5% (2230 ha) of the study area are responsible for water loss which equals 48% of mean river basin retention capacity (or 21% of maximum retention capacity).
Progressive urban development is responsible for soil sealing which averts precipitation to infiltration. SWHCL expresses the loss of soil´s space to retain water. Every single square meter of impervious cover decreases soil water-holding capacity whose volume ranges from 100 to 400 mm·m−3 [36]—Table 1. Soil sealing led to a decrease of mean soil water-holding capacity by 1.375 mil·m3 (or by 3.360 mil·m3 of maximum SWHC) during the period of 1990–2018 (Table 7). Loss of SWHC corresponds to LHP loss and, hence, to the loss of one of the key ecosystem services.
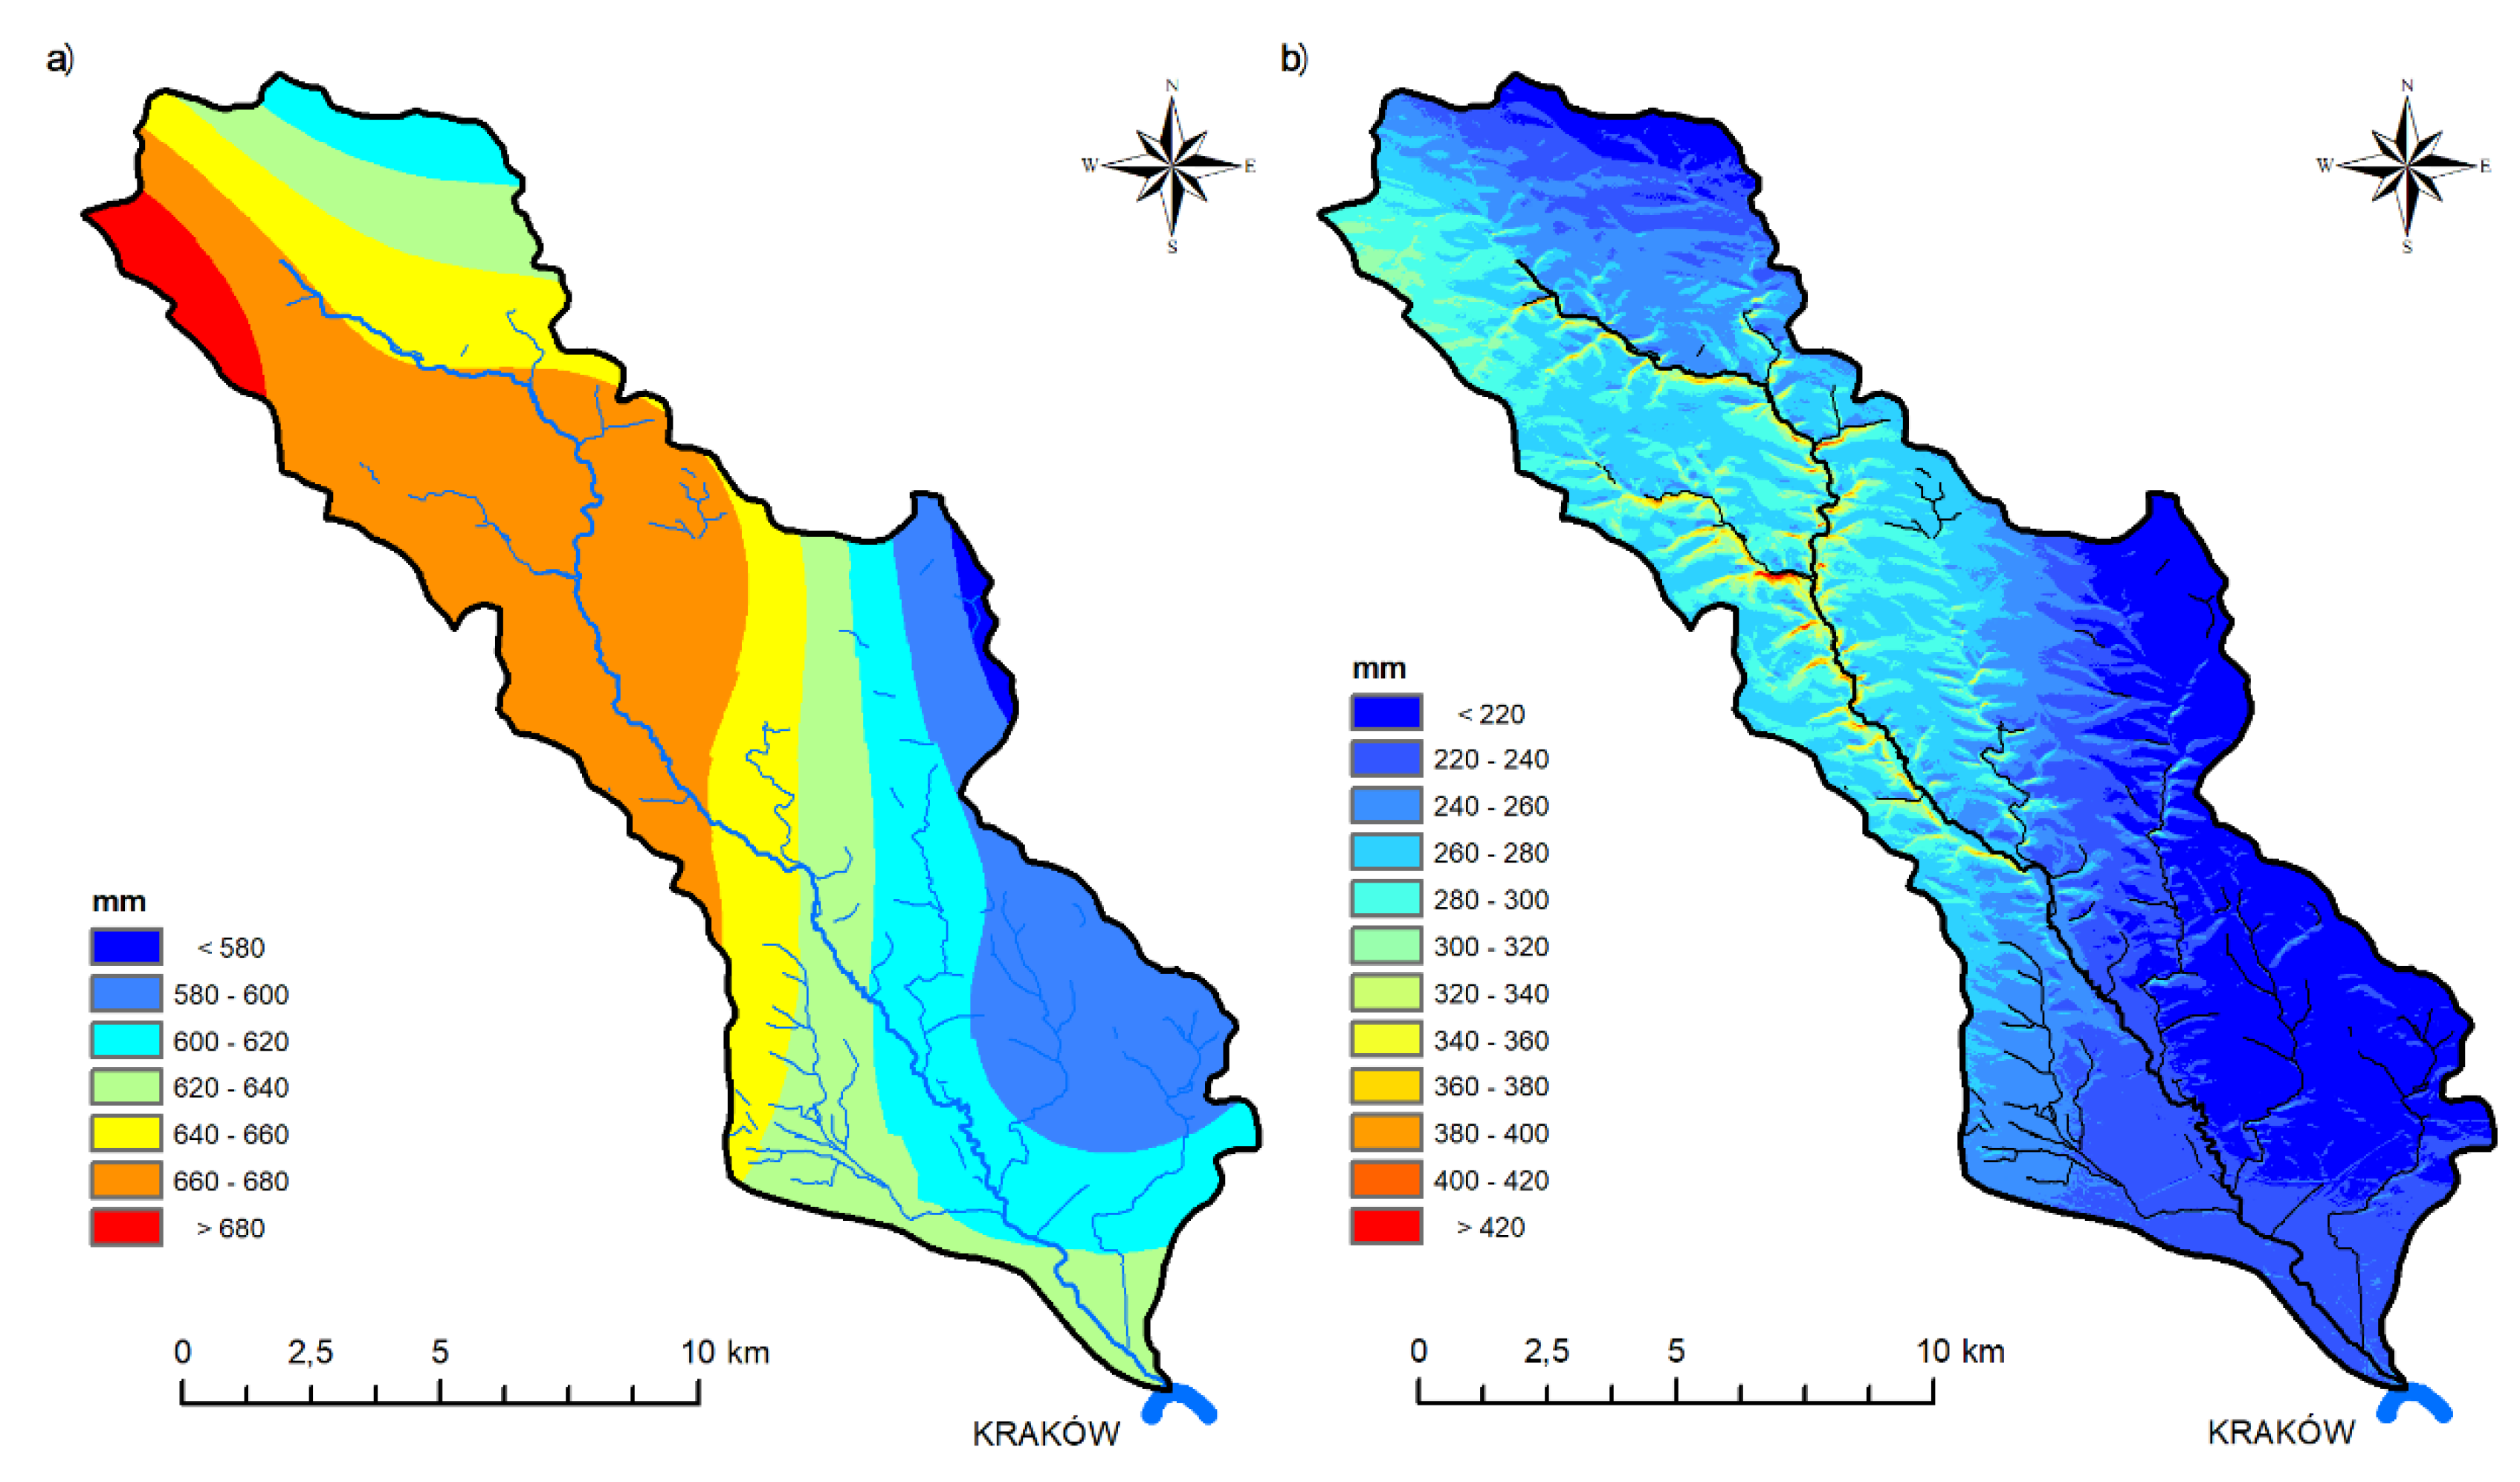
The influence of climate must be involved in all estimations of water availability in the Prądnik river basin. Anthropogenic activity aside, surface water bodies and groundwater quantity is determined by the balance between atmospheric inputs and losses related to evapotranspiration. The relationship between precipitation and evapotranspiration is a well-established indicator of water availability [56]. Potential water loss describes the depth of net precipitation which cannot be retained in the soil environment due to urbanization. PWL states the depth of CWB in the natural environment, where infiltration and retention of water is unblocked. The annual climate water balance varies from 196 mm in the east and north of the study area, to 496 mm in the valleys of the Prądnik river (Figure 6). As the area of impervious surfaces increased the volume of water loss rose as well. In the 1990’s the area of IS was 1297 ha, the PWL equaled to 3.095 mil·m3; nowadays, with a sealed area of 2230 ha, the PWL raised to 5.232 mil·m3.
However, the total water loss is far greater. In urbanized areas, precipitation falling on artificial surfaces either evaporates or runs off. The runoff water drains quickly, and, in the long term, less surface water remains available for evapotranspiration [57]. Urban evapotranspiration can be neglected because it is considerably less than from neighboring rural areas, because of the contrasts in the hydrological properties of building materials and vegetation-covered soils [58]. Hence, it would be better to use the mean annual precipitation as the description of total water loss. It is obvious that TWL exceeds the water retention potential of the soil environment. TWL is almost 3 times greater than PWL and clearly illustrates the actual water loss of the urban environment. It is evident (Table 7) that the historical impacts from urbanization are massive and complex. Sealed surfaces covering 2230 ha (reference year 2018) are concerned with the runoff and/or evaporation of 14.182 mil·m3 per year. Such progressive urban development and consequent TWL is often linked with the prevention of groundwater recharge [59,60,61] and decreased low flows between rainfall events [62]. As urban areas develop, the resulting LU/LC changes affect hydrologic processes through alterations in recharge, runoff and evapotranspiration which, in turn, affect the quantity of water bodies [63].
The urban area extent almost doubled during the observed time period of 1990–2018. Nowadays, covering 2230 ha (11.5%) of the total, impervious surfaces may have a significant effect on the hydrology of the Prądnik basin. Booth and Jackson [64] state that changes in the hydrologic responses of river basins begin at very low levels of urban development; with measured effects when the area of impervious cover reaches about 10%. In addition, Oudin et al. [65] stated that high, low and mean flows were impacted at a threshold of a 10% impermeable extent. Yang et al. [66] indicated that 3–5% impervious cover is the threshold value—beyond which urban development effects start to have a statistically significant impact on streamflow regime. Model simulations at 6% of the total impervious area confirmed increases in maximum flows in urbanized river basins when compared to rural river basins in comparable physiographic locations. For shorter recurrence periods (1–2 years), the increase in maximum flow due to urban development is more evident than for longer recurrence interval peak flows (10 years or greater) [67]. Walega et al. [68] showed that the increase of the impervious area in Suduł Dominikanski (right tributary of Prądnik river) increased peak flow and flood volume and also decreased the response of catchment of heavy storm. Bhaduri et al. [69] found a linear relationship between the extent of the impervious cover and average annual runoff, later confirmed by Assouline and Mualem [70]. A research on the city of Leipzig, Germany, demonstrated that runoff had more than doubled in period of 1940–2003 due to the progressive urban development [71]. Similarly, Perry and Nawaz [72] demonstrated comparable results in the urbanized area of the city of Leeds, Great Britain. A 75% expansion of the urban area throughout the Prądnik river basin has led to a 75% increase in total water loss. This finding is consistent with studies that reported urbanization promoted quick runoff [73,74,75,76].
The LU/LC change has a direct impact on the high quantity of water loss—not only theoretical, but with visible impacts on ecosystems, groundwater table, crop yields and climate as well. It is not only due to urbanization, but also agriculture and forestry affect hydrologic balance significantly. Many draining facilities have been established across the landscape. In Poland, about 2 million hectares of grasslands are drained with a system of open ditches. Most of them are located in floodplains [76]. Networks of open ditches contribute to the decrease of the groundwater table level. In the study area, there are 53.3 km of ditches. When the river basin is created by pervious geological structures, this network of open ditches decreases the groundwater level in the adjacent areas as well as in the case of the Prądnik river basin. Quick runoff from the drainage facilities is observed typically during the spring. Consequently, for a period of the growing season, there is not sufficient water for the vegetation.
Soil environment under natural forests is usually porous, typical with favorable infiltration and subsequently low rates of runoff. Such conditions are not automatically the case for managed forest stands, especially where no natural understory of vegetation is maintained. Forest management activities concerning site preparation, drainage, road network development and logging may have detrimental effects on water resources [77,78] and the transport of sediments into streams [79].
4. Conclusions
The study presents the backcasting of the water retention change due to progressive urban development. Urban development in the Prądnik river basin largely affects the hydrologic balance. Impervious surfaces limit infiltration and space for retention of water while promoting runoff and evaporation. We have provided three ways of insight into urban related water-retention loss:
- water-retention loss could be perceived as damage to the soil´s ability to retain precipitation due sealing by impervious surfaces;
- water-retention loss due to urbanization could be expressed by volume of net precipitation. It provides the comparison of water volume which could be retained in the natural environment, where infiltration and retention is unblocked;
- water-retention loss can be stated as the total sum of runoff and evaporation from impervious areas, as well as retention of sealed soil—the sum of which equals the precipitation depth per square meter.
Urban areas contribute to decreased water capacity in catchment, not only by the decreasing of soil water storage—as is traditionally declared. Total water loss is far greater and comprises not only the loss of soil-retention potential, but runoff and evaporation must be included. This water loss is rapidly changing over space and time. In consequence in this catchment a strong variability of flow regime is visible (decreased low flow and increased high flow). In the case of the Prądnik basin, the lack of significant trend (decrease trend) of low flow is caused by the high percentage of natural land use in the upper part of the catchment.
The European Union’s “no net land take” initiative is a systematic way to eliminate the adverse effects of further urbanization. According to the initiative, each new area of land would have to be compensated for by the revitalization of the previously urbanized area while brownfields should be used as a priority for any new construction. An alternative to standard technical solutions is the concept of green and blue infrastructure based on the strengthening of natural processes in the landscape. The main advantage of green and blue infrastructure compared to gray infrastructure is its versatility, multifunctionality and ability to self-regulate. Even though academic ecological approaches highlight the significance of the functional aspects of ecosystems, applied management guidelines have still not been able to introduce them into practice. The restoration of ecosystem functions is frequently the consequence of the revitalization actions performed and is rarely intended as a primary purpose.
Our results showed how progressive urban development has affected the hydrologic cycle in the Prądnik river basin. One of the greatest advantages of this presented research is the methodology used and data availability. Altogether, this study provides a better understanding of the impact of urbanization on the temporal and spatial distribution of water resources. It could serve as a base for future smarter urban development, especially in the time of general drought predicted for Europe due to LU/LC change and climate change.
Author Contributions
Conceptualization, T.L.; methodology, T.L., A.W., D.M. and B.O.; software, A.W., D.M. and J.W.; validation, T.L., B.O. and J.W.; formal analysis, T.L., A.W., D.M., J.W., A.R.-P., B.O. and A.W.; investigation, T.L., B.O., A.W., D.M., J.W. and A.R.-P.; resources, T.L. and J.W.; data curation, T.L. and J.W.; writing—original draft preparation, T.L.; writing—review and editing, T.L., A.W., D.M., J.W., B.O. and A.R.-P.; visualization, T.L., D.M.; supervision, T.L., B.O. and A.R.-P.; project administration, T.L. All authors read and agreed to the published version of the manuscript.
Funding
This research was funded by project of the Slovak Grant Agency for Science (VEGA) no. 1/0104/19.
Acknowledgments
The authors wish to express their gratitude to Richard Charles Scott, B.Ed. for language editing of this manuscript.
Conflicts of Interest
The authors declare no conflicts of interest.
Nomenclature
| CLC | CORINE landcover |
| LU/LC | land use/landcover |
| LHP | landscape hydric potential |
| IS | impervious surfaces |
| IMD | degree of imperviousness |
| SWHC | soil water-holding capacity |
| SWHCL | soil water-holding capacity loss |
| PWL | potential water loss |
| TWL | total water loss |
| RPI | relative precipitation index |
| CBW | climatic water balance |
| DEM | digital elevation model |
| cf | correction factor |
References
- Kundzewicz, W. The flood of the floods—Poland, summer 1997. The Extremes of the Extremes: Extraordinary Floods. Proceedings of a symposium held at Reykjavik, Iceland, July 2000. IAHS-AISH P 2002, 273, 147–153. [Google Scholar]
- Radecki–Pawlik, A.; Wojkowski, J.; Wałęga, A.; Pijanowski, J. Using GIS maps for water resources analysis of the Mściwojów water reservoir. In Polish: Zastosowanie metod GIS do analizy zasobów wodnych krajobrazów kulturowych regionu zbiornika wodnego Mściwojów. Acta Sci. Pol. Form. Circumiectus 2015, 14, 109–133. [Google Scholar]
- Van Lanen, H.A.; Laaha, G.; Kingston, D.G.; Gauster, T.; Ionita, M.; Vidal, J.P.; Vlnas, R.; Tallaksen, L.M.; Stahl, K.; Hannaford, J.; et al. Hydrology needed to manage droughts: The 2015 European case. Hydrol. Process. 2016, 30, 3097–3104. [Google Scholar] [CrossRef] [Green Version]
- Dale, V.H. The relationship between land-use change and climate change. Ecol. Appl. 1996, 7, 753–769. [Google Scholar] [CrossRef]
- Kowalewski, Z. Actions for small water retention undertaken in Poland. J. Water Land Dev. 2008, 12, 155–167. [Google Scholar] [CrossRef] [Green Version]
- Mioduszewski, W. Small (natural) water retention in rural areas. J. Water Land Dev. 2014, 20, 19–29. [Google Scholar] [CrossRef] [Green Version]
- Keating, K.; Keeble, H.; Pettit, A.; Stark, D. Cost Estimation for SUDS—Summary of Evidence; Environment Agency: Bristol, UK, 2015. [Google Scholar]
- O’Connor, J.E.; Duda, J.J.; Grant, G.E. 1000 dams down and counting. Science 2015, 348, 496–497. [Google Scholar] [CrossRef]
- Lerer, L.B.; Scudder, T. Health impacts of large dams. Environ. Impact. Asses. 1999, 19, 113–123. [Google Scholar] [CrossRef]
- Lepeška, T. Hydric potential of landscape and integrated river basin management in mountain and submontane regions. Ecohydrol. Hydrobiol. 2010, 10, 13–24. [Google Scholar] [CrossRef]
- Lepeška, T.; Radecki-Pawlik, A.; Wojkowski, J.; Wałęga, A. Hydric potential of the river basin: Prądnik, Polish Highlands. Acta Geophys. 2017, 65, 1253–1267. [Google Scholar] [CrossRef]
- Wojkowski, J.; Młyński, D.; Lepeška, T.; Wałęga, A.; Radecki-Pawlik, A. Link between hydric potential and predictability of maximum flow for selected catchments in Western Carpathians. Sci. Total Environ. 2019, 683, 293–307. [Google Scholar] [CrossRef] [PubMed]
- Foley, J.A.; DeFries, R.; Asner, G.P.; Barford, C.; Bonan, G.; Carpenter, S.R.; Chapin, F.S.; Coe, M.T.; Daily, G.C.; Gibbs, H.K.; et al. Global consequences of land use. Science 2005, 309, 570–574. [Google Scholar] [CrossRef] [Green Version]
- Sahin, V.; Hall, M.J. The effects of afforestation and deforestation on water yields. J. Hydrol. 1996, 178, 293–309. [Google Scholar] [CrossRef]
- Costa, M.H.; Botta, A.; Cardille, J.A. Effects of large-scale changes in land cover on the discharge of the Tocantins River, Southeastern Amazonia. J. Hydrol. 2003, 283, 206–217. [Google Scholar] [CrossRef]
- Viola, M.R.; Mello, C.R.; Beskow, S.; Norton, L.D. Impacts of land-use changes on the hydrology of the Grande river basin headwaters, Southeastern Brazil. Water Resour. Manag. 2014, 28, 4537–4550. [Google Scholar] [CrossRef]
- Naef, F.; Scherrer, S.; Weiler, M. A process based assessment of the potential to reduce flood runoff by land use change. J. Hydrol. 2002, 267, 74–79. [Google Scholar] [CrossRef]
- Bulletin of the Meteorological Society. American Meteorological Society. Statement on meteorological drought. Bull. Am. Meteorol. Soc. 2004, 85, 771–773. [Google Scholar]
- van Lanen, H.A.J.; Peters, E. Definition, effects and assessment of groundwater droughts. In Drought and Drought Mitigation in Europe; Vogt, J.V., Somma, F., Eds.; Kluwer Academic Publishers: Dordrecht, The Netherlands, 2000; pp. 49–61. [Google Scholar]
- Riebsame, W.E.; Changnon, S.A.; Karl, T.R. Drought and Natural Resource Management in the United States: Impacts and implica$tions of the 1987–1989 Drought; Westview Press: Boulder, CO, USA, 1991. [Google Scholar]
- Lepeška, T. The impact of impervious surfaces on ecohydrology and health in urban ecosystems of Banská Bystrica (Slovakia). Soil Water Res. 2016, 11, 29–36. [Google Scholar] [CrossRef] [Green Version]
- Tsihrintzis, V.A.; Rizwan, H. Modeling and management of urban stormwater runoff quality: A review. Water Resour. Manag. 1997, 11, 136–164. [Google Scholar] [CrossRef]
- Paul, M.J.; Meyer, J.L. Streams in the urban landscape. Annu. Rev. Ecol. Evol. Syst. 2001, 32, 333–365. [Google Scholar] [CrossRef]
- Shuster, W.D.; Bonta, J.; Thurston, H.; Warnemuende, E.; Smith, D.R. Impacts of impervious surface on watershed hydrology: A review. Urban Water J. 2005, 2, 263–275. [Google Scholar] [CrossRef]
- Konrad, C.P. Effects of Urban Development on Floods; US Geological Survey, Fact Sheet 076-03: Reston, VA, USA, 2003.
- Rosburg, T.T.; Nelson, P.A.; Bledsoe, B.P. Effects of urbanization on flow duration and stream flashiness: A case study of Puget Sound streams, western Washington, USA. J. Am. Water Resour. As. 2017, 53, 493–507. [Google Scholar] [CrossRef]
- Smith, B.K.; Smith, J.A. The flashiest watersheds in the contiguous United States. J. Hydrometeorol. 2015, 16, 2365–2381. [Google Scholar] [CrossRef]
- O’Driscoll, M.; Clinton, S.; Jefferson, A.; Manda, A.; McMillan, S. Urbanization effects on watershed hydrology and in-stream processes in the southern United States. Water 2010, 2, 605–648. [Google Scholar] [CrossRef]
- Huang, H.J.; Cheng, S.J.; Wen, J.C.; Lee, J.H. Effect of growing watershed imperviousness on hydrograph parameters and peak discharge. Hydrol. Process. 2008, 22, 2075–2085. [Google Scholar] [CrossRef]
- Hawley, R.J.; Bledsoe, B.P. How do flow peaks and durations change in suburbanizing semi-arid watersheds? A southern California case study. J. Hydrol. 2011, 405, 69–82. [Google Scholar] [CrossRef]
- Lewicki, L. Preliminary assessment of urban watercourse capacity under significant anthropogenic impact. Acta Sci. Pol. Form. Circumiectus 2015, 14, 135–147. [Google Scholar] [CrossRef]
- Soja, R. Hydrology of the Ojców National Park. In Monograph of the Ojców National Park; Nature: Ojców, Poland, 2008. [Google Scholar]
- Walega, A.; Grzebinoga, M. The flood risk assessment in Cracow agglomeration as an element of a flood risk management. Acta Sci. Pol. Form. Circumiectus 2014, 13, 259–273. [Google Scholar] [CrossRef]
- CORINE Land Cover—Copernicus Land Monitoring Service. Available online: https://land.copernicus.eu/pan-european/corine-land-cover (accessed on 8 June 2020).
- Imperviousness—Copernicus Land Monitoring Service. Available online: https://land.copernicus.eu/pan-european/high-resolution-layers/imperviousness (accessed on 8 June 2020).
- Kutílek, M.; Nielsen, D.R. Soil Hydrology: Textbook for Students of Soil Science, Agriculture, Forestry, Geoecology, Hydrology, Geomorphology and Other Related Disciplines; Catena Verlag: Cremlingen-Destedt, Germany, 1994. [Google Scholar]
- Geohring, L.D.; Gates, D.; Duiker, S.W.; Bossard, S. Soil and Water Management; Study Guide; NRCCA Cornell University: Ithaca, NY, USA, 2016. [Google Scholar]
- Ball, J. Soil and Water Relationships. Available online: http://www.noble.org/ag/soils/soilwaterrelationships/ (accessed on 9 June 2020).
- Blencowe, J.P.B.; Moore, S.D.; Young, G.J.; Shearer, R.C.; Hagerstrom, R.; Conley, W.M.; Potter, J.S. Soil; US Soil Department of Agriculture Bulletin 462: Washington, DC, USA, 1960.
- Know Your Water Holding Capacity. Available online: https://www.cropquest.com/know-your-water-holding-capacity/ (accessed on 9 June 2020).
- Kaczorowska, Z. Opady w Polsce w Przekroju Wieloletnim. [Precipitation in Poland—Multiannual Survey]; Prace Inst. Geogr.: Warzsawa, Poland, 1962. [Google Scholar]
- Rutkowska, A.; Ptak, M. On certain stationarity tests for hydrologic series. Stud. Geotech. Mech. 2012, 34, 51–63. [Google Scholar] [CrossRef] [Green Version]
- Książek, L.; Woś, A.; Florek, J.; Wyrębek, M.; Młyński, D.; Wałęga, A. Combined use of the hydraulic and hydrological methods to calculate the environmental flow: Wisloka river, Poland: Case study. Environ. Monit. Assess. 2019, 191, 254. [Google Scholar]
- Pingale, S.M.; Khare, D.; Jat, M.K.; Adamowski, J. Trend analysis of climatic variables in an arid and semi-arid region of the Ajmer District, Rajasthan, India. J. Water Land Dev. 2016, 28, 3–18. [Google Scholar] [CrossRef] [Green Version]
- Mallakpour, I.; Villarini, G. A simulation study to examine the sensitivity of the Pettitt test to detect abrupt changes in mean. Hydrol. Sci. J. 2016, 61, 245–254. [Google Scholar] [CrossRef] [Green Version]
- Ostertagova, E.; Ostertag, O.; Kováč, J. Methodology and Application of the Kruskal-Wallis Test. Appl. Mech. Mater. 2014, 611, 115–120. [Google Scholar] [CrossRef]
- Młyński, D.; Wałęga, A.; Petroselli, A. Verfication of empirical formulas for calculating annual peak flows with specific return period in the upper Vistula basin. Acta Sci. Pol. Form. Circumiectus 2018, 17, 145–154. [Google Scholar] [CrossRef]
- Czarnecka, M.; Nidzgorska–Lencewicz, J. Multiannual variability of seasonal precipitation in Poland. Water Environ. Rural Areas 2012, 12, 45–60. [Google Scholar]
- Gąsiorek, E.; Grządziel, M.; Musiał, E.; Rojek, M. Determination of relative precipitation index based on standardized precipitation index for monthly precipitation sums. Infrastruct. Ecol. Rural Areas 2012, 3, 181–195. [Google Scholar]
- Kopcińska, J.; Skowera, B.; Wojkowski, J.; Zając, E.; Ziernicka–Wojtaszek, A. Identification of the Dry and the Wet Months in the Opolskie Voivodeship on the Basis of Chosen Climate Indexes (1981–2010). Infrastruct. Ecol. Rural Areas 2018, 2, 421–434. [Google Scholar]
- Młyński, D.; Wałęga, A.; Bugajski, P.; Operacz, A.; Kurek, K. Verification of empirical formulas for calculating mean low flow with the view to evaluating available water resources. Acta Sci. Pol. Formatio Circumiectus 2019, 18, 83–92. [Google Scholar] [CrossRef]
- Niedźwiedź, T.E.; Łupikasza, I.; Pińskwar, Z.W.; Kundzewicz, M.; Stoffel, M.; Małarzewski, Ł. Climatological background of floods at the northern foothills of the Tatra Mountains. Theor. Appl. Climatol. 2014, 119, 273–284. [Google Scholar]
- Falarz, M. Long-term variability in reconstructed and observed snow coverover the last 100 winter seasons in Cracow and Zakopane (southern Poland). Clim. Res. 2002, 19, 247–256. [Google Scholar] [CrossRef] [Green Version]
- O’Geen, A.; Dahlgren, R.; Swarowsky, A.; Tate, K.; Lewis, D.; Singer, M. Research connects soil hydrology and stream water chemistry in California oak woodlands. Calif. Agric. 2010, 64, 78–84. [Google Scholar] [CrossRef] [Green Version]
- Büttner, G.; Maucha, G. The Thematic Accuracy of Corine Land Cover 2000; EEA Technical Report 7; European Environmental Agency: Copenhagen, Denmark, 2006. [Google Scholar]
- Novotny, E.V.; Stefan, H.G. Stream flow in Minnesota: Indicator of climate change. J. Hydrol. 2007, 334, 319–333. [Google Scholar] [CrossRef]
- Taha, H. Urban climates and heat islands; albedo, evapotranspiration, and anthropogenic heat. Energy Build. 1997, 25, 99–103. [Google Scholar] [CrossRef] [Green Version]
- Chandler, T.J. Urban Climatology and Its Relevance to Urban Design; World Meteorological Organization: Geneva, Switzerland, 1976. [Google Scholar]
- Calhoun, D.L.; Frick, E.A.; Buell, G.R. Effects of urban development on nutrient loads and streamflow, upper Chattahoochee River basin, Georgia, 1976–2001. In Proceedings of the 2003 Georgia Water Resources Conference, Athens, GA, USA, 23–24 April 2003. [Google Scholar]
- de la Crétaz, A.L.; Barten, P.K. Land Use Effects on Streamflow and Water Quality in the Northeastern United States; CRC Press: Boca Raton, FL, USA, 2007. [Google Scholar]
- Jeppesen, J.; Christensen, S. Modelling of the urban water cycle and the consequences of massive rain runoff infiltration for Copenhagen. IAHS Publ. 2009, 20, 34–41. [Google Scholar]
- Leopold, L.B. Hydrology for Urban Land Planning—A Guide Book on the Hydrologic Effects of Urban Landuse; US Geological Survey Circular: Reston, VA, USA, 1968; p. 554.
- Srinivasan, V.; Seto, K.C.; Emerson, R.; Gorelick, S.M. The impact of urbanization on water vulnerability: A coupled human–environment system approach for Chennai, India. Glob. Environ. Chang. 2013, 23, 229–239. [Google Scholar] [CrossRef]
- Booth, D.B.; Jackson, C.R. Urbanization of aquatics e degradation thresholds, stormwater detention, and limits of mitigation. J. Am. Water Resour. As. 1997, 33, 1077–1090. [Google Scholar] [CrossRef]
- Oudin, L.; Salavati, B.; Furusho–Percot, C.; Ribstein, P.; Saadi, M. Hydrological impacts of urbanization at the catchment scale. J. Hydrol. 2018, 559, 774–786. [Google Scholar] [CrossRef] [Green Version]
- Yang, G.; Bowling, L.C.; Cherkauer, K.A.; Pijanowski, B.C.; Niyogi, D. Hydroclimatic response of watersheds to urban intensity—An Observational and modelling based analysis for the White River basin, Indiana. J. Hydrometeorol. 2010, 11, 122–138. [Google Scholar] [CrossRef] [Green Version]
- Bosch, D.J.; Lohani, V.K.; Dymond, R.L.; Kibler, D.F.; Stephenson, K. Hydrological and fiscal impacts of residential development: Virginia case study. J. Water Resour. Plann. Manag. 2003, 129, 107–114. [Google Scholar] [CrossRef]
- Wałęga, A.; Radecki–Pawlik, A.; Cupak, A.; Hathaway, J.; Pukowiec, M. Influence of Changes of Catchment Permeability and Frequency of Rainfall on Critical Storm Duration in an Urbanized Catchment—A Case Study, Cracow, Poland. Water 2019, 11, 2557. [Google Scholar] [CrossRef] [Green Version]
- Bhaduri, B.; Minner, M.; Tatalovich, S.; Harbor, J. Long-term hydrologic impact of urbanization: A tale of two models. J. Water Resour. Plann. Manag. 2001, 127, 13–19. [Google Scholar] [CrossRef]
- Assouline, S.; Mualem, Y. Infiltration during soil sealing: The effect of areal heterogeneity of soil hydraulic properties. Water Resour. Res. 2002, 38, 22-1–22-9. [Google Scholar] [CrossRef]
- Haase, D.; Nuissl, H. Does urban sprawl drive changes in the water balance and policy?: The case of Leipzig (Germany) 1870–2003. Landsc. Urban Plan. 2007, 80, 1–13. [Google Scholar] [CrossRef]
- Perry, T.; Nawaz, R. An investigation into the extent and impacts of hard surfacing of domestic gardens in an area of Leeds, United Kingdom. Landsc. Urban Plan. 2008, 86, 1–13. [Google Scholar] [CrossRef]
- Im, S.; Kim, H.; Kim, C.; Jang, C. Assessing the impacts of land use changes on watershed hydrology using MIKE SHE. Environ. Geol. 2009, 57, 231–239. [Google Scholar] [CrossRef]
- Dietz, M.E. Low impact development practices: A review of current research and recommendations for future directions. Water Air Soil Pollut. 2007, 186, 351–363. [Google Scholar] [CrossRef]
- Du, J.; Qian, L.; Rui, H.; Zuo, T.; Zheng, D.; Xu, Y.; Xu, C.Y. Assessing the effects of urbanization on annual runoff and flood events using an integrated hydrological modelling system for Qinhuai River basin, China. J. Hydrol. 2012, 464, 127–139. [Google Scholar] [CrossRef]
- Mioduszewski, W.; Querner, E.; Kowalewski, Z.; Ślesnicka, A. Wpływ eksploatacji dolinowego systemu melioracyjnego na zasoby wodne małej zlewni rzecznej [Impact of exploitation of valley drainage system on water resources in small river catchments]. Zesz. Nauk. Akad. Rol. We Wrocławiu 1996, 4, 265–278. [Google Scholar]
- Anderson, H.W.; Hoover, M.D.; Reinhart, K.G. Forests and Water: Effects of Forest Management on Floods, Sedimentation, and Water Supply; USDA For. Serv. Ge. Tech. Rep. PSW-18/1976; Pacific Southwest Forest and Range Experiment Station: Berkeley, CA, USA, 1976. [Google Scholar]
- Bowling, L.C.; Lettenmaier, D.P. Evaluation of the Effects of Forest Roads on Streamflow in Hard and Ware Creeks, Washington; Water Resource Series; Technical Report No. 155; University of Washington: Washington, DC, USA, 2002. [Google Scholar]
- Calder, I.R.; Aylward, B. Forest and floods: Moving to an evidence-based approach to watershed and integrated flood management. Water Int. 2006, 31, 87–99. [Google Scholar] [CrossRef]
Figure 1.
Orthophoto map of the Prądnik river basin (a) and its subcatchments (b).

Figure 2.
Landscape attributes of the Prądnik river basin: (a) hypsometry; (b) slope inclination; (c) bedrock transmissivity; (d) soil types; (e) soil texture; (f) land use/landcover (CLC 2018).
Figure 2.
Landscape attributes of the Prądnik river basin: (a) hypsometry; (b) slope inclination; (c) bedrock transmissivity; (d) soil types; (e) soil texture; (f) land use/landcover (CLC 2018).

Figure 3.
Course of the annual sum of precipitation for the Prądnik river basin in the period 1990–2017.
Figure 3.
Course of the annual sum of precipitation for the Prądnik river basin in the period 1990–2017.

Figure 4.
Course of low flows for the Prądnik river basin in the period 2002–2017.

Figure 5.
Urban development in the Prądnik river basin in period 1990–2018.

Figure 6.
(a) Mean annual precipitation and (b) annual climatic water balance in the Prądnik river basin.
Figure 6.
(a) Mean annual precipitation and (b) annual climatic water balance in the Prądnik river basin.


Table 1.
Review of water-holding capacity (mm∙m−3) of main soil texture groups.
| Texture | Source/Author | |||||
|---|---|---|---|---|---|---|
| [37] | [38] | [39] | [36] | [40] | ||
| Mean | Maximum | |||||
| Coarse sand | 50 | 21–63 | 60 | – | – | 67 |
| Fine sand | 145 | 63–83 | 100 | 100 | 300 | – |
| Loamy sand | 167 | 92–100 | 140 | 125 | 325 | 100 |
| Sandy loam | 200 | 105–117 | 200 | 150 | 350 | – |
| Fine sandy loam | – | 125–167 | – | – | – | 158 |
| Silty loam | 350 | 167–208 | – | – | – | 200 |
| Silty clay loam | 200 | 145–167 | – | – | – | – |
| Silty clay | 217 | 125–142 | – | – | – | 133 |
| Clay | 200 | 100–125 | 400 | 250 | 500 | 113 |
| Self-mulching clay | – | – | 450 | – | – | – |
| Light sandy clay loam | – | – | 230 | – | – | – |
| Loam | 317 | – | 270 | 200 | 400 | – |
| Sandy clay loam | 158 | – | 280 | – | – | – |
| Clay loam | 183 | – | 320 | 230 | 450 | – |
Table 2.
Pluvial classification on the basis of relative precipitation index (RPI).
| Pluvial Classes | RPI (%) | |
|---|---|---|
| Month | Year | |
| Extremely dry | <25 | <50 |
| Very dry | 26–50 | 50–75 |
| Dry | 51–75 | 76–90 |
| Average | 76–125 | 91–110 |
| Wet | 126–150 | 111–125 |
| Very wet | 151–200 | 126–150 |
| Extremely wet | >200 | >150 |
Table 3.
RPI index values (%) and pluvial classification of months and years for the Prądnik basin in the period 1990–2017.
Table 3.
RPI index values (%) and pluvial classification of months and years for the Prądnik basin in the period 1990–2017.
| Years | Months | ||||||||||||
|---|---|---|---|---|---|---|---|---|---|---|---|---|---|
| 1 | 2 | 3 | 4 | 5 | 6 | 7 | 8 | 9 | 10 | 11 | 12 | 1–12 | |
| 1990 | 38 | 69 | 46 | 117 | 92 | 79 | 169 | 123 | 150 | 31 | 107 | 36 | 88 |
| 1991 | 20 | 48 | 29 | 68 | 131 | 81 | 108 | 124 | 94 | 105 | 94 | 84 | 82 |
| 1992 | 66 | 52 | 112 | 68 | 72 | 9 | 80 | 13 | 86 | 155 | 91 | 115 | 77 |
| 1993 | 68 | 77 | 88 | 48 | 63 | 140 | 153 | 76 | 91 | 52 | 66 | 74 | 83 |
| 1994 | 103 | 16 | 157 | 179 | 122 | 72 | 88 | 176 | 124 | 110 | 73 | 91 | 109 |
| 1995 | 77 | 65 | 85 | 113 | 118 | 265 | 36 | 107 | 197 | 23 | 50 | 68 | 100 |
| 1996 | 53 | 39 | 45 | 111 | 215 | 142 | 118 | 202 | 217 | 50 | 92 | 17 | 109 |
| 1997 | 27 | 76 | 57 | 73 | 103 | 192 | 418 | 47 | 80 | 97 | 75 | 74 | 110 |
| 1998 | 95 | 85 | 88 | 123 | 69 | 246 | 130 | 159 | 118 | 147 | 88 | 71 | 118 |
| 1999 | 61 | 139 | 44 | 80 | 71 | 256 | 71 | 84 | 77 | 144 | 98 | 54 | 98 |
| 2000 | 87 | 75 | 185 | 54 | 98 | 110 | 277 | 101 | 57 | 24 | 71 | 108 | 104 |
| 2001 | 71 | 54 | 96 | 203 | 126 | 146 | 326 | 199 | 182 | 32 | 109 | 84 | 136 |
| 2002 | 91 | 110 | 51 | 89 | 82 | 163 | 99 | 123 | 99 | 134 | 47 | 38 | 94 |
| 2003 | 82 | 30 | 60 | 90 | 167 | 46 | 118 | 61 | 68 | 91 | 41 | 88 | 78 |
| 2004 | 81 | 146 | 123 | 48 | 93 | 71 | 159 | 70 | 56 | 65 | 114 | 27 | 88 |
| 2005 | 164 | 80 | 61 | 51 | 136 | 91 | 155 | 171 | 34 | 17 | 45 | 197 | 100 |
| 2006 | 61 | 65 | 98 | 84 | 109 | 131 | 26 | 231 | 46 | 27 | 136 | 38 | 88 |
| 2007 | 213 | 86 | 115 | 34 | 55 | 129 | 110 | 36 | 278 | 79 | 157 | 36 | 111 |
| 2008 | 67 | 38 | 115 | 73 | 64 | 42 | 257 | 83 | 168 | 82 | 57 | 72 | 93 |
| 2009 | 48 | 95 | 131 | 6 | 125 | 335 | 146 | 78 | 57 | 148 | 114 | 94 | 115 |
| 2010 | 86 | 68 | 59 | 68 | 403 | 171 | 314 | 267 | 152 | 16 | 122 | 106 | 153 |
| 2011 | 47 | 31 | 31 | 30 | 67 | 56 | 313 | 53 | 21 | 43 | 0 | 75 | 64 |
| 2012 | 143 | 87 | 36 | 96 | 53 | 194 | 139 | 52 | 68 | 171 | 52 | 50 | 95 |
| 2013 | 118 | 60 | 129 | 47 | 181 | 378 | 49 | 76 | 126 | 23 | 115 | 49 | 113 |
| 2014 | 86 | 38 | 70 | 72 | 156 | 139 | 177 | 160 | 94 | 51 | 61 | 60 | 97 |
| 2015 | 106 | 61 | 87 | 47 | 163 | 63 | 103 | 65 | 117 | 74 | 125 | 20 | 86 |
| 2016 | 59 | 179 | 64 | 94 | 88 | 60 | 217 | 104 | 40 | 196 | 68 | 86 | 105 |
| 2017 | 35 | 45 | 79 | 186 | 97 | 85 | 122 | 101 | 234 | 145 | 114 | 52 | 108 |
Color codes for the pluvial classes are presented in Table 2.
Table 4.
Values of descriptive statistics for the low flows time series in the period 2002–2017.
| Min (m3·s−1) | Mean (m3·s−1) | Median (m3·s−1) | Max (m3·s−1) | s (m3·s−1) | Cs | Ske | K |
|---|---|---|---|---|---|---|---|
| 0.20 | 0.30 | 0.28 | 0.51 | 0.09 | 0.29 | 1.68 | 2.38 |
S—standard deviation; Cs—coefficient of variation; Ske—skewness; K—kurtosis.
Table 5.
Results of the trend analysis conducted by selected tests for the Prądnik basin.
| Test | Value of Test Statistics | Probability |
|---|---|---|
| Mann–Kendall | −0.045 | 0.964 |
| Pettitt | 26.000 | 0.788 |
| Kruskal–Wallis | 0.279 | 0.600 |
Table 6.
Change of impervious cover extent during 1990–2018, the Prądnik river basin.
| CORINE Landcover | 1990 | 2000 | 2006 | 2012 | 2018 | |||||
|---|---|---|---|---|---|---|---|---|---|---|
| Area (ha) | Δ (%) | Area (ha) | Δ (%) | Area (ha) | Δ (%) | Area (ha) | Δ (%) | Area (ha) | Δ (%) | |
| 112 | 1059 | – | 1042 * | −1.6 * | 1708 | 61.3 | 1735 | 63.8 | 1954 | 84.5 |
| 121 | 177 | – | 197 | 11.3 | 253 | 42.9 | 271 | 53.1 | 248 | 40.1 |
| 133 | 20 | – | 60 | 200.0 | – | – | – | – | – | – |
| 142 | 41 | – | 24 | −41.4 | 40 | −2.4 | 40 | −2.4 | 28 | −31.7 |
| Total | 1297 | – | 1323 * | 20.0 | 2001 | 54.3 | 2046 | 57.7 | 2230 | 71.9 |
112—discontinuous urban fabric; 121—industrial or commercial units; 133—construction areas; 142—sport and leisure facilities. * During mapping of CLC in 2000, impervious surfaces area of 234 ha were not recognized by software. Total sum of IS in 2000 CLC is 1557 ha.
Table 7.
Change of water retention potential during 1990–2018, the Prądnik river basin.
| Year | IS (ha) | SWHCL (mil·m3) | Δ SWHCL (%) | PWL (mil·m3) | Δ PWL (%) | TWL (mil·m3) | Δ TWL (%) | ||
|---|---|---|---|---|---|---|---|---|---|
| Mean | Max | Mean | Max | ||||||
| 1990 | 1297 | 2.005 | 4.642 | – | – | 3.095 | – | 8.122 | – |
| 2000 | 1557 | 2.432 | 5.649 | +21.3 | +21.7 | 3.720 | +20.2 | 9.840 | +21.2 |
| 2006 | 2001 | 3.087 | 7.146 | +53.9 | +53.9 | 4.665 | +50.7 | 12.417 | +52.9 |
| 2012 | 2046 | 3.147 | 7.230 | +56.9 | +55.7 | 4.766 | +54.0 | 12.691 | +56.3 |
| 2018 | 2230 | 3.380 | 8.002 | +68.6 | +72.3 | 5.232 | +69.0 | 14.182 | +74.6 |
IS—impervious surfaces; PWL—potential water loss; SWHCL—soil water-holding capacity loss; TWL—total water loss.
© 2020 by the authors. Licensee MDPI, Basel, Switzerland. This article is an open access article distributed under the terms and conditions of the Creative Commons Attribution (CC BY) license (http://creativecommons.org/licenses/by/4.0/).
Share and Cite
MDPI and ACS Style
Lepeška, T.; Wojkowski, J.; Wałęga, A.; Młyński, D.; Radecki-Pawlik, A.; Olah, B. Urbanization—Its Hidden Impact on Water Losses: Prądnik River Basin, Lesser Poland. Water 2020, 12, 1958. https://doi.org/10.3390/w12071958
AMA Style
Lepeška T, Wojkowski J, Wałęga A, Młyński D, Radecki-Pawlik A, Olah B. Urbanization—Its Hidden Impact on Water Losses: Prądnik River Basin, Lesser Poland. Water. 2020; 12(7):1958. https://doi.org/10.3390/w12071958
Chicago/Turabian StyleLepeška, Tomáš, Jakub Wojkowski, Andrzej Wałęga, Dariusz Młyński, Artur Radecki-Pawlik, and Branislav Olah. 2020. "Urbanization—Its Hidden Impact on Water Losses: Prądnik River Basin, Lesser Poland" Water 12, no. 7: 1958. https://doi.org/10.3390/w12071958
Note that from the first issue of 2016, this journal uses article numbers instead of page numbers. See further details here.