Regional Isotopic Signatures of Groundwater in Croatia

1
Croatian Geological Survey, Department of Hydrogeology and Engineering Geology, 10000 Zagreb, Croatia
2
Kemolab Ltd., 10000 Zagreb, Croatia
*
Author to whom correspondence should be addressed.
Water 2020, 12(7), 1983; https://doi.org/10.3390/w12071983
Submission received: 8 May 2020
/
Revised: 8 July 2020
/
Accepted: 10 July 2020
/
Published: 13 July 2020
(This article belongs to the Special Issue Application of Stable Isotopes and Tritium in Hydrology)
Abstract
:Tracer methods are useful for investigating groundwater travel times and recharge rates and analysing impacts on groundwater quality. The most frequently used tracers are stable isotopes and tritium. Stable isotopes of oxygen (δ18O) and hydrogen (δ2H) are mainly used as indicators of the recharge condition. Tritium (3H) is used to estimate an approximate mean groundwater age. This paper presents the results of an analysis of stable isotope data and tritium activity in Croatian groundwater samples that were collected between 1997 and 2014 at approximately 100 sites. The composition of the stable isotopes of groundwater in Croatia originates from recent precipitation and is described using two regional groundwater lines. One of them is applied to groundwater accumulated in the aquifers in the Pannonian part of Croatia and the other is for groundwater accumulated in the Dinaric karst of Croatia. The isotope content shows that the studied groundwater is mainly modern water. A mix of sub-modern and modern water is mostly accumulated in semi-confined porous aquifers in northern Croatia, deep carbonate aquifers, and (sub)thermal springs.
1. Introduction
Water molecules have isotopic “fingerprints” according to the differing ratios of their oxygen and hydrogen isotopes and their radioisotope activity. The most frequently used isotopes in groundwater hydrology are stable isotopes and tritium, which naturally occur in the environment. Consequently, they are called “environmental isotopes”. All three isotopes enter the hydrological cycle via precipitation. Stable isotopes of oxygen (δ18O) and hydrogen (δ2H) are mainly used as indicators of the recharge condition. Tritium (3H) is used to estimate the approximate groundwater age.
The global monitoring of the isotopic composition of monthly precipitation is carried out through the Global Network of Isotopes in Precipitation (GNIP), which was established in 1961 by the International Atomic Energy Agency (IAEA) and the World Meteorological Organization (WMO). The objective of this network is the systematic collection of the isotopic data of precipitation and the determination of temporal and spatial variations in the isotopes within precipitation. Isotopic data include the tritium activity concentration and stable isotopes of hydrogen and oxygen isotopes (δ2H and δ18O values), as well as climatological data (mean monthly temperature, monthly precipitation amount, and atmospheric water vapour pressure) [1].
The stable isotopes of hydrogen (1H, 2H) and oxygen (16O, 18O) are natural environmental tracers with broad applications in groundwater hydrology [2,3,4,5,6,7,8]. They help to reveal the groundwater origin and recharge [9,10,11], as well as the mean groundwater age in some cases [12,13]. The content of stable isotopes in water is affected by the sources of precipitating air masses, which are linked to climate characteristics such as ambient temperature, precipitation amount, wind speed, and humidity. Fractionation processes are responsible for the spatial and temporal variations in water isotope composition [14,15,16], as well as orographic effects [17], distance from the coast, and latitude [18,19].
The isotopic composition of groundwater in both karst and alluvial aquifers in Croatia was previously studied for different purposes. The study of general functioning of the karst hydrogeological system [20] and the delineation of catchment areas of karst springs [21] were performed using an analysis of the distribution of stable isotopes in groundwater. Using stable isotope composition, the recharge areas of karst aquifers were considered [22,23,24,25]. A lumped parameter approach was used for the groundwater age estimation [12,26]. Several studies have been carried out where isotope composition of precipitation, surface water, and groundwater were employed for identification of groundwater recharge sources and for improvement of the conceptual model of the porous aquifer systems [27,28,29,30,31].
The isotopic composition of groundwater was studied in the neighbouring countries also. Mezga et al. [32] presented the isotopic composition of sampled groundwater that was monitored over three years and performed a comparison with previous studies regarding the isotopic composition of precipitation, surface water, and groundwater in Slovenia. Nikolov et al. [33] concluded that most of the analysed groundwater in Vojvodina (Serbia) can be characterized as modern waters, recharged mostly from precipitation.
Tritium (3H) is the radioactive isotope of hydrogen with a half-life of 12.32 years [34]. It decays into helium−3 (3He). Tritium is naturally produced in the atmosphere by the reaction of cosmic radiation with nitrogen atoms. In hydrology and oceanography, 3H content is expressed in tritium units (TU). Other disciplines may use the 3H activity concentration in Bq (Bequerel), where 1 TU = 0.118 Bq/L [35,36]. The natural 3H activity concentration in precipitation varies within the range of 5 to 10 TU, depending on the location [9,37]. Prior to atmospheric nuclear bomb testing in the 1950s, the mean 3H activity concentrations were approximately 2 to 8 TU [38]. Due to nuclear bomb testing, the maximum concentrations of 3H in the precipitation in the northern hemisphere reached more than 5000 TU in 1963 [39]. The data over the last twenty years show an almost constant mean annual 3H concentration [40,41]. However, seasonal variations are observable. The lowest 3H concentrations are distributed in the winter months. Duliński et al. [40] suggest that these low 3H activity concentrations likely reflect episodes of specific circulation patterns over Europe, where the fast transport of oceanic water vapour from the Atlantic Ocean to central Europe occurs without significant rainout and moisture exchange with the surface of the continent. The maximum monthly 3H activity concentration is observed in the late spring and summer months [23,40,42,43,44,45,46,47]. The extremely high 3H activity concentrations occasionally recorded are likely linked to episodic emissions of technogenic tritium on the European continent [48]. The possible sources are nuclear power reactors and the applications of artificial tritium in medicine and the watch industry [40].
Since it is relatively geochemically conservative, tritium is an excellent tracer for the investigation of groundwater flow dynamics as well as giving an approximate groundwater age at a time scale of less than 100 years [2,26,49,50]. Groundwater 3H activity concentrations reflect the 3H activity concentration when the water, which contributes to groundwater recharge, was in the contact with the atmosphere. Since 3H decays to 3He, the application of the 3H/3He method, which measures the relative abundance of 3H and 3He in a groundwater sample [49], allows for a more precise definition of the groundwater age.
This study aims to evaluate the regional isotopic signatures of groundwater in Croatia. The study is focused on comparisons between groundwater stable isotopes and precipitation isotope data. To achieve this, we analyse the existing data on stable isotopes (δ2H and δ18O) and tritium activity (3H) stored in the database of the Croatian Geological Survey (HGI-CGS), as well as data from published papers. Isotopic data are taken from studies on drinking groundwater. An overview of the sampling sites from different aquifer systems in which water samples were collected between 1997 and 2014 is presented, and the descriptive statistics of isotopic data are shown. We also discuss data distribution and the various correlations among the data.
2. Materials and Methods
2.1. Study Area
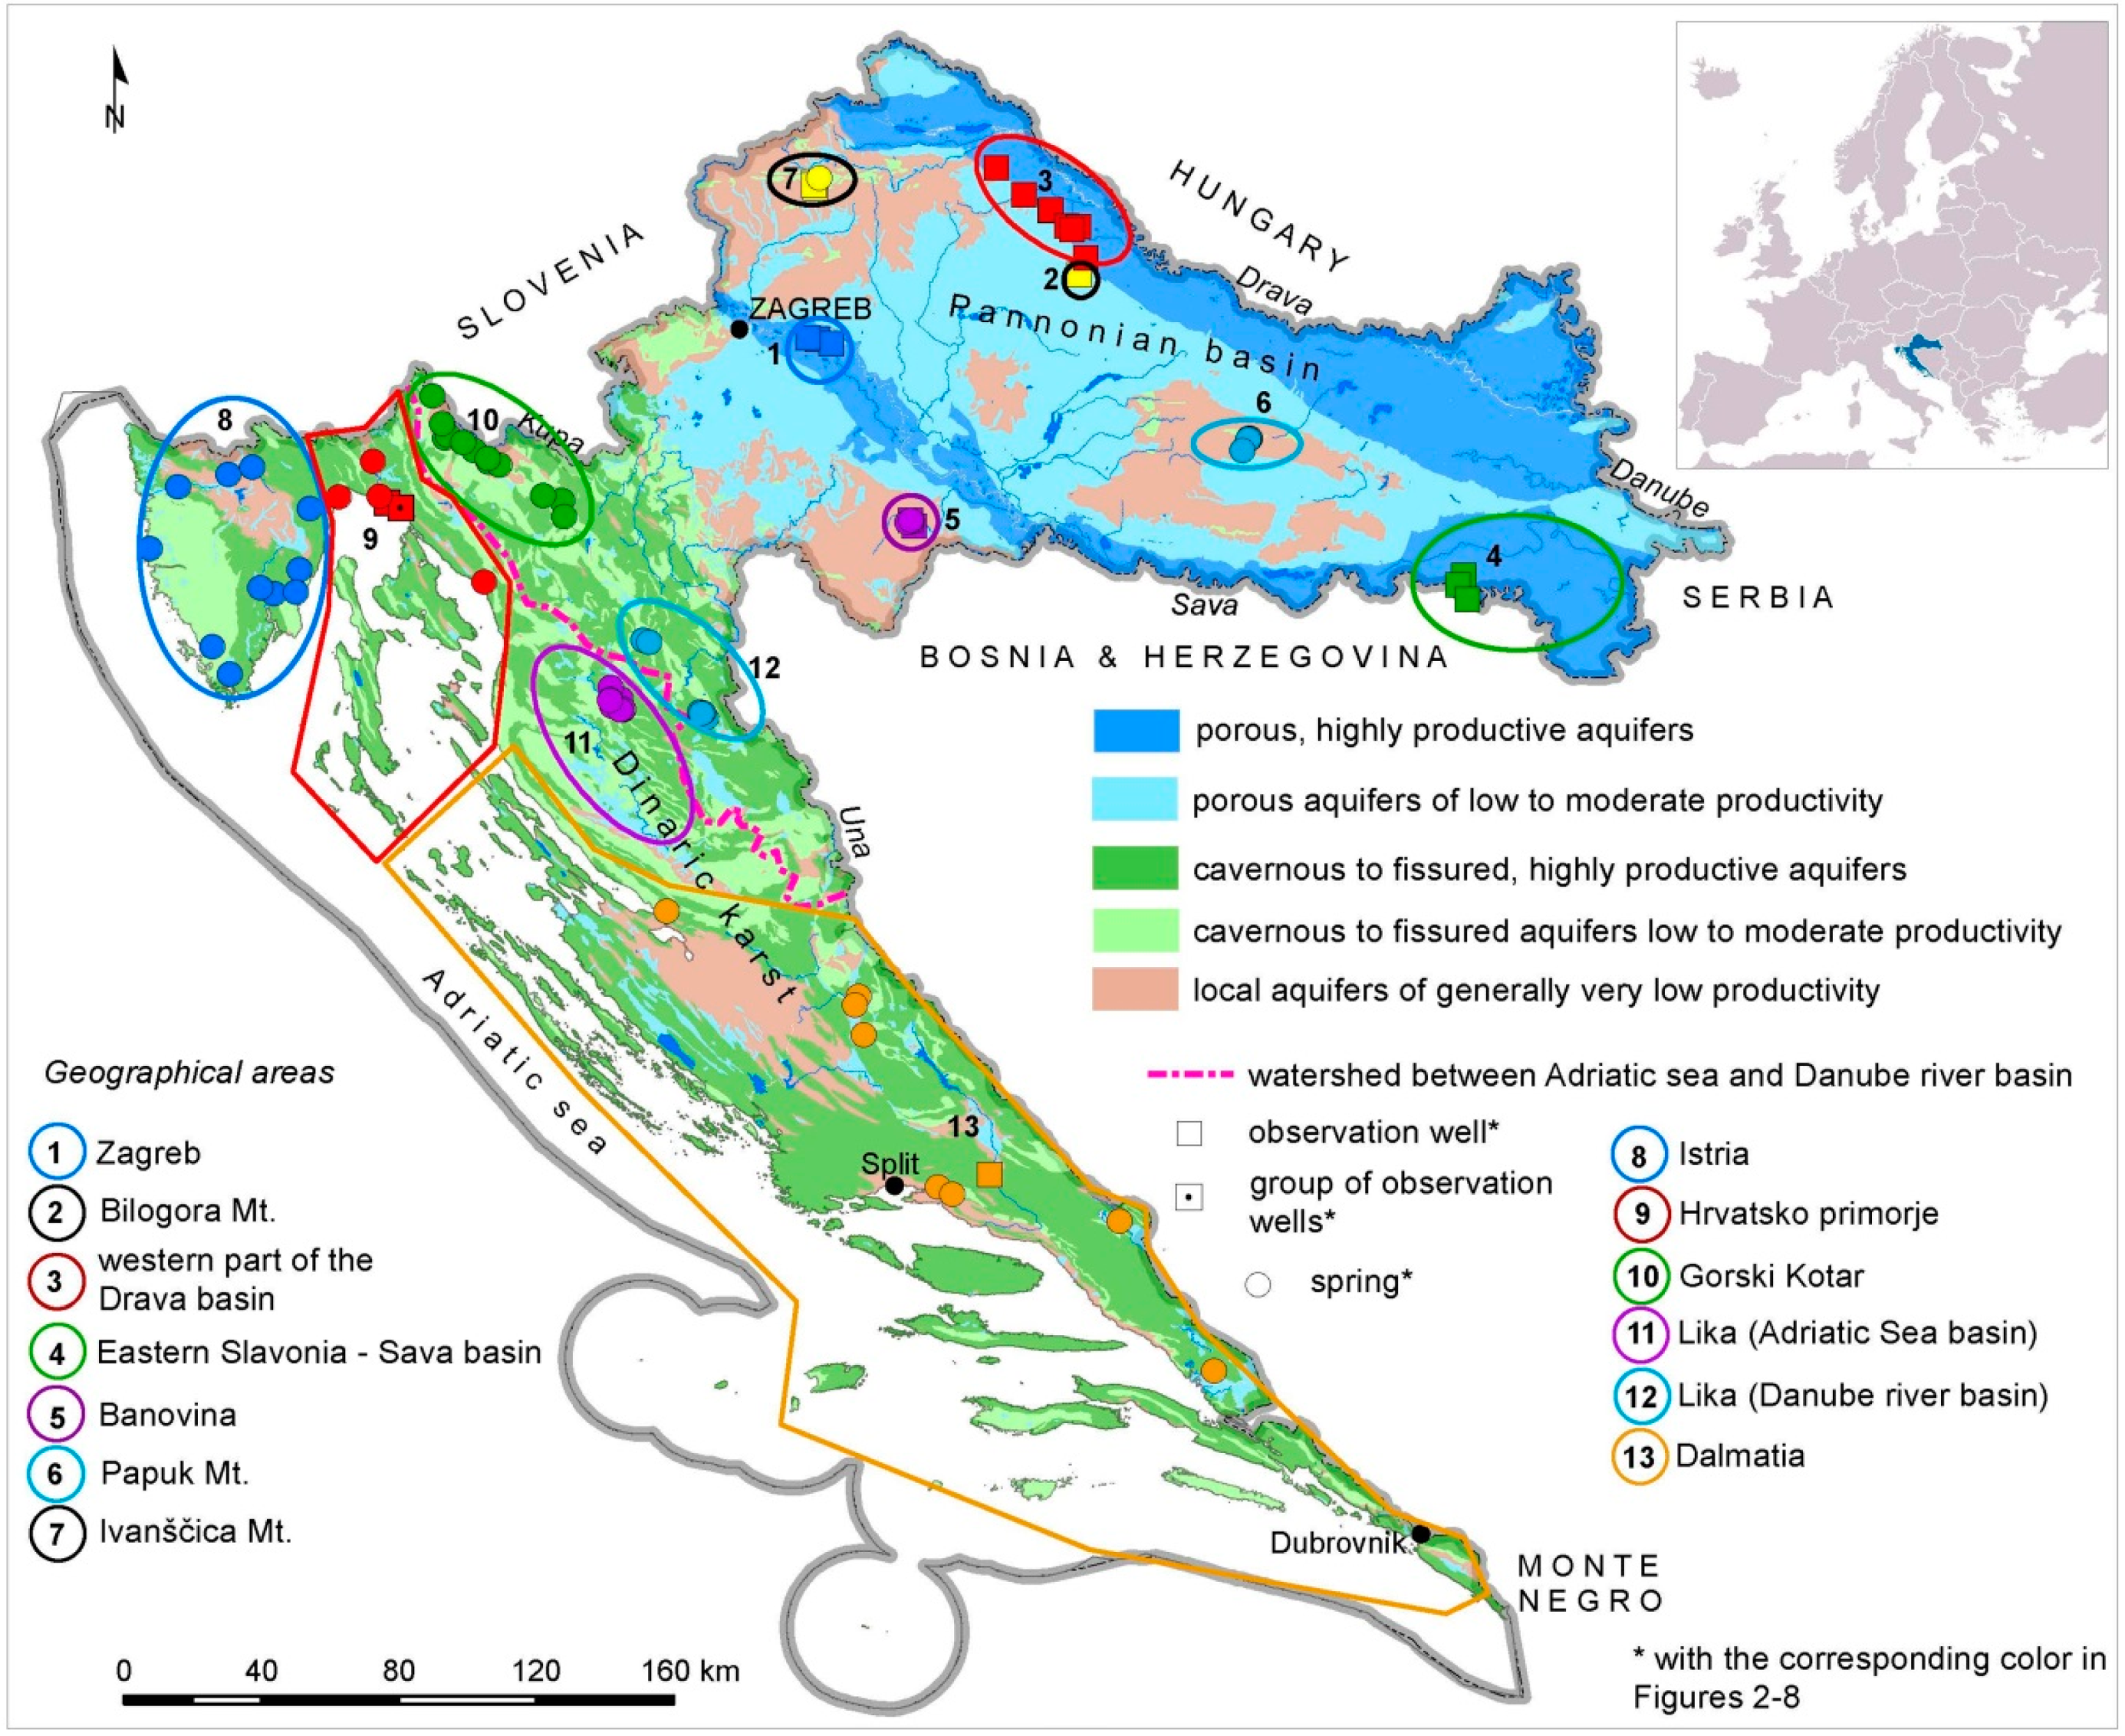
Croatia is a small southern European country, comprising an area of only 56,538 km2. From a hydrogeological and even water management standpoint, the country can be divided into two hydrogeological regions: the Northern or Pannonian region and the Southern or Dinaric karst region (Figure 1). Northern Croatia is situated in a southwestern part of the Pannonian Basin where large lowlands are dominant along the two Danube tributaries—the river Sava and Drava and their major tributaries—and along the river Danube in the east-most part of the region. Quaternary sediments form thick and highly permeable aquifers within these lowlands [51,52]. In between the lowlands, there is a hilly region (in some places mountainous), composed mainly of low permeable deposits ranging in age from the Palaeozoic to Quaternary, while only smaller areas are occupied by permeable carbonate deposits of the Triassic age, which represent an important aquifer. The altitudes of these lowlands vary from approximately 120 m a.s.l. in the west to approximately 80 m a.s.l. in the east. In the mountainous region, the altitudes can reach 1000 m a.s.l.
The karst area of Croatia is mainly composed of carbonate rocks of the Mesozoic age. Carbonate rocks, especially limestone, have developed conduit and fissured porosity, which accumulate and transfer a significant amount of groundwater. Besides the existence of numerous geomorphological phenomena, the basic characteristics of the karst area are the absence of surface water, a high velocity of groundwater flow, groundwater discharge at the springs of over ten m3/s, significant groundwater amounts that discharge into the sea, and the strong impact of the sea on coastal aquifers. There are frequent occurrences here of karst poljes with springs on one side and ponors on the other; this sometimes also means that the same water sinks and reappears multiple times on several levels [poljes] before it reaches the final erosion base [53,54,55]. The altitudes of these areas vary from approximately 1900 m a.s.l. in the high mountains to 0 m a.s.l. at the coast.
Croatia is divided into two main climate regions—Continental and Mediterranean—with some variations within those climate zones [56]. According to Köppen’s classification, most of Croatia has a moderately warm rainy climate (C), whereas only the highest mountain areas have a snow-forest climate (D). The Dalmatian coast and islands have a Mediterranean climate (Cs), while in other parts of Croatia there are different types of moderately warm and humid climates (Cf) which differ according to the warmth of summer months (hot, warm or fresh summers) and annual precipitation. The lowest mean annual air temperature occurs at the highest mountains and reaches 2–3 °C. In the lowlands of northern Croatia, the average air temperature is around 11 °C, while in the Adriatic area, it ranges from 13 °C in the north to 17 °C in the far south. Summer is the driest season along the coast, and winter is the rainiest season, with twice the amount of precipitation as in the summer. The continental part of Croatia has a different climate. The mean annual precipitation in Croatia ranges from about 300 mm to just above 3500 mm. The majority of precipitation is caused by south-western and western air circulation (cyclogenetic area of the Mediterranean), while a significantly smaller amount of precipitation is caused by relatively dry air masses coming from the northeast. The lowest annual precipitation, approximately 300 mm, can be found on the outer islands of the southern Adriatic. On the islands and coasts of central and northern Dalmatia and on the western coast of Istria, about 800 to 900 mm of precipitation can be expected. In continental Croatia, the mean annual precipitation decreases from west to east. In the western part (wider Zagreb area), it ranges from 1000 to 1500 mm, while in Eastern Slavonia, the mean annual precipitation reaches only 600 to 700 mm. Due to orographic influence, the greatest amount of precipitation can be found along the Dinaric Mountain Range, which extends from NW to SE, separating the coastal area from continental Croatia. In this area, the mean annual precipitation reaches 3000 to 3500 mm. The karst aquifers formed below this massif drain towards both regional basins, the Adriatic Sea basin in the south and the Danube basin in the north.
The hydrogeological structures, relief indents, and different climatological influences result in different isotopic signatures of the groundwater in Croatian regions.
2.2. Data and Methods
The first step in analysing the isotopic composition of groundwater was to collect as much measured data as possible. For this study, the data sources were mainly the HGI-CGS database, unpublished reports, and published articles. Groundwater samples for the analysis of stable isotopes and tritium in groundwater were collected in different periods from 1997 to 2014 (Table 1 and Table 2).
The stable isotope compositions were analysed at the Jožef Stefan Institute (Ljubljana, Slovenia) from 1997 to 1999. They were measured on a Varian MAT 250 mass spectrometer [46]. From 2001 to 2005, the measurements were conducted at Joanneum Research (Graz, Austria). An isotope ratio mass spectrometer (IRMS) was used for the measurements. The stable isotope composition of the water from 2005 to 2014 was determined at SILab [Stable Isotope Laboratory at the Physics Department, School of Medicine, University of Rijeka, Rijeka, Croatia]. An HDO Equilibration Unit (ISO Cal, Phoenix, AZ, USA) attached to the dual inlet port of a DeltaPlusXP (Thermo Finnigan, Waltham, MA, SAD) IRMS was used [23].
The results of the stable isotope composition are expressed as the δ-values per mill (‰) relative to the standard: δS/R = (RSample/RReference) − 1 [14,57,58,59]. RSample and RReference mark the isotope ratio (R = 2H/1H and R = 18O/16O) in the sample. The analytical precision of the determined δ-values was better than ±0.1‰ for δ18O and ±1‰ for δ2H.
Tritium activity concentrations were mostly analysed at the Department of Experimental Physics of the Ruđer Bošković Institute (RBI) in Zagreb. The gas proportional counting (GPC) technique was used until 2007 [60,61]. Since 2010, samples have been measured only using the liquid scintillation counting technique following electrolytic enrichment (LSC-EE), while during 2008 and 2009, both techniques were used [47,62,63,64,65]. The GPC technique was replaced by the LSC-EE technique for the following reasons: (i) the tritium activity approached natural pre-bomb levels (<5–10 TU), so the measurement of samples without tritium enrichment was not sufficiently precise and (ii) the GPC technique did not satisfy the requirements for a low detection limit and a high throughput of samples. In the RBI reports from 1997 to 1999, the results were expressed in Bq/L and later in TU and Bq/L. The detection limit was 2.5 TU, and the measurement uncertainty was between 2 and 5 TU, depending on the activity concentration [41]. The tritium activity concentrations in some samples collected from 2005 to 2008 were determined at the Isotope Hydrology Section Laboratory at the IAEA [26]. Tritium activity concentrations in the samples collected in 2013 and 2014 were measured at Hydrosys Labor Ltd. in Budapest, Hungary. The analytical method was based on the MSZ 19387:1987 standard. The results are expressed in TU.
For locations featuring a large amount of measured data, the descriptive statistics of stable isotopes and tritium activity concentrations (minimum and maximum values, arithmetic mean, and standard deviation) were used to describe the isotopic data of groundwater variability in the territory of Croatia. In several locations, there was only one measured datum, which was also used in the analysis. Data divided into two categories were used to create the attached diagrams. The term “mean values” is used when the displayed values represent the calculated arithmetic mean of all values measured so far at a particular measuring point. Individual results of all performed measurements were used on diagrams made based on “single values”. The first step in the analysis was to compare the δ2H and δ18O isotopic compositions of groundwater for each site considering the global meteoric water line (GMWL), as well as the local meteoric water lines (LMWLs).
If δ2H is plotted versus δ18O, the data group form a linear trend line, which can be described by its slope and intercept. The global meteoric water line (GMWL) defines the general relation between δ2H and δ18O in the precipitation on a global scale and is described by δ2H = 8 × δ18O + 10 [83,84,85]. For regional and local areas, the slope and intercept can differ from the GMWL, so for hydrogeological research, the regional/local meteorological water line (RMWL/LMWL) can be more appropriate. A comparison of RMWL/LMWL with GMWL shows local deviations from the world average. A direction coefficient (slope) of LMWL with a value greater than 8 indicates multiple moisture circulation, whereas a direction coefficient of less than 8 indicates greater moisture loss through evaporation [86].
There are different ways to calculate slope and intercept. Ordinary least squares regression (OLSR) is most commonly used for this purpose. Recently, reduced major axis (RMA) regression has been used. These methods do not, however, take into account the amount of precipitation. A new precipitation weighted least square regression (PWLSR) method and precipitation-weighted regressions (PWRMA) method have been applied more recently [87,88]. In this paper, the regional meteoric water lines (RMWL) for the continental and coastal parts of Croatia [89] are used alongside other published LMWLs [20,26,27,41,45,46,47,90,91,92,93] (Table 3).
Most LMWLs are defined by the least squares regression method; the exceptions are the LMWLs for Ljubljana and Portorož [47,91,92] and Zagreb [41]. Previous studies of different approaches to calculate the LMWL have led to the conclusion that all regression lines have similar values for both the slope and the intercept [41,47,91,92]. This indicates that the LMWLs defined by the OLSR method can be used for comparisons with the measured isotopic composition of groundwater in Croatian regions. The absence of a significant difference between the PWLSR slope and both the OLSR and RMA slopes indicates a relatively homogeneous distribution of monthly rainfall, as well as little small monthly rainfall with a minor excess of deuterium [41,88].
Deuterium excess (d-excess) is defined as d (‰) = δ2H − 8 × δ18O [83]. This is an isotope parameter that indicates the deviation of local samples from the GMWL and is an indicator of climate sensitivity at the source of humidity, as well as along the trajectory of air masses into the atmosphere [94]. In other words, d-excess reflects the prevailing conditions during the evolution and interaction or mixing of air masses en route to the precipitation site [86].
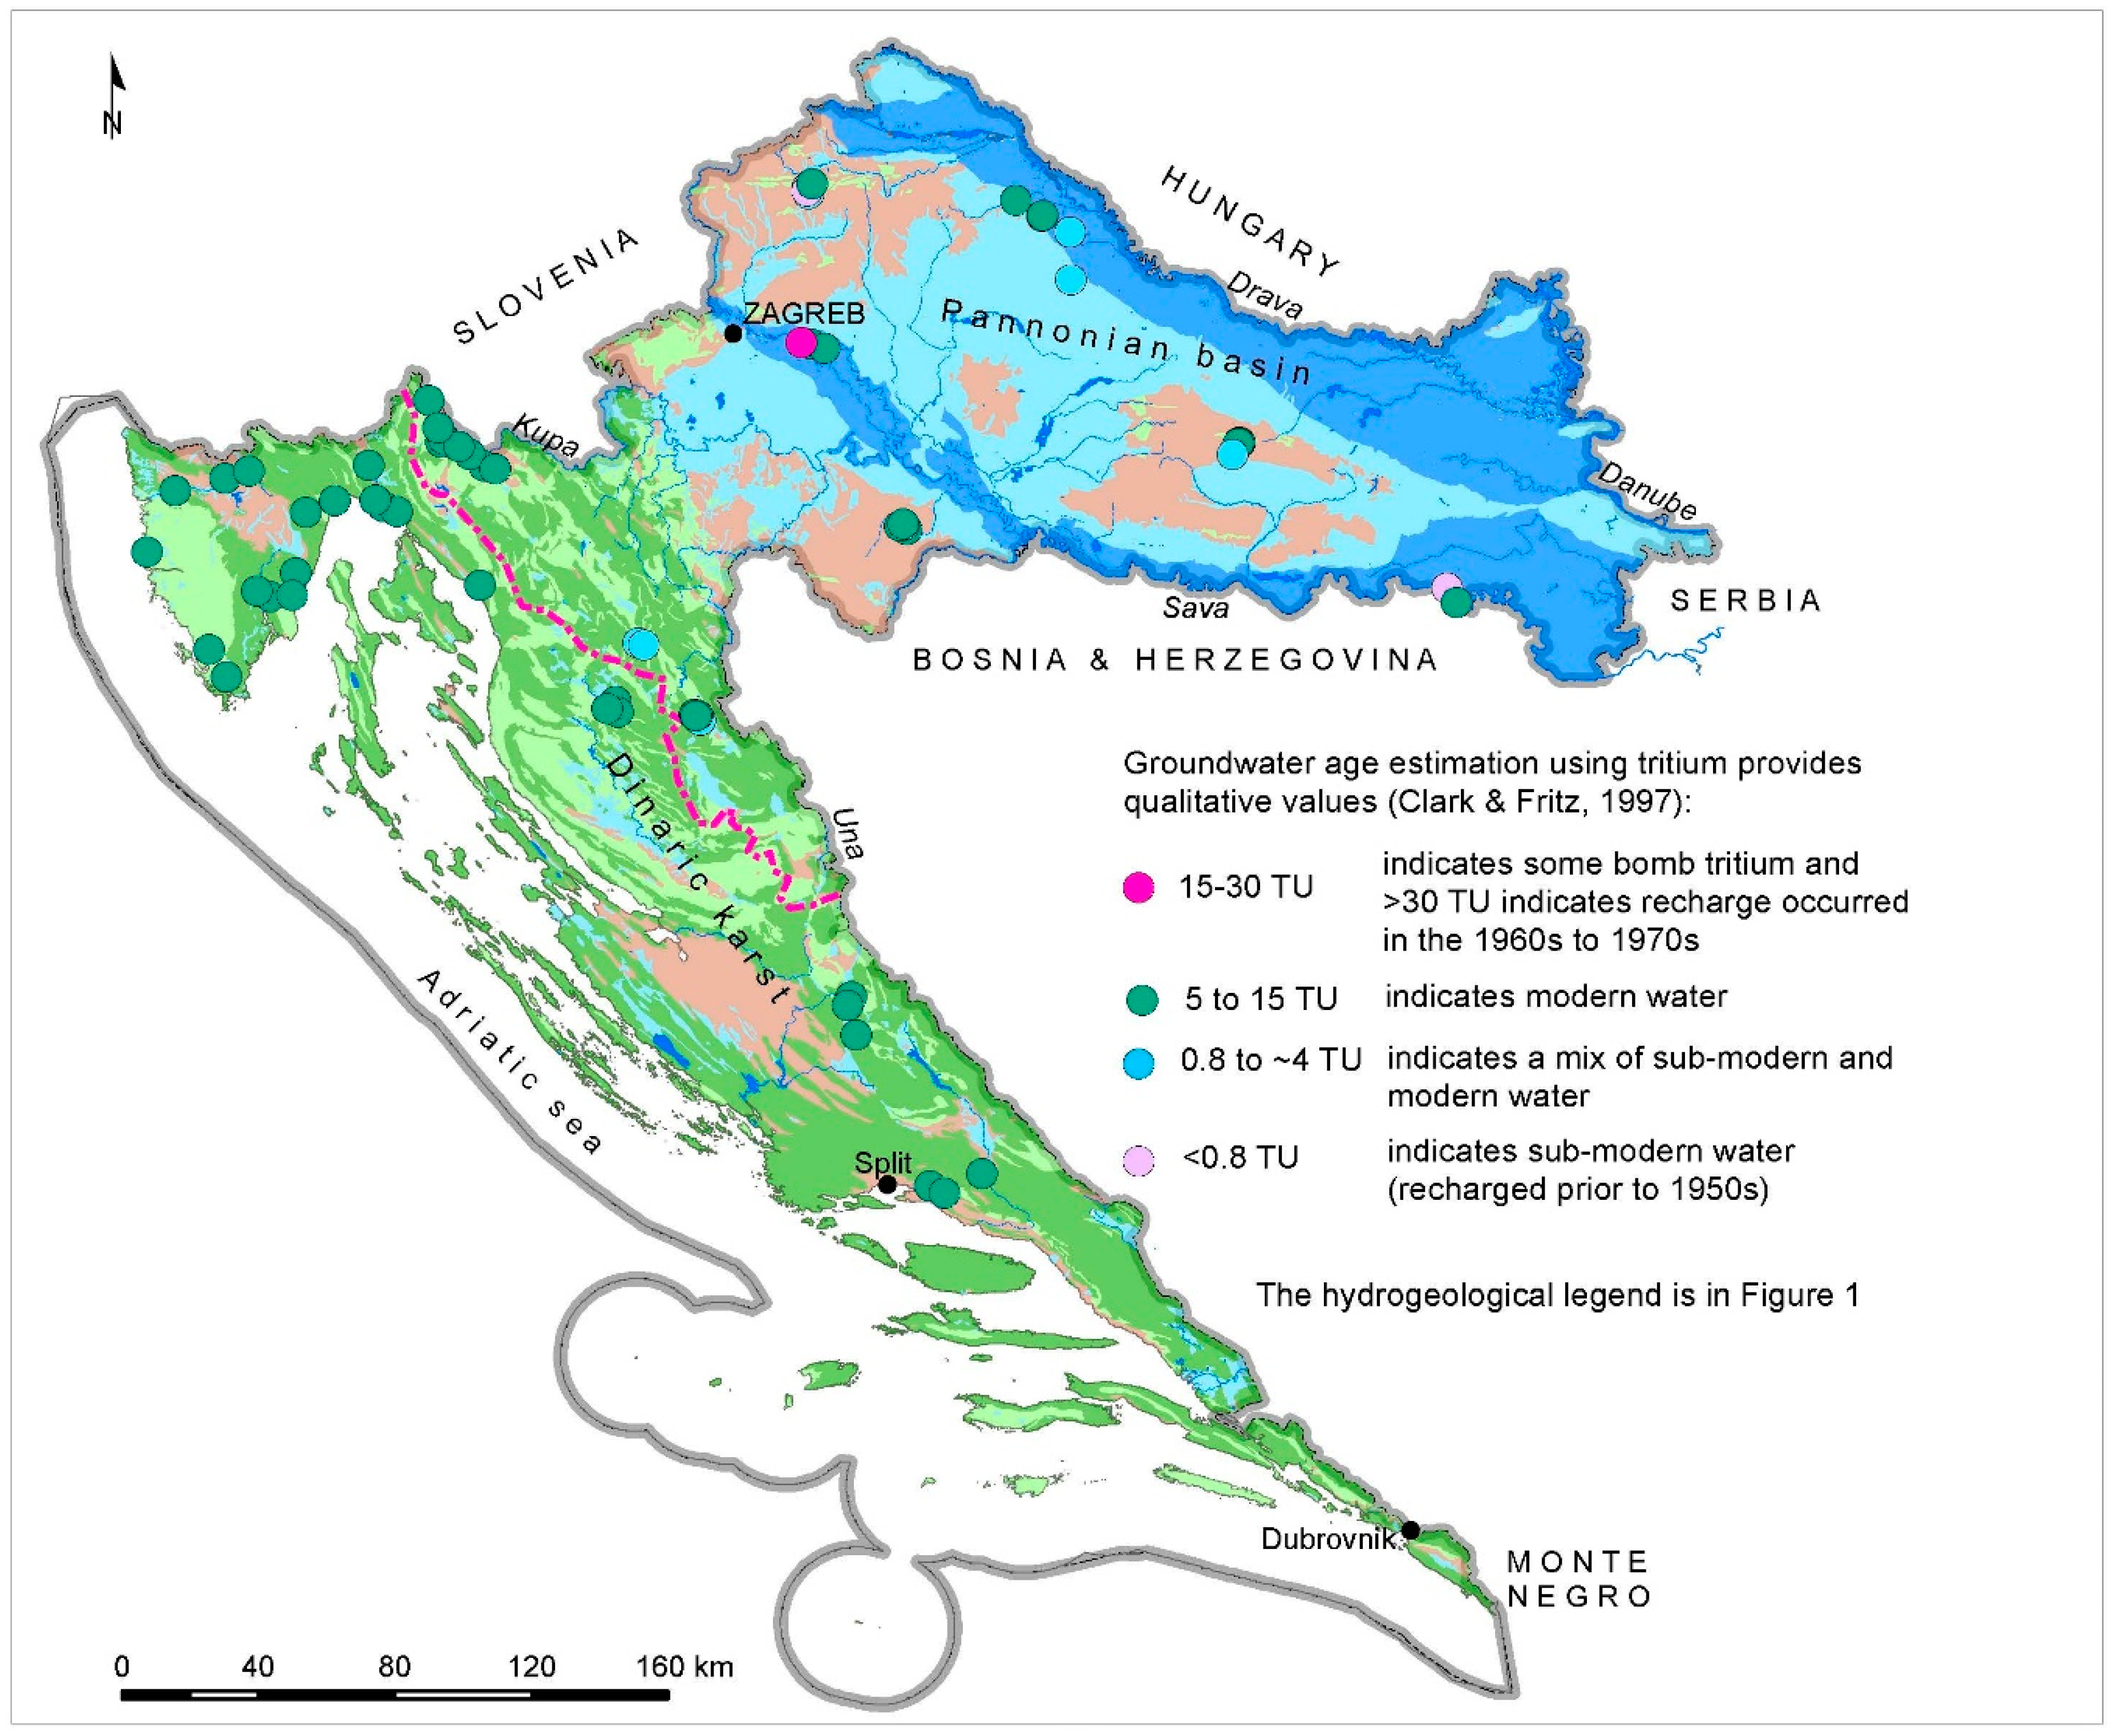
Tritium activity concentrations in the groundwater samples were used to estimate an approximate mean groundwater age (MRT). The qualitative interpretations in this study are made as follows [9]: <0.8 TU indicates sub-modern water (recharged prior to 1950s), 0.8 to ≈ 4 TU indicates a mix of sub-modern and modern water, 5 to 15 TU indicates modern water, 15–30 TU indicates some “bomb” tritium, and >30 TU indicates that a recharge occurred in the 1960s to 1970s.
3. Results and Discussion
The statistical isotopic data of groundwater samples from the observation wells and springs are presented in Tables S1a, S2a, S3a and S4a. On the sampling sites where the composition of stable isotopes was measured only once, groundwater isotopic data are shown in Tables S1b, S2b, S3b and S4b. The tables can be found in Supplementary Files.
3.1. Stable Isotope Composition of Groundwater in the Karst Area of Croatia
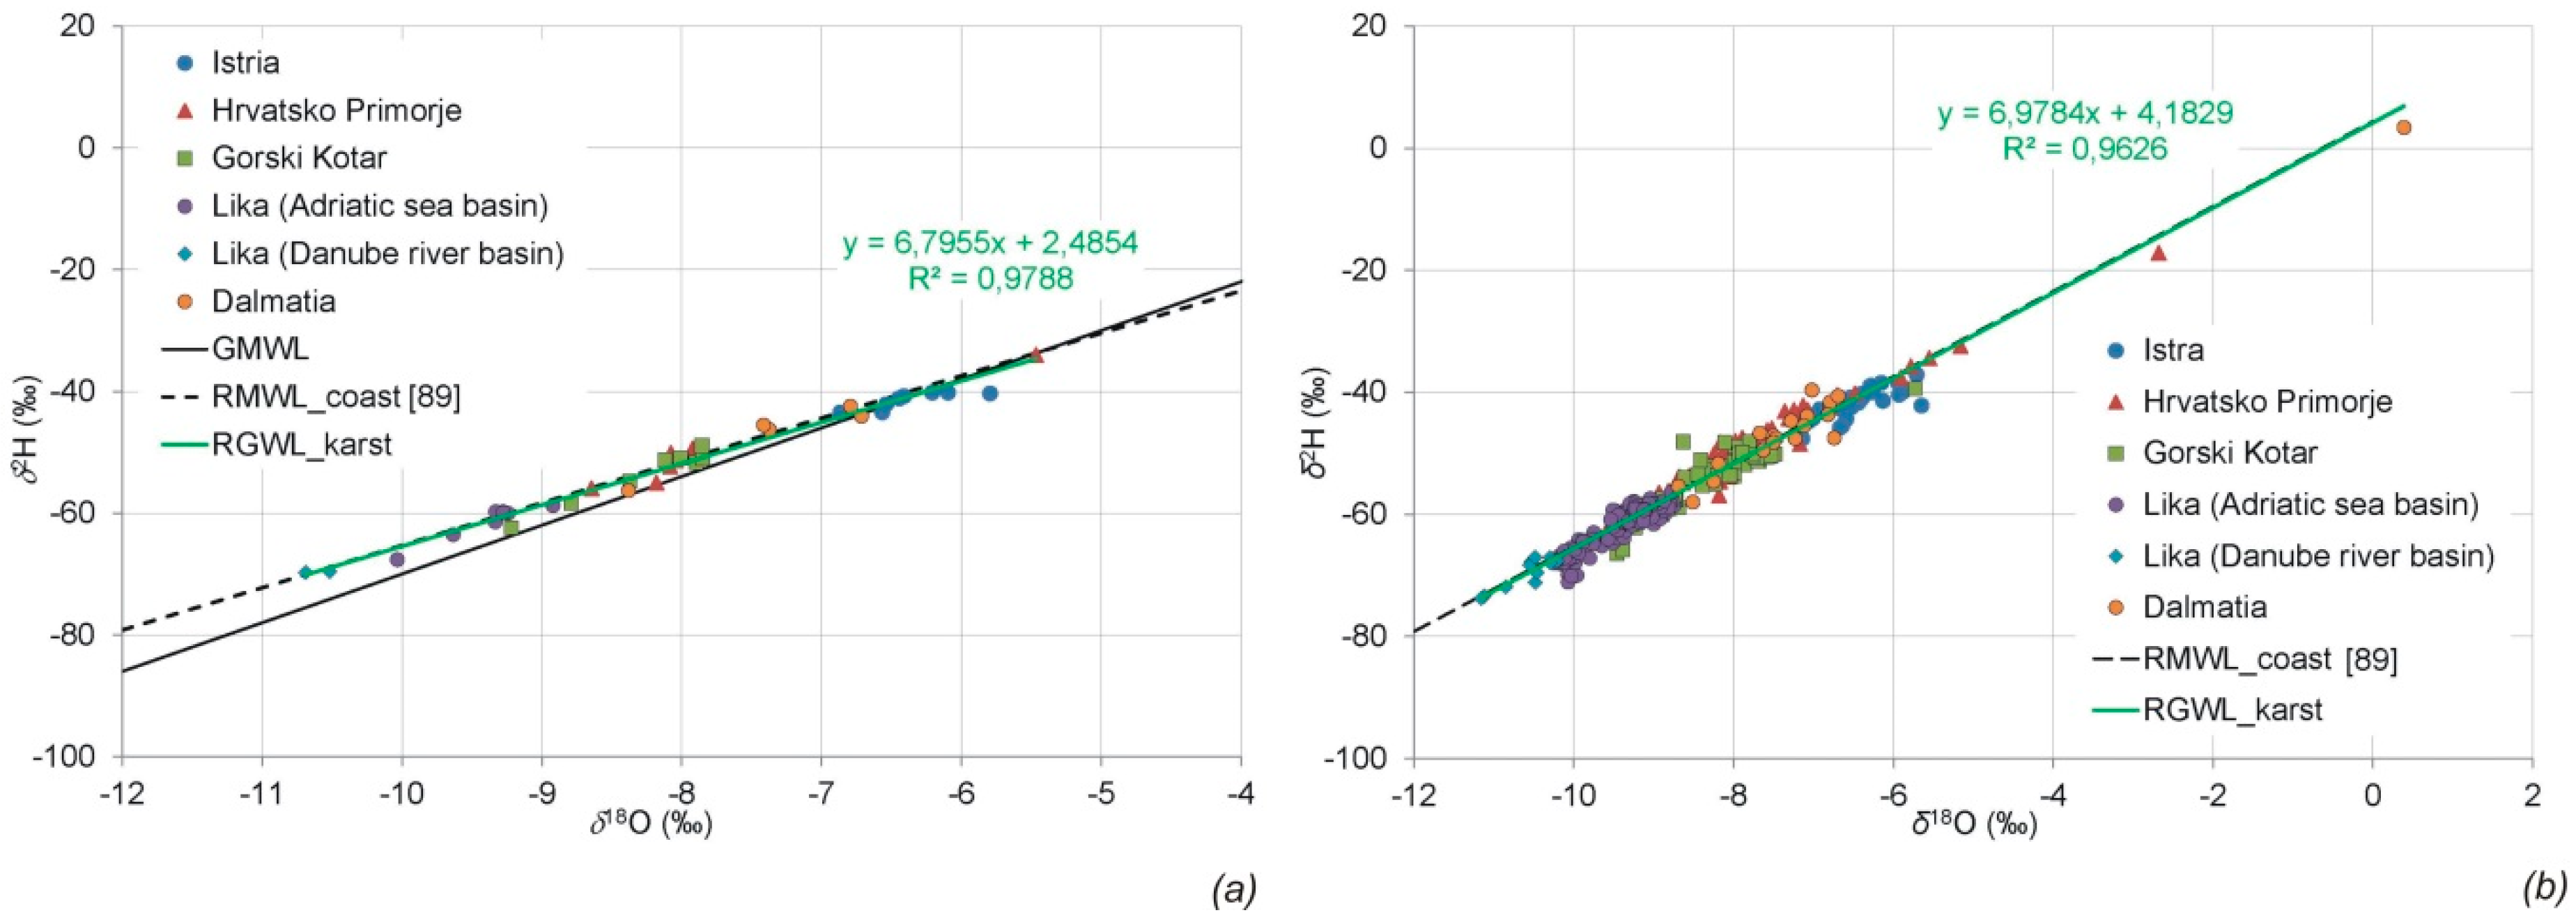
The mean δ18O values in the drinking karst groundwater range from −10.9‰ to −5.5‰. Similarly, the lowest mean δ2H was −71.9‰, and the highest δ2H was −34.0‰ (Table S1a, Figure 2a). The most positive δ-values were measured in the spring below the sea surface (submarine spring, vrulja Modrič), reflecting the influence of sea water (Figure 2b). A slightly more negative value of stable isotopes was measured in the groundwater sample of the coastal spring Kristal in the summer of 2001 (Figure 2b). Since the sampling was done in summer, during the dry season, the influence of the sea was very pronounced, as observed by the isotopic composition of the groundwater. The δ18O/δ2H values for all karst springs are distributed along the regional meteoric water line of the coastal part of Croatia (RMWL_cost in Table 3) and indicate a meteoric origin. This also applies to springs belonging to the Danube River basin that are approximately 50 km away from the sea. Consequently, most precipitation that exerts an influence on groundwater recharge in the karst area comes from the precipitation supplied by the south wind in the direction of the Adriatic sea (more often in the cold than in the warm part of the year).
A comparison of RMWL with GMWL shows local deviations from the world average. The slope of RMWL_coast has a value less than 8 (Table 3), indicating greater moisture losses through evaporation. Evaporation moisture losses occur due to low rainfall, during very hot summers, or for both reasons simultaneously [95], which is characteristic of this part of Croatia.
The δ18O/δ2H values form the regional karst groundwater line (RGWL_karst), which is described by following equations—δ2H = 6.8 × δ18O + 2.5 (n = 38, R2 = 0.98), for the mean values of the stable isotopes (Figure 2a), and δ2H = 7.0 × δ18O + 4.2 (n = 340, R2 = 0.96), for the single values of the stable isotopes (Figure 2b). Both lines have very similar slopes and intercepts to RMWL_coast.
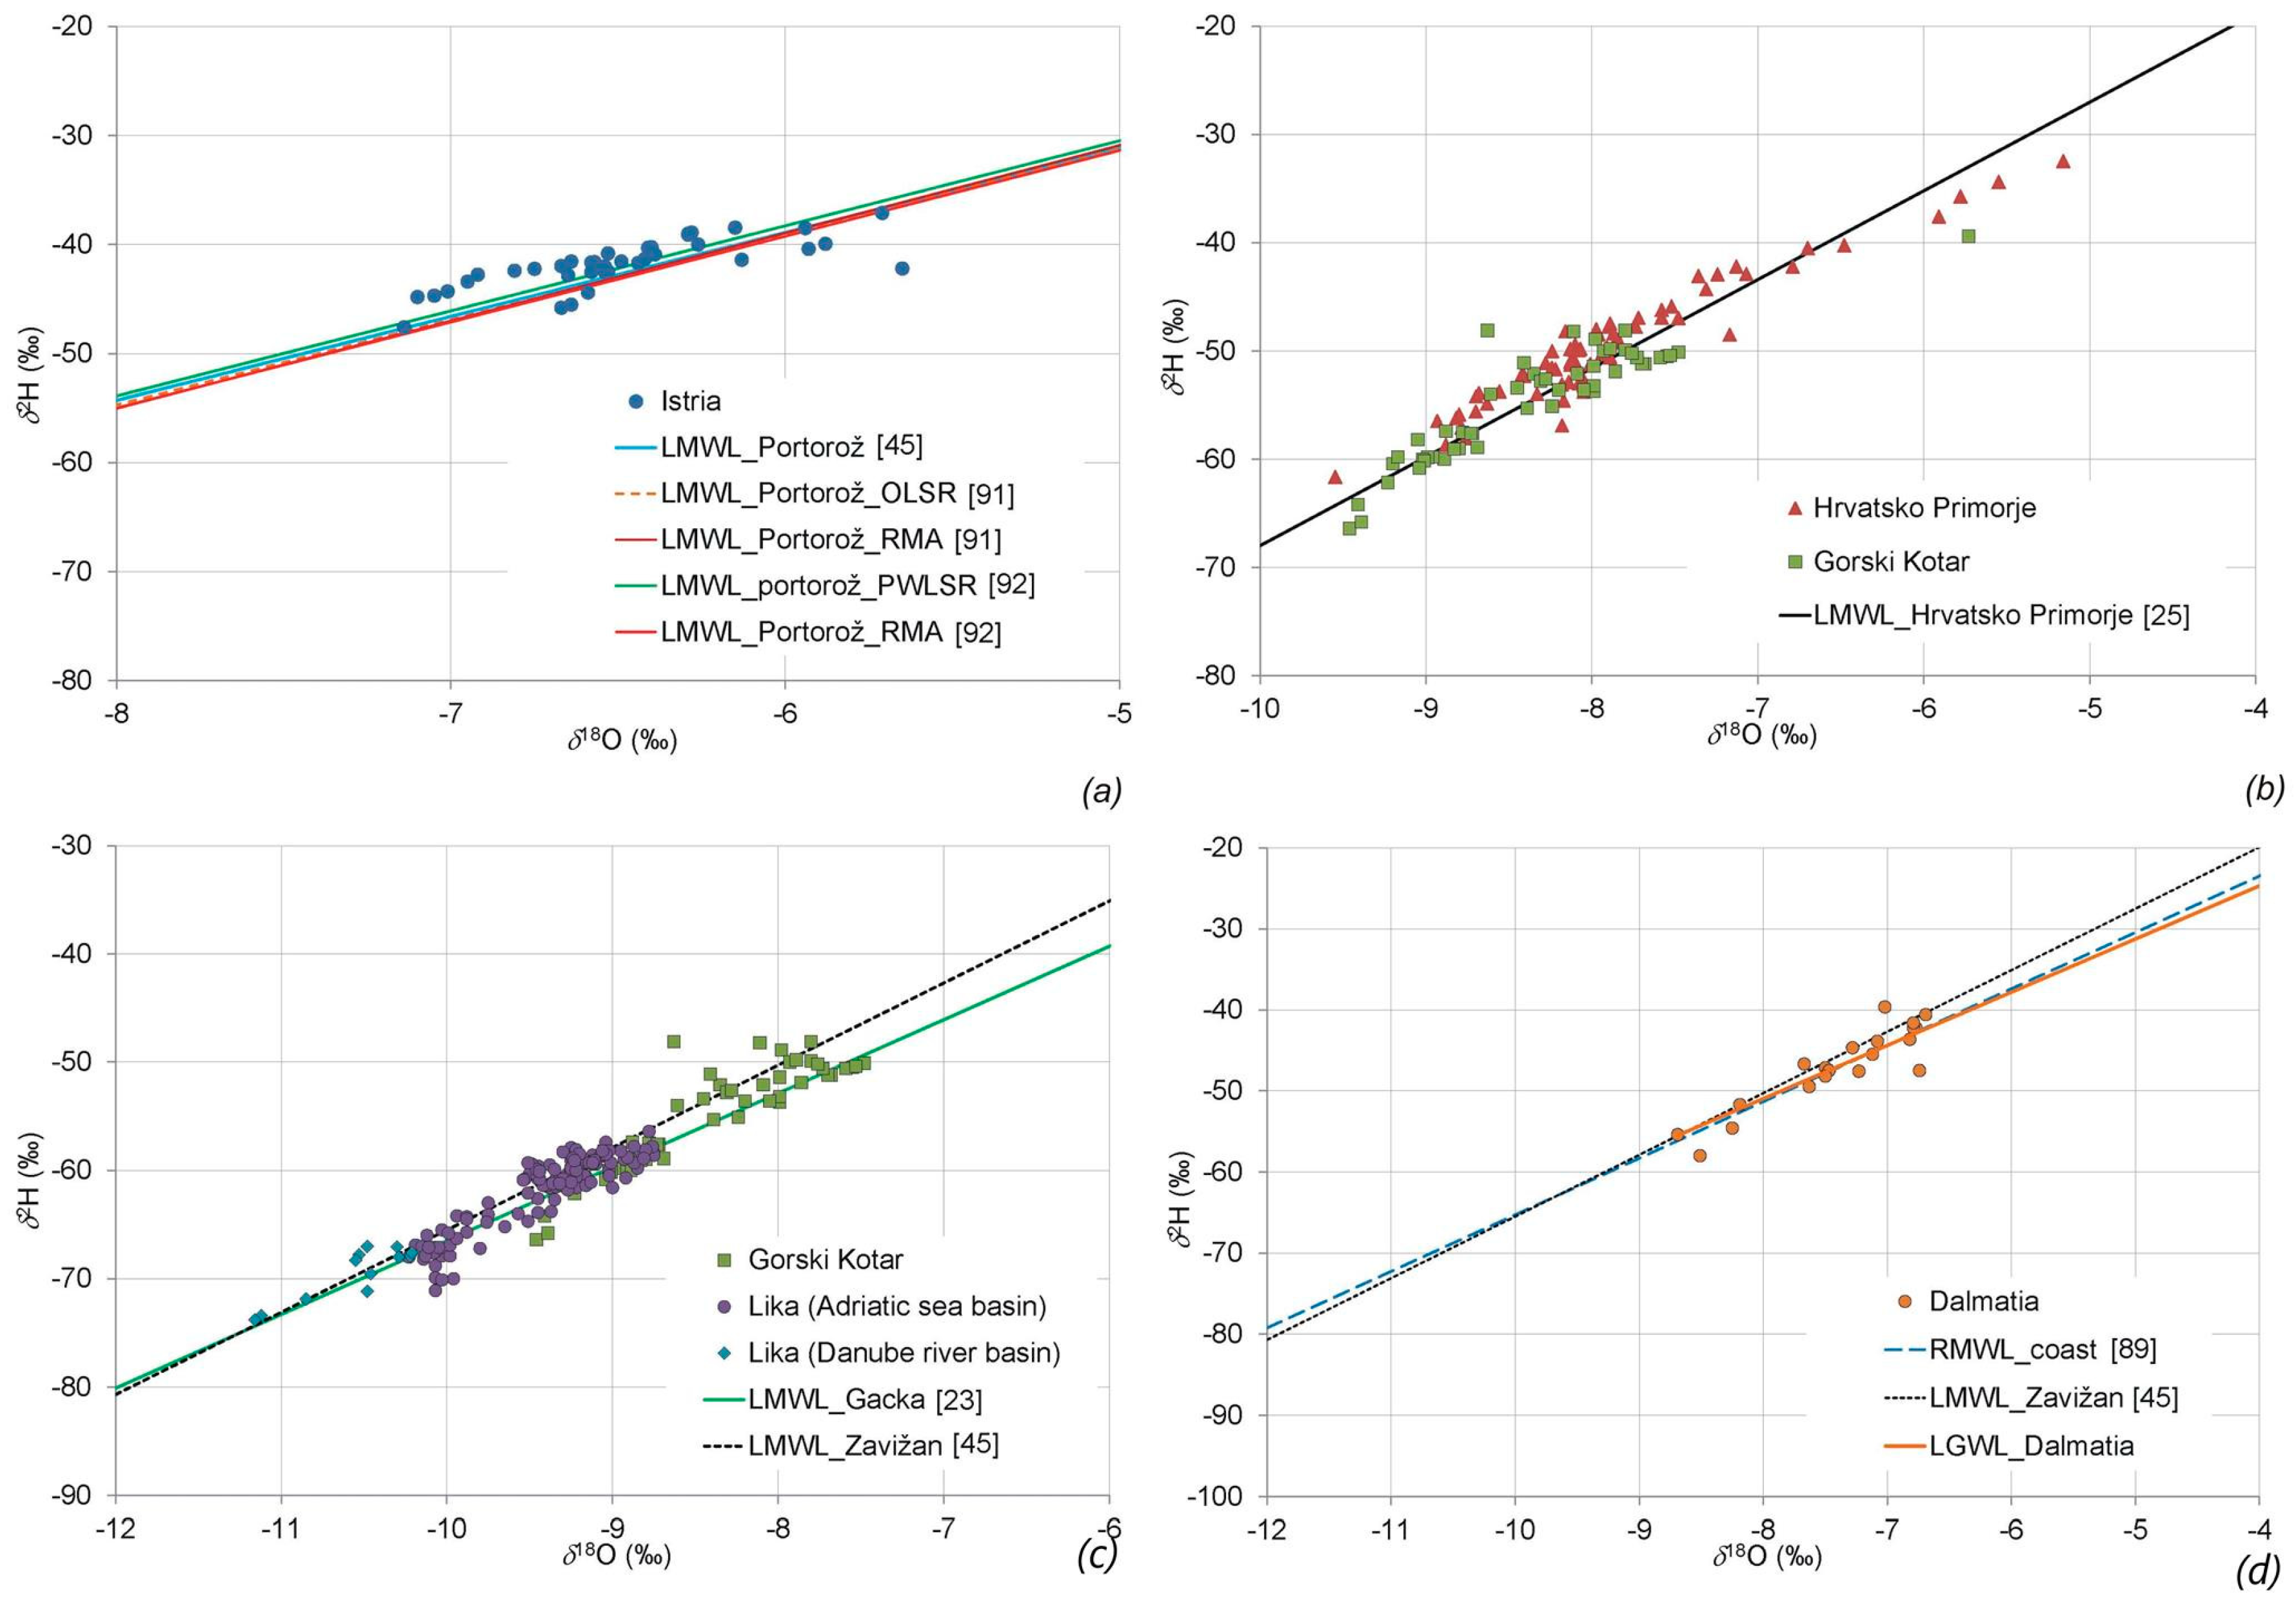
Depending on their affiliation with their geographic areas, individual groups of springs are clearly located along the RMWL_coast. However, some spring groups fit better with LMWLs. The single values of stable isotopes of karst groundwater from Figure 2b and LMWLs are shown in Figure 3. Figure 3a shows the isotopic composition of the spring water in Istria and the LMWLs defined by Vreča et al. [45,91,92] (Table 3). The δ18O/δ2H data of the spring water fit very well with the LMWLs determined by the isotopic precipitation composition in Portorož, Slovenia. This is unsurprising, since Portorož is less than 50 km away from central Istria and climatically belongs to the same area. The figure shows several LMWLs that are determined using different methods. All regression lines have similar values (within uncertainties) for both the slope and the intercept values [92]. The slopes of LMWLs obtained using data for the period 2007–2010 and the PWLSR method are close to those of the LMWLs using the OLSR and RMA method for the periods of 2001–2003 and 2000–2006.
The majority of the springs that belong to the Gorski Kotar (Kupica, Mala Belica, Gerovčica, Vela Učka, Zvir, Velika Belica, Kupa, and Kupari) in the Danube River basin and Hrvatsko Primorje (Vela Učka, Rječina, Zvir Perilo, and Martinščica) in the Adriatic Sea basin (Table 2) are situated in the zone between approximately δ18O = −8.6‰ and δ18O = −7.9‰, as well as δ2H = −55.9‰ and δ2H = −48.9‰ (Figure 3b). Although some of these springs are located along the coast (Zvir, Perilo, and Martinscica) and some at several hundred meters above sea level (Rječina, Vela Učka, Kupica, Mala Belica, Gerovčica, Velika Belica, Kupa, and Kupari), their δ18O values have small variations. Their isotopic compositions are mainly influenced by the climatic conditions in the recharge area of the aquifer, which are approximately the same (found in close proximity to one another) for the considered springs.
The mean residence time (MRT) of groundwater was calculated for the stable isotope δ18O using the lumped parameter approach and applying the exponential model, the combined exponential-piston model, and the dispersion model to the isotopic input (rainfall) and output (spring) datasets during 2011–2013 [12]. The MRTs of 3.24 and 3.6 months for the Rječina spring and 7.2 months for the Zvir spring suggest the presence of recent groundwater recharge from precipitation, as well as fast groundwater flow. The cumulative age distributions show that the proportion of water younger than 1xMRT at both springs was more than 50% and that the proportion of water younger than 2xMRT was almost 90%.
The high mean δ-values δ18O = −5.9‰ to −5.2‰ and δ2H = −37.6‰ to −32.5‰ in Hrvatsko Primorje refer to the coastal spring Kristal in Opatija (Figure 1 and Figure 3b). The water is brackish, and during low water hydrological conditions, the proportion of seawater is considerable, which is reflected in the composition of the stable isotopes in the water.
Figure 3c shows the isotopic composition of the spring water in Gorski Kotar and Lika, as well as the LMWLs defined by Vreča et al. [45] and Mandić et al. [23] (Table 3). The figure clearly shows that the LMWL defined by Mandic et al. [23] fits well with groundwater samples at all Lika springs and at the springs located in the eastern part of Gorski Kotar. At the same time, LMWL_Zavižan [45] fits better with the springs in the westernmost part of Gorski Kotar, whose recharge area is situated at a high altitude, as well as the Zavižan.
The lowest δ-values were recorded on the springs that belong to the Lika area in the Danube River basin (Table 2, Figure 3c). Although these springs are located in the Danube River basin, it is evident that aquifer recharge is carried out by precipitation, which is influenced by the Mediterranean air mass. In this area (but east of Malo vrelo Ličke Jesenice and Veliko vrelo Ličke Jesenice), the composition of the stable isotopes was once measured at six springs (Korenička Rijeka spring, Kameniti vrelac, Koreničko vrelo, Makarevo vrelo, and Mlinac i Stipinovac) in the Una river basin (Table 2, Figure 1). The measured δ18O values were in the range of −10.9‰ to −10.2‰ and −71.9‰ to −67.1‰ for δ2H (Table S1b), which is very similar to the mean isotopic composition of Malo vrelo Ličke Jesenice and Veliko vrelo Ličke Jesenice.
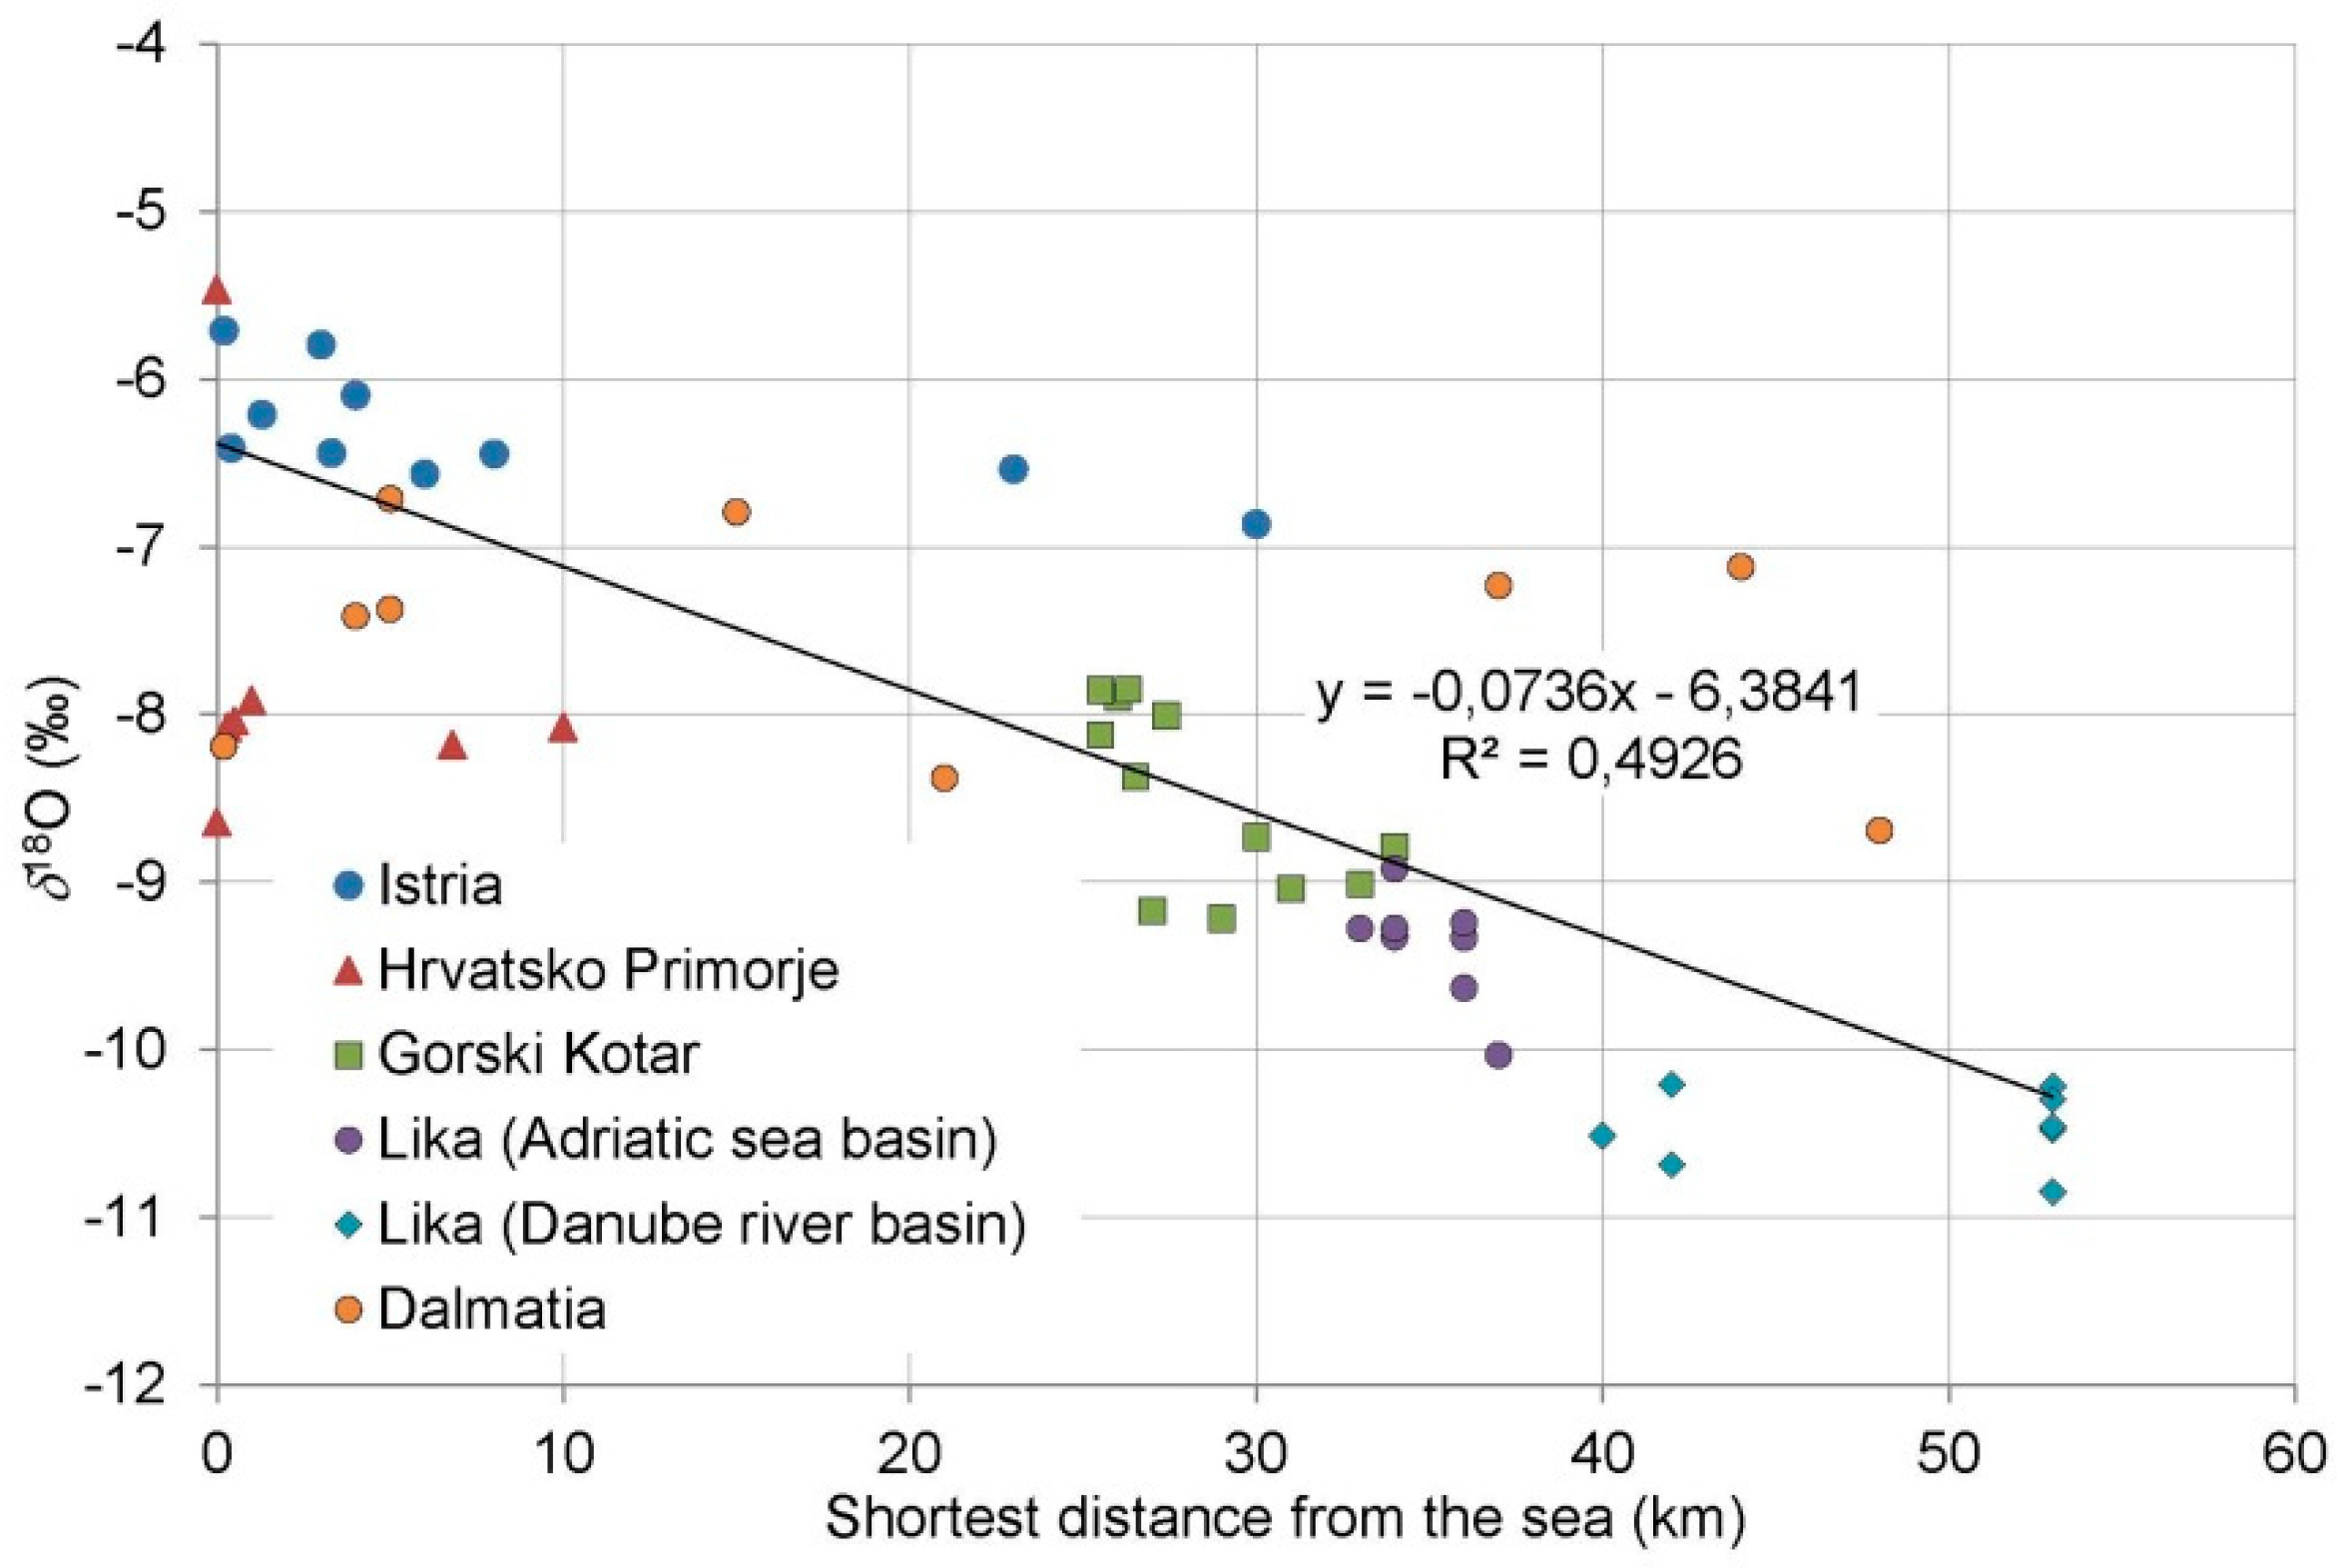
At the same time, at springs that belong to the Lika area in the Adriatic Sea basin (Majerovo vrelo, Klanjac, Tonkovića vrelo, Grab, Marusino vrelo, Jaz, and Knjapovac—in Table 2), the mean δ18O values were in the range of −10.2‰ to −8.0‰, as well as −71.0‰ to −50.0‰ for δ2H (Table S1a). All springs, including those in the Danube River basin and those in the Adriatic Sea basin, are situated at similar altitudes (Table 2), so the differences between the stable isotope compositions of the springs belonging to the Danube River basin and the springs belonging to the Adriatic Sea basin could be caused by the “continental effect”, also referred to as the distance-from-coast effect [39]. However, in this case, the distance from the sea is likely not the reason because the differences are very small, (approximately 20 kilometres) (Figure 4). Although the springs are at similar altitudes, the altitudes of their recharge areas are different. Higher altitudes in the catchment area of the springs in the Danube River basin likely have a much greater impact than the distance from the coast. As the altitude of the terrain increases, the δ18O and δ2H in precipitation becomes increasingly more depleted. This effect correlates to air temperature, which drops due to an increase in altitude [39]. The δ18O effect generally varies between −0.1‰ and −0.6‰/100 m of altitude and often decreases with an increase in altitude [96].
The mean δ18O values of spring water in Dalmatia vary between −6.7‰ and −8.7‰ and −40.0‰ and −58.0‰ for δ2H (Figure 3d), which is, according to Kapelj et al. [21], within the range of the stable isotope composition of groundwater in middle Dalmatia. The composition of stable isotopes in groundwater, especially in the spectrum of depleted values, shows similarity to LMWL_Zavižan [45] and thus reflects the influence of the recharge area at high altitudes (e.g., Zavižan—Velebit Mt. 1594 m a.s.l., Dinara Mt. 1830 m a.s.l.). However, the stable isotopes data of measured groundwater define a local groundwater line (LGWL_Dalmatia) that better matches the RMWL_coast (Figure 3d). It is described using equation δ2H = 6.6 × δ18O + 1.7 (n = 21, R2 = 0.97). The difference between the slope values of the lines for RGWL_coast and LGWL_Dalmatia is generally about 0.42‰ and between the axis intercept values is about 2.74‰. These differences between LMWL_Zavižan and LGWL_Dalmatia are 1.02‰ for slope values and 8.84‰ for intercept values. Kapelj et al. [21] analysed the mean altitude of the spring catchment areas and found the δ18O gradient to be between −0.2‰ and −0.4‰/100 m, which corresponds to the value of −0.3‰/100 m determined by Vreča et al. [46] using stable isotope data for precipitation at several stations in Croatia and Slovenia, as well as that of Mandić et al. [23], who used stable isotope data for the groundwater at Lika springs Majerovo vrelo, Tonkovic vrelo, and Pećina. Using data on the stable isotopes in precipitation at several stations in the Učka area (Rijeka hinterland), Hunjak [89] determined a δ18O gradient of −0.19‰/100 m. However, these relationships cannot be applied to all springs analysed in this paper because they have different catchment areas that differ in their temperature changes and wind directions, which both significantly affect the composition of stable isotopes in precipitation and thus in groundwater.
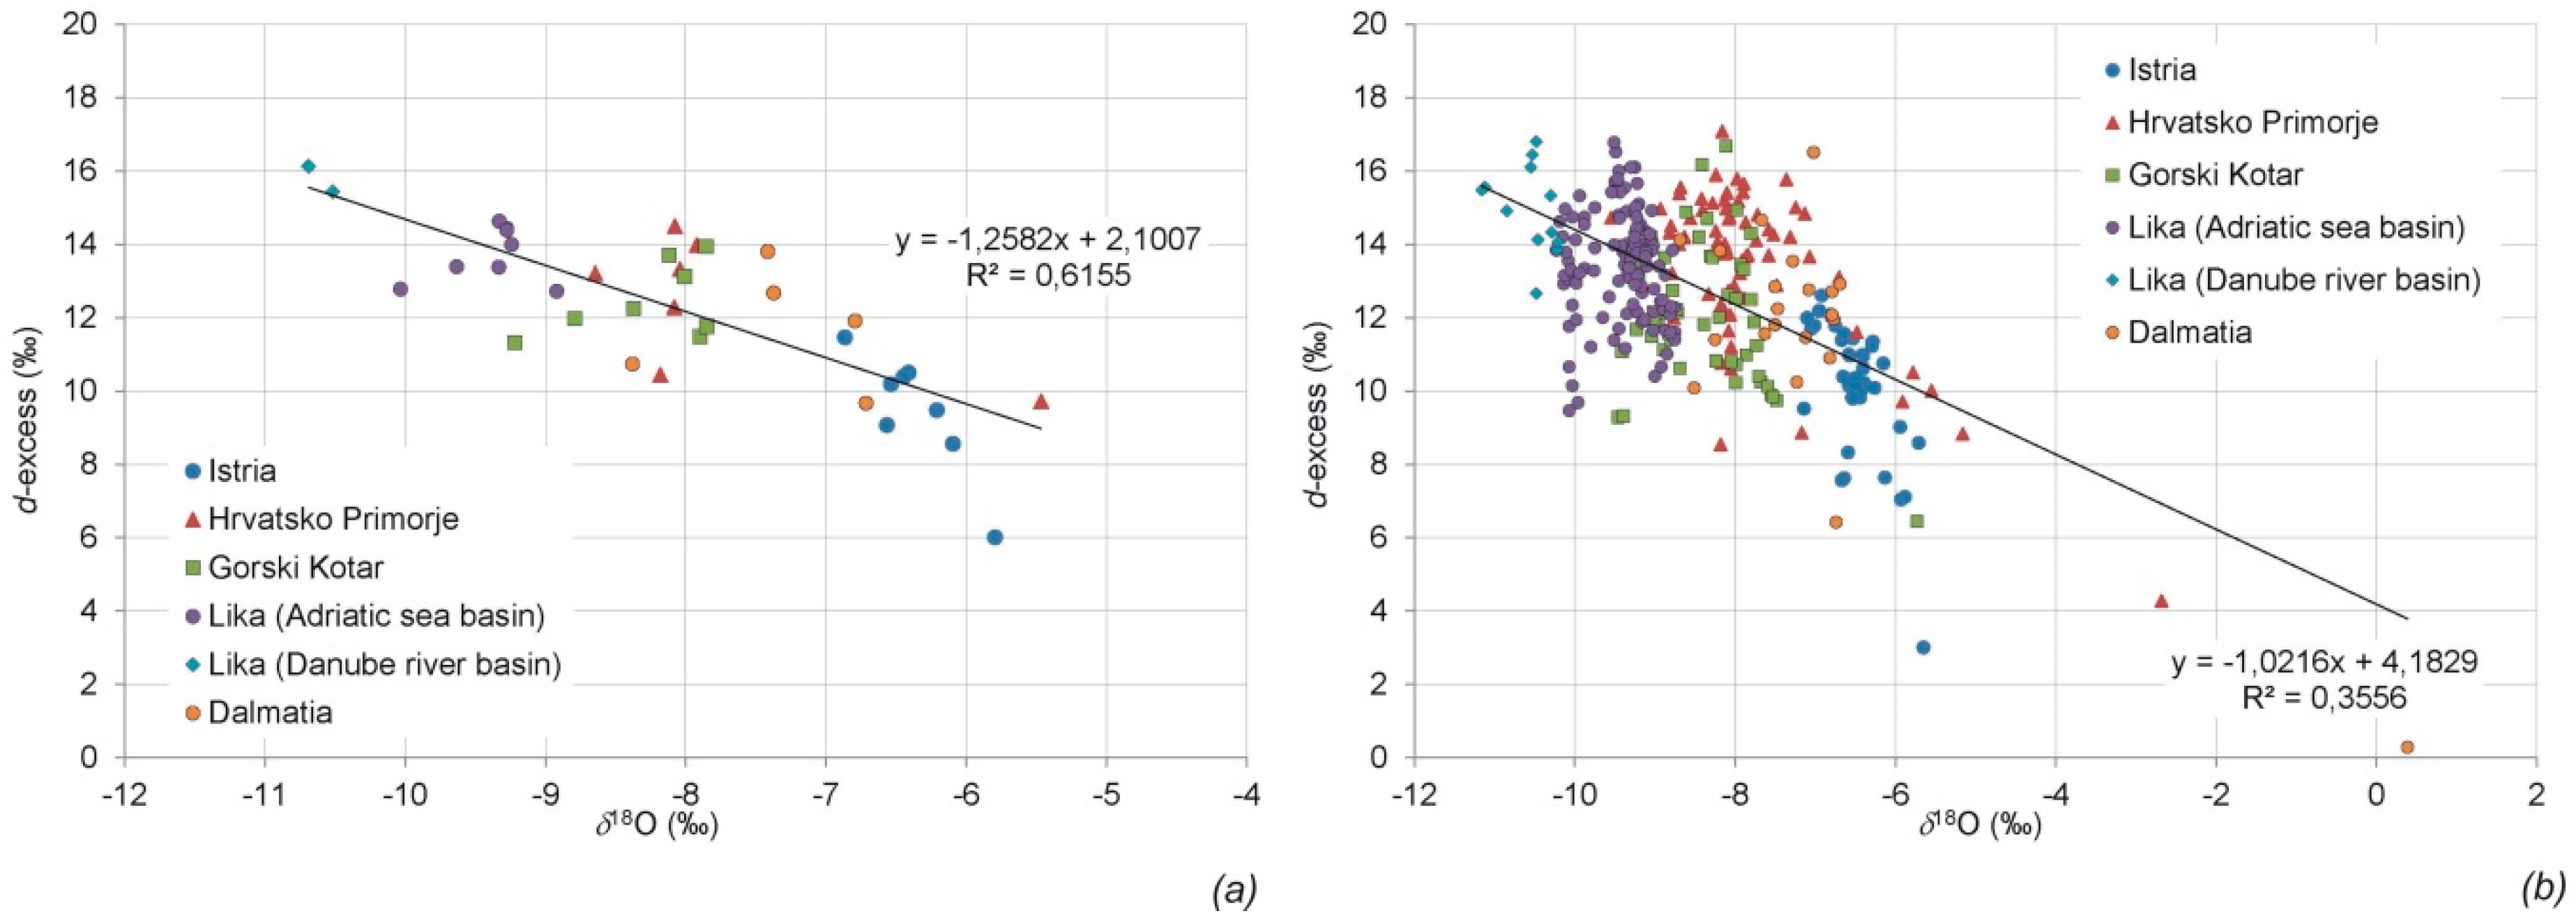
The d-excess values of karst groundwater were determined to be between 6‰ and 17‰ (Table S1, Figure 5). d-values lower than 6‰ were found in three individual samples (coastal Kristal spring, vrulja Modrič, and Šišan spring in Istria), which are under the influence of sea water. In many cases, d-excess is found to increase with altitude [39,45]. Atlantic air masses typically have d-excess values around 10‰, while Mediterranean air masses are characterized by higher d-excess values of approximately 12‰ [14]. The catchment areas of the springs in Lika, Gorski Kotar, and Hrvatsko Primorje are at relatively high altitudes, and due to the influence of high altitudes and Mediterranean air masses, their d-excess values are high and reach 17‰ (Figure 5b). The lowest d-excess values are determined in springs in Istria whose catchment areas are at relatively low altitudes and are partly affected by Atlantic air masses.
3.2. Stable Isotope Characteristics of Groundwater in the Pannonian Area of Croatia
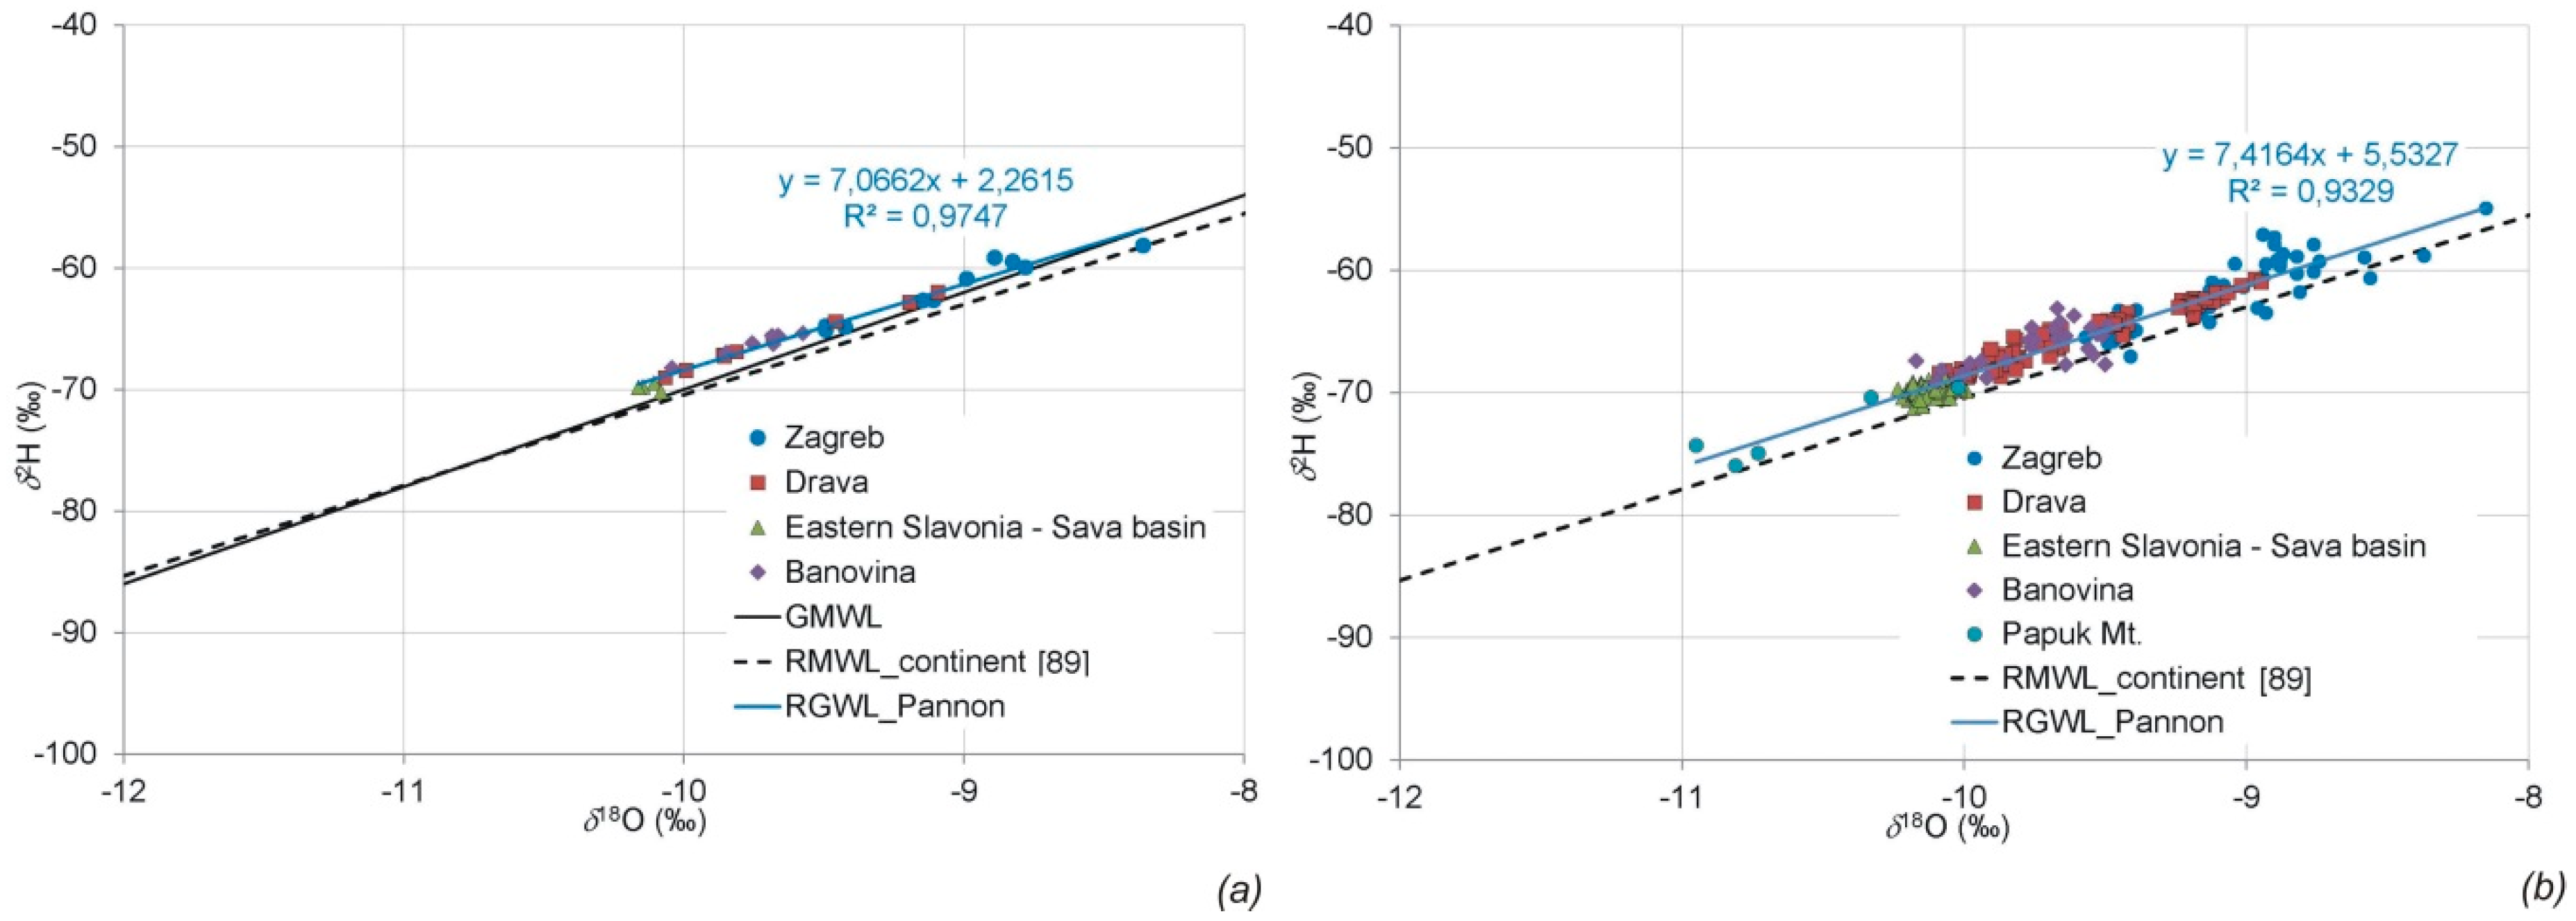
δ18O values of groundwater ranged from −11.0‰ to −8.2‰ and from −76.0‰ to −57.0‰ for δ2H (Table S2, Figure 6). The lowest δ18O and δ2H values were measured in the spring water on Papuk Mt (Figure 6b). As an increase in altitude leads to depleted isotope values, it is expected that among all the analysed groundwater samples, these springs will have the lowest isotopic values as their recharge areas are situated at the highest altitudes, reaching 825 m a.s.l. The highest values of stable isotopes were measured in groundwater in the Zagreb area where they range from −9.5‰ to −8.2‰ for δ18O and from −65.0‰ to −57.0‰ for δ2H (Figure 6b). The altitude of the groundwater recharge in this area reaches up to 200 m a.s.l. As shown in Figure 6b, the stable isotope values of groundwater samples from Eastern Slavonia—the Sava basin, Banovina, and the Drava River valley—are located between the stable isotope values of groundwater on Papuk Mt. and the Zagreb area. The groundwater recharge areas in the Drava river valley reach approximately 250 m a.s.l. and 290 m a.s.l. in the Banovina area. The catchment area of groundwater captured by observation wells in Eastern Slavonia—the Sava basin—is mostly north of the wells [29], possibly also on the slopes of the Slavonian highlands up to altitudes of about 250 m a.s.l.
The groundwater isotopic values in the Pannonian part of Croatia lie slightly above the RMWL_continent and indicate a meteoric origin (Figure 6). Considering that only a small fraction of precipitation actually reaches groundwater in these types of aquifers, the meteoric signal in groundwater is muted. The regional groundwater line (RGWL_Pannon) is developed from groundwater δ18O/δ2H values. It is described by the following equations—δ2H = 7.1 × δ18O + 2.3 (n = 30, R2 = 0.97), for the mean values of the stable isotopes (Figure 6a), and δ2H = 7.4 × δ18O + 5.5 (n = 255, R2 = 0.93), for the single values of the stable isotopes (Figure 6b).
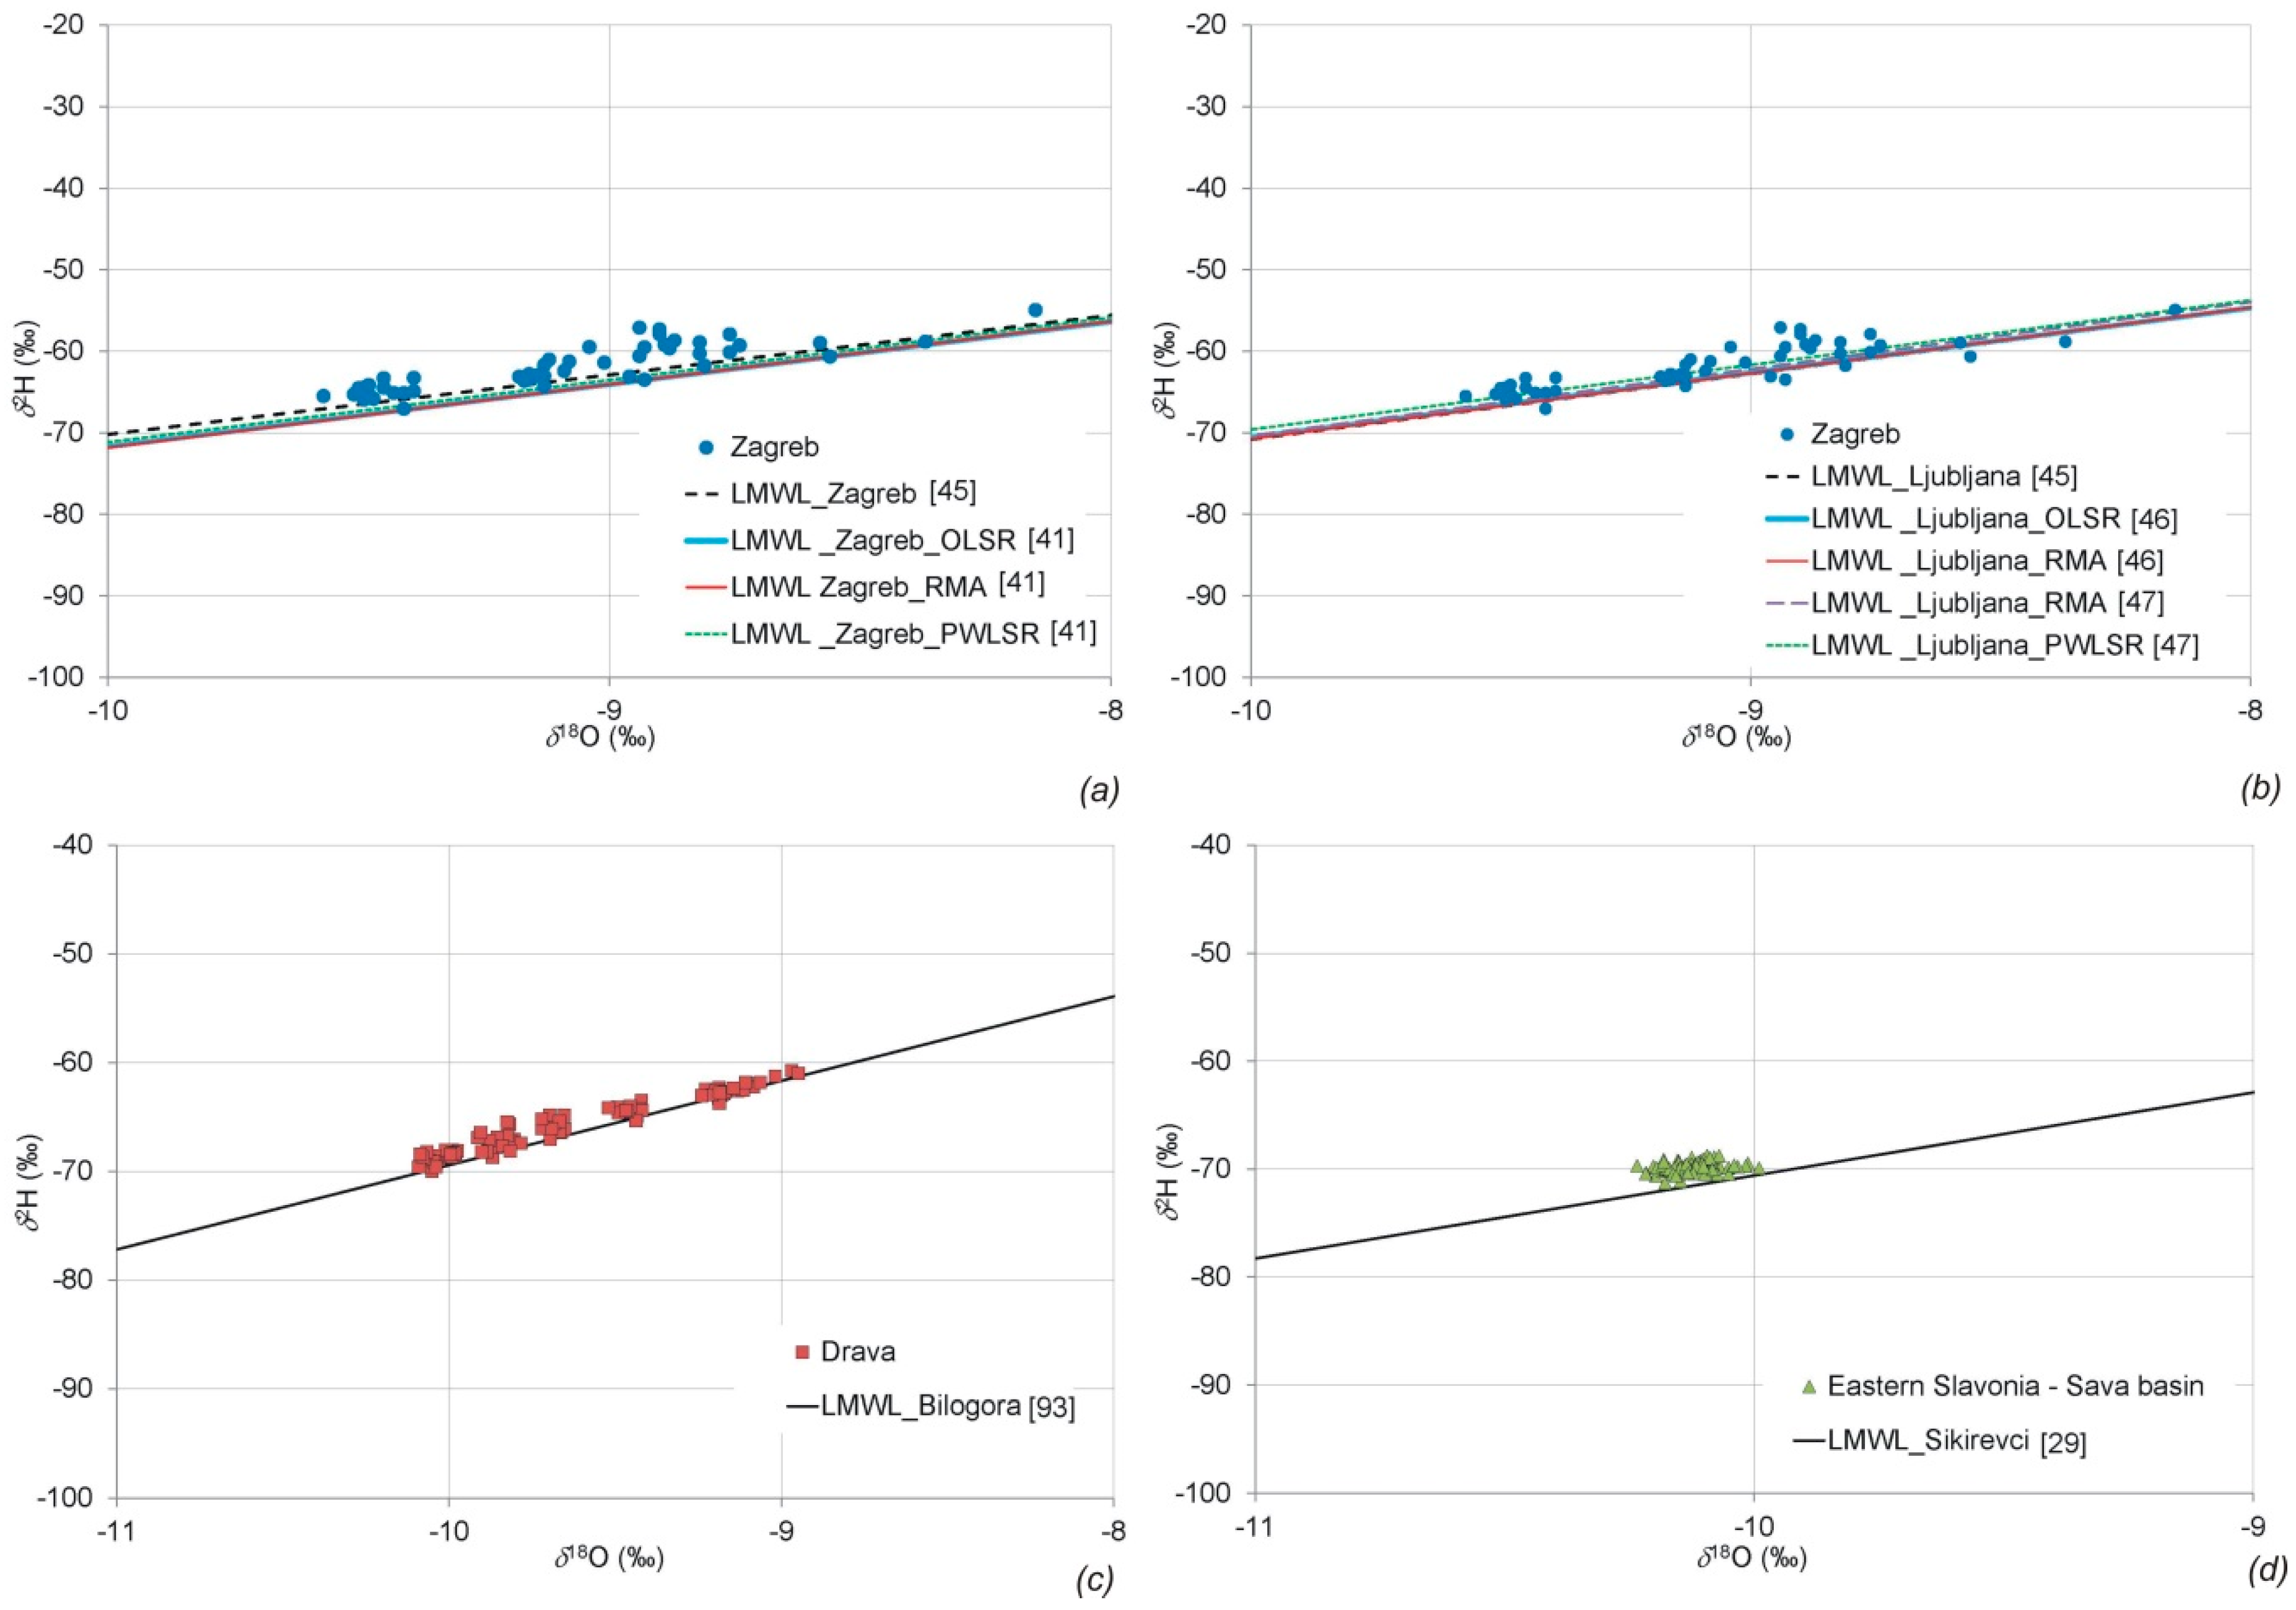
As in the case of karst groundwater, the groundwater in certain areas in the Pannonian part of Croatia is compared with LMWLs (Figure 7a–d). The single values of stable isotopes of groundwater in the Pannonian part of Croatia from Figure 6b and LWWLs are shown in Figure 7. The isotopic composition of the studied groundwater in the Zagreb area fits better with LMWL_Ljubljana [45,46,47] than with LMWL_Zagreb [41,45]. This was previously identified by Marković et al. [24], Horvatinčić et al., [27], and Parlov et al. [30]. The different methodologies used to calculate the LMWLs for Ljubljana [45,46,47] showed slightly better matching of the groundwater isotopic composition with the LMWL determined using the PWLSR method (Figure 7b). Considering that the precipitation weighted least square regression (PWLSR) method takes into account the precipitation amount and that the analysed groundwater is relatively close to the surface of the terrain and to the Sava River (which has an impact on groundwater recharge), the result is unsurprising. The values of the stable isotopes are scattered and show seasonal influence, which points to a relatively short mean residence time of the groundwater in this area. The aquifer is directly exposed to precipitation because there are no covering deposits, as well as to the influence of the Sava River because the observation wells are located in its immediate vicinity. Figure 7c shows the composition of the stable isotopes in the groundwater in the Drava River valley. The LMWL was developed on the basis of the measured values of the stable isotopes on Bilogora Mt. [93], south of the observed wells. The isotopic composition of the groundwater lies slightly above the LMWL_Bilogora. Stable isotopes were analysed over a wide area and at different depths of the aquifer (Table 1), and their values are grouped according to these elements (Figure 7c). The depleted isotope composition is characteristic of groundwater from the deeper parts of the aquifer system and the enriched isotopes are characteristic of the shallower parts of aquifers.
Figure 7d shows the composition of the stable isotopes of groundwater in the aquifer system in Eastern Slavonia—the Sava basin—as well as the LMWL that was made on the basis of the stable isotope values of the precipitation, which were measured in the immediate vicinity of the analysed wells [29]. The stable isotope composition data in groundwater are slightly above the LMWL and are grouped into almost a single point. Since groundwater is accumulated in the aquifer system in which the mean residence time is several decades (as evidenced by 3H activity concentrations), the water is homogenized so that the differences in the stable isotope composition of the precipitation—which recharge the groundwater—completely disappear.
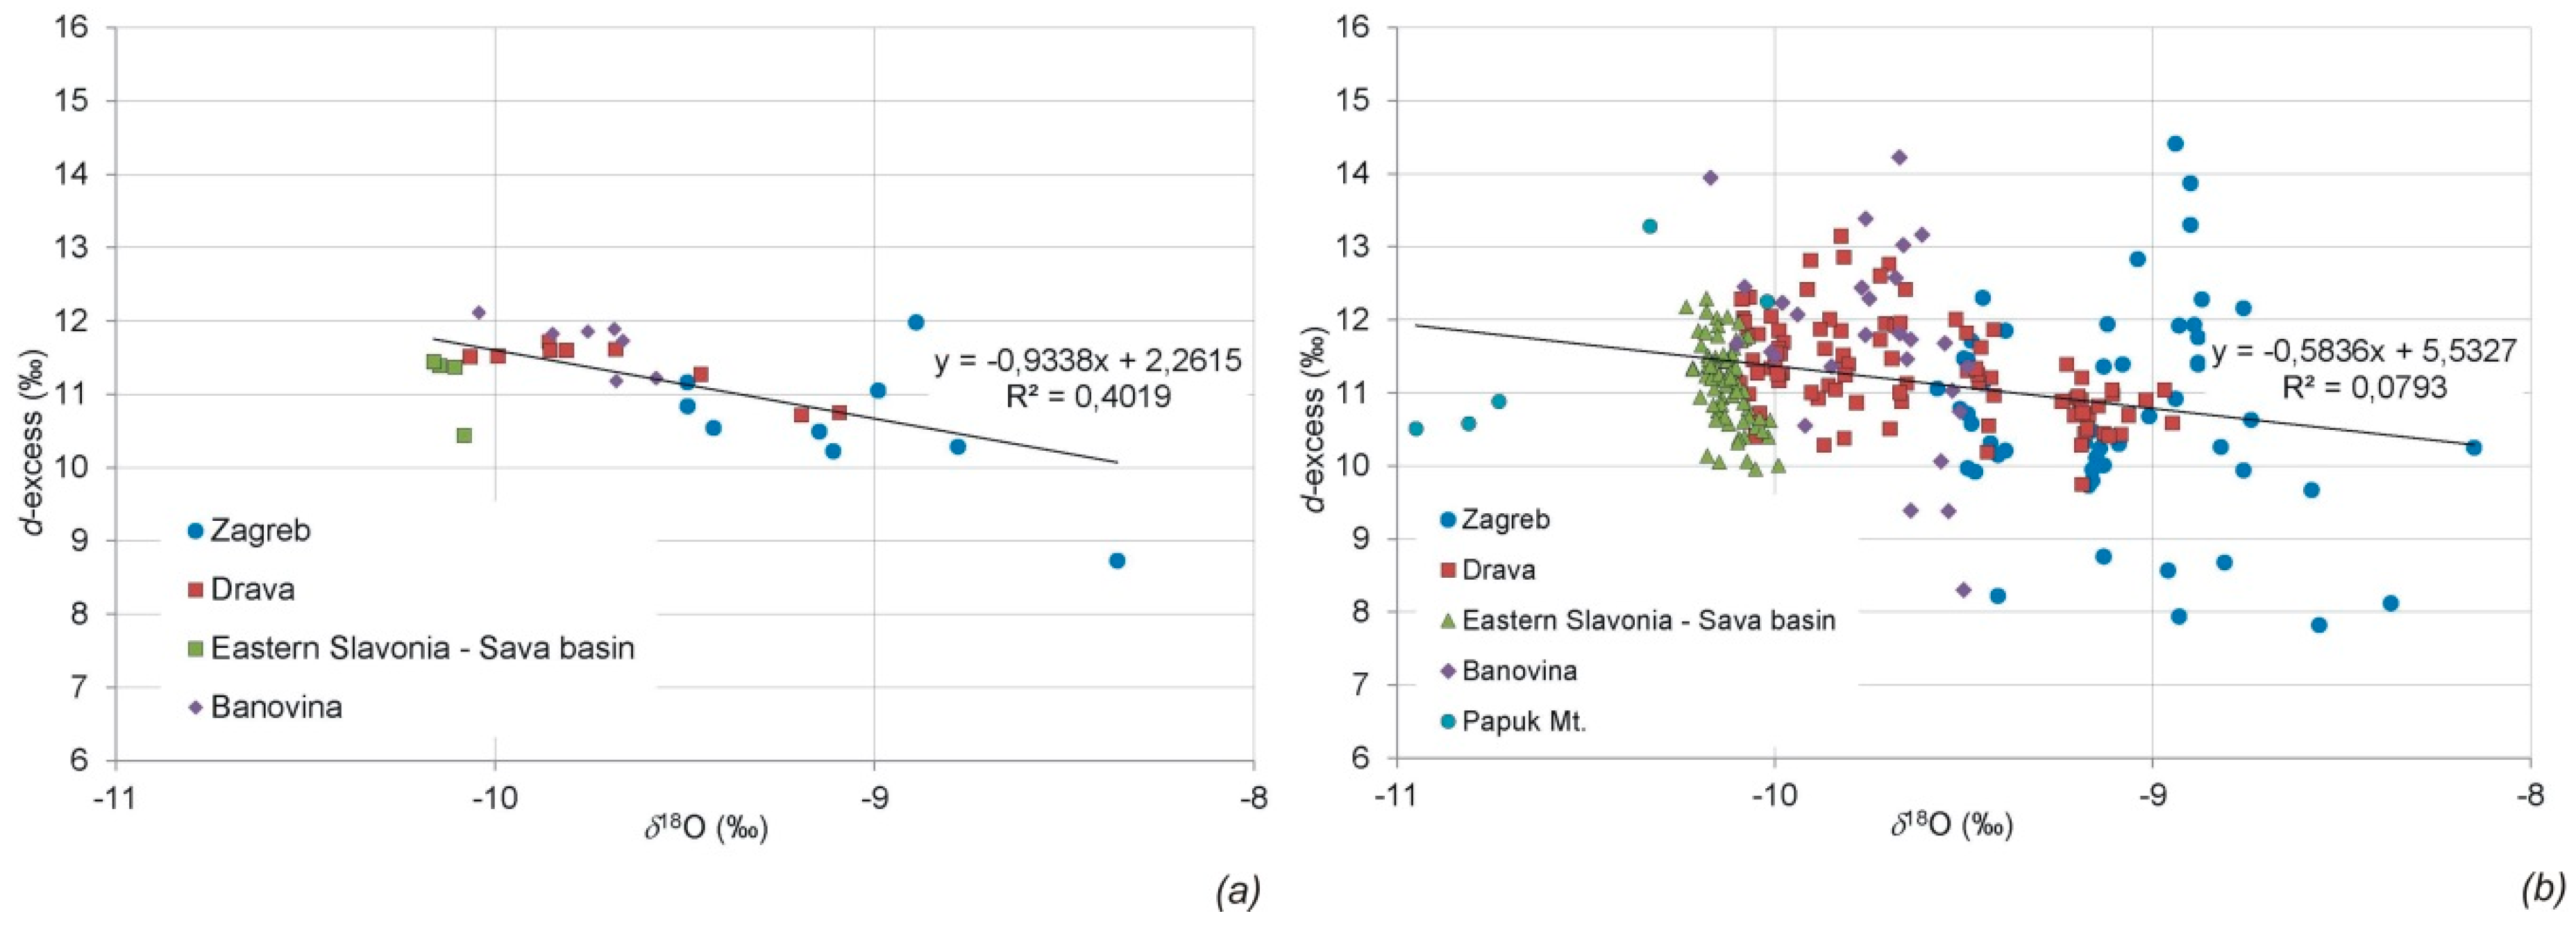
The mean d-excess values of groundwater were determined to be between 8.7‰ and 12.1‰ (Table S2, Figure 8a), while the single values range from 7.8‰ to 14.4‰ (Figure 8b). Higher values of d-excess are attributed to the influence of Mediterranean precipitating air masses [41,45]. Bottyán et al. [97] estimated that the moisture sources of precipitation in Hungary come from the Mediterranean region (57.0%), local moisture (14.8%), the Atlantic region (14.2%), Northern Europe (7.4%), and Eastern Europe (6.6%). Most of the d-excess values in the groundwater samples range from 10‰ to 12‰. This is especially pronounced in the groundwater samples in Eastern Slavonia—the Sava basin—, where the mean residence time of the groundwater is relatively long [29] and, accordingly, the range of d-excess values is relatively narrow—i.e., the differences in climatic conditions (the source of humidity and contribution of air masses) during aquifer recharge are muffled in the groundwater samples. Opposite to this, d-excess is found in a wide range of values in the analysed groundwater samples in the Zagreb and Banovina area. Since higher values of d-excess are characteristic for winter months and lower values for summer months [14,41,45] (as evident in the groundwater samples), it can be concluded that the mean residence time of groundwater is relatively short.
3.3. Tritium Activity in Groundwater
Spatial distribution of an approximate groundwater age estimated by tritium is shown in Figure 9. The mean 3H activity concentrations in the groundwater mostly vary between 4 TU and 10 TU (Tables S3 and S4). In karst aquifers, the 3H activity of the groundwater in the rainy seasons and the mean tritium activity concentrations indicate modern water [9]. For the karst springs Pećina, Majerovo vrelo, and Tonkovića vrelo (areas of the Lika in the Adriatic Sea basin), the groundwater age was estimated using the 3H activity concentration in groundwater and the lumped parameter model [26]. A similar MRT was defined for all three springs and was estimated to be approximately 12 years.
Modern water is also indicated in the groundwater from alluvial aquifers close to the Sava River (Table S4). The highest 3H activity concentrations were measured in the groundwater in the Zagreb area, as well as in the Sava River, which flows through Zagreb. This result is consistent with the well-known fact that the aquifer is recharged by the Sava River in the Zagreb area [29,52,98,99]. The observation wells are located close to the Sava River. The high 3H activity concentrations in the groundwater samples are explained by the release of tritiated water from Krško Nuclear Power Plant, 30 km upstream from Zagreb [27,100]. This indicates the infiltration of surface water from the Sava River into the Quaternary alluvial aquifer. Modern water is indicated in the groundwater accumulated in the porous aquifer and observed close to the Sava River in Eastern Slavonia—the Sava basin—during high water periods (Table 2, Figure 9). In the shallow part of the aquifer system in the western part of the Drava basin (Table 1), modern groundwater is also indicated (Table S4).
The values between 0.8 and 4 TU indicate a mix of sub-modern and modern water. These values were measured in the karst aquifers during summer under base flow conditions (Table S3). A mix of sub-modern and modern water is also indicated in the deep porous aquifer of Bilogora Mt. (label 2 in Figure 1), as well as in the deeper part of the alluvial aquifer system in the western part of the Drava basin (Table S4). 3H activity concentrations less than 0.8 TU were measured in the deep alluvial aquifer in Eastern Slavonia as well as in the deep carbonate aquifer on Ivanščica Mt and in the thermal spring on Papuk Mt (Table S4). In Eastern Slavonia—the Sava basin—, but approximately one km away from the Sava river, 3H activity concentrations were measured only once under conditions of high water and accurately reflects the dynamics of groundwater flow in a semi-confined aquifer. Groundwater is recharged north of the sampled observation well and through relatively thick covering deposits, so the mean residence time of groundwater is relatively long [29]. The aquifer is recharged from the Sava River only in its immediate vicinity and only during high water [29], as evidenced by the measurement of tritium activity.
4. Conclusions
This paper presents an analysis of stable isotope data and tritium activity concentrations in Croatian groundwater at approximately 100 sites. Data were collected between 1997 and 2014. The stable isotope composition was compared with different regional and local meteoric water lines. The primary findings of the study are as follows:
- The composition of groundwater stable isotopes in the Pannonian area of Croatia fits well with the regional meteoric water line for the continental portion of Croatia (RMWL_continent), based on which we conclude that RMWL_continent can be accepted for all future research on the composition of stable isotopes in northern Croatia.
- Although the regional meteoric water line for the coastal part of Croatia (RMWL_coast) was developed according to stable isotopic compositions of precipitation, especially at measuring sites located on the Adriatic coast, it is evident that the line fits well with the composition of the stable isotopes of all analysed karst groundwater. Thus, we conclude that the recharge of the karst aquifers is mainly driven by precipitation introduced by winds blowing from the south of the region as shown by the d-excess, which has a strong Mediterranean influence.
- The composition of the groundwater stable isotopes in the karst part of Croatia agrees well with RMWL_coast, based on which we conclude that RMWL_coast can be used as an accurate reference for all future research on the composition of stable isotopes in the karstic part of Croatia.
- The composition of stable isotopes in the Pannonian part of Croatia forms a unique regional line of Pannonian groundwater.
- The composition of stable isotopes in the karst part of Croatia forms a unique regional line of karst groundwater.
- This article offers a unique summary of data measured over a long period of time and provides a large picture of the stable isotope data found in Croatia. Especially valuable are the insights into the correspondence between the stable isotope data of precipitation and groundwater through LMWLs and local groundwater lines over a large span of time. The fact that this correspondence is best in the karst area is perhaps not a great surprise (since karst areas are known to have the shortest mean residence time), but that the Mediterranean influence is spreading far beyond mountains of a high altitude and corresponds strongly with isotopic groundwater data are findings that will help in further research.
- According to its isotopic composition, almost all the investigated groundwater used in Croatia for various purposes, primarily as drinking water, is modern water, making such water relatively vulnerable to the potential sources of pollution found in the environment. The groundwater that is accumulated in semi-confined aquifers in eastern Croatia is in a better position, as well as the groundwater in the deep carbonate aquifers in northern Croatia, whose age can reach several decades.
- The number of geographical and temporal data points is very large (approximately 100 groundwater measurement locations and 50 precipitation measurement locations, as well as approximately 1000 measurements of the stable isotopes and tritium activity concentrations in groundwater and more than 1000 measurements of the stable isotopes in precipitation), which is significant for all conclusions made.
The present analysis of data on the isotopic composition of groundwater may be useful for future comparisons with other data in different or identical locations to obtain better knowledge on the isotopic composition of groundwater in Croatia and in nearby countries.
Supplementary Materials
The following are available online at https://www.mdpi.com/2073-4441/12/7/1983/s1 and include isotope data in Tables S1–S4.
Author Contributions
Conceptualization, Ž.B.; analysis and interpretation, Ž.B. and M.K.; writing—original draft preparation, Ž.B., M.K. and T.H.; writing—review and editing, O.L. All authors have read and agreed to the published version of the manuscript.
Funding
This research received no external funding.
Acknowledgments
The authors wish to express their gratitude to the former and current HGI-CGS employees who collected the water samples, as well as the authors of unpublished technical reports used in drafting this paper. Special thanks to Zvjezdana Roller-Lutz, under whose leadership SILab, the first laboratory for measuring stable isotopes in Croatia, was established. A lot of measurements used in this work were made under her guidance and supervision, so the authors thank her for mentorship, useful discussions, and lifelong friendship. The authors wish to thank anonymous reviewers and guest editors for their very useful comments which have helped to improve the manuscript.
Conflicts of Interest
The authors declare no conflicts of interest.
References
- International Atomic Energy Agency (IAEA). Global Network of Isotopes in Precipitation. The GNIP Database. Available online: https://nucleus.iaea.org/wiser (accessed on 10 July 2020).
- Maloszewski, P.; Zuber, A. Determining the turnover time of groundwater systems with the aid of environmental tracers. 1. Models and their applicability. J. Hydrol. 1982, 57, 207–231. [Google Scholar] [CrossRef]
- Maloszewski, P.; Zuber, A. Manual on lumped parameter models used for the interpretation of environmental tracer data in groundwater. In Use of Isotopes for Analysis of Flow and Transport Dynamics in Groundwater Systems; Yutsever, Y., Ed.; IAEA: Vienna, Austria, 2002; pp. 1–50. [Google Scholar]
- Maloszewski, P.; Rauert, W.; Stichler, W.; Herrmann, A. Application of flow models in an alpine catchment area using tritium and deuterium data. J. Hydrol. 1983, 66, 319–330. [Google Scholar] [CrossRef]
- Maloszewski, P.; Rauert, W.; Trimborn, P.; Herrmann, A.; Rau, R. Isotope hydrological study of mean transit times in an alpine basin (Wimbachtal, Germany). J. Hydrol. 1992, 140, 343–360. [Google Scholar] [CrossRef]
- Maloszewski, P.; Stichler, W.; Zuber, A.; Rank, D. Identifying the flow systems in a karst-fissured-porous aquifer, the Schneealpe, Austria, by modelling of environmental 18O and 2H isotopes. J. Hydrol. 2002, 256, 48–59. [Google Scholar] [CrossRef]
- McGuire, K.J.; DeWalle, D.R.; Gburek, W.J. Evaluation of mean residence time in subsurface waters using oxygen-18 fluctuations during drought conditions in the mid-Appalachians. J. Hydrol. 2002, 261, 132–149. [Google Scholar] [CrossRef]
- Rozanski, K.; Dulinski, M. A reconnaissance isotope study of waters in the karst of the Western Tatra mountains. Catena 1988, 15, 289–301. [Google Scholar] [CrossRef]
- Clark, I.D.; Fritz, P. Environmental Isotopes in Hydrogeology; Lewis Publishers: London, UK, 1997; p. 328. [Google Scholar]
- Maloszewski, P.; Moser, H.; Stichler, W.; Bertleff, B.; Hedin, K. Modelling of groundwater pollution by riverbank filtration using oxigen-18 data. Ground Water Monit. Manag. 1990, 173, 153–161. [Google Scholar]
- Stichler, W.; Maloszewski, P.; Moser, H. Modelling of river water infiltration using oxigen-18 data. J. Hydrol. 1986, 83, 355–365. [Google Scholar] [CrossRef]
- Brkić, Ž.; Kuhta, M.; Hunjak, T. Groundwater flow mechanism in the well-developed karst aquifer system in the western Croatia: Insights from spring discharge and water isotopes. Catena 2018, 161, 14–26. [Google Scholar] [CrossRef]
- Lauber, U.; Goldscheider, N. Use of artificial and natural tracers to assess groundwater transit-time distribution and flow systems in a high-alpine karts system (Wetterstein Mountains, Germany). Hydrogeol. J. 2014, 22, 1807–1824. [Google Scholar] [CrossRef]
- Rozanski, K.; Araguás-Araguás, L.; Gonfiantini, R. Isotopic pattern in modern global precipitation. In Climate Change in Continental Isotopic Record; Swart, P.K., Lohwan, K.L., Mckenzie, J., Savin, S., Eds.; American Geophysical Union: Washington, DC, USA, 1993; pp. 1–36. [Google Scholar]
- Rozanski, K.; Araguás-Araguás, L. Spatial and temporal variability of stable isotope composition of precipitation over the South American continent. Bull. Inst. Fr. Études Andin. 1995, 24, 379–390. [Google Scholar]
- Aggarwal, P.K.; Alduchov, O.A.; Froehlich, K.O.; Araguás-Araguás, L.J.; Sturchio, N.C.; Kurita, N. Stable isotopes in global precipitation: A unified interpretation based on atmospheric moisture residence time. Geophys. Res. Lett. 2012, 39. [Google Scholar] [CrossRef]
- Sánchez-Murillo, R.; Birkel, C. Groundwater recharge mechanisms inferred from isoscapes in a complex tropical mountainous region. Geophys. Res. Lett. 2016, 4343, 5060–5069. [Google Scholar] [CrossRef]
- Crawford, J.; Hughes, C.E.; Parkes, S.D. Is the isotopic composition of event-based precipitation driven by moisture source or synoptic scale weather in the Sydney Basin, Australia? J. Hydrol. 2013, 507, 213–226. [Google Scholar] [CrossRef]
- Jouzel, J.; Delaygue, G.; Landais, A.; Masson-Delmotte, V.; Risi, C.; Vimeux, F. Water isotopes as tools to document oceanic sources of precipitation. Water Resour. Res. 2013, 49, 7469–7486. [Google Scholar] [CrossRef]
- Paar, D.; Mance, D.; Stroj, A.; Pavić, M. Northern Velebit (Croatia) karst hydrological system: Results of a preliminary 2H and 18O stable isotope study. Geol. Croat. 2019, 72, 205–213. [Google Scholar] [CrossRef]
- Kapelj, S.; Kapelj, J.; Švonja, M. Hydrogeological characteristics of the Jadro and Žrnovnica catchment. Tusculum 2011, 5, 205–216. [Google Scholar]
- Biondić, B.; Biondić, R.; Kapelj, S. Karst groundwater protection in the Kupa River catchment area and sustainable development. Environ. Geol. 2006, 49, 828–839. [Google Scholar] [CrossRef]
- Mandić, M.; Bojić, D.; Roller-Lutz, Z.; Lutz, H.O.; Krajcar Bronić, I. Note on the spring region of Gacka River (Croatia). Isot. Environ. Health Stud. 2008, 44, 201–208. [Google Scholar] [CrossRef]
- Frančišković-Bilinski, S.; Cuculić, V.; Bilinski, H.; Häusler, H.; Stadler, P. Geochemical and stable isotopic variability within two rivers rising under the same mountain but belonging to two distant watersheds. Chem. Erde–Geochem. 2013, 73, 293–308. [Google Scholar] [CrossRef]
- Mance, D.; Hunjak, T.; Lenac, D.; Rubinić, J.; Roller-Lutz, Z. Stable isotope analysis of the karst hydrological systems in the Bay of Kvarner (Croatia). Appl. Rad. Isot. 2014, 90, 23–34. [Google Scholar] [CrossRef]
- Ozyurt, N.N.; Lutz, O.H.; Hunjak, T.; Mance, D.; Roller-Lutz, Z. Characterization of the Gacka River basin karst aquifer (Croatia): Hydrochemistry, stable isotopes and tritium -based mean residence time. Sci. Total Environ. 2014, 487, 245–254. [Google Scholar] [CrossRef] [PubMed]
- Horvatinčić, N.; Barešić, J.; Krajcar Bronić, I.; Karman, K.; Forisz, I.; Obelić, B. Study of the bank filtered groundwater system of the Sava River at Zagreb (Croatia) using isotope analyses. Cent. Eur. Geol. 2011, 54, 121–127. [Google Scholar] [CrossRef] [Green Version]
- Marković, T.; Brkić, Ž.; Larva, O. Using hydrochemical data and modelling to enhance the knowledge of groundwater flow and quality in an alluvial aquifer of Zagreb, Croatia. Sci. Total Environ. 2013, 458–460, 508–516. [Google Scholar] [CrossRef] [PubMed]
- Brkić, Ž.; Briški, M.; Marković, T. Use of hydrochemistry and isotopes for improving the knowledge of groundwater flow in a semiconfined aquifer system of the Eastern Slavonia (Croatia). Catena 2016, 142, 153–165. [Google Scholar] [CrossRef]
- Parlov, J.; Kovač, Z.; Nakić, Z.; Barešić, J. Using water stable isotopes for identifying groundwater recharge sources of the unconfined alluvial Zagreb Aquifer (Croatia). Water 2019, 11, 2177. [Google Scholar] [CrossRef] [Green Version]
- Marković, T.; Karlović, I.; Perčec Tadić, M.; Larva, O. Application of stable water isotopes to improve conceptual model of alluvial aquifer in the Varaždin Area. Water 2020, 12, 379. [Google Scholar] [CrossRef] [Green Version]
- Mezga, K.; Urbanc, J.; Cerar, S. The isotope altitude effect reflected in groundwater: A case study from Slovenia. Isot. Environ. Health. S 2014, 50, 33–51. [Google Scholar] [CrossRef]
- Nikolov, J.; Krajcar Bronić, I.; Todorović, N.; Barešić, J.; Petrović Pantić, T.; Marković, T.; Bikit-Schroeder, K.; Stojković, I.; Tomić, M. A survey of isotopic composition (2H, 3H, 18O) of groundwater from Vojvodina. J. Radioanal. Nucl. Chem. 2019, 320, 385–394. [Google Scholar] [CrossRef]
- Lucas, L.L.; Unterweger, M.P. Comprehensive review and critical evaluation of the half-life of tritium. J. Res. Natl. Inst. Stan. 2000, 105, 541. [Google Scholar] [CrossRef]
- Ingraham, N.L. Isotopic variations in precipitation. In Isotope Tracers in Catchment Hydrology; Kendall, C., McDonnell, J.J., Eds.; Elsevier: London, UK, 1998; pp. 87–118. [Google Scholar]
- Gat, J.R.; Mook, W.G.; Meijer, H.A.J. Atmospheric water. In Environmental Isotopes in the Hydrological Cycle, Principles and Applications, IHP-V, Technical Documents in Hydrology; Mook, W.G., Ed.; UNESCO: Paris, France, 2001; pp. 63–74. [Google Scholar]
- Rózanski, K.; Gonfiantinu, R.; Araguás-Araguás, L. Tritium in the global atmosphere: Distribution patterns and recent trends. J. Phys. G Nucl. Part Phys. 1991, 17, 532–536. [Google Scholar] [CrossRef]
- Tacher, L.L. The distribution of tritium fallout in precipitation over North America. Int. Assoc. Hydrol. Bull. 1962, 77, 48. [Google Scholar] [CrossRef]
- International Atomic Energy Agency (IAEA). Environmental Isotopes in the Hydrological Cycle: Principles and Applications; Gat, J.R., Mook, W.G., Meijer, H.A.J., Eds.; IAEA: Vienna, Austria, 2001; Volume 2, p. 235. [Google Scholar]
- Dulinski, M.; Rozanski, K.; Pierchala, A.; Gorczyca, Z.; Marzec, M. Isotopic composition of precipitation in Poland: A 44-year record. Acta Geophys. 2019, 67, 1637–1648. [Google Scholar] [CrossRef] [Green Version]
- Krajcar Bronić, I.; Barešić, J.; Borković, D.; Sironić, A.; Lovrenčić Mikelić, I.; Vreča, P. Long-term isotope records of precipitation in Zagreb, Croatia. Water 2020, 12, 226. [Google Scholar] [CrossRef] [Green Version]
- Barešić, J.; Štrok, M.; Svetek, B.; Vreča, P.; Krajcar Bronić, I. Activity concentration of tritium (3H) in precipitation—Long-term investigations performed in Croatia and Slovenia. In Proceedings of the Sixth International Conference on Radiation and Applications in Various Fields of Research, Ohrid, North Macedonia, 18–22 June 2018; p. 186. [Google Scholar]
- Horvatinčić, N.; Kapelj, S.; Sironić, A.; Krajcar Bronić, I.; Kapelj, J.; Marković, T. Investigation of water resources and water protection in the karst area of Croatia using isotopic and geochemical analyses. In Proceedings of the Advances in Isotope Hydrology and its Role in Sustainable Water Resources Management (IHS-2007), Vienna, Austria, 21–25 May 2007; Volume 2, pp. 295–304. [Google Scholar]
- Krajcar Bronić, I. Environmental 14C and 3H levels in Croatia. In Proceeding of the 4th International Conference on Environmental Radioactivity: Radionuclides as Tracers of Environmental Processes (ENVIRA 2017), Vilnius, Lithuania, 29 May–2 June 2017; p. 152. [Google Scholar]
- Vreča, P.; Krajcar Bronić, I.; Horvatinčić, N.; Barešić, J. Isotopic characteristics of precipitation in Slovenia and Croatia: Comparison of continental and maritime stations. J. Hydrol. 2006, 330, 457–469. [Google Scholar]
- Vreča, P.; Krajcar Bronić, I.; Leis, A.; Brenčič, M. Isotopic composition of precipitation in Ljubljana (Slovenia). Geologija 2008, 51, 169–180. [Google Scholar] [CrossRef]
- Vreča, P.; Krajcar Bronić, I.; Leis, A.; Demšar, M. Isotopic composition of precipitation at the station Ljubljana (Reaktor), Slovenia—Period 2007–2010. Geologija 2014, 57, 217–230. [Google Scholar] [CrossRef]
- Hebert, D. Technogenic tritium in central European precipitations. Isotopenpraxis 1990, 26, 592–595. [Google Scholar] [CrossRef]
- Kazemi, G.A.; Lehr, J.H.; Perrochet, P. Groundwater Age; Wiley and Sons: London, UK, 2006; p. 325. [Google Scholar]
- Newman, B.D.; Osenbrück, K.; Aeschbach-Hertig, W.; Solomon, D.K.; Cook, P.; Rózanski, K.; Kipfer, R. Dating of “young” groundwaters using environmental trasers: Advantages, applications, and research needs. Isot. Environ. Health Stud. 2010, 46, 259–278. [Google Scholar] [CrossRef]
- Urumović, K.; Hlevnjak, B. The development of basin multilayer aquifer. In Proceedings of the XIX Conference of the Danube Countries on Hydrological Forecasting and Hydrological Bases of Water Management, Osijek, Zagreb, 15–19 June 1998; pp. 519–529. [Google Scholar]
- Brkić, Ž. The relationship of the geological framework to the Quaternary aquifer system in the Sava River valley (Croatia). Geol. Croat. 2017, 70, 201–213. Available online: http://www.geologia-croatica.hr/ojs/index.php/GC/article/view/gc.2017.12/pdf (accessed on 10 July 2020). [CrossRef]
- Biondić, B.; Biondić, R. Hidrogeologija dinarskog krša u Hrvatskoj. In Hydrogeology of the Dinaric Karst in Croatia; Mesec, J., Ed.; University of Zagreb, Faculty of Geotehnical Engineering: Varaždin, Croatia, 2014; p. 341. ISBN 978-953-96597-7-4. [Google Scholar]
- Bonacci, O. Karst Hydrology; Springer: Berlin/Heilderbelg, Germany, 1987; p. 173. [Google Scholar]
- Slišković, I. Vode u kršu slivova Neretve i Cetine. In Water in the Karst of the Neretva and Cetina River Basins; Halamić, J., Ed.; Department of Hydrogeology and Engineering Geology: Zagreb, Croatia, 2014. [Google Scholar]
- Zaninović, K.; Gajić-Čapka, M.; Perčec Tadić, M.; Vučetić, M.; Milković, J.; Bajić, A.; Cindrić, K.; Cvitan, L.; Katušin, Z.; Kaučić, D.; et al. Klimatski Atlas Hrvatske/Climate Atlas of Croatia 1961–1990, 1971–2000; State Hydrometeorological Institute: Zagreb, Croatia, 2008; Available online: https://klima.hr/razno/publikacije/klimatski_atlas_hrvatske.pdf (accessed on 10 July 2020).
- International Atomic Energy Agency (IAEA). Stable Isotope Hydrology: Deuterium and Oxygen-18 in Water Cycle; Gat, J.R., Gonfiantini, R., Eds.; Technical Reports Series 210; IAEA: Vienna, Austria, 1981; p. 339. [Google Scholar]
- Coplen, T.B. New guidelines for the reporting of stable hydrogen, carbon, and oxygen isotope ratio data. Geochim. Cosmochim. Acta 1996, 60, 3359. [Google Scholar] [CrossRef]
- Dunn, P.J.H.; Carter, J.F. Good Practice Guide for Isotope Ratio Mass Spectrometry, 2nd ed.; FIRMS: Bristol, UK, 2018; p. 84. ISBN 978-0-948926-33-4. Available online: http://www.forensic-isotopes.org/gpg.html (accessed on 10 July 2020).
- Horvatinčić, N. Radiocarbon and tritium measurements in water samples and application of isotopic analyses in hydrology. Fizika 1980, 12, 201–218. [Google Scholar]
- Krajcar Bronić, I.; Obelić, B.; Srdoč, D. The simultaneous measurement of tritium activity and background count rate in a proportional counter by the Povinec method: Three years’ experience at the Rudjer Bošković Institute. Nucl. Instrum. Methods Phys. Res. B 1986, 17, 498–500. [Google Scholar] [CrossRef]
- Barešić, J.; Horvatinčić, N.; Krajcar Bronić, I.; Obelić, B. Comparison of two techniques for low-level tritium measurement—Gas proportional and liquid scintillation counting. In Proceedings of the Third European IRPA Congress, Helsinki, Finland, 14–18 June 2010; pp. 1988–1992. [Google Scholar]
- Barešić, J.; Krajcar Bronić, I.; Horvatinčić, N.; Obelić, B.; Sironić, A.; Kožar-Logar, J. Tritium activity measurement of water samples using liquid scintillation counter and electrolytical enrichment. In Proceedings of the 8th Symposium of the Croatian Radiation Protection Association, Krakow, Croatia, 13–15 April 2011; pp. 461–467. [Google Scholar]
- Krajcar Bronić, I.; Barešić, J.; Sironić, A.; Horvatinčić, N. Stability analysis of systems for preparation and measurement of 3H and 14C (Analiza stabilnosti sustava za pripremu i mjerenje 3H i 14C, in Croatian with English Abstract). In Proceedings of the 9th Symposium of the Croatian Radiation Protection Association, Krakow, Croatia, 10–12 April 2013; pp. 495–501. [Google Scholar]
- Stojković, I.; Todorović, N.; Nikolov, J.; Krajcar Bronić, I.; Barešić, J.; Kozmidic Luburić, U. Methodology of tritium determination in aqueous samples by Liquid Scintillation Counting techniques. In Tritium—Advances in Research and Applications; Janković, M.M., Ed.; NOVA Science Publishers: New York, NY, USA, 2018; pp. 99–156. [Google Scholar]
- Lobby Factors. Croatian Geological Survey: HGI-CGS Database. Available online: https://lobbyfacts.eu/representative/c1243fabb99641be8382bf2a80b68d61/croatian-geological-survey (accessed on 10 July 2020).
- Brkić, Ž.; Marković, T. Jasenik—Additional Hydrogeological Investigations: Technical Report; Croatian Geological Survey: Zagreb, Croatia, 2014. (In Croatian) [Google Scholar]
- Brkić, Ž.; Marković, T.; Larva, O. A Hydrogeological Study for the Purpose of Defining Groundwater Exploitation Resources in the Area of Koprivnica—Đurđevac: Technical Report; Croatian Geological Survey: Zagreb, Croatia, 2014. (In Croatian) [Google Scholar]
- Larva, O.; Marković, T.; Mraz, V. Hydrodynamic and hydrochemical conditions at the groundwater source “Pašino vrelo”, with a focus on its development. Geol. Croat. 2010, 6363, 299–312. [Google Scholar] [CrossRef]
- IGH-IGI. Geophysical and Hydrogeological Investigations, Dubočanka Valley—Papuk: Technical Report; Croatian Geological Survey: Zagreb, Croatia, 2003. (In Croatian) [Google Scholar]
- Kuhta, M. Tisovac Spring—Water Supply Požeština (Papuk Nature Park)–Hydrogeological Studies: Technical Report; Croatian Geological Survey: Zagreb, Croatia, 2014. (In Croatian) [Google Scholar]
- Larva, O.; Marković, T.; Mraz, V. Krapina-Zagorje County—Lobor Pumping Station—Hydrogeological Investigations to Determine Exploitation Groundwater Resources: Technical Report; Croatian Geological Survey: Zagreb, Croatia, 2014. (In Croatian) [Google Scholar]
- Biondić, B.; Kapelj, S.; Kuhta, K. Water Management Plan of the Republic of Croatia. GIS of Istria: Hydrogeology: Technical Report; Croatian Geological Survey: Zagreb, Croatia, 1999. (In Croatian) [Google Scholar]
- Biondić, B.; Kapelj, S.; Rubinić, J. Transboundary Aquifers of Croatia and Slovenia between the Kvarner Bay and the Trieste Bay: Technical Report; Croatian Geological Survey: Zagreb, Croatia, 2004. (In Croatian) [Google Scholar]
- Biondić, R.; Biondić, B.; Kapelj, S. Hydrogeological Investigation of the Novljanska Žrnovnica spring: Technical Report; Croatian Geological Survey: Zagreb, Croatia, 1997. (In Croatian) [Google Scholar]
- Biondić, B.; Kapelj, S.; Biondić, D.; Biondić, R.; Novosel, A. A Vulnerability Study of the Upper Part Kupa River Basin: Technical Report; Croatian Geological Survey: Zagreb, Croatia, 2002. (In Croatian) [Google Scholar]
- Pavičić, A.; Prelogović, E.; Kapelj, J.; Biondić, D.; Kapelj, S.; Hinić, V. A Vulnerability Study of the Gacka River. Technical Report; Croatian Geological Survey: Zagreb, Croatia, 1997. (In Croatian) [Google Scholar]
- Pavičić, A.; Terzić, J.; Marković, T. Hydrogeological Investigation of the in the Wider Area of the Korenica Spring (Phase II): Technical Report; Croatian Geological Survey: Zagreb, Croatia, 2006. (In Croatian) [Google Scholar]
- Pavičić, A.; Terzić, J.; Marković, T.; Dukarić, A. Hydrogeological Report on the Establishment of the Lička Jasenica Regional Pumping Site: Technical Report; Croatian Geological Survey: Zagreb, Croatia, 2008. (In Croatian) [Google Scholar]
- Kuhta, M.; Božičević, S.; Kapelj, S.; Miko, S. A Study of the Protection and Use of Valuable Natural Features of the Modrič Cave and Its Surroundings: Technical Report; Croatian Geological Survey: Zagreb, Croatia, 1999. (In Croatian) [Google Scholar]
- Kapelj, S.; Kapelj, S.; Singer, D. Hydrogeological Investigation of the Jadro and Žrnovnica Catchment Areas (Phase II). Technical Report; Croatian Geological Survey: Zagreb, Croatia, 2002. (In Croatian) [Google Scholar]
- Buljan, R. Spring Lopuško vrelo—Proposal of the Sanitary Protection Zones: Technical Report; Croatian Geological Survey: Zagreb, Croatia, 2002. (In Croatian) [Google Scholar]
- Dansgaard, W. Stable isotopes in precipitation. Tellus 1964, 16, 436–468. [Google Scholar] [CrossRef]
- Craig, H. Standard for reporting concentrations of deuterium and oxygen-18 in natural waters. Science 1961, 133, 1833–1834. [Google Scholar] [CrossRef] [PubMed]
- Dansgaard, W. The isotope composition of natural waters. Medd. Grønland 1961, 165, 120. [Google Scholar]
- Froehlich, K.; Gibson, J.; Aggarwal, P. Deuterium excess in precipitation and its climatological significance. In Proceedings of the Study of Environmental Change Using Isotope Techniques, Vienna, Austria, 23–27 April 2001; pp. 54–66. [Google Scholar]
- Crawford, J.; Hughes, C.E.; Lykoudis, S. Alternative least squares methods for determining the meteoric water line, demonstrated using GNIP data. J. Hydrol. 2014, 519, 2331–2340. [Google Scholar] [CrossRef]
- Hughes, C.E.; Crawford, J. A new precipitation weighted method for determining the meteoric water line for hydrological applications demonstrated using Australian and global GNIP data. J. Hydrol. 2012, 464, 344–351. [Google Scholar] [CrossRef]
- Hunjak, T. Spatial Distribution of Oxygen and Hydrogen Stable Isotopes from Precipitation in Croatia. Ph.D. Thesis, University of Zagreb, Zagreb, Croatia, 2015; 82p. (In Croatian). [Google Scholar]
- Hunjak, T.; Lutz, H.O.; Roller-Lutz, Z. Stable isotope composition of the meteoric precipitation in Croatia. Isot. Environ. Health. S 2013, 4949, 36–345. [Google Scholar] [CrossRef]
- Vreča, P.; Krajcar Bronić, I.; Leis, A. Isotopic composition of precipitation in Portorož (Slovenia). Geologija 2011, 5454, 129–138. [Google Scholar] [CrossRef]
- Vreča, P.; Krajcar Bronić, I.; Leis, A. Isotopic composition of precipitation at the station Portorož, Slovenia—Period 2007–2010. Geologija 2015, 5858, 233–246. [Google Scholar] [CrossRef] [Green Version]
- Hunjak, T.; Roller-Lutz, Z. Interpretation of the Composition of Stable Isotopes of Precipitation in Northern Croatia: Report; SILab Stable Isotope Laboratory at the Physics Department, School of Medicine, University of Rijeka: Rijeka, Croatia, 2013. (In Croatian) [Google Scholar]
- Pfahl, S.; Sodremann, H. What controls deuterium excess in global precipitation? Clim. Past 2014, 10, 771–781. [Google Scholar] [CrossRef] [Green Version]
- Peng, H.; Mayer, B.; Harris, S.; Krouse, H.R. The influence of below-cloud secondary effects on the stable isotope composition of hydrogen and oxygen in precipitation at Calgary, Alberta, Canada. Tellus 2007, 5959, 698–704. [Google Scholar] [CrossRef]
- Vogel, J.C.; Lerman, J.C.; Mook, W.G. Natural isotopes in surface and groundwater from Argentina. Hydrol. Sci. Bull. 1975, 2020, 203–221. [Google Scholar]
- Bottyán, E.; Czuppon, G.; Weidinger, T.; Haszpra, L.; Kármán, K. Moisture source diagnostics and isotope characteristics for precipitation in east Hungary: Implications for their relationship. Hydrolog. Sci. J. 2017, 6262, 2049–2060. [Google Scholar] [CrossRef]
- Posavec, K. Identification and Prediction of Minimum Ground Water Levels of Zagreb Alluvial Aquifer Using Recession Curve Models. Ph.D. Thesis, University of Zagreb, Zagreb, Croatia, 2016; 89p. (In Croatian). [Google Scholar]
- Brkić, Ž.; Larva, O.; Urumović, K. Quantity status of groundwater in alluvial aquifers in Northern Croatia. Geol. Croat. 2010, 63, 283–298. [Google Scholar] [CrossRef]
- Barešić, J.; Parlov, J.; Kovač, Z.; Sironić, A. Use of nuclear power plant released tritium as a groundwater tracer. Rud. Geol. Naft. Zb. 2019, 3535, 25–35. Available online: https://hrcak.srce.hr/ojs/index.php/rgn/article/view/9589 (accessed on 10 July 2020). [CrossRef] [Green Version]
Figure 1.
Aquifer types in Croatia, geographical areas (schematic), and the locations of the isotope composition measurements. The colours of the sampling points and the frame colours of the geographical areas correspond to the colours of the points in Figure 2, Figure 3, Figure 4, Figure 5, Figure 6, Figure 7 and Figure 8.

Figure 2.
The regional meteoric water line of the coastal part of Croatia (RMWL_coast) and the stable isotope composition of the spring water in the Dinaric karst in Croatia: (a) the mean values of the stable isotopes and (b) the single values of the stable isotopes.
Figure 2.
The regional meteoric water line of the coastal part of Croatia (RMWL_coast) and the stable isotope composition of the spring water in the Dinaric karst in Croatia: (a) the mean values of the stable isotopes and (b) the single values of the stable isotopes.

Figure 3.
Local meteoric water lines (LMWLs) and the single values of the groundwater stable isotopes in the Dinaric karst in Croatia: (a) Istria, (b) Hrvatsko Primorje and Gorski Kotar, (c) Gorski Kotar and Lika, and (d) Dalmatia.
Figure 3.
Local meteoric water lines (LMWLs) and the single values of the groundwater stable isotopes in the Dinaric karst in Croatia: (a) Istria, (b) Hrvatsko Primorje and Gorski Kotar, (c) Gorski Kotar and Lika, and (d) Dalmatia.

Figure 4.
The mean δ18O vs. the shortest distance from the sea.

Figure 5.
Linear relationship between δ18O and d-excess of karst groundwater: (a) the mean values and (b) the single values.
Figure 5.
Linear relationship between δ18O and d-excess of karst groundwater: (a) the mean values and (b) the single values.

Figure 6.
The regional meteoric water line of the continental part of Croatia (RMWL_continent) and the stable isotope composition of spring water in the Pannonian part in Croatia: (a) the mean values of stable isotopes and (b) the single values of stable isotopes.
Figure 6.
The regional meteoric water line of the continental part of Croatia (RMWL_continent) and the stable isotope composition of spring water in the Pannonian part in Croatia: (a) the mean values of stable isotopes and (b) the single values of stable isotopes.

Figure 7.
LMWLs and the single stable isotope composition of groundwater in the Pannonian part of Croatia: (a) groundwater in the Zagreb aquifer and LMWL Zagreb, (b) groundwater in the Zagreb aquifer and LMWL Ljubljana, (c) the Drava Basin, and (d) Eastern Slavonia—the Sava basin.
Figure 7.
LMWLs and the single stable isotope composition of groundwater in the Pannonian part of Croatia: (a) groundwater in the Zagreb aquifer and LMWL Zagreb, (b) groundwater in the Zagreb aquifer and LMWL Ljubljana, (c) the Drava Basin, and (d) Eastern Slavonia—the Sava basin.

Figure 8.
Relationship between δ18O and d-excess in the analysed groundwater in the Pannonian part of Croatia: (a) the mean values and (b) the single values.
Figure 8.
Relationship between δ18O and d-excess in the analysed groundwater in the Pannonian part of Croatia: (a) the mean values and (b) the single values.

Figure 9.
Spatial distribution of an approximate groundwater age using tritium activity.


Table 1.
Information on the measurement points in the Pannonian part of Croatia. Legend: measurement point type (OW—observation well, S—spring), lithology (G—gravel, S—sand, L—limestone; D—dolomite).
Table 1.
Information on the measurement points in the Pannonian part of Croatia. Legend: measurement point type (OW—observation well, S—spring), lithology (G—gravel, S—sand, L—limestone; D—dolomite).
| Sampling Location | Measurement Point Type | Longitude (°) | Latitude (°) | Z (m a.s.l.) | Screen Bottom (m a.s.l.) | Lithology | Geographical Area | Sampling Time | Number of Stable Isotope Samples | Number of 3H Samples | Data Source |
|---|---|---|---|---|---|---|---|---|---|---|---|
| ČDP-9/1 | OW | 16.07 | 45.76 | 107.75 | 31.8 | G | western part of the Sava basin (Zagreb area) | 2001–2003 | 7 | 7 | [28,66] |
| ČDP-9/2 | OW | 16.07 | 45.76 | 107.75 | 62.8 | G | 2001–2003 | 7 | 7 | [28,66] | |
| ČDP-9/3 | OW | 16.07 | 45.76 | 107.75 | 88.8 | G | 2001–2003 | 7 | 7 | [28,66] | |
| ČDP-23/1 | OW | 16.13 | 45.75 | 103.79 | 18.8 | G | 2001–2003 | 7 | 7 | [28,66] | |
| ČDP-23/2 | OW | 16.13 | 45.75 | 103.79 | 47.8 | G | 2001–2003 | 7 | 7 | [28,66] | |
| ČDP-23/3 | OW | 16.13 | 45.75 | 103.79 | 86.2 | G | 2001–2003 | 7 | 7 | [28,66] | |
| PP-18/20 | OW | 16.04 | 45.77 | 108.25 | 87.8 | G | 2001–2003 | 7 | 3 | [28,66] | |
| PP-18/40 | OW | 16.04 | 45.77 | 108.25 | 67.9 | G | 2001–2003 | 7 | 3 | [28,66] | |
| PP-18/90 | OW | 16.04 | 45.77 | 108.25 | 19.3 | G | 2001–2003 | 7 | 3 | [28,66] | |
| JP-10 | OW | 16.04 | 45.77 | 107.88 | 70.1 | G | 2001–2003 | 7 | 4 | [28,66] | |
| SPB-J | OW | 17.06 | 45.93 | 175.00 | 79.0 | G, S | Bilogora Mt. | 2013 | 1 | 2 | [66,67] |
| GR-1D | OW | 16.75 | 46.21 | 143.04 | 99.1 | G | western part of the Drava basin | 2013–2014 | 7 | [66,68] | |
| KP-12A | OW | 16.85 | 46.14 | 138.50 | 115.5 | G | 2013–2014 | 11 | 2 | [66,68] | |
| KP-12 | OW | 16.85 | 46.14 | 138.00 | 49.0 | G | 2013–2014 | 12 | 2 | [66,68] | |
| SO-1 | OW | 16.95 | 46.10 | 126.00 | 112.0 | G, S | 2013–2014 | 12 | 2 | [66,68] | |
| O-6 | OW | 16.95 | 46.10 | 126.00 | 54.0 | G, S | 2013–2014 | 12 | [66,68] | ||
| VIRJE | OW | 17.01 | 46.06 | 125.00 | 115.0 | G, S | 2013–2014 | 12 | [66,68] | ||
| SPB-8 | OW | 17.05 | 46.06 | 117.50 | 49.5 | G, S | 2013–2014 | 11 | 2 | [66,68] | |
| SPB-10 | OW | 17.03 | 46.05 | 126.50 | 62.5 | G, S | 2013–2014 | 7 | [66,68] | ||
| ĐN-3 | OW | 17.08 | 45.98 | 141.00 | 92.7 | G, S | 2013–2014 | 7 | [66,68] | ||
| SPB-4 | OW | 18.47 | 45.13 | 83.00 | 16.3 | G, S | Eastern Slavonia—Sava basin | 2012–2013 | 17 | [29,66] | |
| SPB-7 | OW | 18.45 | 45.10 | 85.50 | 16.2 | G, S | 2012–2013 | 17 | 1 | [29,66] | |
| SPB-9 | OW | 18.45 | 45.10 | 85.00 | 9.5 | G, S | 2012–2013 | 17 | 1 | [29,66] | |
| V-13 | OW | 18.48 | 45.07 | 87.00 | 55.8 | G, S | 2012–2013 | 17 | 1 | [29,66] | |
| SPBPv | OW | 16.44 | 45.27 | 182.70 | L | Banovina | 2006–2007 | 4 | 1 | [66,69] | |
| B-1 | OW | 16.42 | 45.29 | 178.60 | L | 2006–2007 | 4 | 1 | [66,69] | ||
| B-2 | OW | 16.42 | 45.29 | 178.60 | L | 2006–2007 | 4 | 1 | [66,69] | ||
| B-3 | OW | 16.42 | 45.29 | 178.60 | 145.6 | L | 2006–2007 | 4 | 1 | [66,69] | |
| Bojanića vrelo | S | 16.43 | 45.29 | L | 2006–2007 | 4 | 1 | [66,69] | |||
| Grabovac | S | 16.41 | 45.28 | L | 2006–2007 | 4 | 1 | [66,69] | |||
| Pašino vrelo | S | 16.43 | 45.29 | L | 2006–2007 | 4 | 1 | [66,69] | |||
| Veličanka | S | 17,64 | 45,50 | 512.00 | D | Papuk Mt. | 2002 | 1 | 1 | [66,70] | |
| Dubočanka | S | 17.68 | 45.50 | 490.00 | D | 2002 | 1 | 3 | [66,70,71] | ||
| Tisovac I | S | 17.69 | 45.50 | 495.00 | D | 2002, 2013 | 1 | 3 | [66,70,71] | ||
| Tisovac II | S | 17.69 | 45.50 | 487.00 | D | 2002, 2013 | 1 | 3 | [66,70,71] | ||
| Tisovac III | S | 17.68 | 45.49 | 465.00 | D | 2002, 2013 | 1 | 3 | [66,70,71] | ||
| Subthermal spring | S | 17.66 | 45.47 | 287.00 | D | 2013 | 2 | [66,71] | |||
| LO-1 | OW | 16.06 | 46.17 | 322.00 | Open hole to 140 m | D | Ivanščica Mt. | 2013 | 1 | [66,72] | |
| LO-4 | OW | 16.06 | 46.16 | 280.00 | D | 2013 | 1 | [66,72] | |||
| LO-5 | OW | 16.06 | 46.17 | 305.00 | Open hole to 214–244 m | D | 2013 | 1 | [66,72] | ||
| Škrabutnik | S | 16.08 | 46.19 | 447.00 | D | 2013 | 1 | [66,72] |
Table 2.
Information on the measurement points in the karst part of Croatia. Legend: measurement point type (OW—observation well, S—spring, M—mine).
Table 2.
Information on the measurement points in the karst part of Croatia. Legend: measurement point type (OW—observation well, S—spring, M—mine).
| Sample ID | Measurement Point Type | Longitude (°) | Latitude (°) | Z (m a.s.l.) | Geographical Area | Sampling Time | Number of Stable Isotope Samples | Number of 3H Samples | Data Source |
|---|---|---|---|---|---|---|---|---|---|
| Bubić jama | S | 14.16 | 45.14 | 20.0 | 1998 | 2 | 2 | [66,73] | |
| Bulaž | S | 13.89 | 45.38 | 18.0 | 1998, 2001–2003 | 9 | 7 | [66,73,74] | |
| Fonte Gajo | S | 14.07 | 45.07 | 5.0 | 1998 | 2 | 2 | [66,73] | |
| Gradole | S | 13.70 | 45.34 | 5.0 | 1998, 2001–2003 | 9 | 7 | [66,73,74] | |
| Rakonek | S | 14.02 | 45.09 | 5.0 | 1998 | 2 | 2 | [66,73] | |
| Rudničke vode | M | 14.15 | 45.08 | 2.0 | Istria | 1998 | 2 | 2 | [66,73] |
| Sv. Ivan | S | 13.98 | 45.40 | 48.0 | 1998, 2001–2003 | 9 | 7 | [66,73,74] | |
| Šišan | S | 13.92 | 44.86 | 49.0 | 1998 | 2 | 2 | [66,73] | |
| Funtana | S | 13.61 | 45.18 | 2.0 | 1998 | 1 | 2 | [66,73] | |
| Karpi | S | 13.85 | 44.93 | 50.0 | 1998 | 1 | 2 | [66,73] | |
| Vela Učka | S | 14.19 | 45.30 | 926.0 | 1998 | 2 | 2 | [66,73] | |
| Rječina | S | 14.42 | 45.42 | 325.0 | 1997–1998, 2001–2003, 2012–2013 | 23 | 12 | [12,66,73,74] | |
| Zvir | S | 14.45 | 45.33 | 5.0 | 1997–1998, 2001–2003, 2012–2013 | 23 | 13 | [12,66,73,74] | |
| Kristal | S | 14.30 | 45.33 | 0.0 | 2001–2003 | 7 | 7 | [66,74] | |
| Novljanska Žrnovnica | S | 14.85 | 45.12 | 1.5 | Hrvatsko Primorje | 1997, 1999 | 6 | 4 | [66,75] |
| Martinščica | OW * | 14.48 | 45.32 | 2.0 | 1999 | 5 | 4 | [66,75] | |
| Perilo | OW * | 14.54 | 45.31 | 1.0 | 1999 | 4 | 4 | [66,75] | |
| Čabranka | S | 14.64 | 45.60 | 552.0 | 1997–1999, 2001–2003 | 10 | 10 | [66,74,76] | |
| Kupa | S | 14.69 | 45.49 | 320.0 | 1997–1999 | 5 | 5 | [66,76] | |
| Kupica | S | 14.85 | 45.43 | 250.0 | 1997–1999 | 5 | 5 | [66,76] | |
| Kupari | S | 14.70 | 45.50 | 310.0 | 1997–1999 | 5 | 5 | [66,76] | |
| Mala Belica | S | 14.80 | 45.46 | 290.0 | 1997–1999 | 5 | 5 | [66,76] | |
| Velika Belica | S | 14.76 | 45.48 | 290.0 | Gorski Kotar | 1997–1998 | 4 | 4 | [66,76] |
| Zeleni vir | S | 14.90 | 45.42 | 350.0 | 1997–1999 | 5 | 5 | [66,76] | |
| Gerovčica spring | S | 14.68 | 45.53 | 320.0 | 1997–1999 | 5 | 5 | [66,76] | |
| Gomirje | S | 15.13 | 45.33 | 377.0 | 2002 | 1 | [66] | ||
| Mala Lešnica | S | 14.85 | 45.44 | 238.0 | 2002 | 1 | [66] | ||
| Vitunjčica | S | 15.14 | 45.29 | 349.0 | 2002 | 1 | [66] | ||
| Kamačnik | S | 15.06 | 45.35 | 415.0 | 2002 | 1 | [66] | ||
| Majerovo vrelo | S | 15.36 | 44.81 | 462.0 | 1996, 2005–2008 | 28 | 21 | [26,66,77] | |
| Tonkovića vrelo | S | 15.37 | 44.79 | 457.0 | 1996, 2005–2008 | 27 | 18 | [26,66,77] | |
| Pećina | S | 15.33 | 44.80 | 456.0 | 1996, 2005–2008 | 29 | 21 | [26,66,77] | |
| Klanjac | S | 15.37 | 44.79 | 458.0 | Lika (Adriatic Sea basin) | 2005, 2008 | 14 | [26,66] | |
| Grab | S | 15.32 | 44.85 | 454.0 | 2008 | 10 | [26,66] | ||
| Jaz | S | 15.32 | 44.81 | 456.0 | 2005, 2008 | 10 | [26,66] | ||
| Knjapovac | S | 15.36 | 44.79 | 459.0 | 2005–2006, 2008 | 13 | [26,66] | ||
| Marusino vrelo | S | 15.32 | 44.81 | 456.0 | 2005–2006, 2008 | 14 | [26,66] | ||
| Korenička Rijeka spring | S | 15.65 | 44.78 | 695.0 | 2006 | 1 | 1 | [66,78] | |
| Kameniti vrelac | S | 15.66 | 44.77 | 690.0 | 2006 | 1 | 1 | [66,78] | |
| Koreničko vrelo | S | 15.67 | 44.77 | 700.0 | Lika (Danube River basin) | 2006 | 1 | 1 | [66,78] |
| Makarevo vrelo | S | 15.66 | 44.78 | 695.0 | 2006 | 1 | 1 | [66,78] | |
| Mlinac | S | 15.66 | 44.78 | 700.0 | 2006 | 1 | 1 | [66,78] | |
| Stipinovac | S | 15.46 | 44.97 | 696.0 | 2006 | 1 | 1 | [66,78] | |
| Malo vrelo Ličke Jesenice | S | 15.44 | 44.97 | 481.0 | 2007–2008 | 3 | 3 | [66,79] | |
| Veliko vrelo Ličke Jesenice | S | 15.46 | 44.97 | 479.0 | 2007–2008 | 3 | 3 | [66,79] | |
| Vrilo Velebita | S | 15.54 | 44.26 | 0.0 | 1999 | 1 | [66,80] | ||
| Vrulja Modrič | S | 15.54 | 44.26 | 0.0 | 1999 | 1 | [66,80] | ||
| Jadro | S | 16.52 | 43.54 | 40.0 | 2001 | 4 | 4 | [66,81] | |
| Žrnovica | S | 16.57 | 43.52 | 90.0 | 2001 | 4 | 4 | [66,81] | |
| B-22A | OW | 16.71 | 43.58 | 335.0 | Dalmatia | 2001 | 4 | 4 | [66,81] |
| Krka | S | 16.24 | 44.04 | 225.0 | 2001 | 1 | 1 | [66,82] | |
| Lopuško vrelo | S | 16.22 | 44.02 | 230.0 | 2001 | 1 | 1 | [66,82] | |
| Kosovčica spring | S | 16.25 | 43.94 | 250.0 | 2001 | 1 | 1 | [66,82] | |
| Modro oko | S | 17.51 | 43.06 | 1.5 | 2005 | 2 | [66] | ||
| Opačac | S | 17.18 | 43.45 | 266.2 | 2005 | 2 | [66] |
* group of observation wells.
Table 3.
Local meteoric water lines (LMWLs) used in this paper.
| Name of RMWL/LMWL in This Paper | Station (Altitude m a.s.l.) | Observation Period | δ2H/δ18O Correlation Equation | R or rmSSE * | N | Data Source |
|---|---|---|---|---|---|---|
| RMWL_continent | Bilogora (202), Zagreb (158), Sirač (161), Plitvička jezera (580), Sikirevci (82), Veliki Grđevac (148), Medicinska škola Varaždin (173), Sokolovac (207), Jastrebarsko (152), Duga Resa (130), Virovitica (122), Slavonski Brod (92), Bedekovčina (160), Sošice (560), Pogana jama (980), Grdanjci (185) i Karlovac (126) | 2008–2013 | δ2H = (7.4 ± 0.005) × δ18O + (4.1 ± 0.5) | 0.99 | 524 | [89] |
| RMWL_coast | Labin (263), Vežica (219), Zadar (2), Opatija (0), Kastav (333), Rijeka_Medicinski fakultet (12), Kukuljanovo (281), Ponikve (20), Ičići (1), Vrh, Pehlin (278), Jadranovo (0), Kraj (72), Mali Lošinj (1.9), Zadar GNIP (5), Komiža-Vis GNIP (6), Dubrovnik GNIP (52), Split (42) i Murter (16.6) | 2008–2013 | δ2H = (7.0 ± 0.08) × δ18O + (4.4 ± 0.5) | 0.96 | 655 | [89] |
| LMWL_Portorož | Portorož—Airport (2) | 2001–2003 | δ2H = (7.7 ± 0.4) × δ18O + (7.3 ± 2.2) | 0.96 | 35 | [45] |
| LMWL_Portorož_OLSR | Portorož—Airport (2) | 2000–2006 | δ2H = (7.82 ± 0.23) × δ18O + (7.84 ± 1.57) | 0.97 | 74 | [91] |
| LMWL_Portorož_RMA | Portorož—Airport (2) | 2000–2006 | δ2H = (8.05 ± 0.22) × δ18O + (9.35 ± 1.55) | 0.97 | 74 | [91] |
| LMWL_Portorož_PWLSR | Portorož—Airport (2) | 2007–2010 | δ2H = (7.8 ± 0.27) × δ18O + (8.52 ± 1.85) | 0.96 | 71 | [92] |
| LMWL_Hrvatsko Primorje | Kukuljanovo (281), Pehlin (278), Škalnica (526), Gumance (688), Ilirska Bistrica (1043), Snežnik (1300) | 2010–2012 | δ2H = (8.2 ± 0.1) × δ18O + (14.0 ± 1) | 0.98 | 88 | [25] |
| LMWL_Zavižan | Zavižan—Velebit Mt. (1594) | 2001–2003 | δ2H = (7.6 ± 0.4) × δ18O + (10.5 ± 4.0) | 0.95 | 35 | [45] |
| LMWL_Gacka | Ličko Lešće (457), Gospić (656) | 2005–2006 | δ2H = 6.8 × δ18O + 1.5 | [23] | ||
| LMWL_Ljubljana | Ljubljana (299) | 2001–2003 | δ2H = (8.0 ± 0.2) × δ18O + (9.2 ± 1.8) | 0.99 | 36 | [45] |
| LMWL_Ljubljana (Bežigrad)_OLSR | Ljubljana (299) | 1981–2006 | δ2H = (7.95 ± 0.08) × δ18O + (8.9 ± 0.71) | 0.99 | 290 | [46] |
| LMWL_Ljubljana (Bežigrad)_RMA | Ljubljana (299) | 1981–2006 | δ2H = (8.06 ± 0.08) × δ18O + (9.84 ± 0.71) | 0.99 | 290 | [46] |
| LMWL_Ljubljana (Reaktor)_RMA | Ljubljana | 2007–2010 | δ2H = (8.19 ± 0.22) × δ18O + (11.52 ± 1.97) | 0.98 | 46 | [47] |
| LMWL_Ljubljana (Bežigrad)_PWLSR | Ljubljana (299) | 2007–2010 | δ2H = (7.94 ± 0.21) × δ18O + (9.76 ± 1.91) | 0.99 | 46 | [47] |
| LMWL_Zagreb | Zagreb (157) | 2001–2003 | δ2H = (7.3 ± 0.2) × δ18O + (2.8 ± 1.8) | 0.99 | 34 | [45] |
| LMWL_Zagreb_OLSR * | Zagreb (157) | 1980–2018 | δ2H = (7.65 ± 0.06) × δ18O + (4.79 ± 0.55) | 1.0047 | 389 | [41] |
| LMWL_Zagreb_RMA * | Zagreb (157) | 1980–2018 | δ2H = (7.74 ± 0.06) × δ18O + (5.57 ± 0.55) | 1.0019 | 389 | [41] |
| LMWL_Zagreb_PWLSR * | Zagreb (157) | 1980–2018 | δ2H = (7.64 ± 0.06) × δ18O + (5.24 ± 0.54) | 1.00 | 389 | [41] |
| LMWL_Bilogora | Bilogora (202) | 2010–2013 | δ2H = 7.75 × δ 18O + 8.11 | 0.99 | 19 | [93] |
| LMWL_Sikirevci | Sikirevci (85) | 2012–2014 | δ2H = 7.69 × δ18O + 6.29 | 0.99 | 21 | [29] |
* rmSSE: average of the root mean square sum of squared errors [85].
© 2020 by the authors. Licensee MDPI, Basel, Switzerland. This article is an open access article distributed under the terms and conditions of the Creative Commons Attribution (CC BY) license (http://creativecommons.org/licenses/by/4.0/).
Share and Cite
MDPI and ACS Style
Brkić, Ž.; Kuhta, M.; Hunjak, T.; Larva, O. Regional Isotopic Signatures of Groundwater in Croatia. Water 2020, 12, 1983. https://doi.org/10.3390/w12071983
AMA Style
Brkić Ž, Kuhta M, Hunjak T, Larva O. Regional Isotopic Signatures of Groundwater in Croatia. Water. 2020; 12(7):1983. https://doi.org/10.3390/w12071983
Chicago/Turabian StyleBrkić, Željka, Mladen Kuhta, Tamara Hunjak, and Ozren Larva. 2020. "Regional Isotopic Signatures of Groundwater in Croatia" Water 12, no. 7: 1983. https://doi.org/10.3390/w12071983
Note that from the first issue of 2016, this journal uses article numbers instead of page numbers. See further details here.