Article

Urban Drainage System Improvement for Climate Change Adaptation

1
Department of Civil Engineering, Inha University, Incheon 22212, Korea
2
Columbia Water Center, Earth Institute, Columbia University, New York, NY 10027, USA
3
ERS Division, Insurance Business Service Group LIG System Co., Ltd., Seoul 06153, Korea
4
Department of Water Resources Research Division, Korea Institute of Civil Engineering and Building Technology (KICT), Goyang 10223, Korea
*
Author to whom correspondence should be addressed.
Water 2016, 8(7), 268; https://doi.org/10.3390/w8070268
Submission received: 14 March 2016 / Revised: 25 May 2016 / Accepted: 21 June 2016 / Published: 28 June 2016
(This article belongs to the Special Issue Urban Water Challenges)

Abstract

:
Recently, urban areas have experienced frequent, large-scale flooding, a situation that has been aggravated by climate change. This study aims to improve the urban drainage system to facilitate climate change adaptation. A methodology and a series of mitigation strategies are presented to efficiently improve the urban drainage system in light of climate change. In addition, we assess the impact of climate change and predict the scale of potential future flood damage by applying the methodology and mitigation strategies to urban areas. Based on the methodology presented, urban flood prevention measures for Gyeyang-gu (Province), Incheon, Korea, was established. The validity of the proposed alternatives is verified by assessing the economic feasibility of the projects to reduce flood damage. We expect that the methodology presented will aid the decision-making process and assist in the development of reasonable strategies to improve the urban drainage system for adaptation to climate change.

1. Introduction

Climate change does not only involve an increase in average temperature, it also results in changes to natural phenomena such as extreme temperatures, wind, snowfall, rainfall, and an increase in sea level that directly and indirectly affect human life. As these occurrences can cause enormous physical and mental damage to a country and its people, countries must be allowed to prepare for adaptation at the country level. In particular, increases in localized intensive rainfall and extreme rainfall events have resulted in a need for diverse research about climate change and its effects on urban areas.
Many researchers have examined the effects of climate change on urban drainage infrastructure and municipal areas [1,2,3,4,5,6,7]. Grum et al. [8] simulated and analyzed the effects of extreme rainfall on an urban drainage system using the RCM model. Berggren et al. [9] evaluated the overall effects of climate change on urban areas. Olofsson [10] analyzed the characteristics of urban drainage systems in consideration of B2 and A2 scenarios among the SRES scenario families. Willems et al. [11] provided a critical review of the current state-of-the-art methods for assessing the impacts of climate change on precipitation on the urban catchment scale. Arnbjerg-Nielsen et al. [12] demonstrated that there are still many limitations in understanding how to describe precipitation in a changing climate in order to design and operate urban drainage infrastructure. Zhou [13] suggested an integrated and trans-disciplinary approach for sustainable drainage design.
Semadeni-Davies et al. [14] evaluated the effects on combined sewer systems in urban areas using the DHI MOUSE model. Berggren et al. [15] investigated the hydraulic performance of urban drainage systems related to changes in rainfall and, through hydraulic parameters such as water levels in nodes (e.g., number of floods and frequency and duration of floods) and pipe flow ratio, described the impact of climate change. Neumann et al. [16] demonstrated a potential approach for estimating climate change adaptation costs for urban drainage systems across the US. Semadeni-Davies et al. [17] stated that there was lack of both tools and guidelines in the technical literature in order to assess climate change impacts on hydrology. Furthermore, for urban areas, attention has generally focused on flood risk or water supply, rather than storm water drainage.
Existing urban drainage systems are designed to cope with weather conditions in specific areas. The ages of systems vary and, in some places, can be quite old (e.g., in many old city centers). This means that existing urban drainage systems were designed for past climate conditions and might not be suitable for current circumstances or able to accommodate future changes [18].
Although the effects of climate change at the local level are poorly understood and appear to be gradual, their potential cumulative impact over the service life of drainage infrastructure warrants a change in the basic philosophy of hydrotechnical designs [19]. In practice, engineers have no choice but to consider climate change in order to adapt and serve the public interest [20].
While the necessity of improving the urban drainage system to accommodate climate change has been recognized, few studies have put forward an approach for conducting such research. This is probably due to the complexities involved in incorporating climate change in urban flood analysis in order to evaluate alternative flood control projects. Furthermore, as the field of research on climate change and urban flooding is clearly distinctive from the practice of evaluating flood control alternatives, most research has focused on the analysis of flood variation due to climate change. However, to efficiently improve the urban drainage system, these two fields should be united to account for climate change.
We aim to present an efficient methodology for evaluating urban flood reduction measures with consideration of climate change. To accomplish this, the effects of climate change—mainly on the urban drainage system—are reviewed. In addition, procedures and methodology to evaluate adaptation measures are presented. We apply this methodology to urban areas to estimate the scale of flood damage due to climate change, analyze the economic feasibility, and assess the validity of alternative flood control strategies.
This paper consists of two parts: (1) methodologies of urban drainage system improvement for climate change adaptation; and (2) application with a case study. In Section 2, the procedure for improving design criteria in the urban area considering climate change is introduced. In Section 3, components for future flood damage analysis under a climate change scenario are presented. In Section 4, the procedure and methodology are applied to an urban area, and results are derived. Here, we present results from a single greenhouse gas scenario from only one model, HadGEM3-RA RCM. This study aimed to propose the approach focusing on design of a practical procedure for climate change adaptation rather than improving projection results. However, an ensemble of climate models and greenhouse gas scenarios should be used so that the uncertainty of climate change can be incorporated into the model. In Section 5, the conclusions of this research are presented.

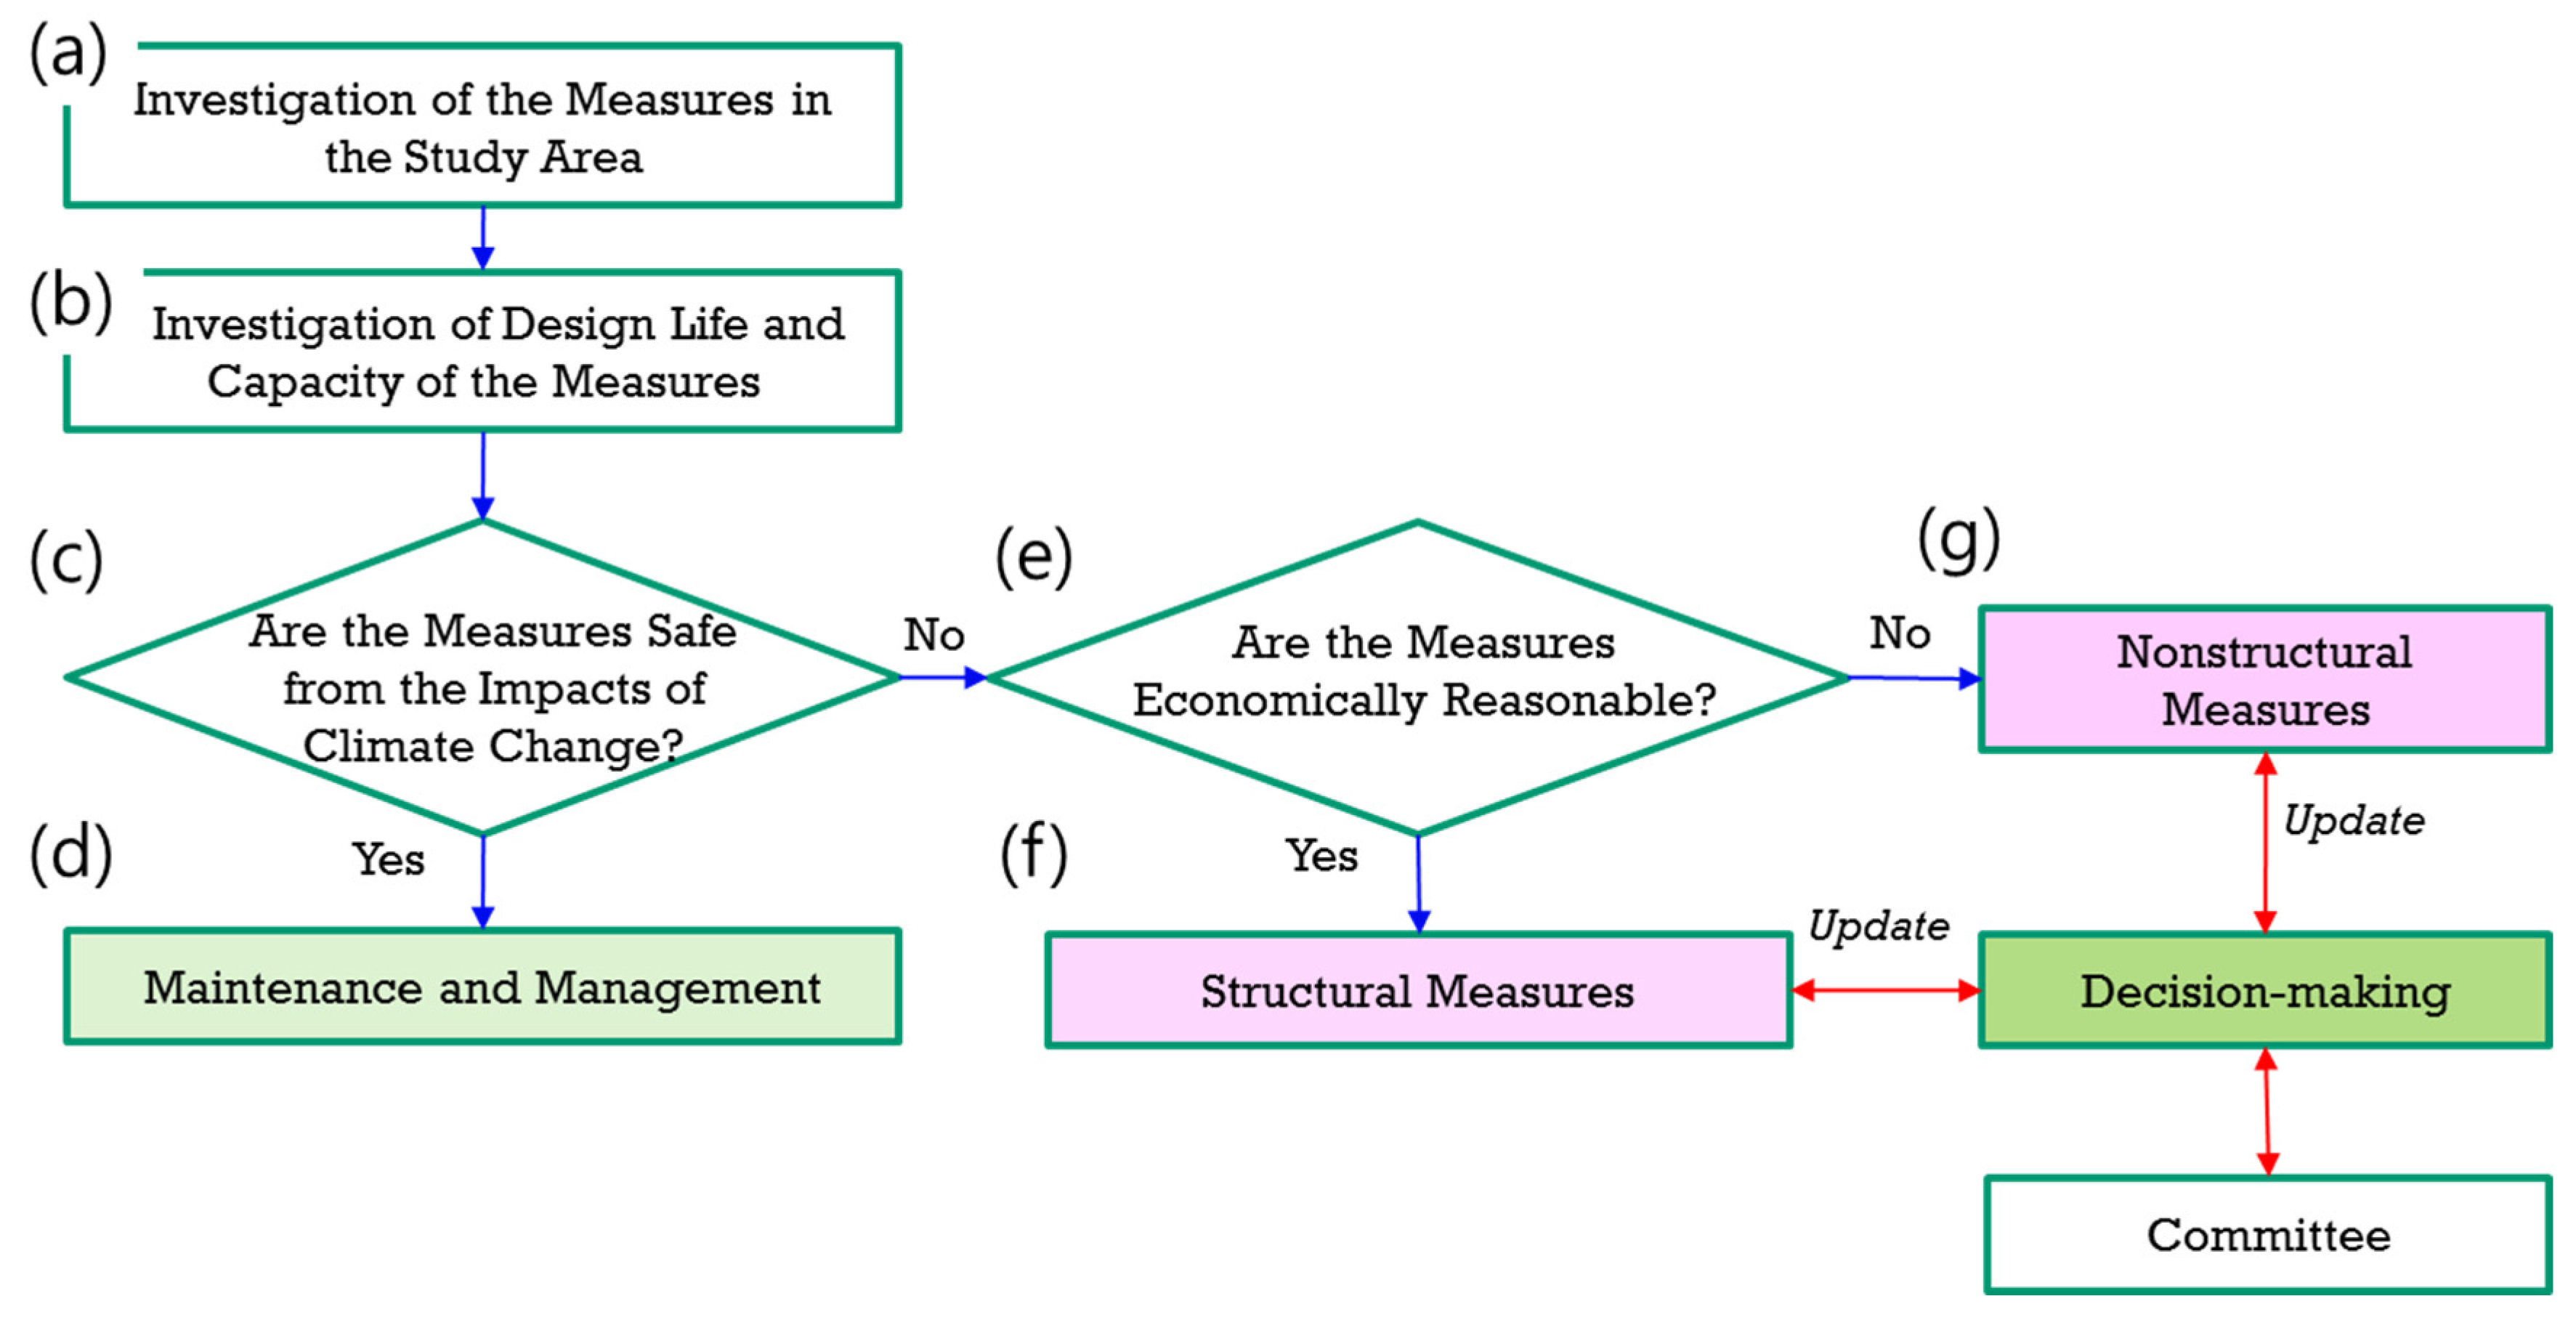
2. The Procedure for Improvement of Design Criteria in Urban Drainage Systems Considering Climate Change

Many researchers predict that design intensities will increase due to climate change. Arnbjerg-Nielsen [12] suggested approaches to quantify the impact of climate changes on extreme rainfall and projected that design intensities in Denmark are likely to increase by 10%–50% within the next 100 years. Ekström et al. [21] suggested that the HadRM3H model can be used with some confidence to estimate extreme rainfall distributions and predicted that, for longer duration events (5–10 days), event magnitudes will show large increases in Scotland (up to +30%) using rational frequency analysis and individual grid box analysis. In the rest of the UK, small increases in the magnitude of more frequent events are expected (up to +10%). This means that improve in design criteria is needed in accordance with the change in design intensities. If we consider the impact of climate change, the revised design criteria will stipulate greater capacity than current standards.
Existing rainfall intensities do not reflect this issue [18]. New design criteria that account for rainfall intensities considering climate change are necessary to prevent drainage system overload [22,23].
With regard to drainage systems, the effectiveness of potential adaptation measures varies due to the magnitude of flooding and regional features. Therefore, system improvement should be preceded by an evaluation of drainage system capacity. Mitigation measures should be identified within a range where the effects of climate change on the drainage system can be evaluated and accommodated, and an economic analysis is necessary for efficient determination. Our recommended approach to accommodate climate change and reduce urban flooding is shown in Figure 1. The procedure is used for the improvement of urban drainage systems.
  • First, investigate a target area to evaluate the disaster-prevention facilities;
  • Study the service life and capabilities of each facility;
  • Assess the change (%) in input based on the design criteria for the facility. Next, determine whether the current disaster-prevention facility is safe from the impact of climate change;
  • If the facility is safe, continue to conduct routine maintenance;
  • If the facility is not safe, attempt to increase safety by improving the drainage system or the operation such as LID (Low-Impact Development), SUDS (Sustainable Drainage Systems), WSUD (Water-Sensitive Urban Design), GSI (Green Stormwater Infrastructure) etc., without reinforcing the disaster-prevention criteria. If this is not effective, reinforce the disaster-prevention criteria;
  • Lastly, prepare for structural enhancements if reinforcement of the disaster prevention criteria is financially valid. The structural measures should reinforce the prevention criteria based on the evaluation of climate change effects and should improve the facility’s performance;
  • However, if structural improvements are not financially valid, prepare for nonstructural measures such as evacuation and restriction.

3. Components for Future Flood Damage Analysis under Climate Change

This study follows Figure 1 for future flood damage analysis. To do this, we choose a climate change scenario of RCP 8.5 shown in Table 1 and do quantile mapping for bias correction of the scenario data. Here, the scenario data which is rainfall, has daily time scale but we may need hourly rainfall data for flood analysis in the urban drainage system. Therefore, the daily rainfall should be disaggregated into hourly data and so the chaotic disaggregation approach is used. Then, the frequency analysis for hourly rainfall data is performed to obtain 2 h in 5-year frequency which is a design rainfall for the branch line of urban drainage systems. We do flood analysis by XP-SWMM model and flood damage analysis by MD-FDA (Multi-Dimensional Flood Damage Analysis) developed in the Ministry of Land, Infrastructure and Transport, Korea (2004). The components for the above mentioned analysis are described in the following sections.

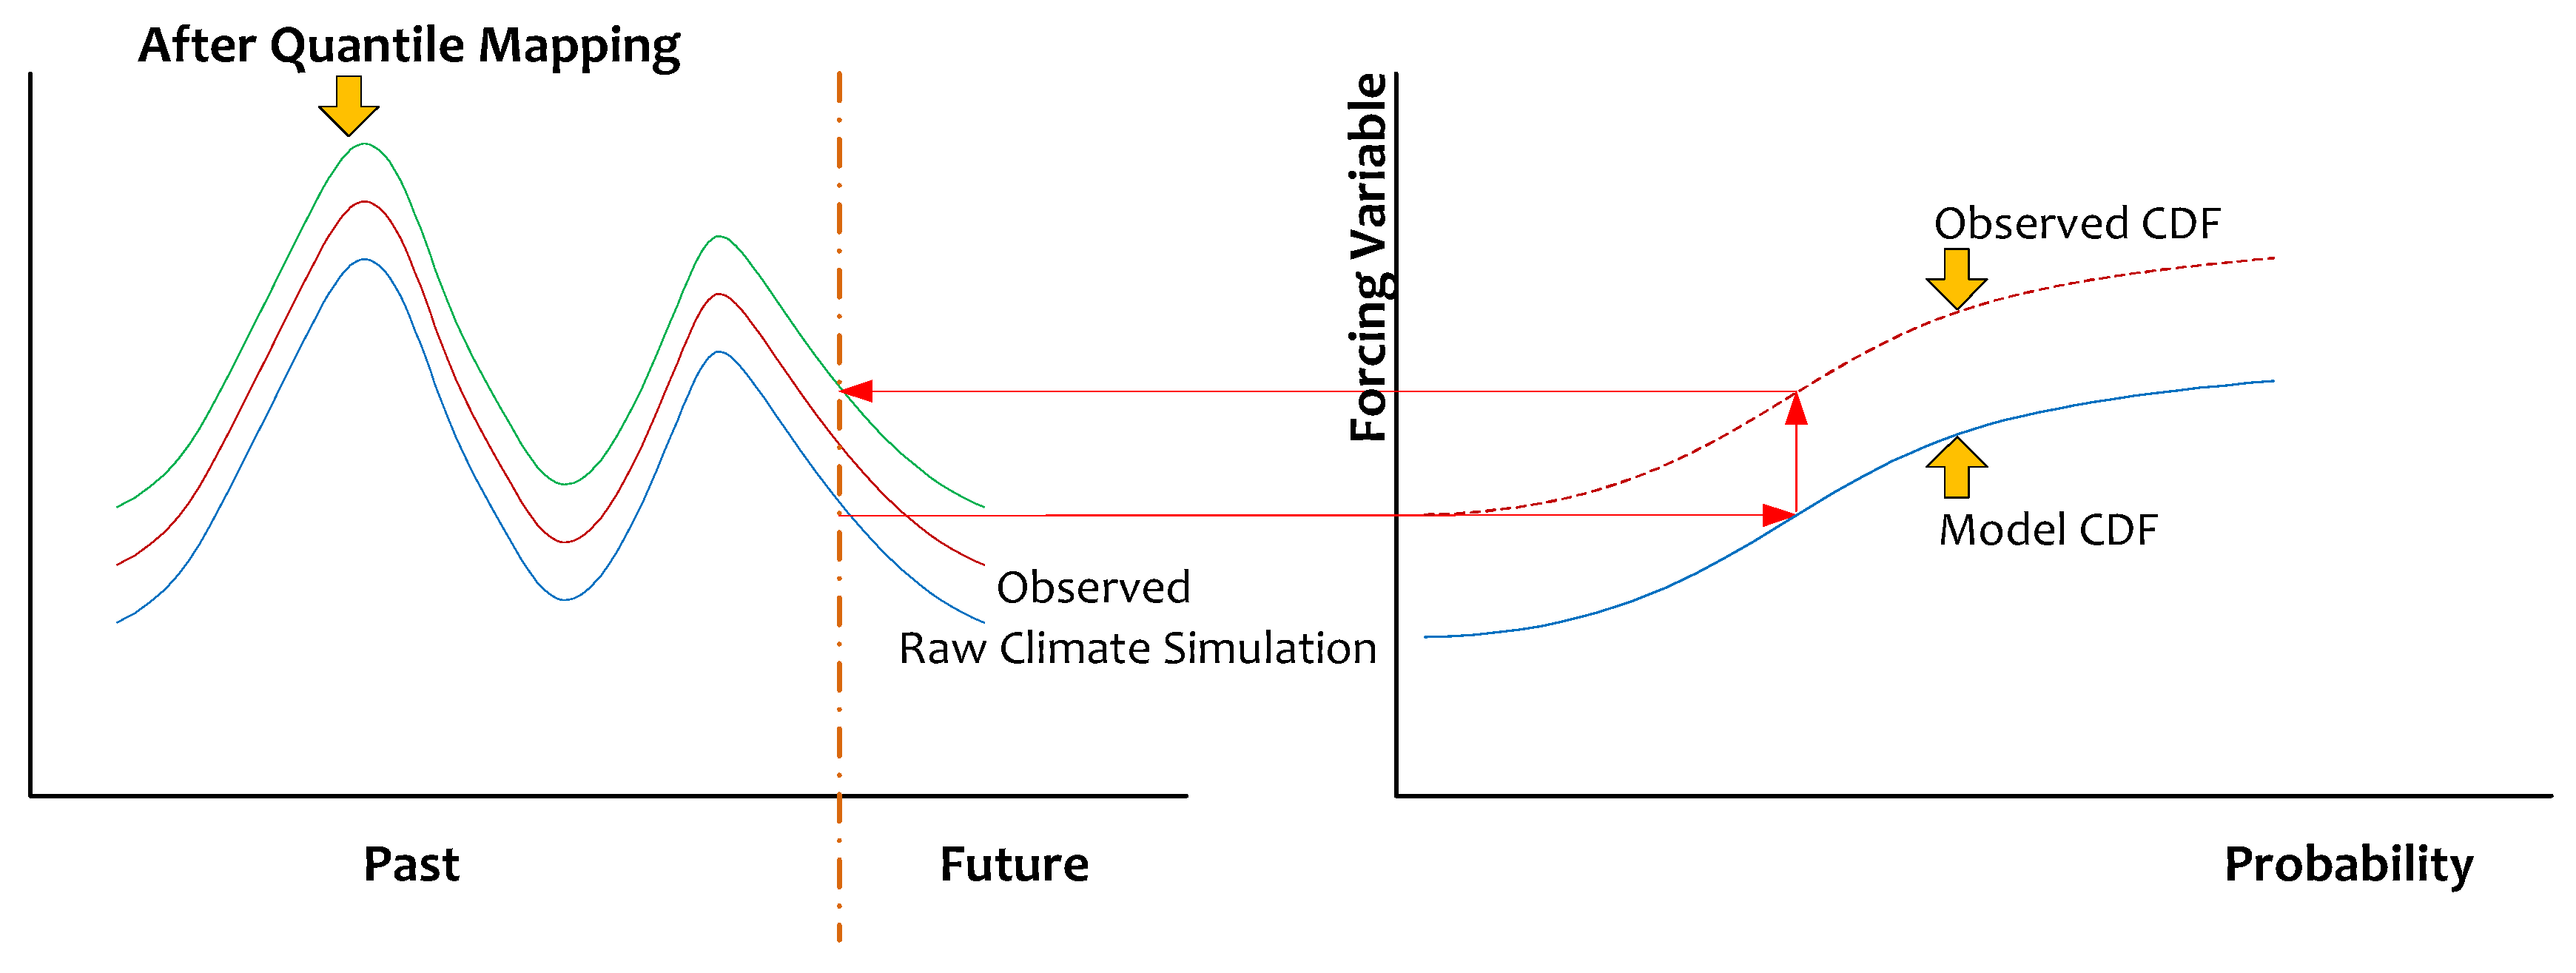
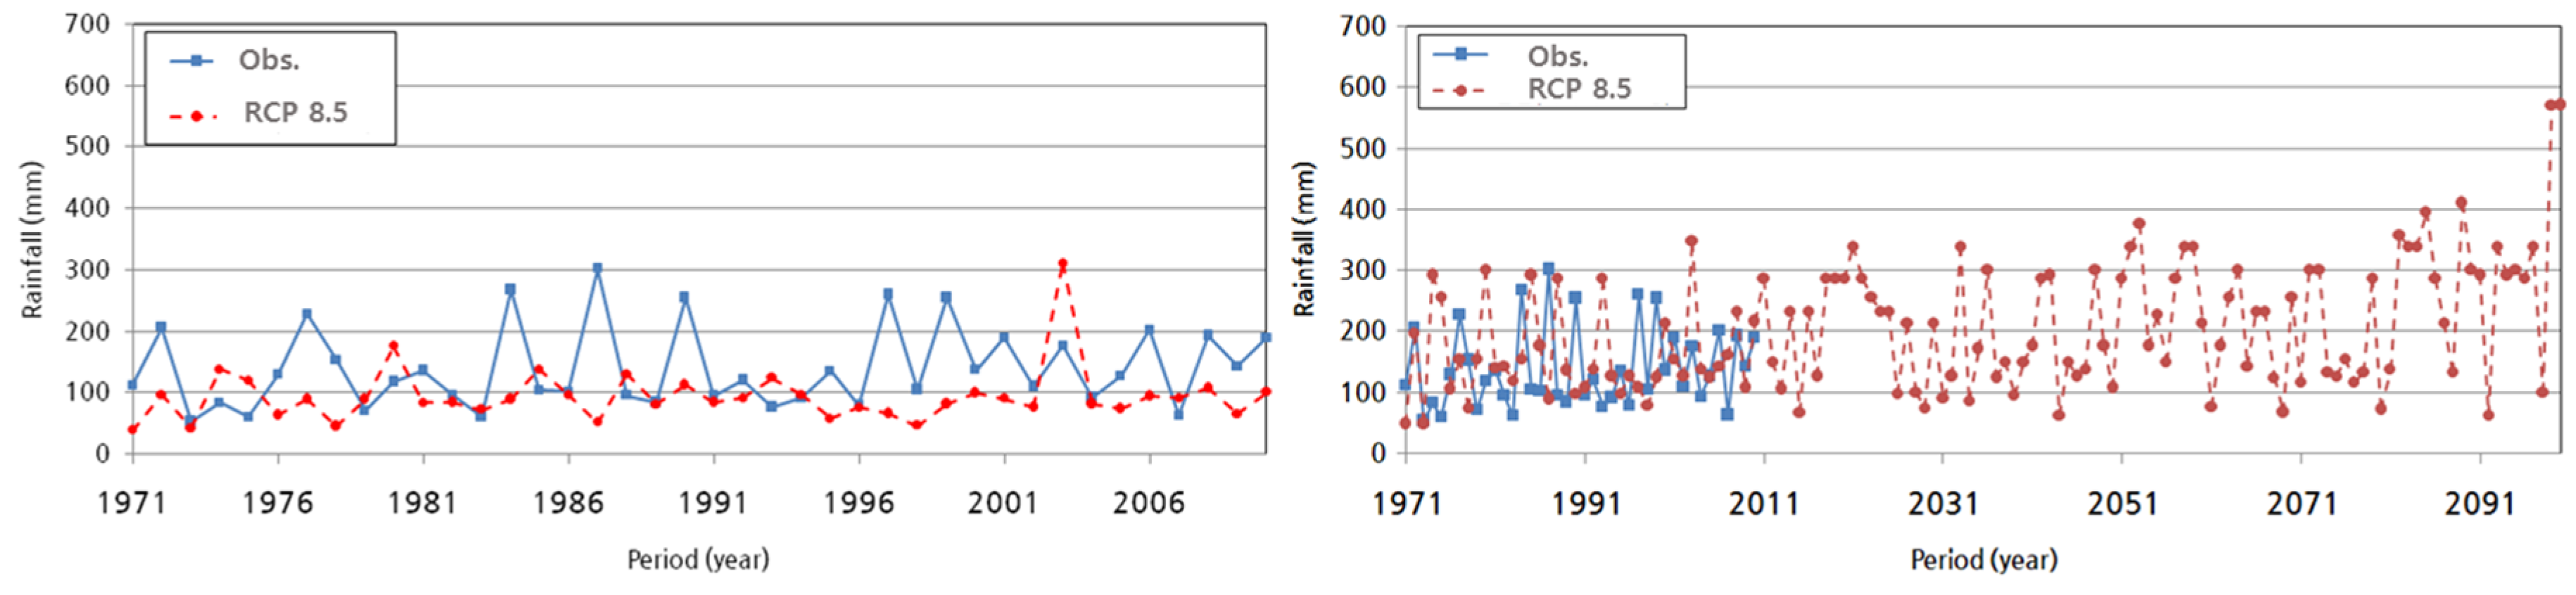
3.1. Climate Change Scenarios and Quantile Mapping

The Representative Concentration Pathways (RCP) suggested by IPCC (Intergovernmental Panel on Climate Change) [24] form a set of greenhouse gas concentration and emission pathways designed to support research on impacts and potential policy responses to climate change [25,26]. As a set, the RCP cover the range of forcing levels associated with emission scenarios published in the literature. The RCP are categorized into four different scenarios based on the degree of carbon dioxide reduction.
The RCP 8.5 corresponds to a high greenhouse gas emissions pathway compared to the scenario literature [27,28]. In addition, it is a so-called “baseline” scenario that does not include any specific climate mitigation target. The greenhouse gas emissions and concentrations in this scenario increase considerably over time, leading to a radiative forcing of 8.5 W/m2 by the end of the century.
In our study, we selected RCP 8.5, in which the largest increases in temperature and rainfall are expected, and adopted the daily scenario presented by the Korea Meteorological Administration (KMA; see Table 1). The Korean government uses a local climate model, HadGEM3-RA, which is based on the HadGEM2-AO model of the Hadley Centre of the British Met Office [29].
The quantile mapping bias correction algorithms suggested by Panofsy and Brire [30] are frequently used to correct systematic distributional biases in precipitation outputs of climate models. The general procedure for quantile mapping is illustrated schematically in Figure 2. It is an empirical statistical technique that matches the quantile of a simulated value to the observed value at the same quantile, as shown in Figure 2.

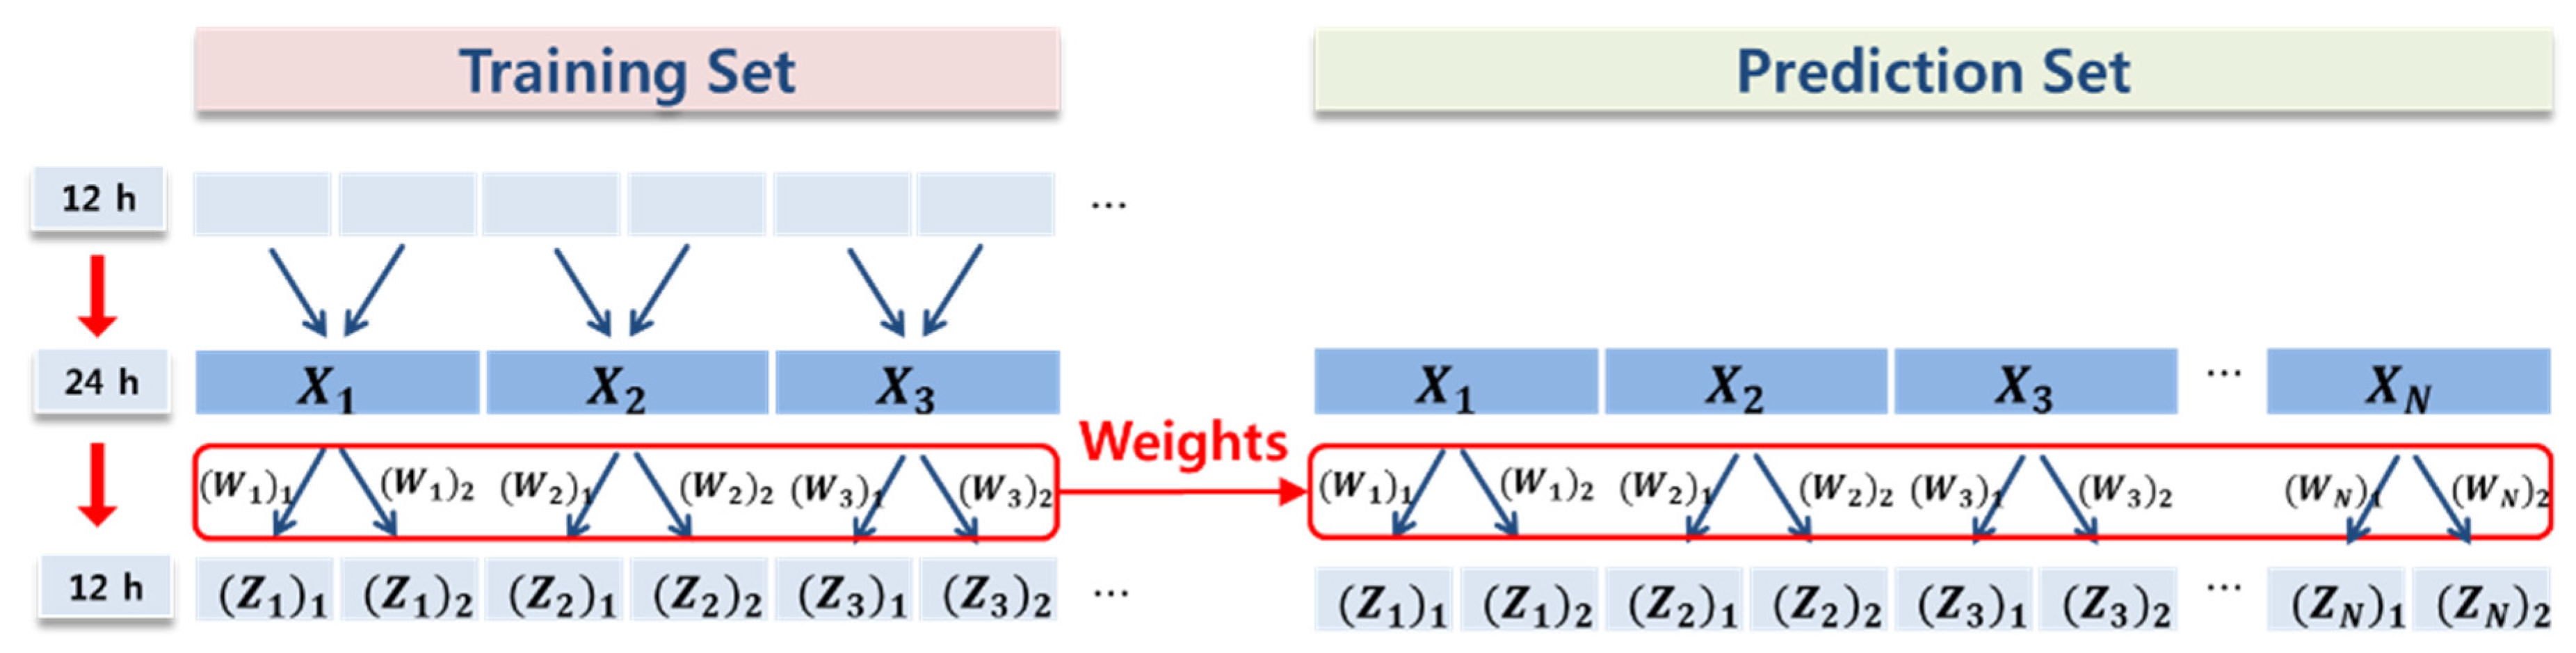
3.2. Approaches for Rainfall Disaggregation and Flood Analysis

The critical problem to evaluate water resources under the climate change is that the climate models have low resolution in time and space. Especially, the time resolution is an important issue for flood analysis and we need downscaling daily rainfall data to hourly rainfall data. KMA provides daily rainfall data produced from HadGEM3-RA climate model. There are several methods for disaggregating daily time scale to hourly [31,32,33]. And we use the chaotic approach (see Sivakumar [34] and Kyoung [35] for details). The chaos disaggregation technique is a method of applying weights calculated from the training set to the prediction set that looks similar to the dynamic behavior of the observed data (training set). Here, we define terms of low-resolution data ( X i ) or weights ( W i ) calculated from the observed data and high-resolution data ( Z i ). Figure 3 shows the concept of the weight using hourly rainfall data. For an example, we have the observed data of 12 h rainfall ( Z i ) and two 12 h rainfall data (12 mm and 18 mm) are aggregated to be 24 h data (30 mm) ( X i ). The weights will be 12/30 and 18/30. These weights can be applied to the future rainfall which has a similar dynamic behavior. Say, the future 24 h rainfall can be disaggregated to 12 h rainfall with weights of 12/30 and 18/30. Therefore, we can obtain the weights from the observations for each time resolution by rainfall data of 3 h, 6 h, 12 h, and 24 h. Low-resolution data of the prediction set ( X i ) is decomposed into high-resolution data ( Z i ) k = ( W i ) k X i by the weight ( W i ) k of the training set. The sum of the weights is one.
k = 1 p ( W i ) k = 1   ( k = 1 ,   2 ,   ,   N   ,   p = T 1 / T 2 )
In this equation, T 1 : Resolution of X i , and T 2 : Resolution of ( Z i ) k .
In this paper, we resolved the rainfall data using the chaos disaggregation technique, which preserves many of the physical properties of the rainfall time series including the no rainfall data.
To analyze the runoff in urban areas, hydraulic and hydrologic analyses of the target area are essential, and existing models can be adopted, if necessary.
Our study utilized XP-SWMM, which is one of the most widely used catchment models designed to simulate urban storm water runoff [36,37,38,39]. The kinematic wave approach [40] was chosen to model the rainfall–runoff process. This method generally provides reliable results for all storm durations, as the method considers the physical processes in surface flow generation [41]. This model is used to understand the frequently complex interactions between rainfall and flooding.

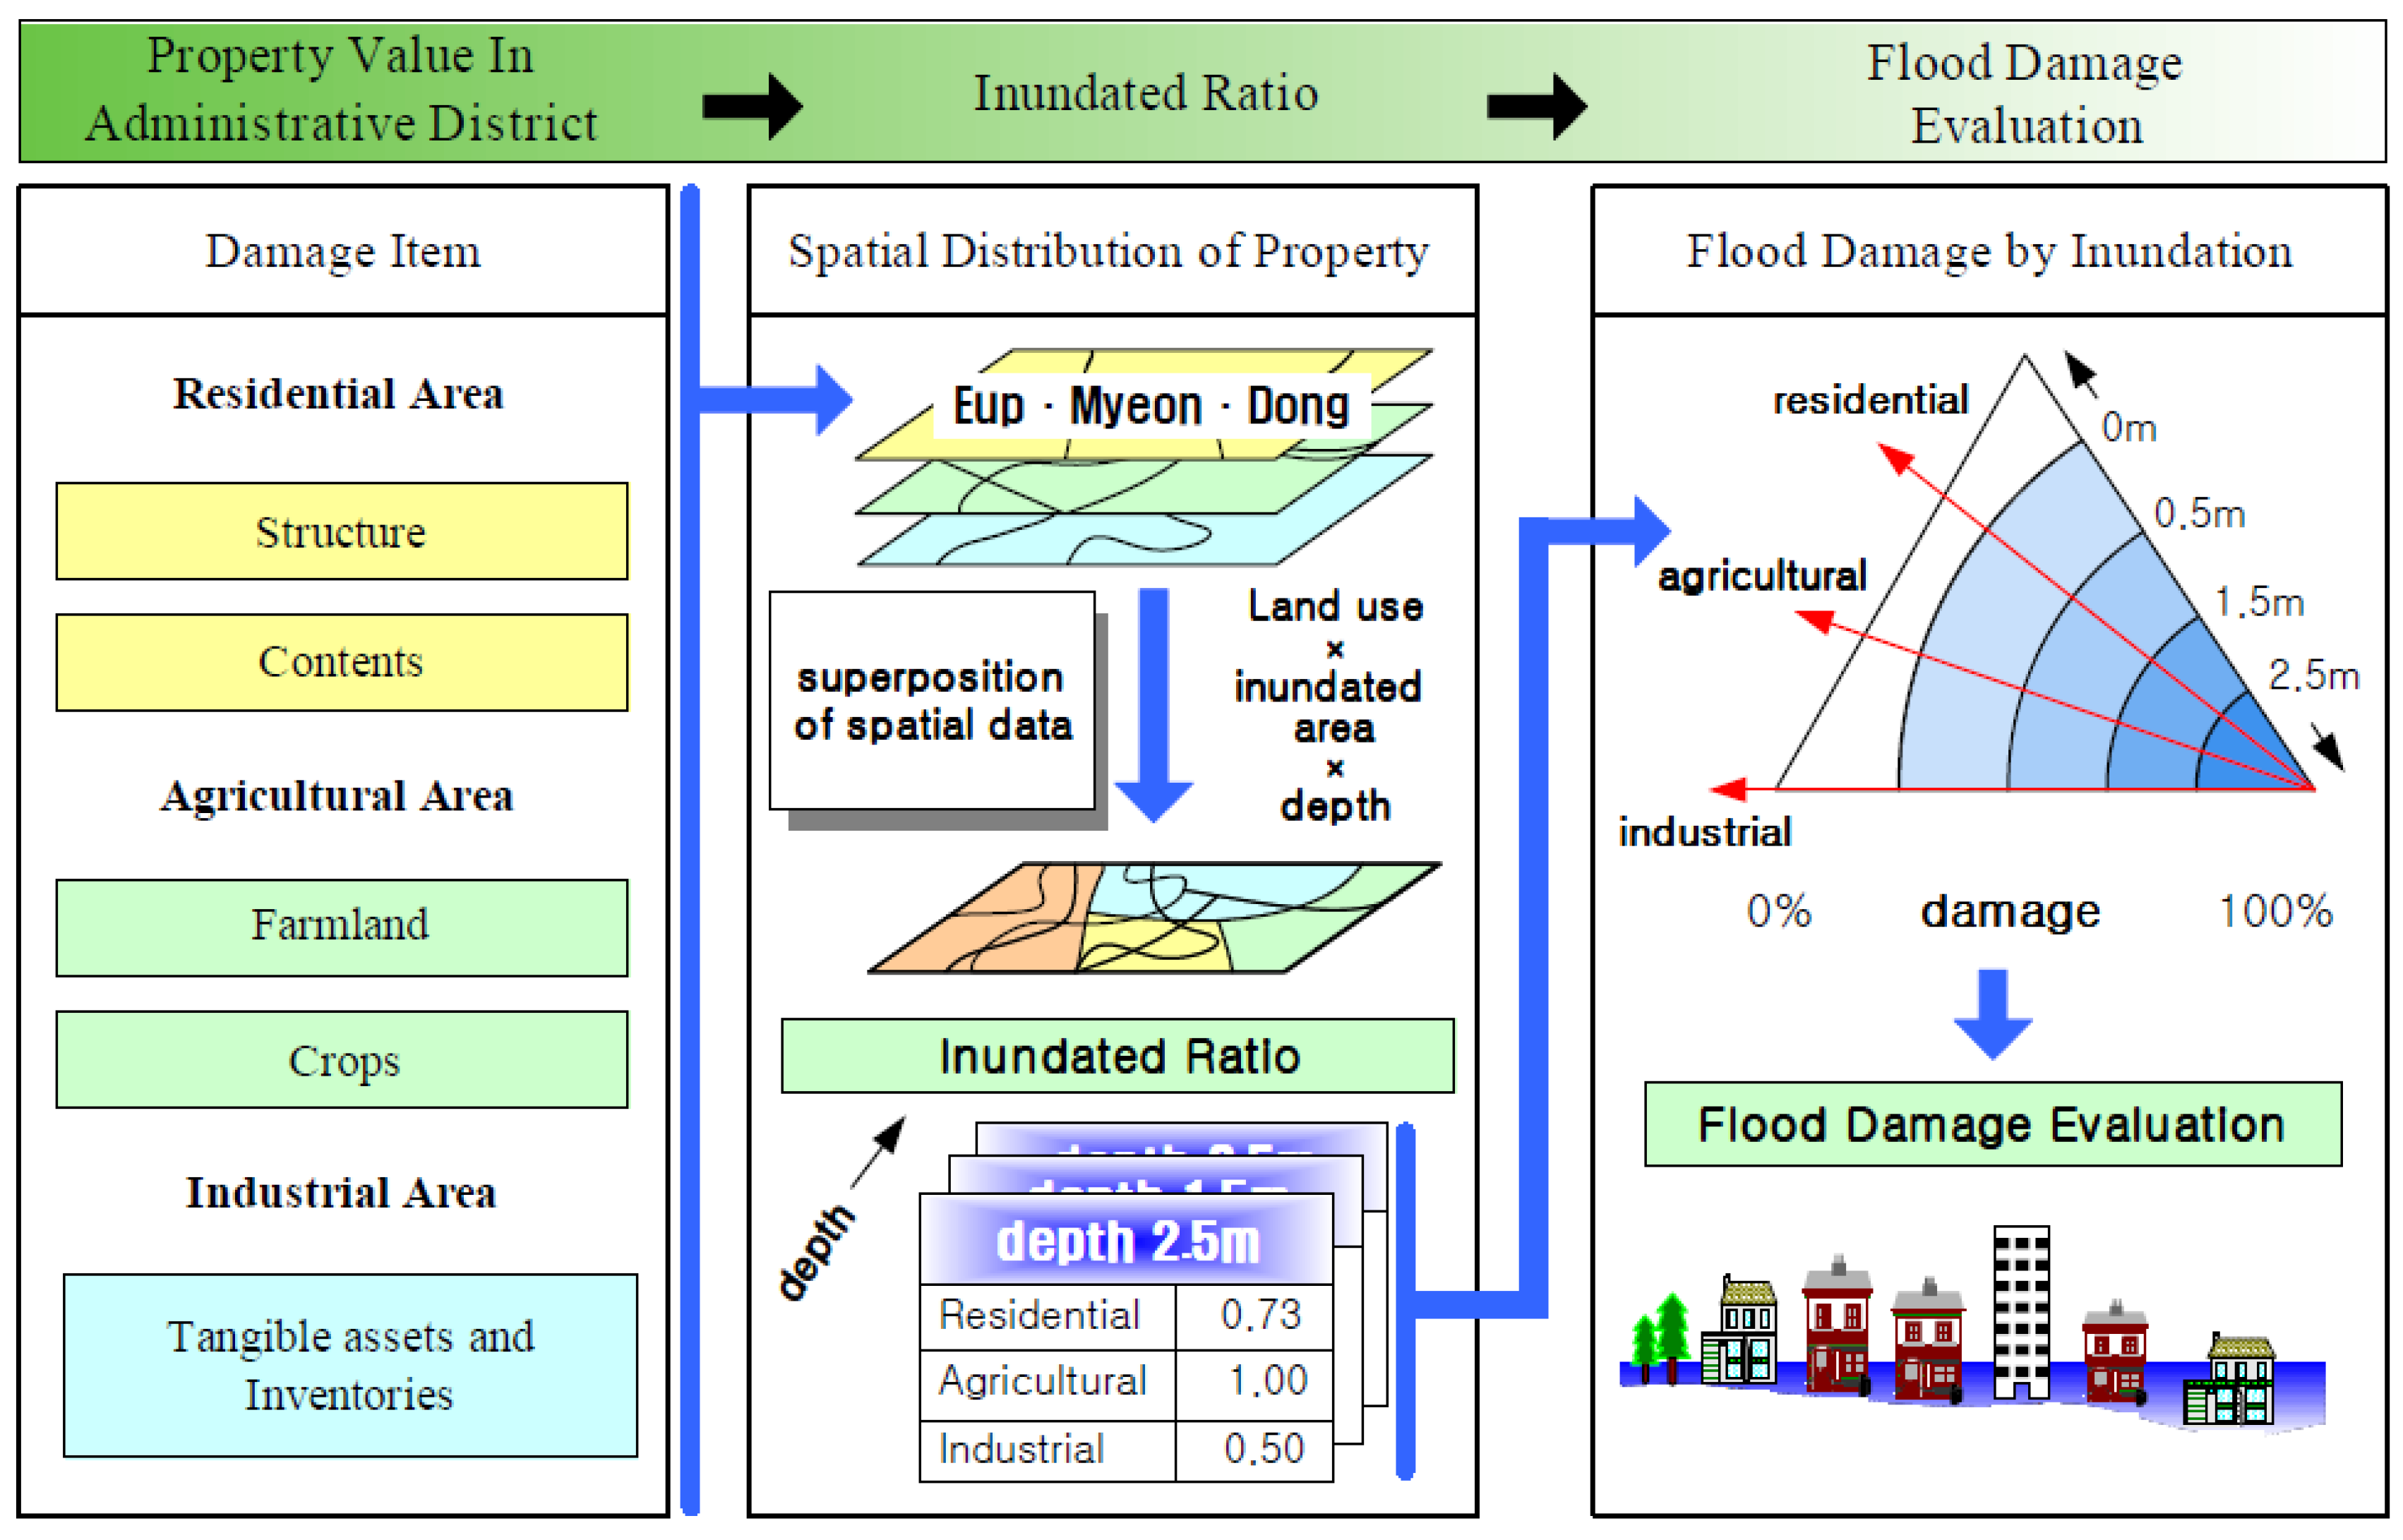
3.3. A Technique for Flood Damage Anaylsis

The multidimensional flood damage analysis (MD-FDA) was suggested to estimate direct damage costs by calculating the damaged assets in flooded areas and multiplying this value by the damage ratio, which fits with inundation depth, as shown in Figure 4 [42]. The procedure for MD-FDA estimation of direct flood damage is as follows:
  • Estimation of property values for an administrative district surrounding the flooded area;
  • Determination of the inundation ratio in light of the spatial property distribution;
  • Determination of the damage ratio in accordance with the inundation depth;
  • Estimation of direct damage by multiplying by the damage ratio.
Based on the range of the flooded area, we used the administrative district units of eup (town), myeon (township), and dong (neighborhood) to estimate the inundated flood damage.
Regional characteristics are classified as residential factors (e.g., structures and contents), agricultural factors (e.g., farmland and crops), and industrial factors (e.g., tangible assets and inventories). Data about each factor can be collected through investigation and publically available statistical data provided by the Korea National Statistical Office (KNSO). The inundation rate is the ratio of damaged property value in a flooded area to the total property value in the related administrative district. When estimating the inundation rate, GIS data are used to classify the regional characteristics and include the Flood Inundation Map, the Administrative District Map, the Land Cover Map, and the Land-use Map. Damage costs for private property are estimated by the following function by adding the values obtained through the method suggested in MD-FDA.
T D =   i = 1 n [ R D i ( · ) + A D i ( · ) + I D i ( · ) ]
T D D = ( 1 + a ) × T D + H D
In these equations, T D is the damage to private property; R D i ( · ) , A D i ( · ) , I D i ( · ) are the functions of residential, agricultural, and industrial damage, respectively;   n is the number of administrative districts (eup–myeon–dong); T D D is total direct damage;   a is the rate of damage to public facilities and private property; and   H D is the number of casualties.
Damage cost functions were expressed by investigating assets in residential, farming and industrial areas and multiplying the damage ratio by the inundation depth. Direct damage cost estimation of public facilities in inundation-expected areas is generally performed using the damage cost ratio of civil facilities to general asset damage costs when it is not possible to estimate the scope and scale.

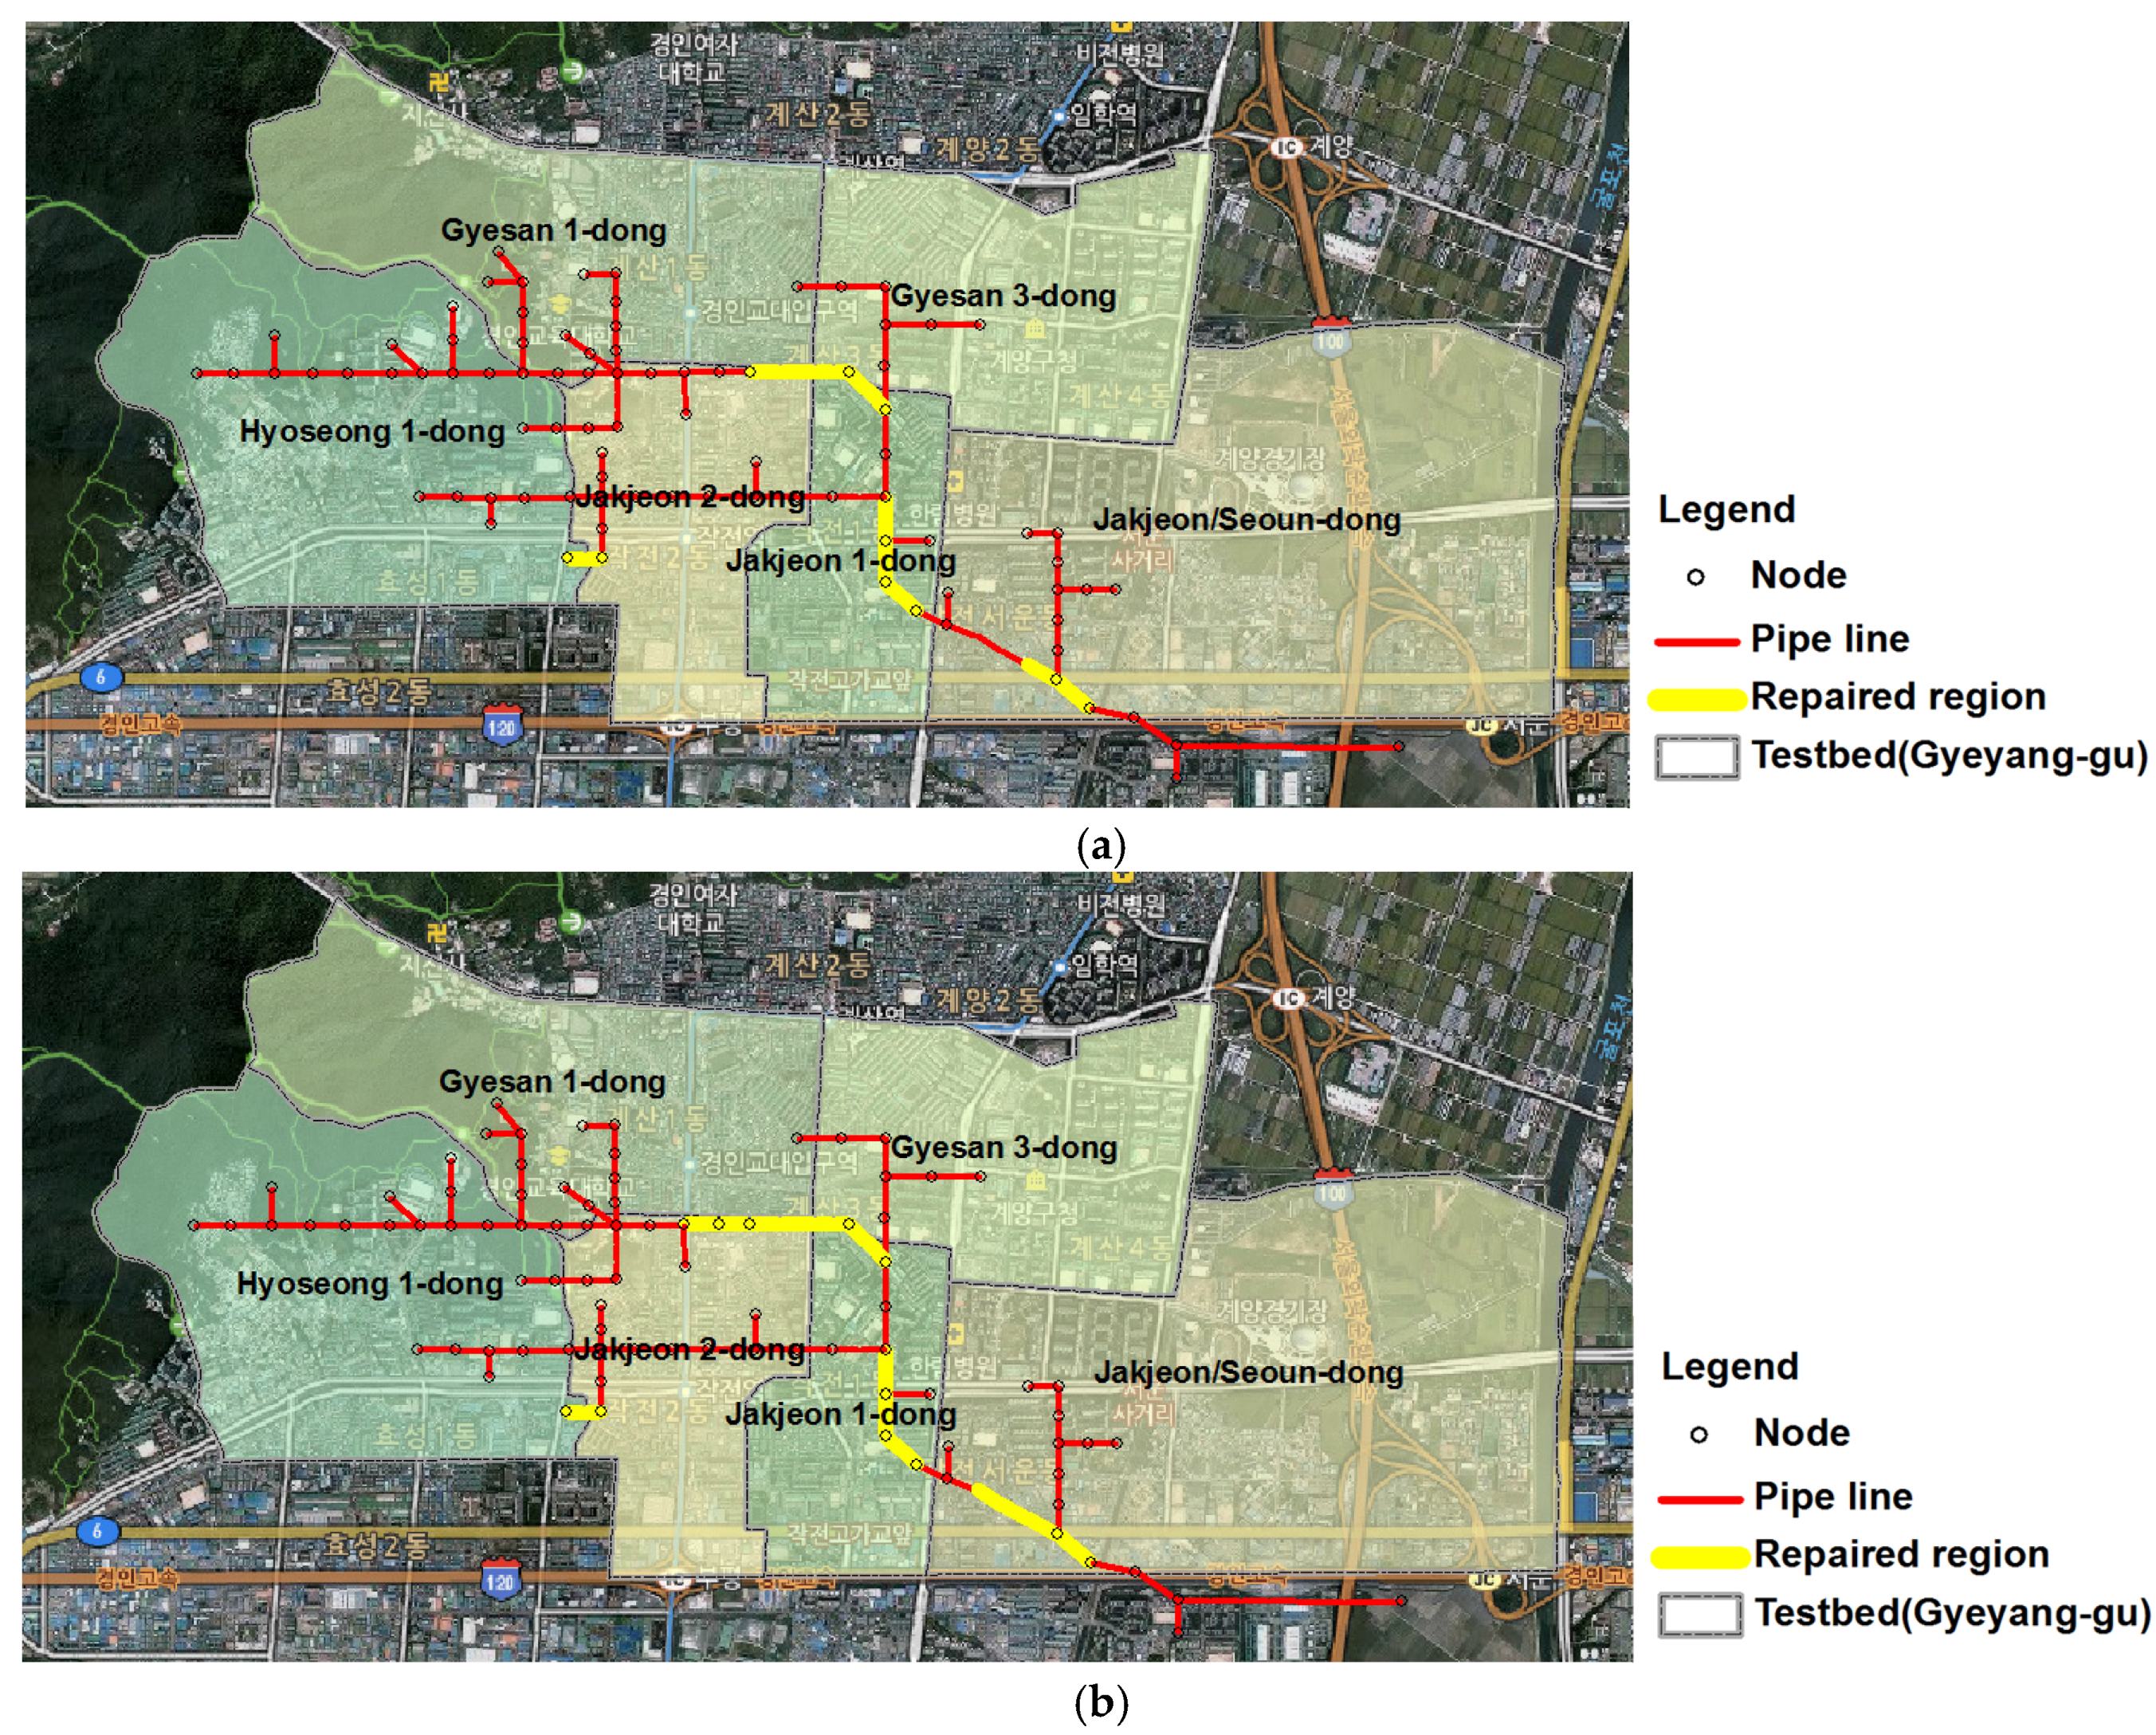
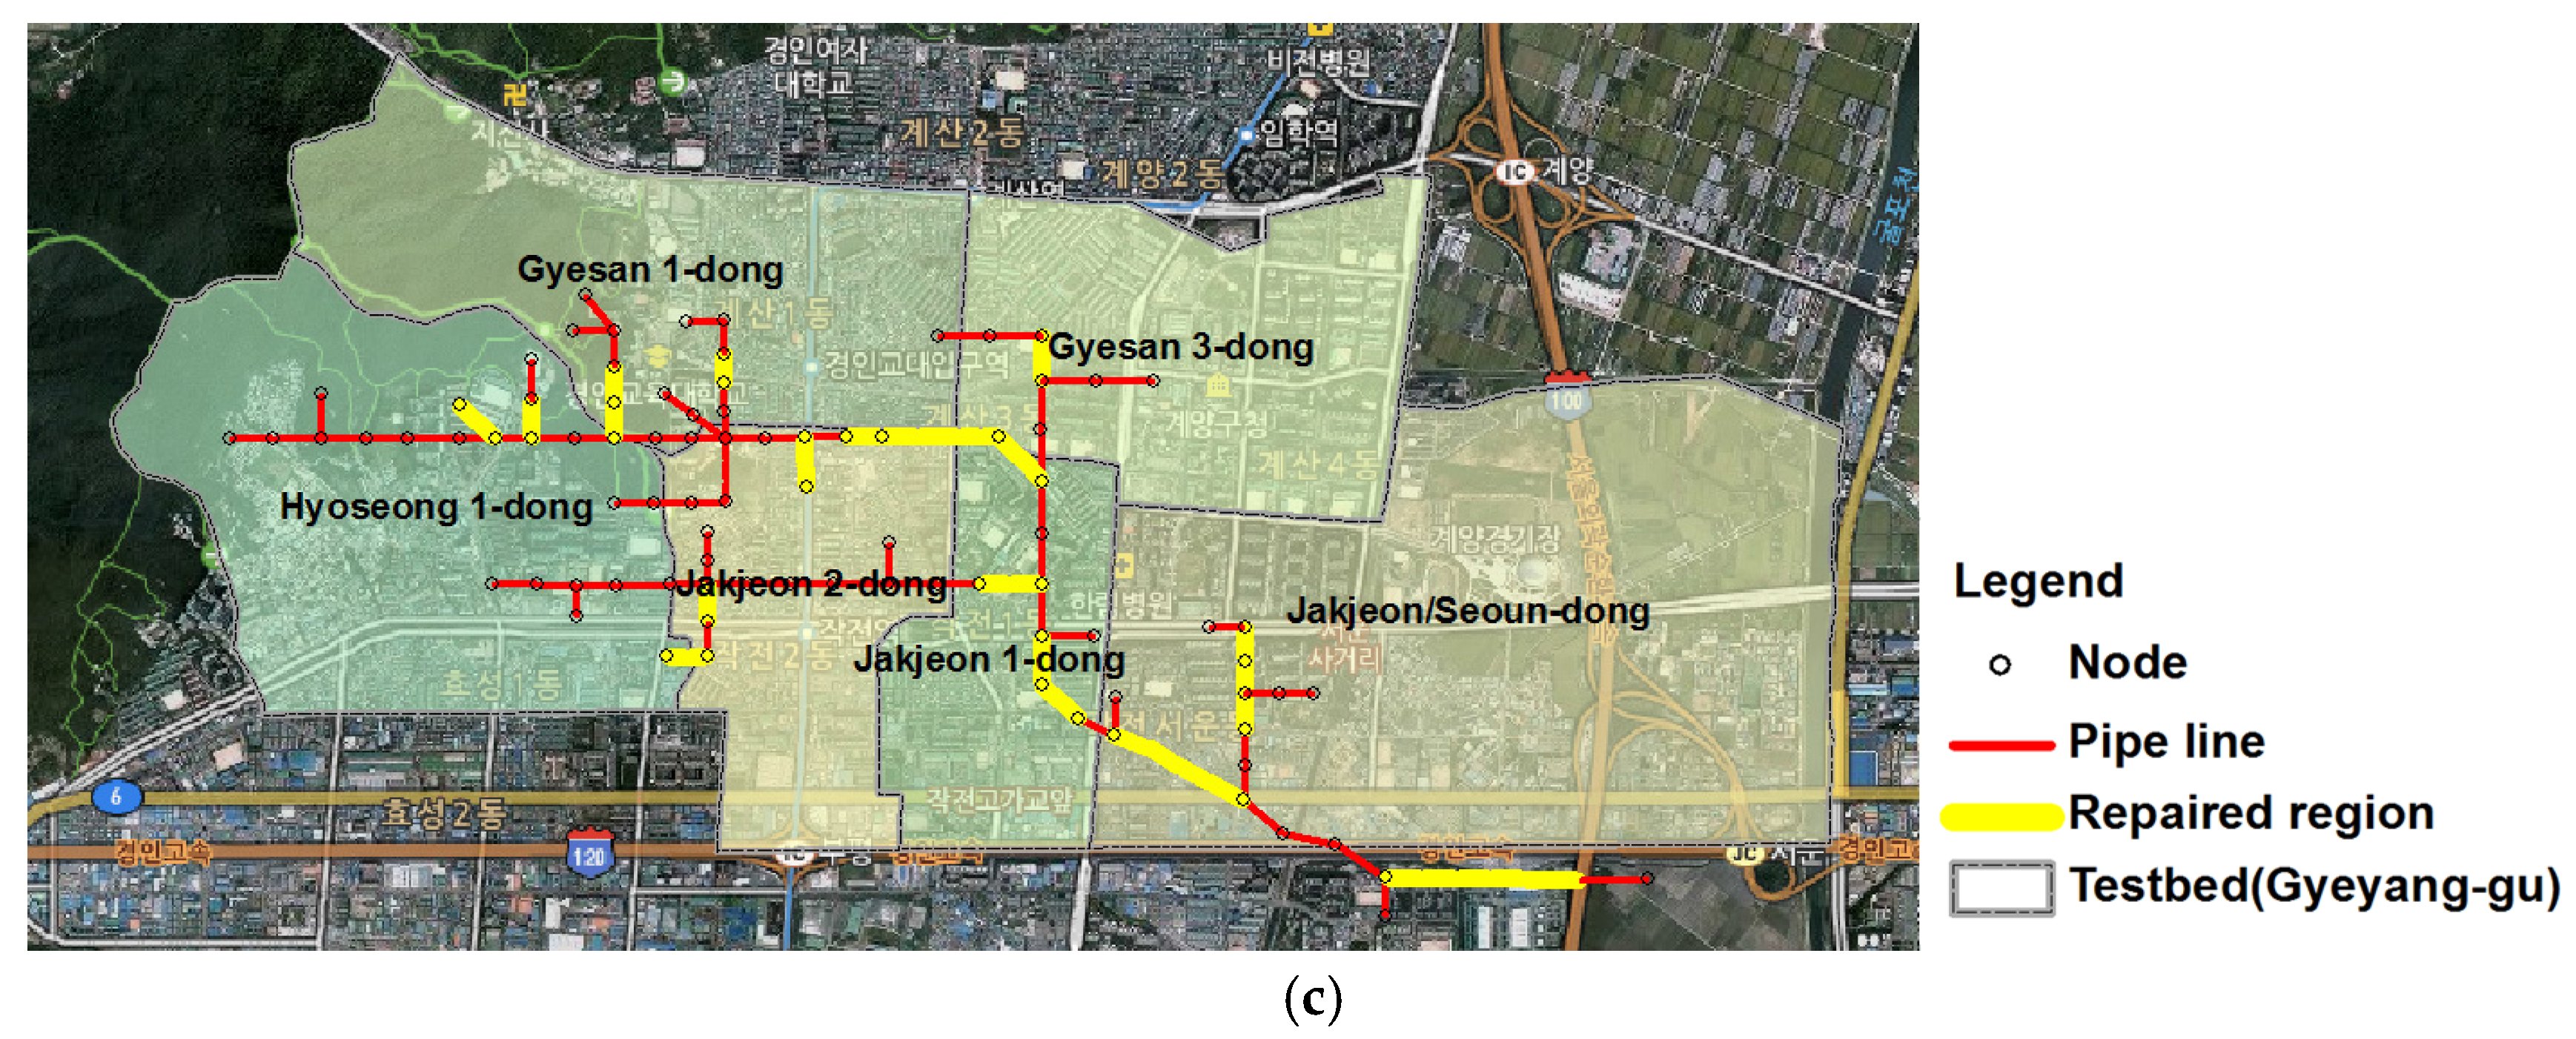
4. A Case Study for Improvement of Urban Drainage Systems in the Future

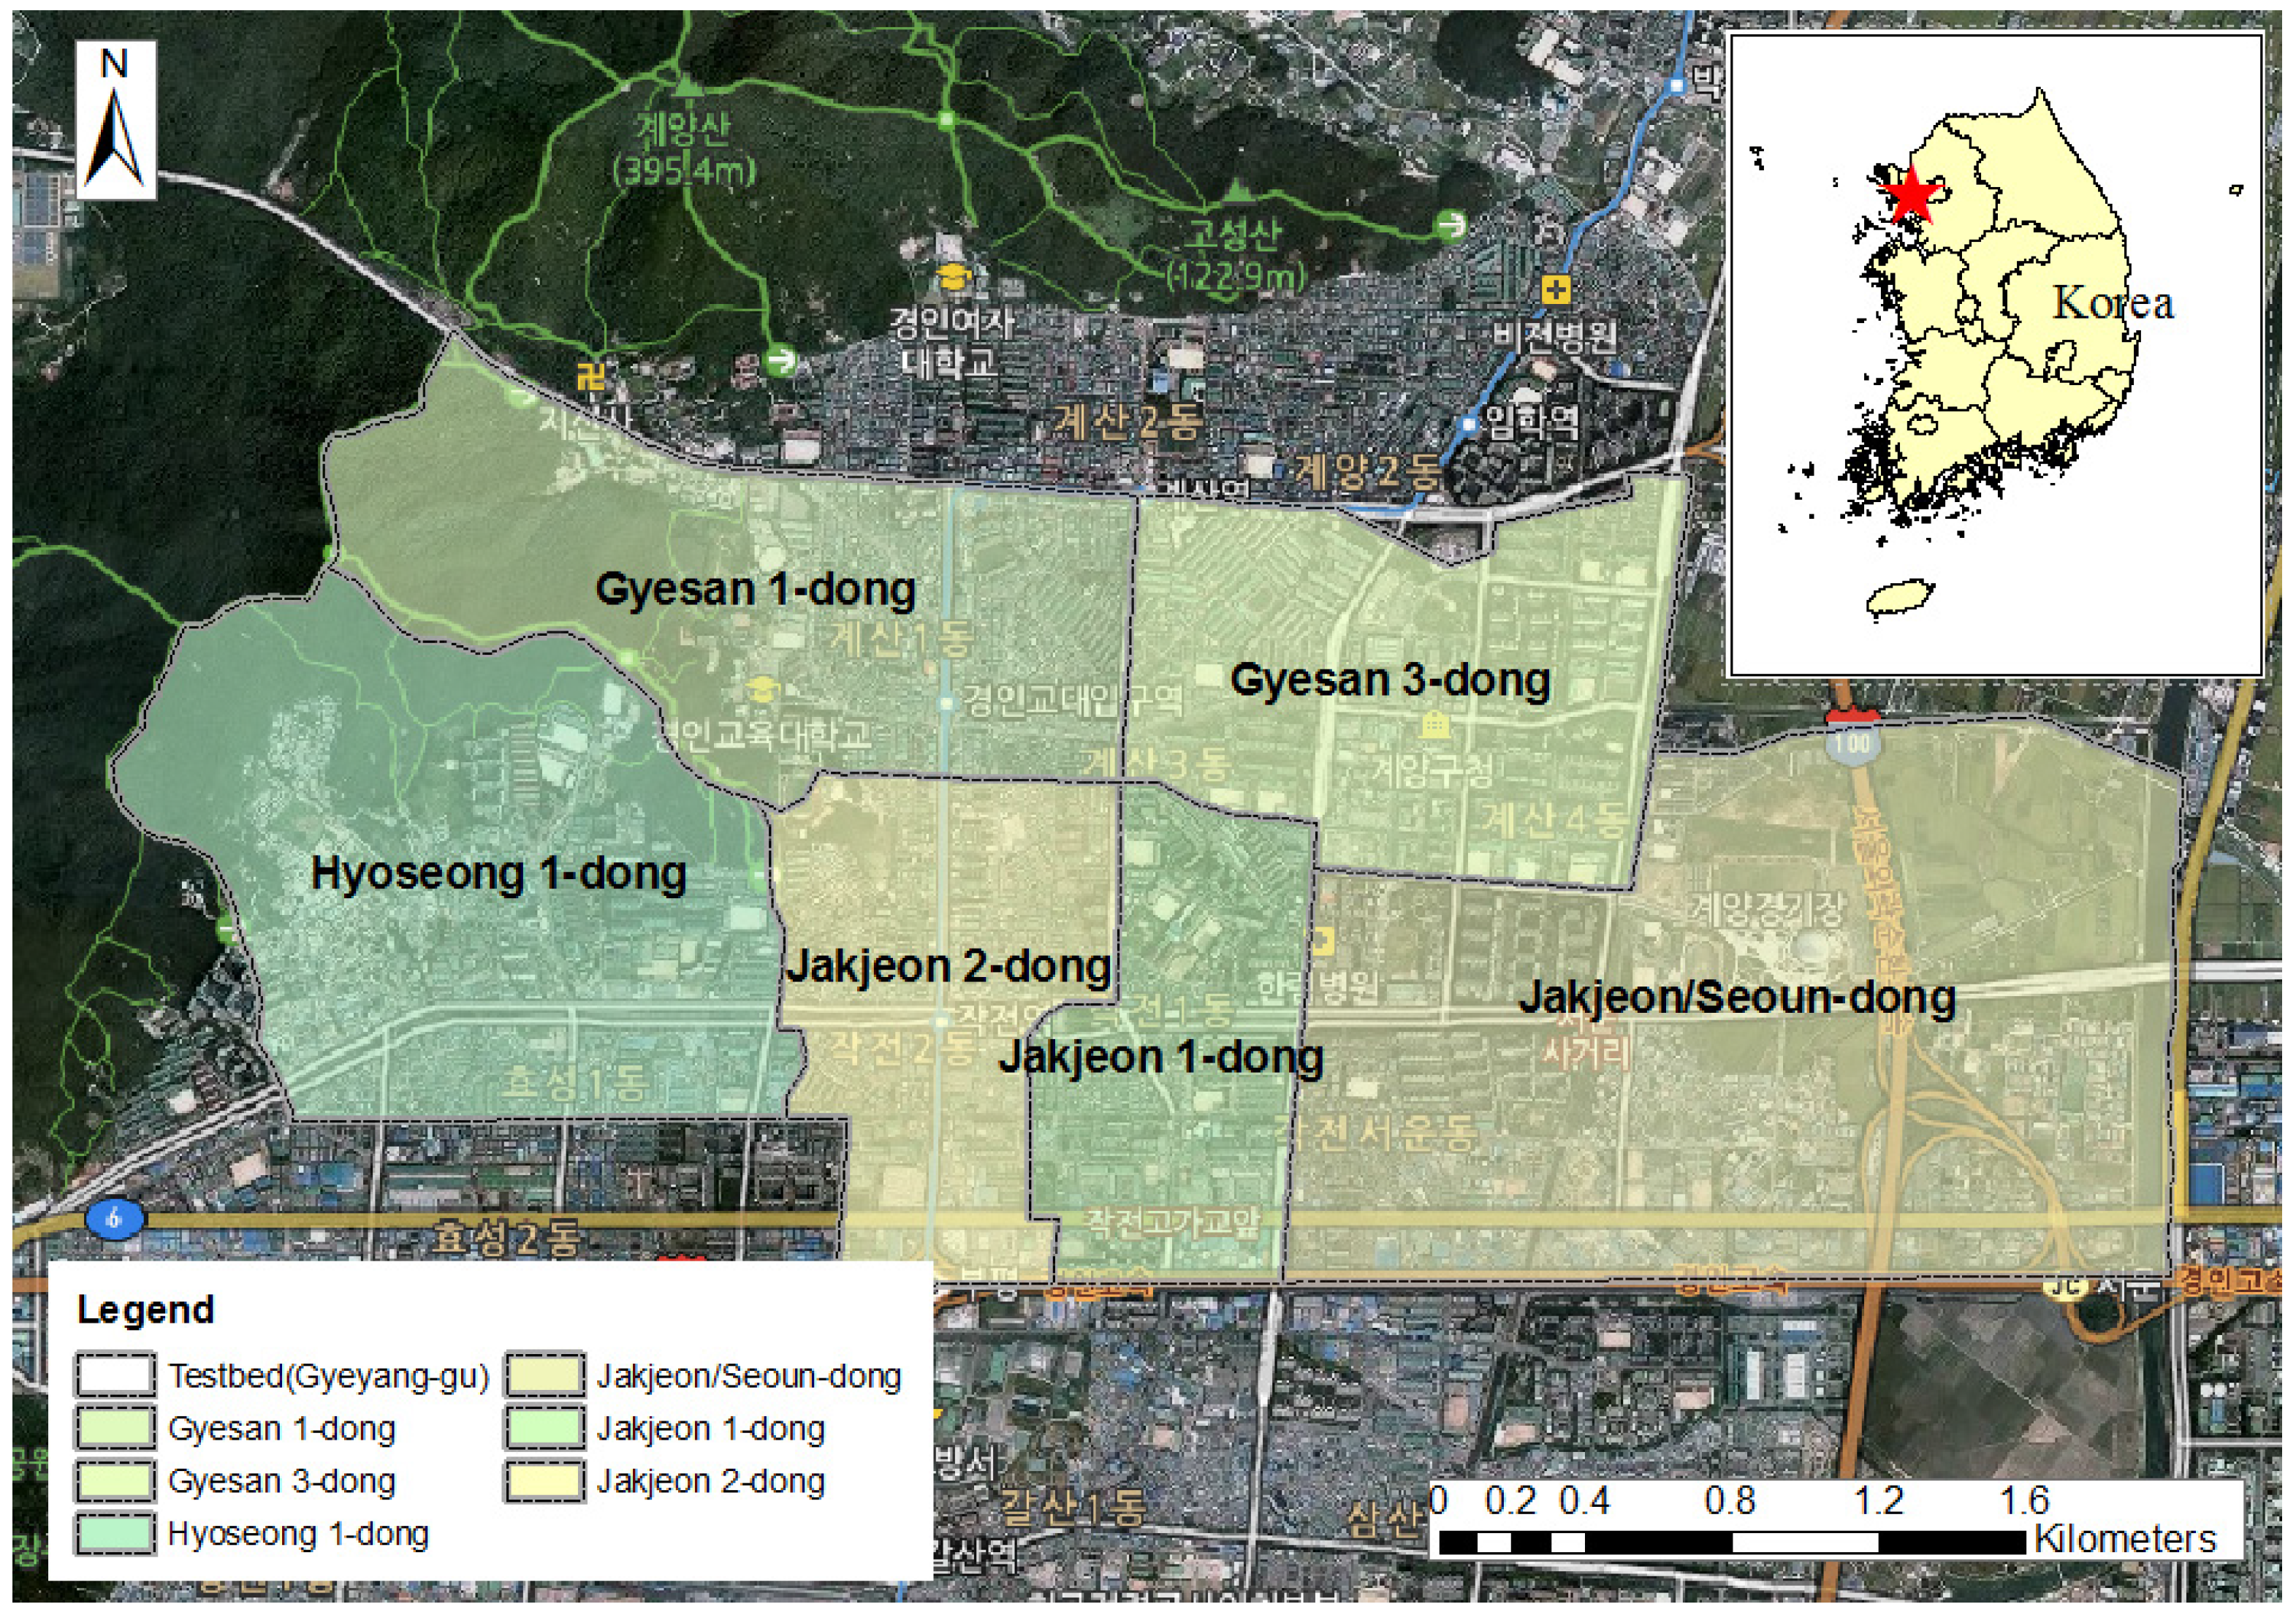
4.1. Study Area and Future Timeframe

Based on the methodology presented in the previous section, urban flood prevention measures for Gyeyang-gu (Province), Incheon, Korea, were established in consideration of climate change. Located in the northeast part of Incheon, Gyeyang-gu (Province) is influenced by both continental and oceanic climates and so experiences numerous meteorological changes over time. Incheon has a flat topography, with 78% of its area having an elevation lower than 50 m, and 57.7% of its area has a slope less than 5°. Gyeyang-gu (area: 9.92 km2) mainly consists of lowlands with a gentle slope and is prone to flooding, as timely rainfall management is not available due to insufficient conveyance capacity of drainage pipes and overloading, etc., in the case of localized intensive rainfall or extreme rainfall (Figure 5).
In this study, four timeframes were specified, and the effects of climate change were simulated for each period. The first scenario was based on past rainfall observation data (between 1971 and 2010) in Incheon. The second scenario considered climate change in a 90-year projection window (2011–2100).
For the simulation involving future rainfall, the time frame was divided into three periods: Future I (2011–2040), Future II (2041–2070), and Future III (2071–2100).
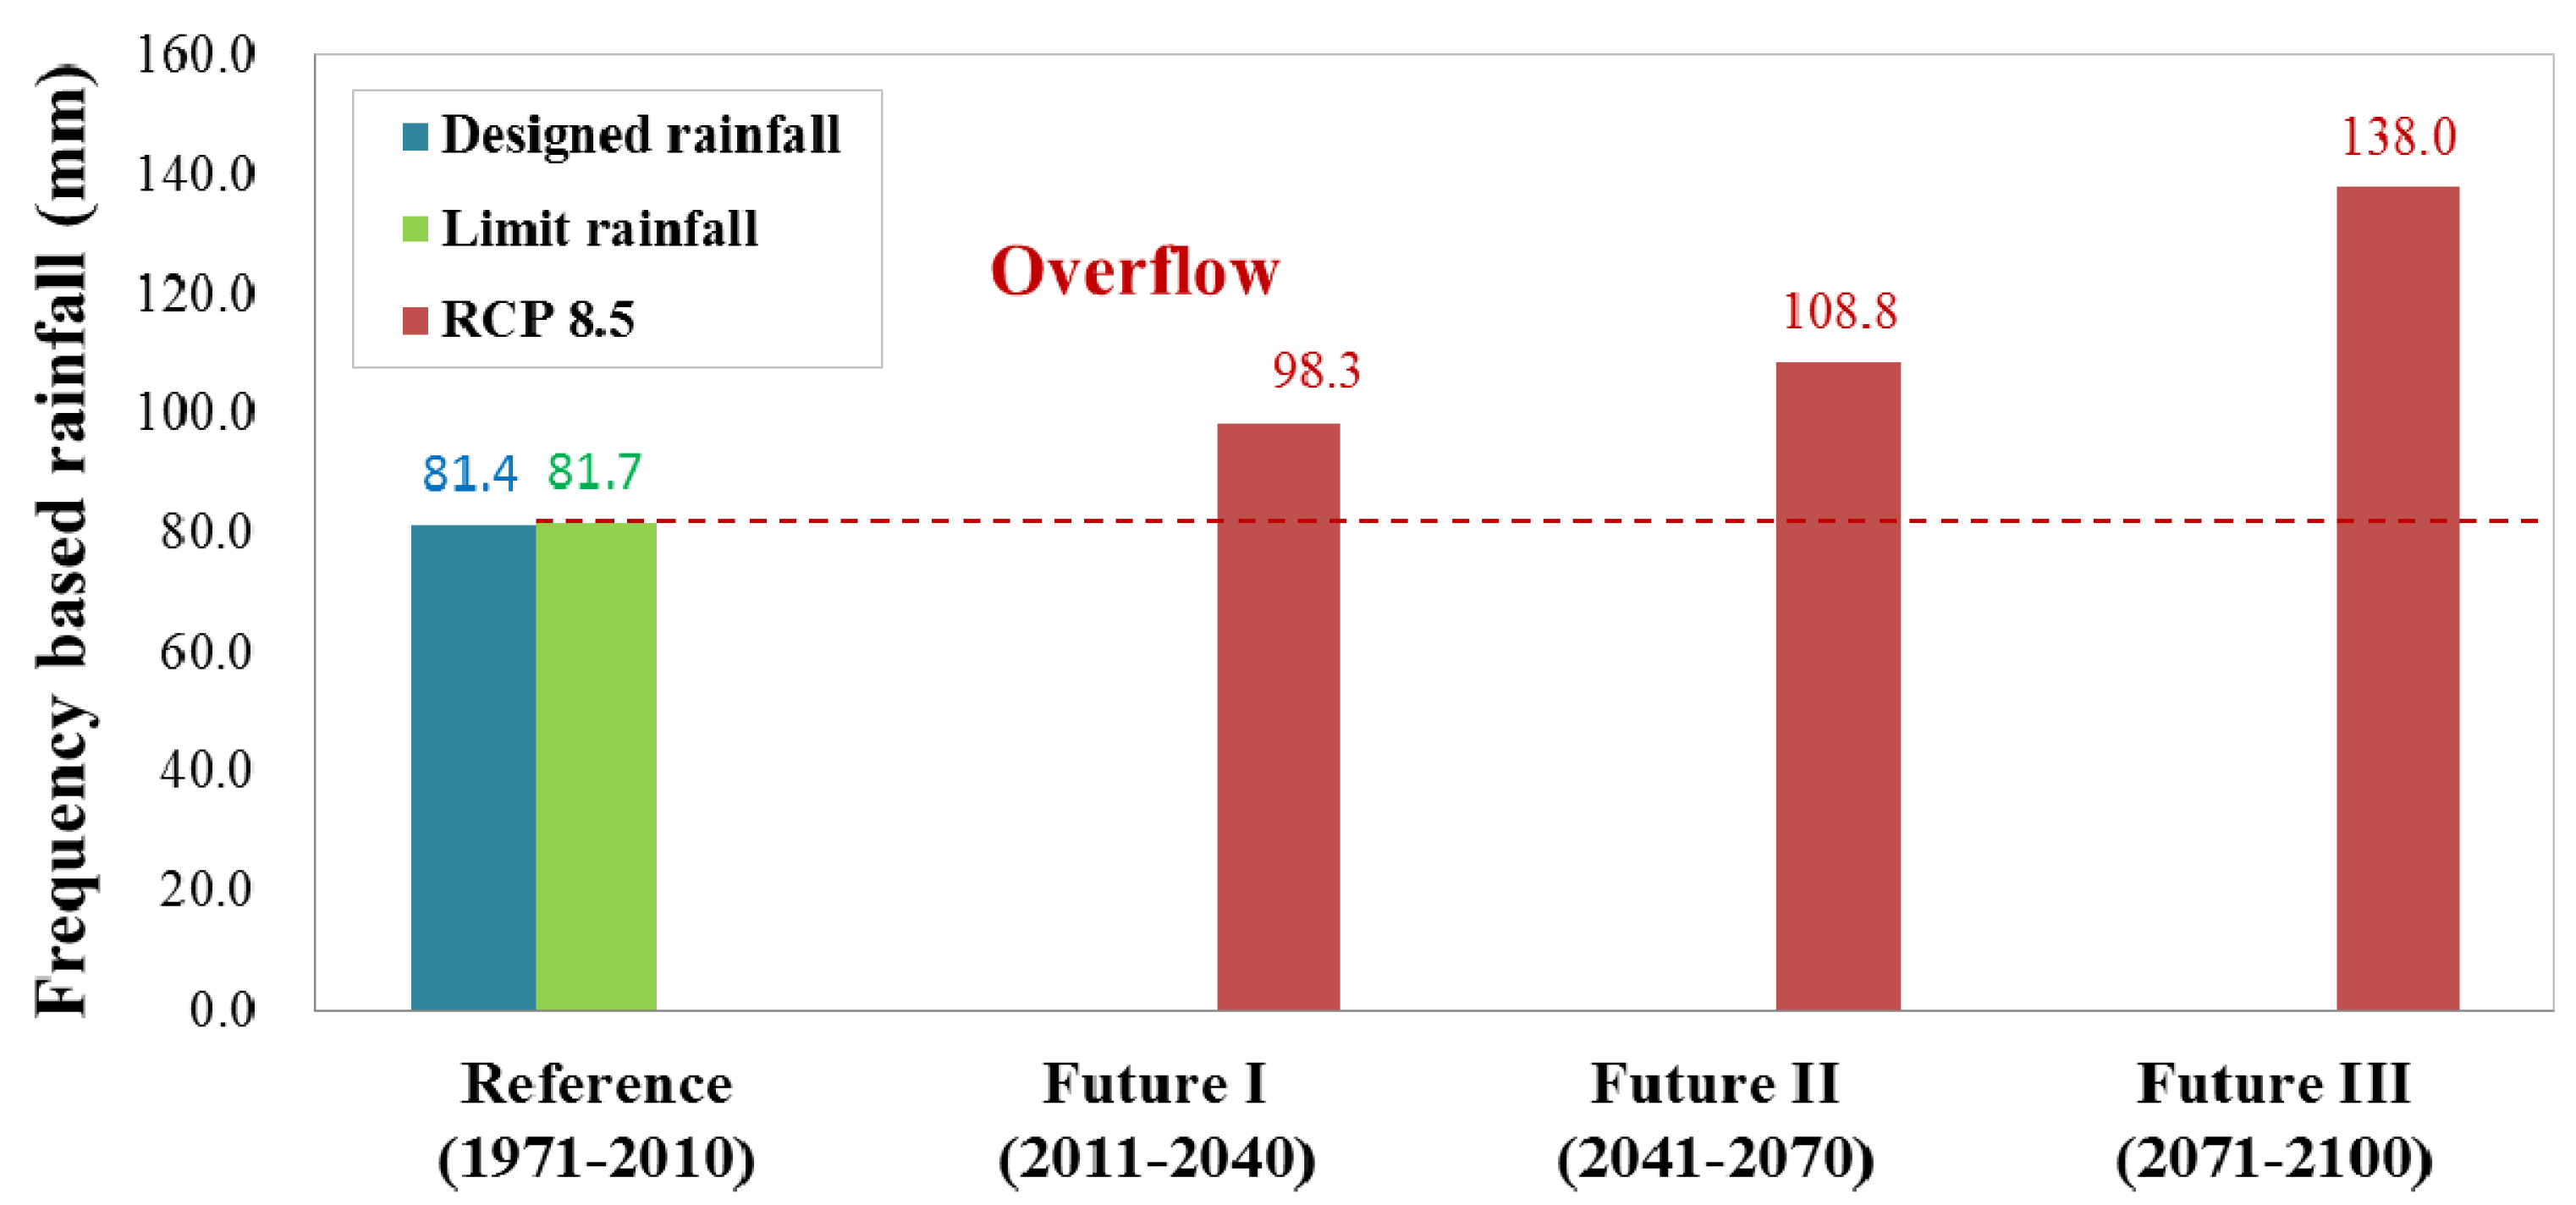
  • Reference: 1971–2010 (Observation Data, Reference period);
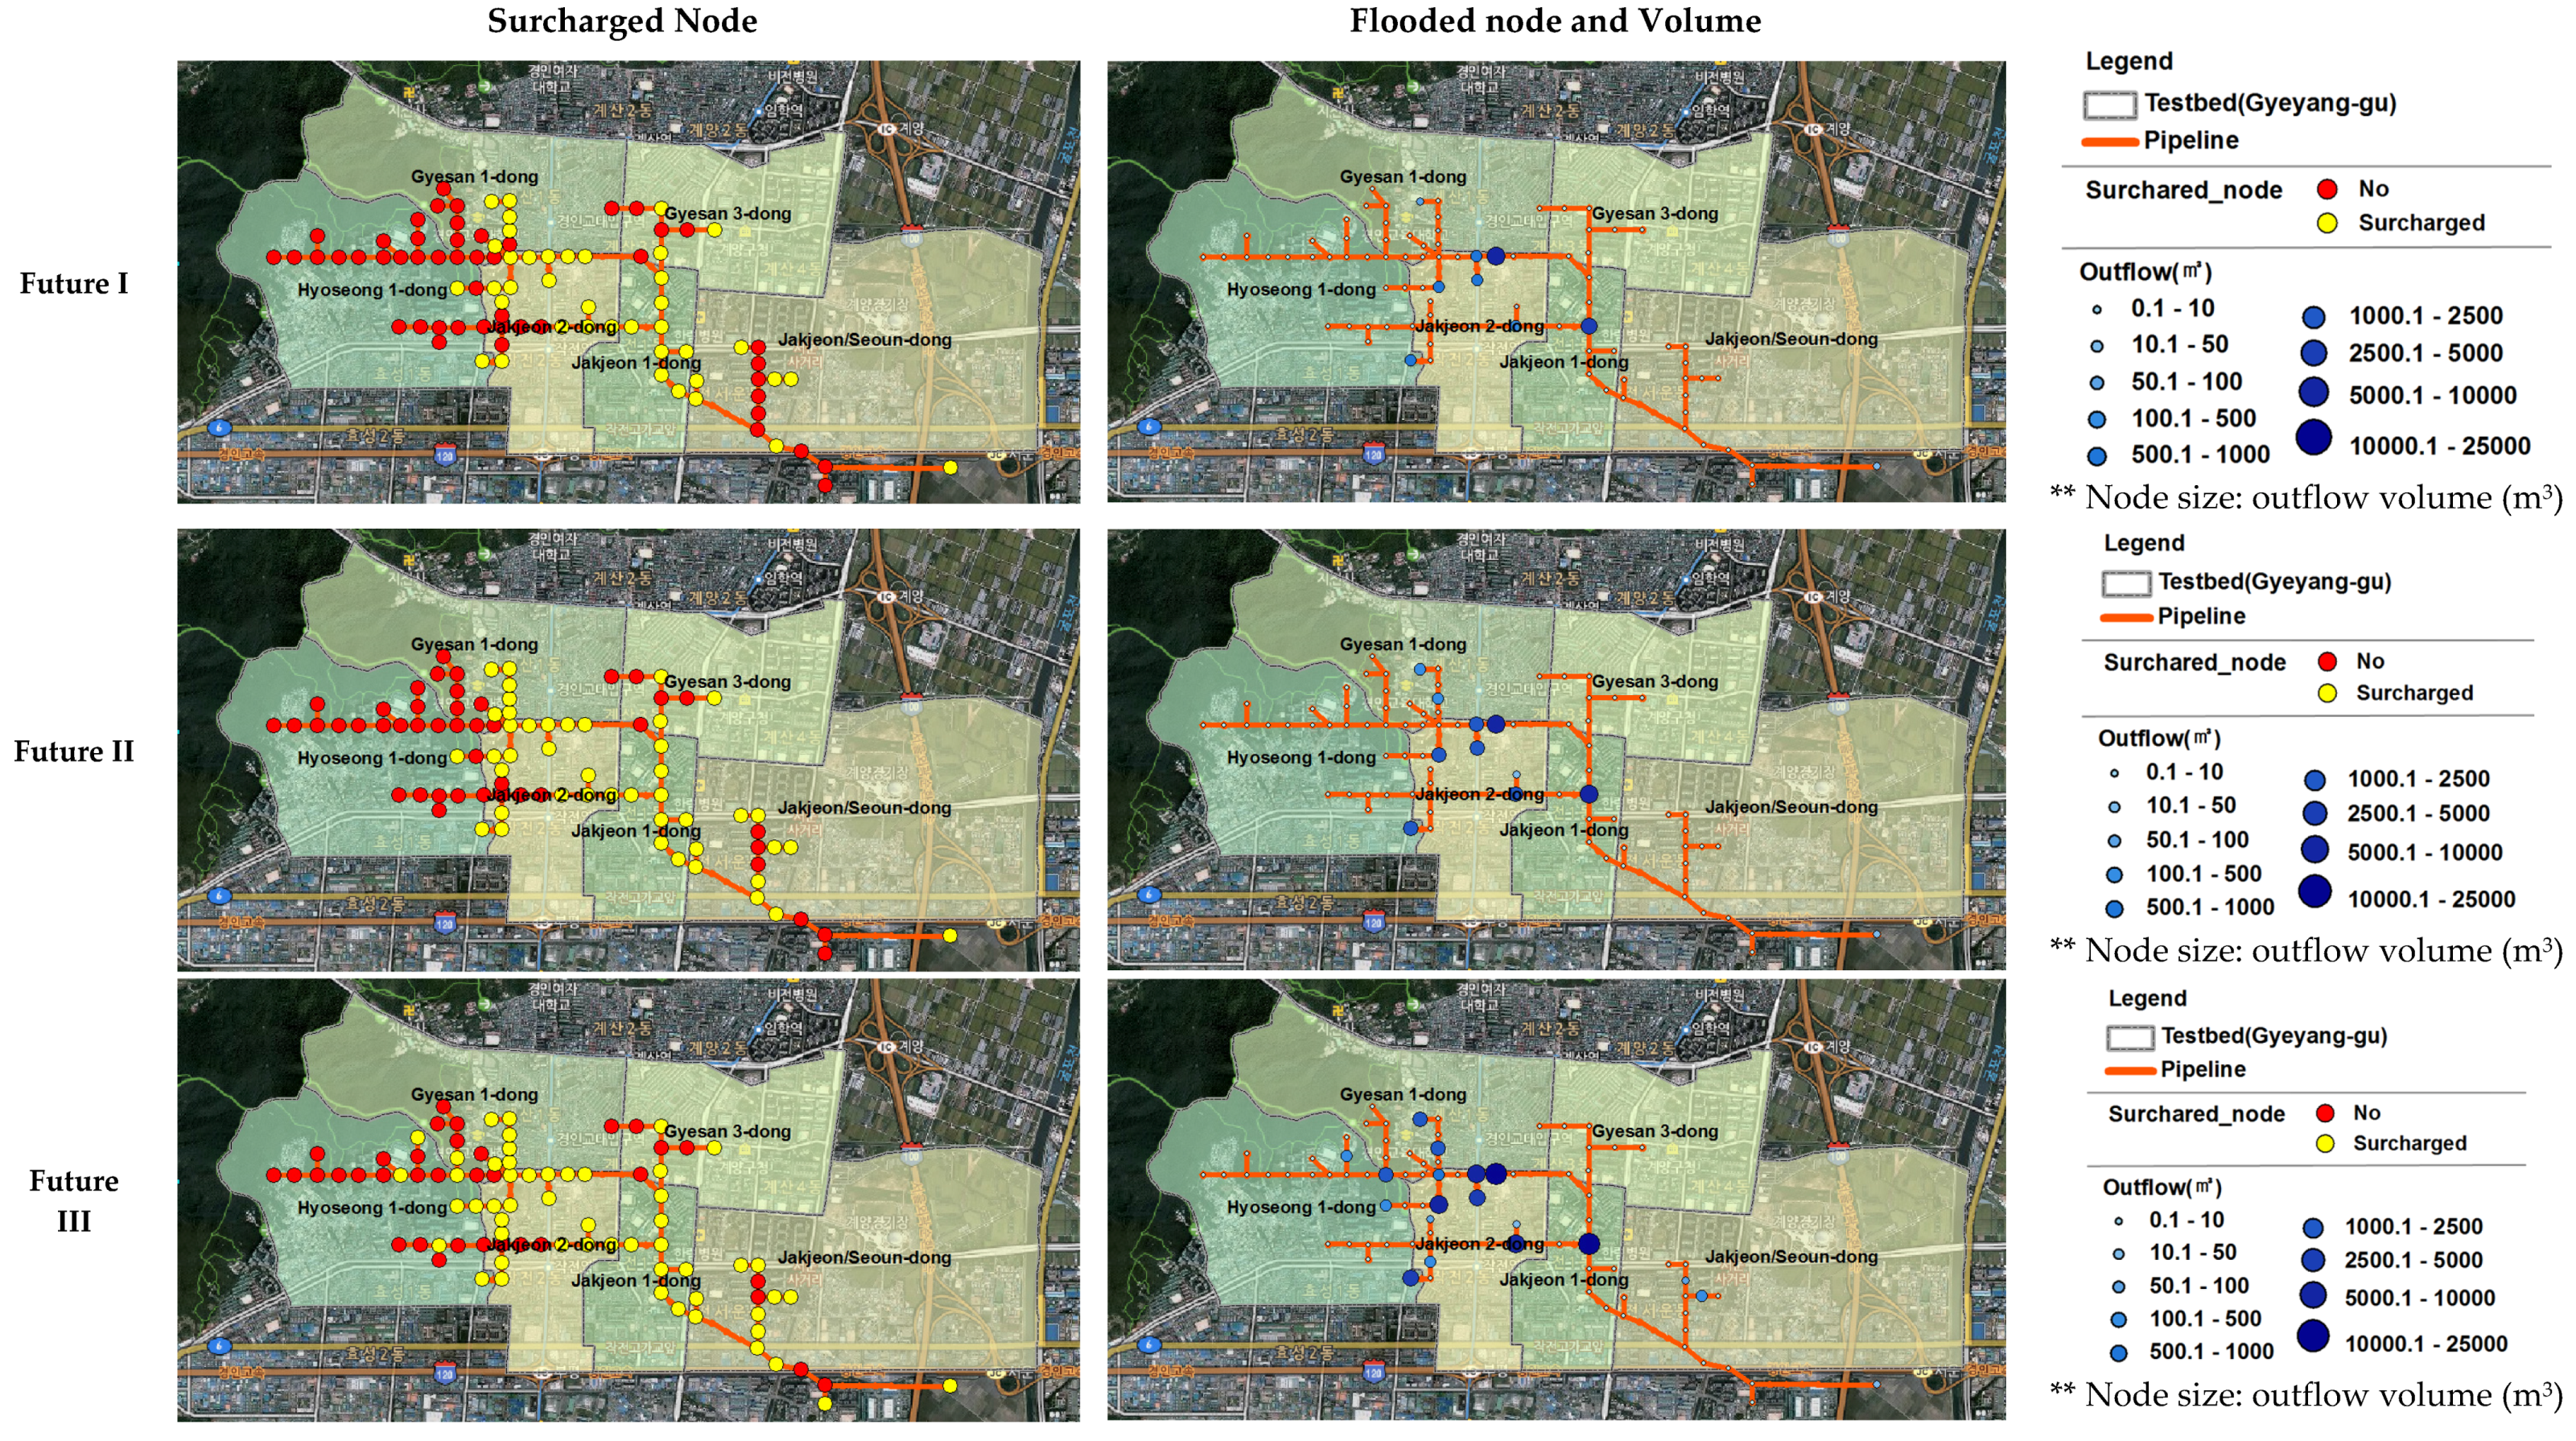
  • Future I: 2011–2040 (RCP Scenario, Projection period);
  • Future II: 2041–2070 (RCP Scenario, Projection period);
  • Future III: 2071–2100 (RCP Scenario, Projection period).

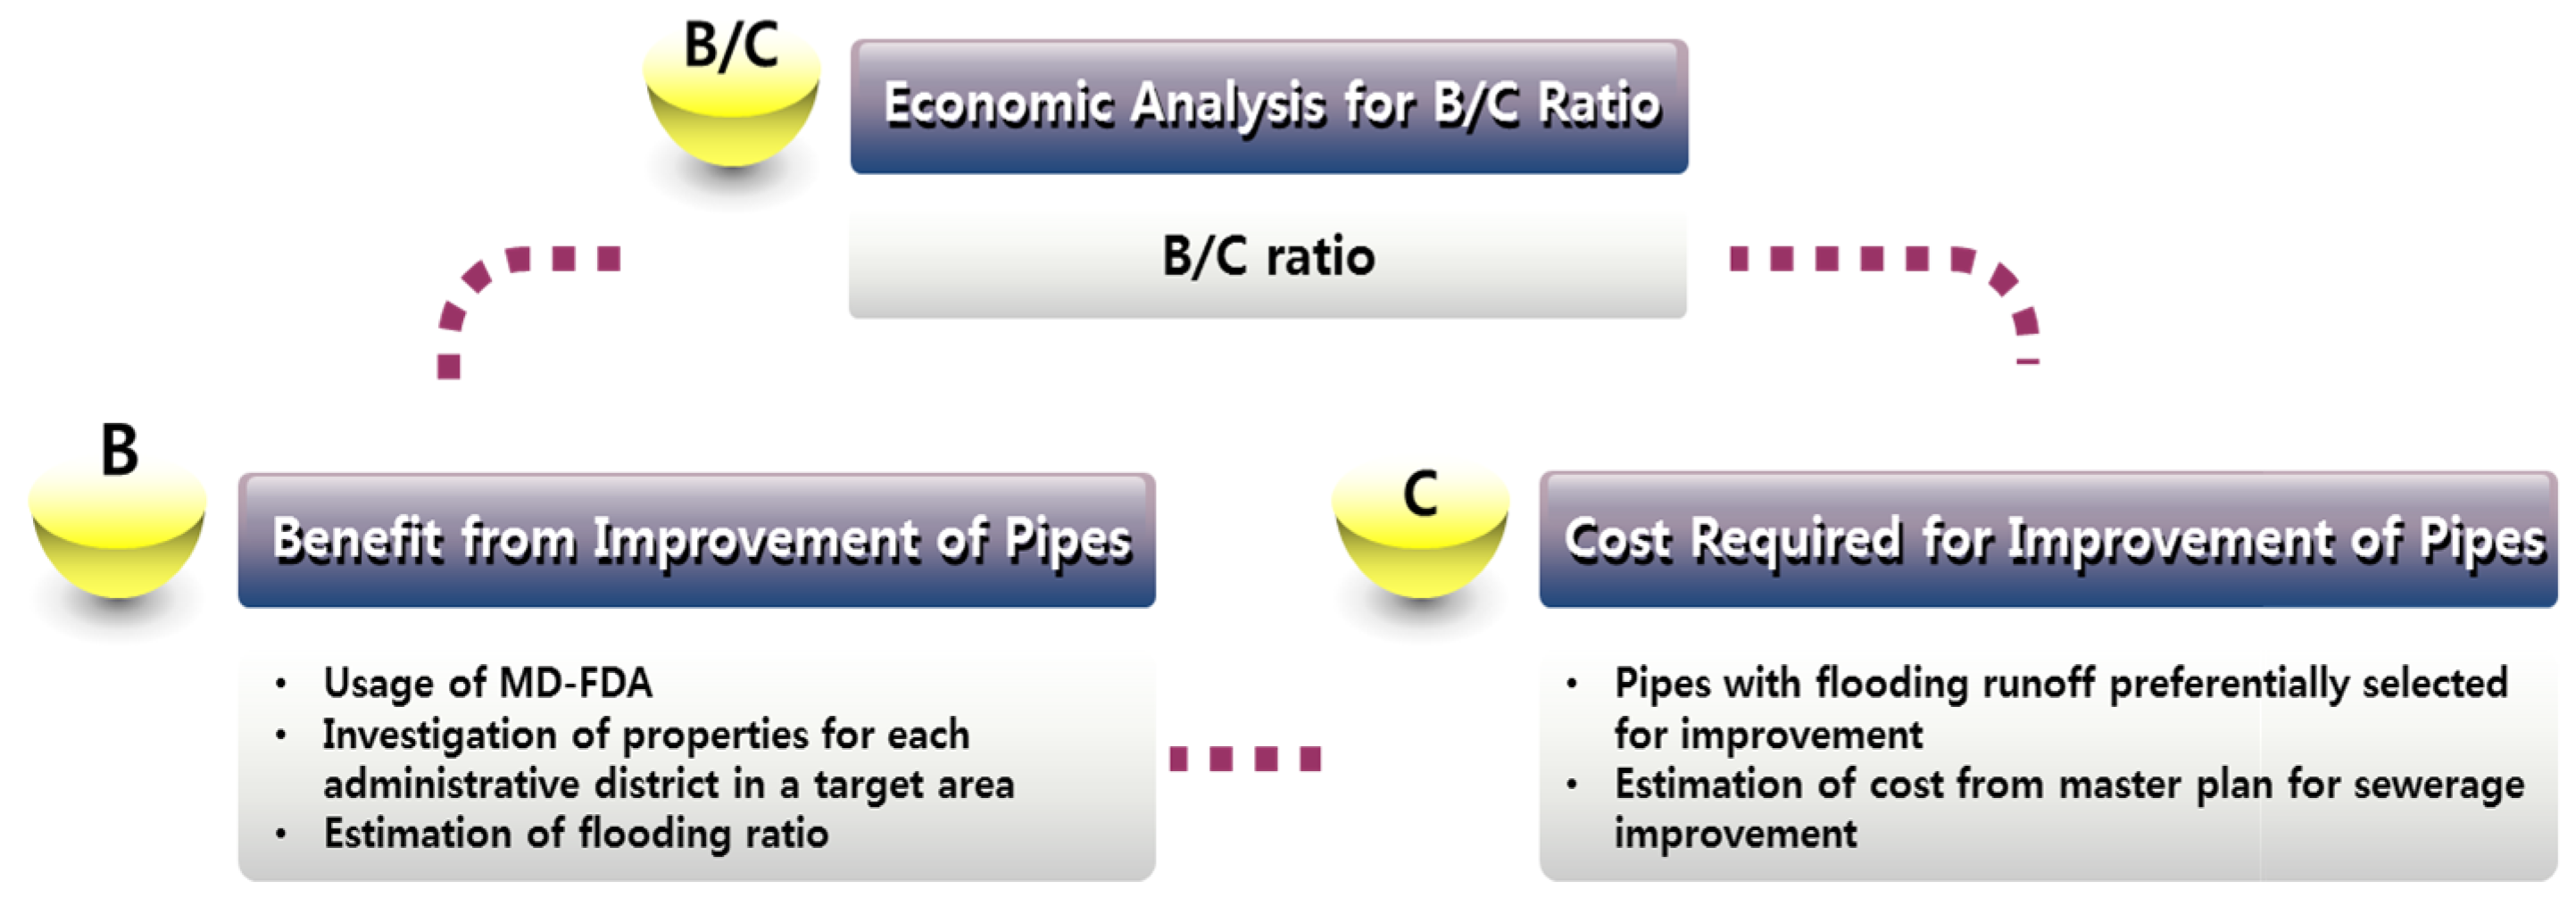
4.2. Practical Implementation with Methodology

This section follows the decision-making procedure for climate change adaptation shown in Section 2 and Figure 1. The detailed implementation of the procedure is described as follows:
Step (a): In accordance with the methodology presented in Section 2, the current urban drainage system facilities were investigated. The study area handles runoff with drainage facilities consisting only of sewer pipes without any pump stations. The total length of the sewer pipes in the study area is 14,917 m (based on XP-SWMM), with a design criteria of 2 h in 5-year frequency. Considering that the design frequency for urban areas in South Korea is 10-year frequency, this area is vulnerable to flooding in the event of localized intensive rainfall due to the lower design frequency. The frequency-based rainfall corresponding to 2 h in 5-year frequency is 81.4 mm. This means that the drainage system can handle 81.4 mm of rainfall over a two-hour period.
Step (b): The next step was to investigate the service life and capabilities of each facility. In flash flood guidance researches, limit rainfall is defined as the specific amount of rainfall that causes flooding. It is estimated by repeating the back calculation of the cumulative rainfall corresponding to the critical discharge for a specified duration, using the runoff analysis model as a means of judging critical situations that can occur in diverse rainfall cases. The estimation of limit rainfall for the target area was 81.7 mm, which meets the design criteria of the current facilities (81.4 mm; Table 2). However, most sewer pipes in this system were installed at least 10 years ago, and aging sewer pipes might make it difficult to accommodate the designed capacity [43].
Step (c): In this study, we used downscaled RCM and RCP 8.5 for the Eastern Asia region provided by NIMR to predict the impact of climate change. Downscaled results from RCM tend to show some level of bias against real observed outcomes (Figure 6a). The quantile mapping approach was used in this study to estimate the bias between observed data and the RCM. Then, the results were applied to RCP 8.5 projection periods to correct the daily total precipitation bias for each period (Figure 6b).
For flood analysis in urban drainage system, we need hourly rainfall data. So, we disaggregated the daily data into hourly data before use. Based on the collected data, the frequency-based rainfall for each target period was estimated under the assumptions of the RCP 8.5 scenario. Table 2 shows the resulting estimates for each target period. To indicate changes in rainfall, the projected rainfall was compared to the design criteria (the rainfall in two hour duration of five year frequency) of the existing drainage system. The frequency-based rainfall for Future I (2020s) was 21% larger than the current design criteria. The frequency-based rainfall was increased by 34% for Future II (2050s), and that for Future III (2080s) was 70% larger than the current design criteria, respectively. For all three periods, projected frequency-based rainfall was much greater than the current design rainfall for the facilities (Figure 7). Furthermore, projected frequency-based rainfall far exceeded the limit rainfall for the facilities in use. This indicates that the capacity of the existing drainage system is remarkably insufficient to accommodate future rainfall.
Depending on the flow capacity of the existing drainage network, an increase in intensity of frequency-based rainfall might result in an increase in sewer overflow and flooding in some urban locations. Urban flooding can create considerable infrastructure problems and huge economic losses in terms of production, as well as significant damage to property and goods.
The runoff simulation for the target area was performed using the estimated frequency-based rainfall in order to review the variation in runoff due to the increase in rainfall intensity. For Future I, the simulation results show that 37 manholes surcharged and nine manholes flooded (Figure 8). The predicted average depth and area of flooding were 0.82 m and 16,600 m2, respectively (Table 3).
For Future II, the results show that 42 manholes surcharged and 10 manholes were flooded. The predicted average depth and area of flooding were 1.15 m and 24,000 m2, respectively. For Future III, 52 manholes surcharged and 17 manholes were flooded. The predicted average depth and area of flooding were 2.05 m and 74,815 m2, respectively. In summary, the Jakjeon-dong area seems to be more vulnerable to localized intensive rainfall than other dong in the study area. It is expected to suffer more damage in the event of heavy rainfall.
Step (e): According to the simulation results based on the RCP 8.5 scenario, the capacity of the current drainage system is insufficient to accommodate future rainfall. Therefore, an overall analysis is necessary to determine a viable alternative. Measures for urban flood mitigation include increasing the elevation of the surrounding land, installing pump stations, and improving the performance of sewer pipes. However, the installation of new retention facilities or pump stations appears to be infeasible in this case, as most of the available land in the urban target area has already been developed. Therefore, a permanent measure to improve the capacity of the existing sewer pipes was selected.
In general, the capacity of a drainage system is determined based on pipe size and pumping capacity [44]. Pipes with more flooding runoff in the simulation were preferentially selected for improvement to efficiently address the deficiency in local capacity due to climate change. To improve the capacity of the pipes with overflow, an increase in dimensions was selected—0.3 m for circular pipes and 0.5 m for rectangular pipes—in order to accommodate projected rainfall for each target period. Table 4 shows the results for sections with insufficient capacity before and after improvements were made. Figure 9 shows an improved section.
Step (f): Fankhauser et al. [45] state that an assessment of adaptation measures requires a comparison of project costs and benefits. Essentially, if cost savings achieved by maintaining the current design standards are less than the present value of future damage, then adaptation measures are justified. Conversely, if the present value of future damage is less than the cost associated with improvements, a case could be made for maintaining the existing design standards. Therefore, drainage design criteria should ideally be reviewed and revised based on cost-benefit analysis and risk assessment in consideration of the threat [19].
The benefit-cost (B/C) ratio is the most widely used measure of economic efficiency. It assesses the economic feasibility of an alternative by reviewing both its benefits and associated costs.
First, the benefits and costs of the alternative must be separated to assess the B/C ratio (Figure 10). In the case study we examined, flooding was expected in a few sections due to increased rainfall, and the sewer pipes were enlarged to prevent such an occurrence. As no damage occurred because of the improvements to the pipes, the benefit of this alternative was the prevention of potential damage due to overflow. To estimate the damage due to overflow, MD-FDA was used. After collecting the data on assets that suffered damage, the direct inundation damage cost was estimated by multiplying the inundated ratio and damage ratio by the asset value for each item in the target area. The results are presented in Table 5.
The cost of this alternative can be the amount spent to improve the sewer pipes. We estimated this cost from the Master Plan for Sewerage Improvement [46].
  • Benefit from improving the prevention facilities (B): reduction of damage due to the overflow
    -
    Investigate the properties for each administrative district in the target area and estimate the flooding ratio;
    -
    Estimate the damage to the properties due to flooding using the flooding ratio.
  • Cost to improve the disaster prevention facilities: (C)
    -
    Estimate the cost to improve the pipes with insufficient capacity.
Table 5 shows the comparison between the benefits and costs of the alternatives. Potential damage due to overflow was concentrated in Jakjeon 2-dong, but the improvements were performed in Jakjeon 1-dong, 2-dong, and Jakjeon/Seoun-dong. As the B/C ratio in each case exceeded one, the alternative presented in this case study was financially valid.
Pipes lacking the capacity to accommodate the future design (plan) or deteriorated infrastructure should be replaced and augmented in the near future. Their replacement and augmentation should not be indiscriminately planned and designed. Rather, the process should be handled efficiently based on the deficiency in local capacity due to climate change so that the outcome is socially and economically effective and achieved at the most reasonable cost. The B/C ratio is the criterion on which to choose the best measure, but the negative effects of the chosen measure should not be ignored. As our economic analysis was limited to the target area, it is unclear whether improving the capacity of sewer pipes will be financially justified in all cases. Our results were derived from the simple application of the presented methodology. However, our results or this procedure will help authorities redesign and augment urban drainage systems in areas vulnerable to flooding in order to prevent damage if they are applied considering local characteristics.

5. Conclusions

Our research reviewed the effects of climate change on urban drainage systems and proposed a procedure and methodology to establish damage reduction measures. The methodology was applied to an urban area to develop an appropriate alternative as an example, and the cost-benefit analysis performed to assess the economic efficiency of the proposed alternative was presented.
Flooding was projected to occur in every simulation, and an increase in pipe capacity was selected to prevent it. The B/C ratio was used to analyze the economic validity of the proposed damage reduction measure. Using this approach, the prevention of potential damage due to overflow was assigned to benefit (B); MD-FDA was utilized to assess the damage due to overflow, and the cost to improve the pipes with insufficient capacity was assigned to cost (C). The results of the economic analysis showed that increase in pipe capacity to address impacts from climate change was valid, because the B/C ratio in each case exceeded one.
Our results were derived from the simple application of the presented methodology. The methodology presented could be used as a guideline for other types of disasters due to climate change, beyond those related to urban drainage systems. This study did not consider the uncertainty of climate change projection because it focused on design of a practical procedure for climate change adaptation. While this study focused on a methodology for design and evaluation of actions based on an example climate model and type of action, future work should assess the impact of climate change and adaptation actions using an ensemble of climate models and greenhouse gas scenarios. Also, effort is needed to evaluate the uncertainty of climate change projection.

Acknowledgments

This work was supported by a National Research Foundation of Korea (NRF) grant, funded by the Korean government (MEST; No. 2011-0028564).

Author Contributions

The research presented here was carried out in collaboration with all authors. Soojun Kim and Hung Soo Kim conceived the original idea for the study. Narae Kang designed/conducted the research methods and drafted the manuscript. Yonsoo Kim, Huiseong Noh and Seung Jin Hong performed the data analysis. Soojun Kim contributed to the writing of the paper. All authors read and approved the final manuscript.

Conflicts of Interest

The authors declare no conflicts of interest.

References

  1. Niemczynowicz, J. Impact of the greenhouse effect on sewerage systems—Lund case study. Hydrol. Sci. J. 1989, 34, 651–666. [Google Scholar] [CrossRef]
  2. Waters, D.; Watt, W.E.; Marsalek, J.; Anderson, B.C. Adaptation of a storm drainage system to accommodate increased rainfall resulting from climate change. J. Environ. Plan. Manag. 2003, 46, 755–770. [Google Scholar] [CrossRef]
  3. Papa, F.; Guo, Y.; Thoman, G. Urban drainage infrastructure planning and management with a changing climate. In Proceedings of the 57th Canadian Water Resources Association Annual Congress—Water and Climate Change: Knowledge for Better Adaptation, Montréal, QC, Canada, 16–18 June 2004.
  4. Ashley, R.M.; Balmforth, D.J.; Saul, A.J.; Blanskby, J. Flooding in the future—Predicting climate change, risks and responses in urban areas. Water Sci. Technol. 2005, 52, 265–273. [Google Scholar] [PubMed]
  5. Denault, C.; Millar, R.G.; Lence, B.J. Assessment of possible impacts of climate change in an urban catchment. J. Am. Water Res. Assoc. 2006, 42, 685–697. [Google Scholar] [CrossRef]
  6. Mailhot, A.; Rivard, G.; Duchesne, S.; Villeneuve, J. Impacts et Adaptations Liés Aux Changements Climatiques (CC) en Matière de Drainage Urbain au Québec; Centre Eau, Terre et Environnement: Québec, QC, Canada, 2007. [Google Scholar]
  7. Mailhot, A.; Duchesne, S.; Rivard, G.; Nantel, E.; Caya, D.; Villeneuve, J. Climate change impacts on the performance of urban drainage systems for southern Québec. In Proceeding of the EIC Climate Change Technology Conference, Ottawa, ON, Canada, 10 May 2006.
  8. Grum, M.; Jørgensen, A.T.; Johansen, R.M.; Linde, J.J. The effect of climate change on urban drainage: An evaluation based on regional climate model simulations. Water Sci. Technol. 2006, 54, 9–15. [Google Scholar] [CrossRef] [PubMed]
  9. Berggren, K.; Olofsson, M.; Viklander, M.; Svensson, G. Tools for measuring climate change impacts on urban drainage systems. In Proceedings of the NOVATECH 2007: Sixth International Conference on Sustainable Techniques and Strategies in Urban Water Management, Lyon, France, 25–28 June 2007.
  10. Olofsson, M. Climate Change and Urban Drainage: Future Precipitation and Hydraulic Impact. Licentiate Thesis, Luleå University of Technology, Luleå, Sweden, 2007. [Google Scholar]
  11. Willems, P.; Arnbjerg-Nielsen, K.; Olsson, J.; Nguyen, V.T.V. Climate change impact assessment on urban rainfall extremes and urban drainage: Methods and shortcomings. Atmos. Res. 2012, 103, 106–118. [Google Scholar] [CrossRef]
  12. Arnbjerg-Nielsen, K.; Willems, P.; Olsson, J.; Beecham, S.; Pathirana, A.; Gregersen, I.B.; Madsen, H.; Nguyen, V. Impacts of climate change on rainfall extremes and urban drainage systems: A review. Water Sci. Technol. 2013, 68, 16–28. [Google Scholar] [CrossRef] [PubMed]
  13. Zhou, Q. A review of sustainable urban drainage systems considering the climate change and urbanization impacts. Water 2014, 6, 976–992. [Google Scholar] [CrossRef]
  14. Semadeni-Davies, A.; Hernebring, C.; Svensson, G.; Gustafsson, L. The impacts of climate change and urbanisation on drainage in helsingborg, sweden: Suburban stormwater. J. Hydrol. 2008, 350, 114–125. [Google Scholar] [CrossRef]
  15. Berggren, K.; Olofsson, M.; Viklander, M.; Svensson, G.; Gustafsson, A. Hydraulic impacts on urban drainage systems due to changes in rainfall caused by climatic change. J. Hydrol. Eng. 2011, 17, 92–98. [Google Scholar] [CrossRef]
  16. Neumann, J.E.; Price, J.; Chinowsky, P.; Wright, L.; Ludwig, L.; Streeter, R.; Jones, R.; Smith, J.B.; Perkins, W.; Jantarasami, L. Climate change risks to us infrastructure: Impacts on roads, bridges, coastal development, and urban drainage. Clim. Chang. 2015, 131, 97–109. [Google Scholar] [CrossRef]
  17. Semadeni-Davies, A.; Hernebring, C.; Svensson, G.; Gustafsson, L. The Impacts of Climate Change and Urbanisation on Urban Drainage in Helsingborg; Final Report; Department Water Research Engineering, Lund University: Lund, Sweden, 2005. [Google Scholar]
  18. Berggren, K. Indicators for urban drainage system-assessment of climate change impacts. In Proceedings of 11th International Conference on Urban Drainage, Edinburgh International Conference Centre, Scotland: 11 ICUD, Munich, Germany, 31 August–5 September 2008.
  19. Arisz, H.; Burrell, B.C. Urban Drainage infrastructure planning and design considering climate change. In EIC Climate Change Technology, Proceedings of the 2006 IEEE EIC Climate Change Conference, Ottawa, ON, Canada, 10–12 May 2006; pp. 1–9.
  20. Lapp, D.; Eng, P. Engineers and climate change: What you need to know. Eng. Dimens. 2005, 26, 51–53. [Google Scholar]
  21. Ekström, M.; Fowler, H.; Kilsby, C.; Jones, P. New estimates of future changes in extreme rainfall across the UK using regional climate model integrations. 2. Future estimates and use in impact studies. J. Hydrol. 2005, 300, 234–251. [Google Scholar] [CrossRef]
  22. Burrel, B.C.; Davar, K.; Hughes, R. A review of flood management considering the impacts of climate change. Water Int. 2007, 32, 342–359. [Google Scholar] [CrossRef]
  23. Mailhot, A.; Duchesne, S. Design criteria of urban drainage infrastructures under climate change. J. Water Resour. Plan. Manag. 2009, 136, 201–208. [Google Scholar] [CrossRef]
  24. Intergovernmental Panel on Climate Change. The Fifth Assessment Report: Climate Change 2013 (AR5); Cambridge University Press: Cambridge, UK, 2013. [Google Scholar]
  25. Moss, R.H.; Edmonds, J.A.; Hibbard, K.A.; Manning, M.R.; Rose, S.K.; Van Vuuren, D.P.; Carter, T.R.; Emori, S.; Kainuma, M.; Kram, T. The next generation of scenarios for climate change research and assessment. Nature 2010, 463, 747–756. [Google Scholar] [CrossRef] [PubMed]
  26. Van Vuuren, D.P.; Edmonds, J.; Kainuma, M.; Riahi, K.; Thomson, A.; Hibbard, K.; Hurtt, G.C.; Kram, T.; Krey, V.; Lamarque, J. The representative concentration pathways: An overview. Clim. Chang. 2011, 109, 5–31. [Google Scholar] [CrossRef]
  27. Fischer, G.; Tubiello, F.N.; Van Velthuizen, H.; Wiberg, D.A. Climate change impacts on irrigation water requirements: Effects of mitigation, 1990–2080. Technol. Forecast. Soc. Chang. 2007, 74, 1083–1107. [Google Scholar] [CrossRef]
  28. Moss, R.H.; Babiker, M.; Brinkman, S.; Calvo, E.; Carter, T.; Edmonds, J.A.; Elgizouli, I.; Emori, S.; Lin, E.; Hibbard, K. Towards New Scenarios for Analysis of Emissions, Climate Change, Impacts, and Response Strategies; Intergovernmental Panel on Climate Change: Geneva, Switzerland, 2008. [Google Scholar]
  29. Park, S.; Lee, I.; Kang, H.; Cho, C. Regional climate projection for East Asia and Korea using the HadGEM3-RA. In Proceedings of the Fifth Korea-Japan-China Joint Conference on Meteorology, Busan, Korea, 24–26 October 2011; pp. 89–89.
  30. Panofsky, H.A.; Brier, G.W. Some Applications of Statistics to Meteorology; State University, College of Earth and Mineral Sciences: University Park, PA, USA, 1968. [Google Scholar]
  31. Rodriguez-Iturbe, I.; Cox, D.; Isham, V. Some Models for Rainfall Based on Stochastic Point Processes. In Proceedings of the Royal Society of London A: Mathematical, Physical and Engineering Sciences, London, UK, 8 April 1987.
  32. Rodriguez-Iturbe, I.; Cox, D.; Isham, V. A Point Process Model for Rainfall: Further Developments. In Proceedings of the Royal Society of London A: Mathematical, Physical and Engineering Sciences, London, UK, 8 June 1988.
  33. Glasbey, C.; Cooper, G.; McGechan, M. Disaggregation of Daily Rainfall by Conditional Simulation from a Point-Process Model. J. Hydrol. 1995, 165, 1–9. [Google Scholar] [CrossRef]
  34. Sivakumar, B.; Sorooshian, S.; Gupta, H.V.; Gao, X. A chaotic approach to rainfall disaggregation. Water Resour. Res. 2001, 37, 61–72. [Google Scholar] [CrossRef]
  35. Kyoung, M. Assessment of Climate Change Effect on Standardized Precipitation Index and Frequency Based Precipitation. Ph.D. Thesis, Inha University, Incheon, Korea, 2010. [Google Scholar]
  36. Phillips, B.; Yu, S.; Thompson, G.; De Silva, N. 1D and 2D modelling of urban drainage systems using XP-SWMM and TUFLOW. In Proceedings of the 10th International Conference on Urban Drainage, Copenhagen, Denmark, 21–26 August 2005; pp. 21–26.
  37. Toriman, M.E.; Hassan, A.J.; Gazim, M.B.; Mokhtar, M.; Mastura, S.S.; Jaafar, O.; Karim, O.; Aziz, N.A.A. Integration of 1-D hydrodynamic model and GIS approach in flood management study in Malaysia. Res. J. Earth Sci. 2009, 1, 22–27. [Google Scholar]
  38. Van der Sterren, M.; Rahman, A.; Ryan, G. Modeling of a Lot scale rainwater tank system in XP-SWMM: A case study in Western Sydney, Australia. J. Environ. Manag. 2014, 141, 177–189. [Google Scholar] [CrossRef] [PubMed]
  39. Ricks, M.D. Development of Computer Simulation Model for Urban Region Using Xp-Swmm in Savannah, Georgia. Ph.D. Thesis, University of South Carolina, Columbia, CA, USA, 2015. [Google Scholar]
  40. Lighthill, M.J.; Whitham, G.B. On kinematic waves. I. flood movement in long rivers. In Proceedings of the Royal Society of London A: Mathematical, Physical and Engineering Sciences, London, UK, 10 May 1955.
  41. Xiong, Y.; Melching, C.S. Comparison of kinematic-wave and nonlinear reservoir routing of urban watershed runoff. J. Hydrol. Eng. 2005, 10, 39–49. [Google Scholar] [CrossRef]
  42. Yi, C.; Lee, J.; Shim, M. GIS-based distributed technique for assessing economic loss from flood damage: Pre-feasibility study for the anyang stream basin in Korea. Nat. Hazards 2010, 55, 251–272. [Google Scholar] [CrossRef]
  43. Zhang, X.Z.; Liu, Y.Z. Analysis and simulation of drainage capacity of urban pipe network. Res. J. Appl. Sci. Eng. Technol. 2013, 6, 387–392. [Google Scholar]
  44. Mark, O.; Weesakul, S.; Apirumanekul, C.; Aroonnet, S.B.; Djordjević, S. Potential and limitations of 1D modelling of urban flooding. J. Hydrol. 2004, 299, 284–299. [Google Scholar] [CrossRef]
  45. Fankhauser, S.; Smith, J.; Tol, R. The Costs of Adapting to Climate Change; Global Environment Facility: Washington, DC, USA, 1998. [Google Scholar]
  46. Minister of Environment. Master Plan for Sewerage Improvement; Seoul-si: Seoul, Korea, 2002. [Google Scholar]
Figure 1. Decision-making procedure for applying a new design criteria considering climate change.
Water 08 00268 g001
Figure 2. Quantile mapping for bias correction.
Water 08 00268 g002
Figure 3. The concept of weighting in chaotic disaggregation.
Water 08 00268 g003
Figure 4. Procedure of the Multidimensional Flood Damage Analysis (MD-FDA).
Water 08 00268 g004
Figure 5. The study area (Gyeyang-gu); gray line denotes the administrative district of Gyeyang-gu (Incheon, Korea).
Water 08 00268 g005
Figure 6. Comparison of rainfall observations and climate change scenarios at Incheon, Korea. (a) Reference period; (b) Projection period (bias correction by the Quantile Mapping Method).
Water 08 00268 g006
Figure 7. Comparison between design rainfall and frequency-based rainfall.
Water 08 00268 g007
Figure 8. Surcharged nodes, flooded nodes, and flooded volume (m3) for each target period Step (d): If the facility is not safe → Step (e).
Water 08 00268 g008
Figure 9. Sections with insufficient capacity. (a) Future I (2020s); (b) Future II (2050s); (c) Future III (2080s).
Water 08 00268 g009aWater 08 00268 g009b
Figure 10. Estimation of damage due to flooding and economic analysis.
Water 08 00268 g010
Table 1. NIMR climate change scenario data.
ModelHadGEM3-RA
ScenariosRCP 8.5
Time period2010–2100
Grid size12.5 km
Meteorological factorPrecipitation
Time scaleDaily average
Table 2. The predicted five-year, two-hour, frequency-based rainfall amounts (unit: mm). ▲ represents an increase compared to current the design criteria.
Design RainfallLimit RainfallFuture IFuture IIFuture III
81.4▲0.4%▲21%▲34%▲70%
Table 3. Projected damage for each target period.
DamageFuture IFuture IIFuture III
Average flooding depth (m)0.821.152.05
Average flooding area (m2)16,60024,00036,700
Overflow discharge ( m 3 )13,45227,62074,815
Table 4. Changes in capacity for inadequate sections in the target area.
ClassificationFuture IFuture IIFuture III
Section lacking in capacity (m)101111752506
Improved section (m)178228535535
Table 5. Benefit/cost (B/C) ratio of the improvement in prevention facilities. (Unit: KRW one million, KRW = South Korean won).
ClassificationBenefitsCostsB/C
Future I132411751.13
Future II257421881.17
Future III589049311.19

