Article

Impact Assessment of Climate and Land-Use Changes on Flooding Behavior in the Upper Ciliwung River, Jakarta, Indonesia

1
Institute for the Advanced Study of Sustainability, United Nations University, Tokyo 150-8925, Japan
2
Integrated Research System for Sustainability Science, The University of Tokyo, 7-3-1 Hongo, Bunkyo-Ku, Tokyo 113-8654, Japan
*
Author to whom correspondence should be addressed.
Water 2016, 8(12), 559; https://doi.org/10.3390/w8120559
Submission received: 5 September 2016 / Revised: 1 November 2016 / Accepted: 21 November 2016 / Published: 29 November 2016

Abstract

:
The hydrological conditions upstream of the Ciliwung watershed are changing due to climate and land-use changes. Any changes in this area may increase the flood frequencies which may have countless consequences downstream of the watershed where the Jakarta city is located. We simulated the effects of land-use and climate changes on flooding (e.g., peak flow and river discharge) in the upper Ciliwung River basin in Greater Jakarta, Indonesia. Hydrologic Modeling System (HEC-HMS), a rainfall-runoff simulation model, was used to simulate peak river discharge values for current and future conditions. The model was calibrated and validated based on the observed river discharge data from February 2007 and January 1996, respectively. The statistical analysis showed that the performance of the model is satisfactory, with Nash–Sutcliffe efficiency 0.64 and 0.58 for calibration and validation, respectively. The coefficients of determination values are 0.86 and 0.82, respectively. The effect of the projected land-use changes alone in 2030 increased the peak flow by approximately 20%. When considering the land-use changes in conjunction with the future climate scenario, the peak flow based on the precipitation corresponding to a 50-year return period in 2030 increased by 130%. Based on the results of this study, it is urgent that a flood management plan be implemented in the target area to reduce flooding in the near future.

1. Introduction

Rapid land-use changes in developing countries and increased extreme rainfall events could potentially result in elevated flood risk, particularly in megacities, due to inadequate drainage systems [1,2]. Although various researchers have explored this issue, the megacity of Jakarta still lacks such comprehensive evaluation. The Ciliwung watershed is the main river basin in Jakarta Metropolitan Area [3] and the ecosystem changes of the upstream Ciliwung River will affect the other part of the river basin [4]. Therefore, it is necessary to implement countermeasures to reduce future flooding based on the scientific simulation of the effects of climate and land-use changes on hydrological behavior and flooding occurrences upstream of this area.
Urbanization changes hydrological behavior by reducing infiltration, baseflow and lag time and increasing surface runoff, peak flow, flow volumes, and frequency of flooding [5,6,7,8,9]. Land-use changes coupled with climate change may have adverse effects on hydrological behavior and flooding or drought frequencies [10]. In the tropical region of Southeast Asia, these changes may have a pernicious effect not only on the ecosystems but also on the infrastructures of cities. Changes in land-use, particularly the development of urban areas, can increase surface runoff and flooding [11]. Various researchers have studied the effects of land-use change on the hydrological response of watersheds. For instance, Li and Wang [12] used a Long-Term Hydrologic Impact Assessment (L-THIA) model to examine the effects of land-use and land-cover changes on surface runoff in the Dardenne Creek watershed in St. Louis, Missouri. Du et al. [11] developed an integrated modeling system to evaluate the effects of urbanization on flood events in the Qinhuai River watershed in Jiangsu Province, China, using the Hydrologic Modeling System (HEC-HMS). Emam et al. [13] used the Soil and Water Assessment Tools (SWAT) model to assess the effects of land-use changes on surface runoff in the Razan-Ghahavand watershed in Iran. Im et al. [14] used the Systeme Hydrologique Europeen model (MIKE SHE) to evaluate the impact of land-use changes on the hydrology of the Gyeongancheon watershed in Korea.
According to the Fifth Assessment Report of the Intergovernmental Panel on Climate Change (IPCC-AR5), global average temperatures are expected to increase between 0.5 °F and 8.6 °F by the year 2100 [15]. Many researchers have studied the impacts of climate change on water resources and flooding using hydrological models [13,16,17,18]. Halwatura and Najim [19] applied the HEC-HMS model to simulate runoff in a tropical catchment. Mahmood et al. [16] used HEC-HMS to analyze the impact of climate change on water resources in Pakistan. Muis et al. [20] studied the flood risk under climate and land-use changes in Indonesia. Ranger et al [21] assessed the potential impact of climate change on flood risk in Mumbai. Meng et al. [22] evaluated the impacts of recent climate change on the hydrology in the Northeastern Tibetan Plateau.
Jakarta, the capital city of Indonesia, is experiencing changes in the hydrological regime due to rapid urbanization. The Ciliwung River basin, a major river basin that passes through the center of Jakarta, has caused several catastrophic floods during the past few decades. Additionally, these changes can alter groundwater recharge, which is the main source of drinking water in Jakarta [23]. The situation may be even more severe in the region upstream of the river basin. According to center for region Cimanuk-Cisanggarung river basin [24], over 40% of the population in the cities located upstream of the Ciliwung River basin (e.g., Depok and Bogor) rely on groundwater resources, which is a greater proportion of the population than in the city of Jakarta.
The main objective of this research was to evaluate the flooding behavior (e.g., flood discharge, peak flow) upstream of the Ciliwung River basin, in the Bogor watershed, using projected future climate and land-use data. Moreover, the further goal of this study was to generate discharge data based on the 50-year return period, which will be useful for the design and implementation of flood control systems. The HEC-HMS model was used in this study to quantify the flood response to urbanization and projected climate change. It is important to note that the river discharge generated in this study will be further used for inundation modeling of the city of Jakarta.

2. Materials and Methods
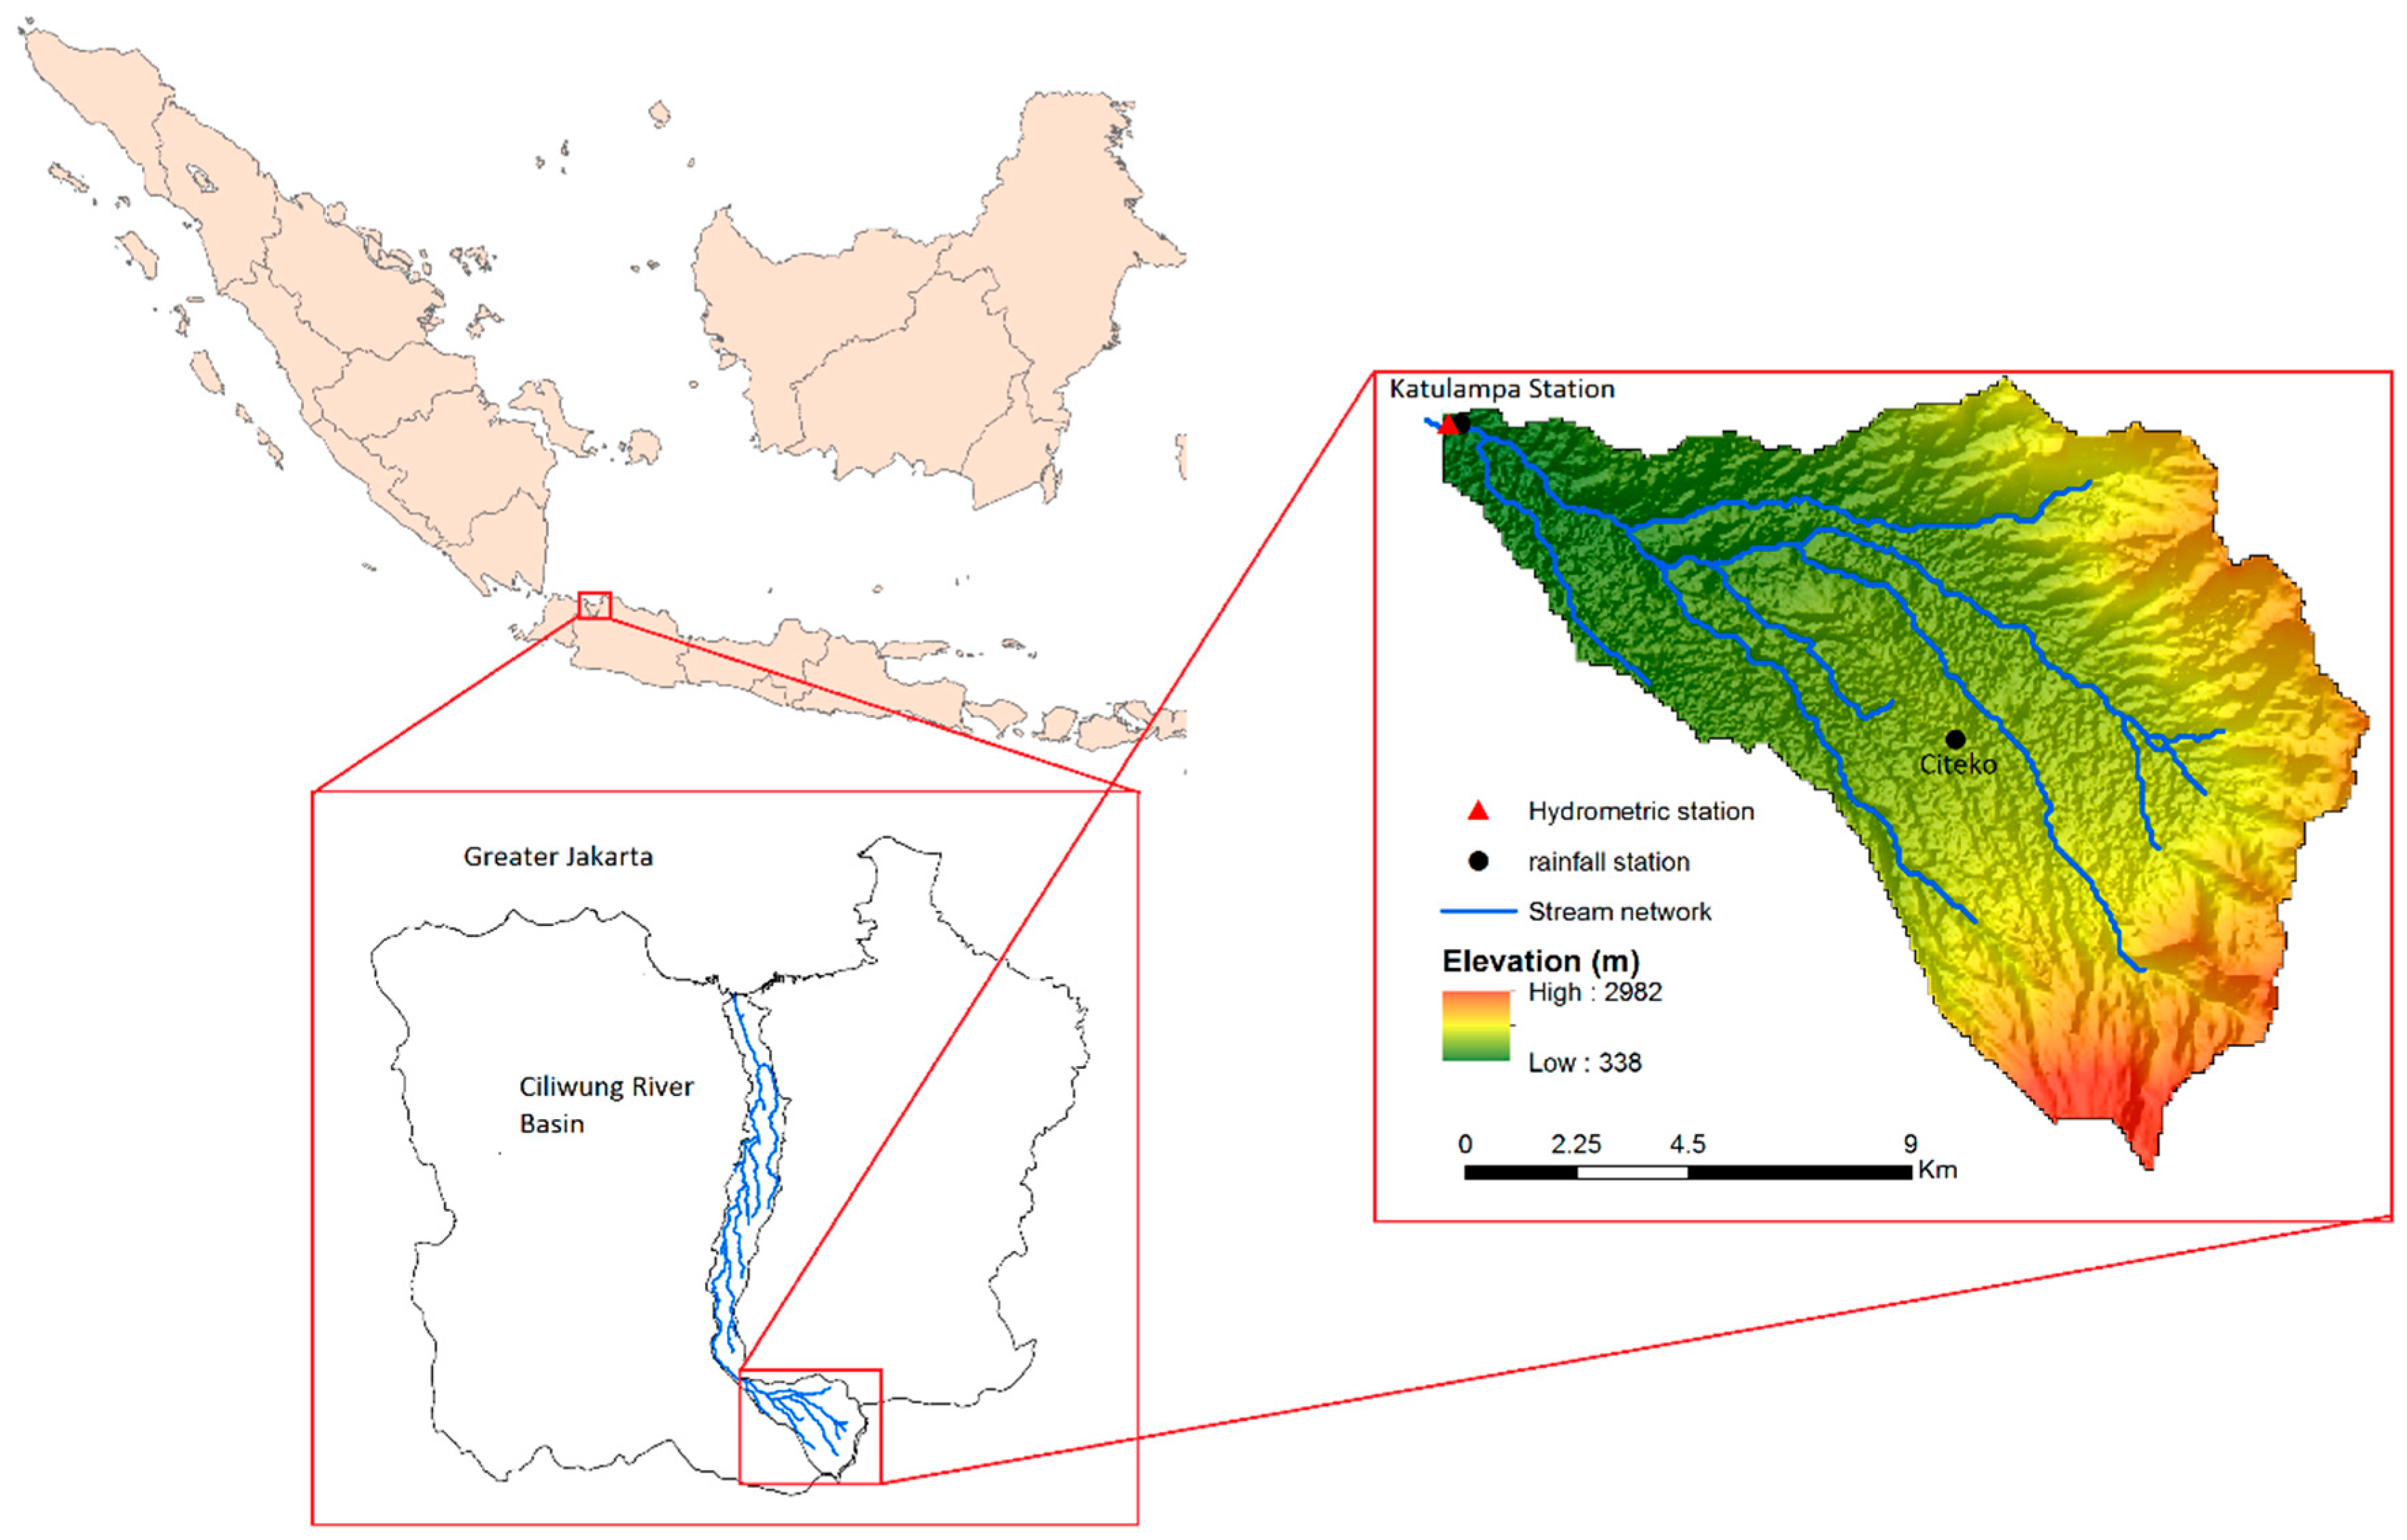
2.1. Study Area

The study area is located upstream of the Ciliwung River basin. The Ciliwung River is the main river flowing across Jakarta and has a drainage area of approximately 420 km2. The city of Jakarta is located downstream from this basin. Any hydrological changes upstream of the Ciliwung River basin may have pernicious effects on flood inundation in the lowlands of Jakarta.
The watershed upstream of the Ciliwung River is the Bogor watershed, which has an area of 230 km2 and an altitude ranging from 338 m to 2982 m. The mean annual rainfall is approximately 2683 mm, and the mean annual temperature is approximately 29 °C. The land-use types are forests, agriculture (e.g., paddy fields), urban areas and water. The soil types in the Bogor watershed are Humic Andosols, Ochric Andosols and Arthic Acrisols. There are two rain gauge stations located in the basin (Katulampa and Citeko) and one hydrometric station (Katulampa) located at the outlet of the basin. Figure 1 shows the Ciliwung River basin, the Bogor watershed, the elevation, meteorological and hydrometric stations, and stream networks.

2.2. Data

To set up the model, diverse datasets were needed, such as the Digital Elevation Model (DEM), land-use, soil, river discharge and climate (e.g., rainfall) data. Land-use maps for 2009 (base-line) and 2030 (future scenario) were obtained from the Ministry of Interior Indonesia (Figure 2a,b). The soil map was extracted from the Food and Agriculture Organization (FAO) global soil map (Figure 2c). The DEM data was extracted from the Shuttle Radar Topography Mission (SRTM) with 90 m resolution. Daily rainfall data were used for flood simulation. Daily discharge data for the Katulampa flow gauging station were used for calibration and validation of the model (Table 1). The downscaled Global Circulation Model (GCM) data for future flood generation were used from the previous study by Mishra and Herath [25]. Briefly, the Meteorological Research Institute Coupled atmosphere–ocean General Circulation Model, version 3.2 (MRI-CGCM 3.2 model) with Representative Concentration Pathways (RCP) 4.5 [26] for the period 2020–2039 was used for the climate change impact assessment, due to its easy accessibility and high temporal resolution compared to other climate models. The MRI-CGCM3.2 was developed at the Meteorological Research Institute (MRI), Japan.
Because the output of GCMs is often not suitable for direct use in assessing the impact of climate change at the local scale (such as a basin) [25,27], it is necessary to first correct the GCM output. To correct the GCM data output, the quantile mapping technique was applied to minimize the biases in precipitation frequency and intensity. This method consists of two steps: (1) truncating the GCM distribution of rainfall at a threshold value which was derived from the inverse gamma cumulative distribution function (CDF) of the zero-non-exceedance probability of observational data; and (2) matching the CDF of truncated GCM data series and observation data series by taking the inverse CDF of the GCM data with observational shape and scale parameters. More details are available in Mishra and Herath [25].

2.3. Rainfall-Runoff Model

A HEC-HMS rainfall-runoff model [28] was used in this study to simulate floods and generate peak flows. HEC-HMS is a hydrological model and is capable of analyzing runoff based on hourly to daily rainfall. The model can be applied to simulate urban flooding, flood frequency, flood warning system planning, stream restoration, and reservoir flooding spillway capacity [29]. The model has been used in a variety of different geographic conditions, ranging from large river basins to small urban areas [30]. In the HMS model, the watershed was first delineated into sub-basins based on the digital elevation model, and then, physical parameters (e.g., slope, length to centroid, area) were determined for each sub-basin. There are different methods available for rainfall modeling: losses (e.g., Green and Ampt, Soil Conservation Service-Curve Number (SCS-CN), Smith and deficit and constant), transformation (e.g., SCS unit hydrograph, Clark unit hydrograph and Snyder unit hydrograph), base flow (e.g., recession and constant monthly), and channel routing (e.g., kinematic wave, Muskingum, and Muskingum-Cunge).
In this study, to set up the HMS model, the initial parameters of the HMS model were first constructed using the Watershed Modeling System (WMS) program. The watershed was delineated into five sub-basins according to DEM and stream maps. The rainfall hyetograph was obtained from measurement data at two rain gauge stations. The SCS-CN method was used for loss estimation and excess rainfall; it controls the partitioning between intercepted water, infiltration and surface runoff. The SCS-CN method uses a curve number calculated based on land-use, hydrological soil groups and antecedent soil moisture; the method uses the following equations [28]:
R e = ( R 0.2 S ) 2 ( R + 0.8 S ) ,
where Re is accumulated rainfall excess, R is accumulated rainfall depth, and S is potential maximum retention, which is determined using the following equation:
S = 254 ( 100 C N 1 ) ,
where CN is the SCS curve number and ranges from 0 to 100.
The SCS unit hydrograph, which controls the stream surface runoff concentration time, was used as the direct runoff transformation method. The transformation method attempts to build a suitable hydrograph using watershed characteristics [29]. The lag time (in min) is required for the SCS unit hydrograph method and was calculated using the watershed length, CN value and watershed slope (see Equation (3)) [31]. The lag time is the time between the occurrence of rainfall and the excess peak flow at the point of analysis.
L T = L 0.8   ×   ( 1000 C N 10 ) + 1 ) 0.7 1900 Y ,
where LT is lag time, L is watershed length, CN is curve number, and Y is watershed slope in percent.
Finally, the Muskingum-Cunge method was used as the routing method. The Muskingum-Cunge method required data describing the length of the channel, slope, channel manning coefficient, bottom width and side slope.

2.4. Model Calibration and Validation

The HEC-HMS model was calibrated using observed data (e.g., river discharge) to improve the predictability of the model [18], which resulted in greater confidence in the reliability of the model [32]. In this research, the HMS model was first calibrated based on datasets describing a storm event in February 2007 and then validated using datasets of an event in January 1996. A series of model parameter sets were estimated using the HMS model’s optimization tools. We used different objective functions to calibrate the HMS model. The objective functions search for the parameters that yield the best value for an index.

2.5. Model Performance Criteria

Generally, the accuracy of a calibrated and validated model must be evaluated prior to model application [33]. To evaluate the accuracy of the model, we used the Nash–Sutcliffe efficiency (NSE) [34] and the coefficient of determination (R2) because they are widely used in hydrological modeling.
The NSE varies between negative infinity and 1, and R2 ranges from 0 to 1.

3. Results and Discussion

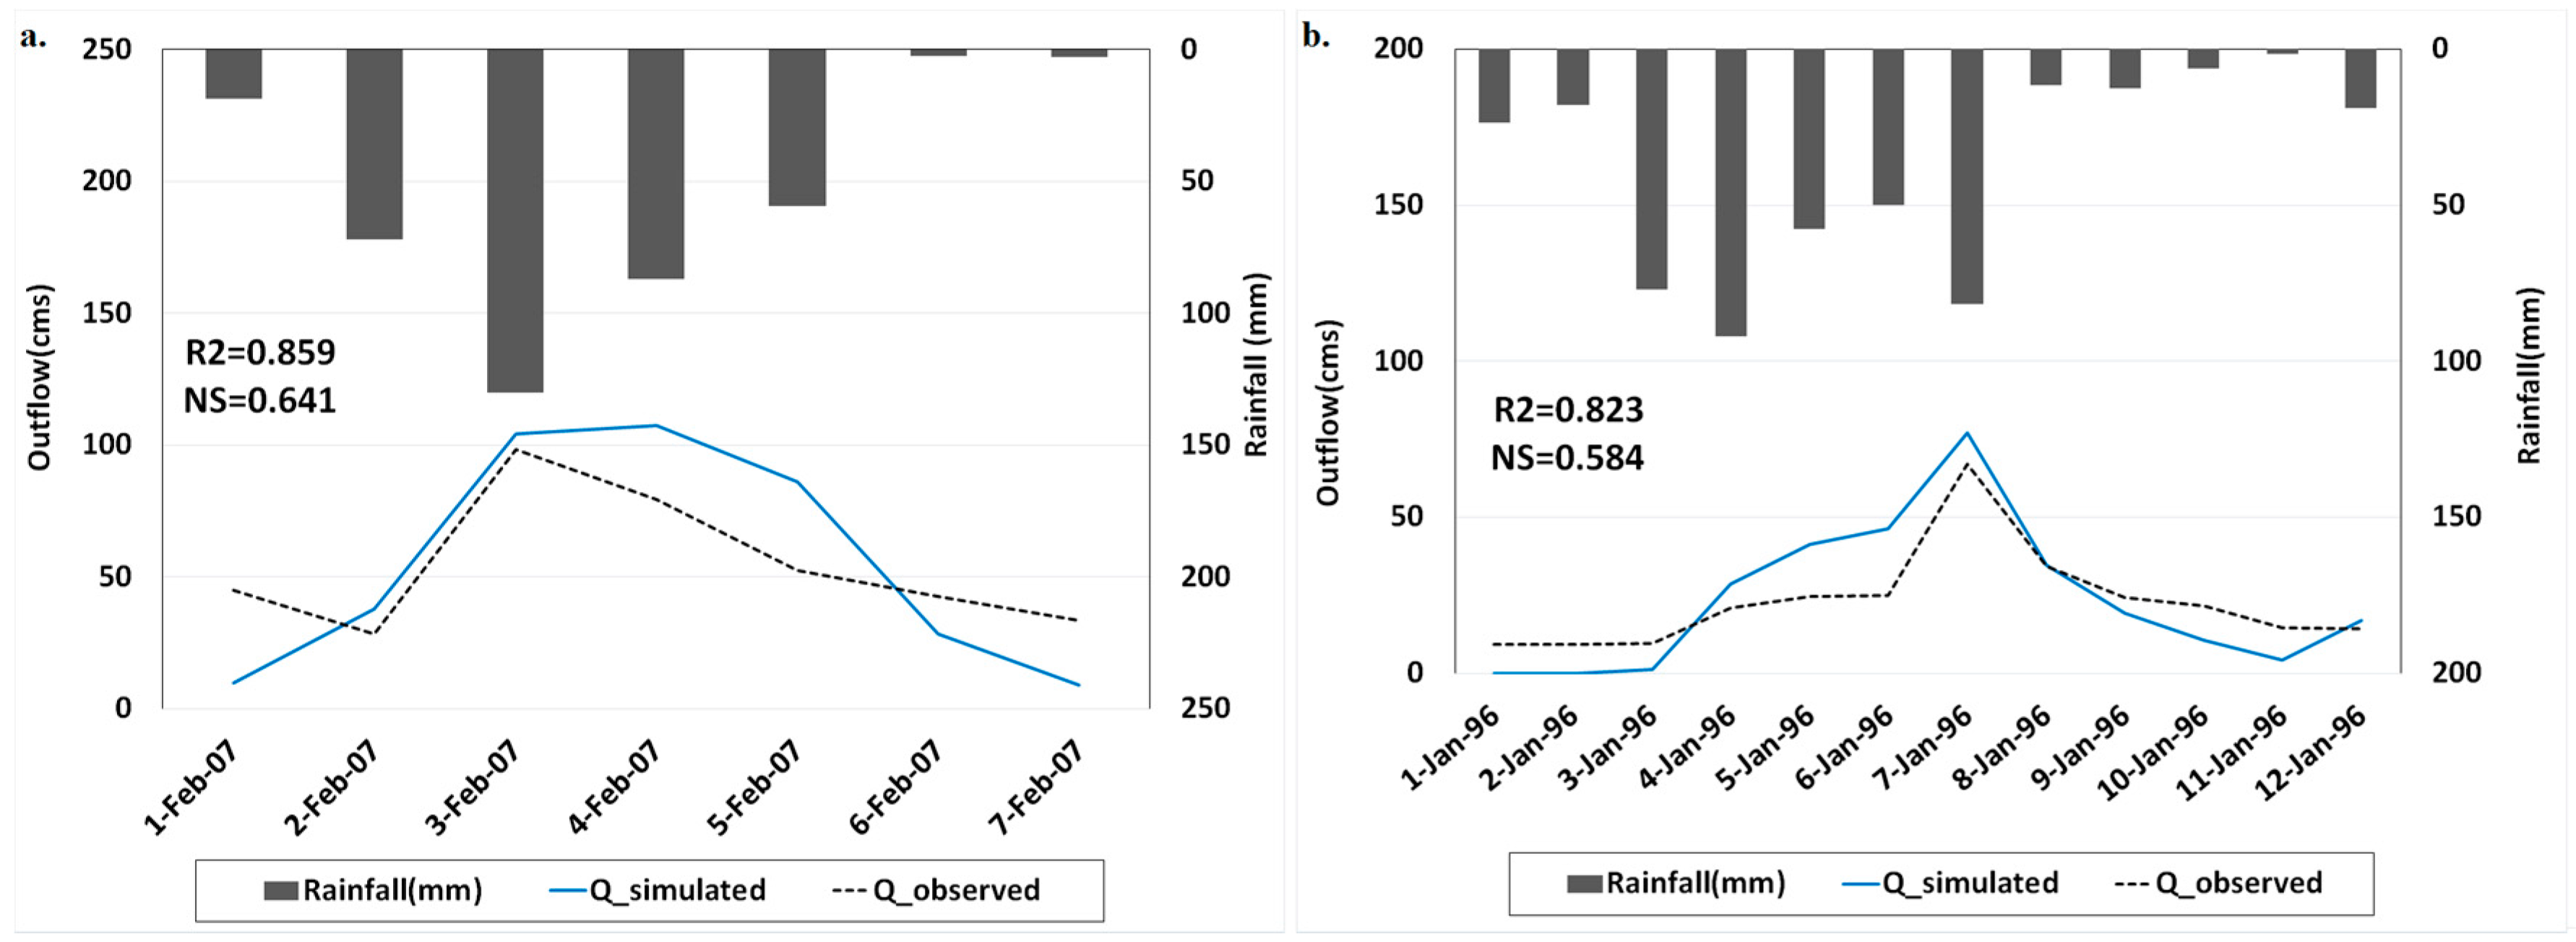
3.1. HMS Calibration and Validation

The HMS model was calibrated based on the river discharge at the Katulampa station for 10 days, between 1 February 2007 and 9 February 2007. The calibration process was performed by adjusting the CN and lag time for overland and N for streams. Therefore, the total number of adjusted parameters was 13. Table 2 shows the parameters and their bounds. The lag time is defined as the time from the center of mass of excess rainfall to the peak of the hydrograph [35].
We tested different objective functions, namely, Nash–Sutcliffe (NS), peak-weighted root mean square error (PWRMSE), and percent error in peak (PEP). We found that PEP performed best in terms of parameter optimization with NS and R2 at 0.86 and 0.64, respectively; therefore, this objective function was selected for further simulations. This function considers the peak flow criterion and that is probably the reason of high performance of this objective function. Moreover, the sensitivity analysis revealed that CN is the most sensitive parameter. This result is comparable to that found by Kamali et al. [36] and Asadi [37]. The calibrated model was further validated using data describing a flood event that took place in January 1996 (between 1 January and 12 January 1996). Figure 3 shows the results of the calibration and validation for storm events in February 2007 and January 1996, respectively. As shown in the results, the NS values were 0.64 and 0.58 and the R2 values were 0.85 and 0.82 for the calibration and validation periods, respectively. Moriasi et al. [38] stated that NS and R2 values greater than 0.5 indicate high model performance.

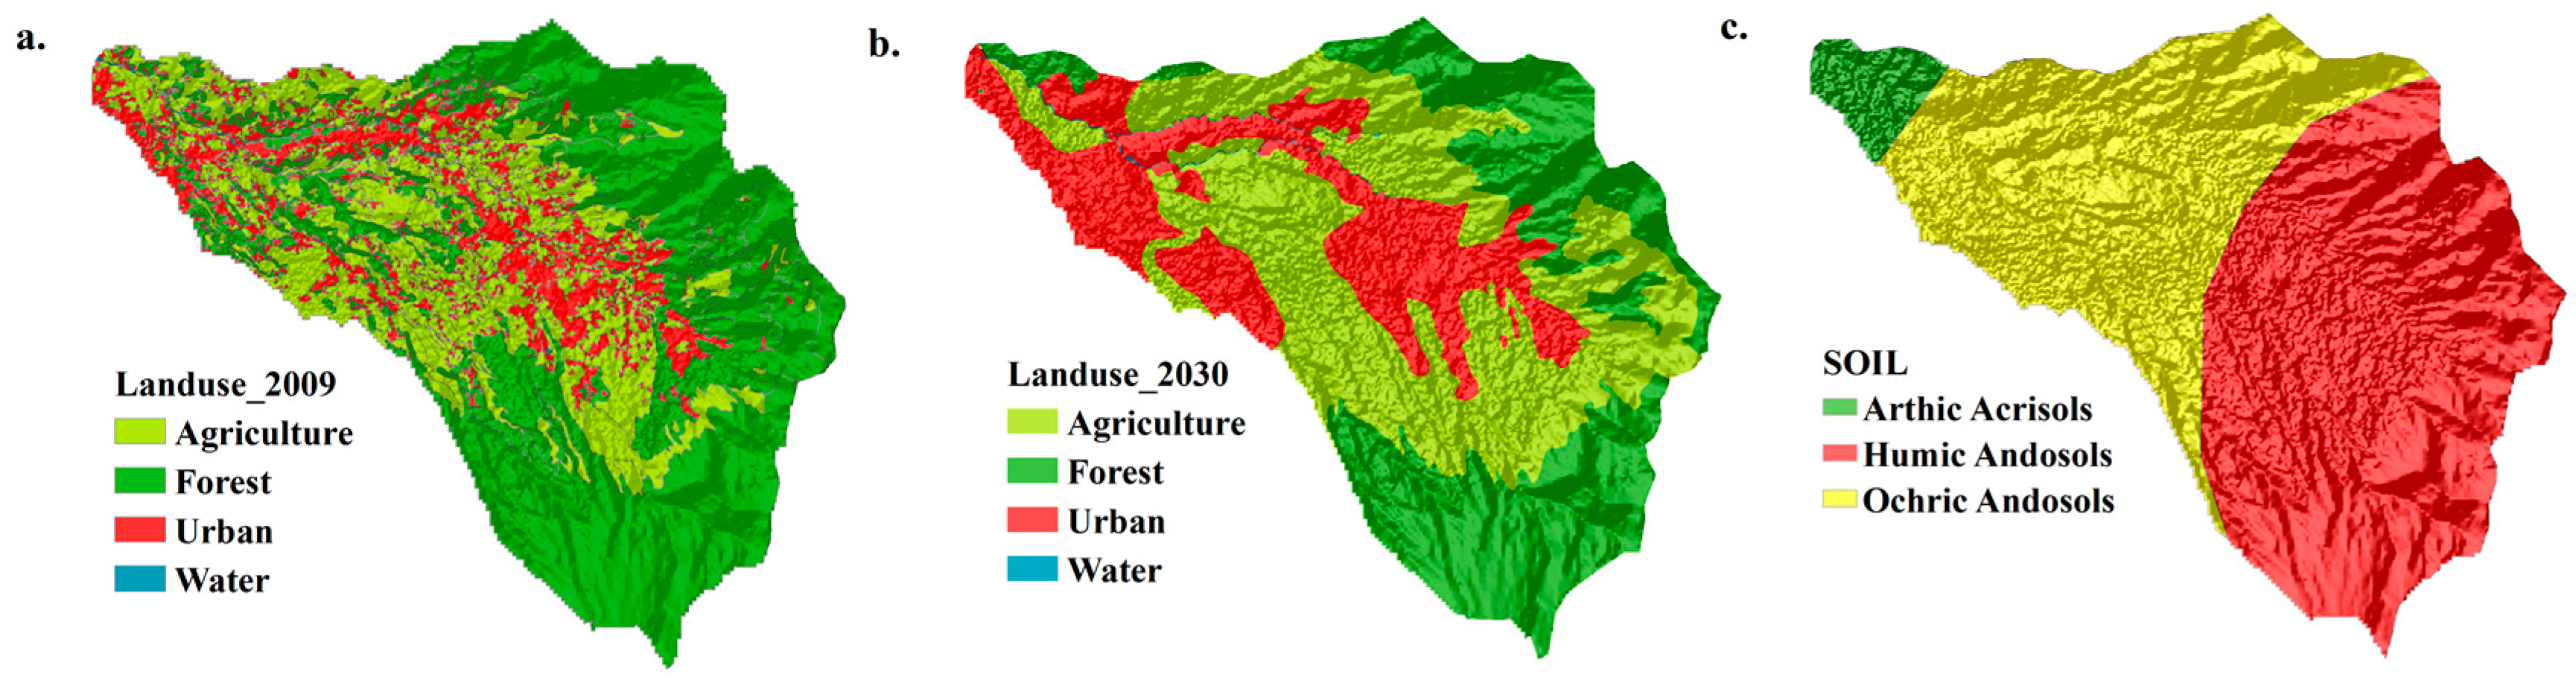
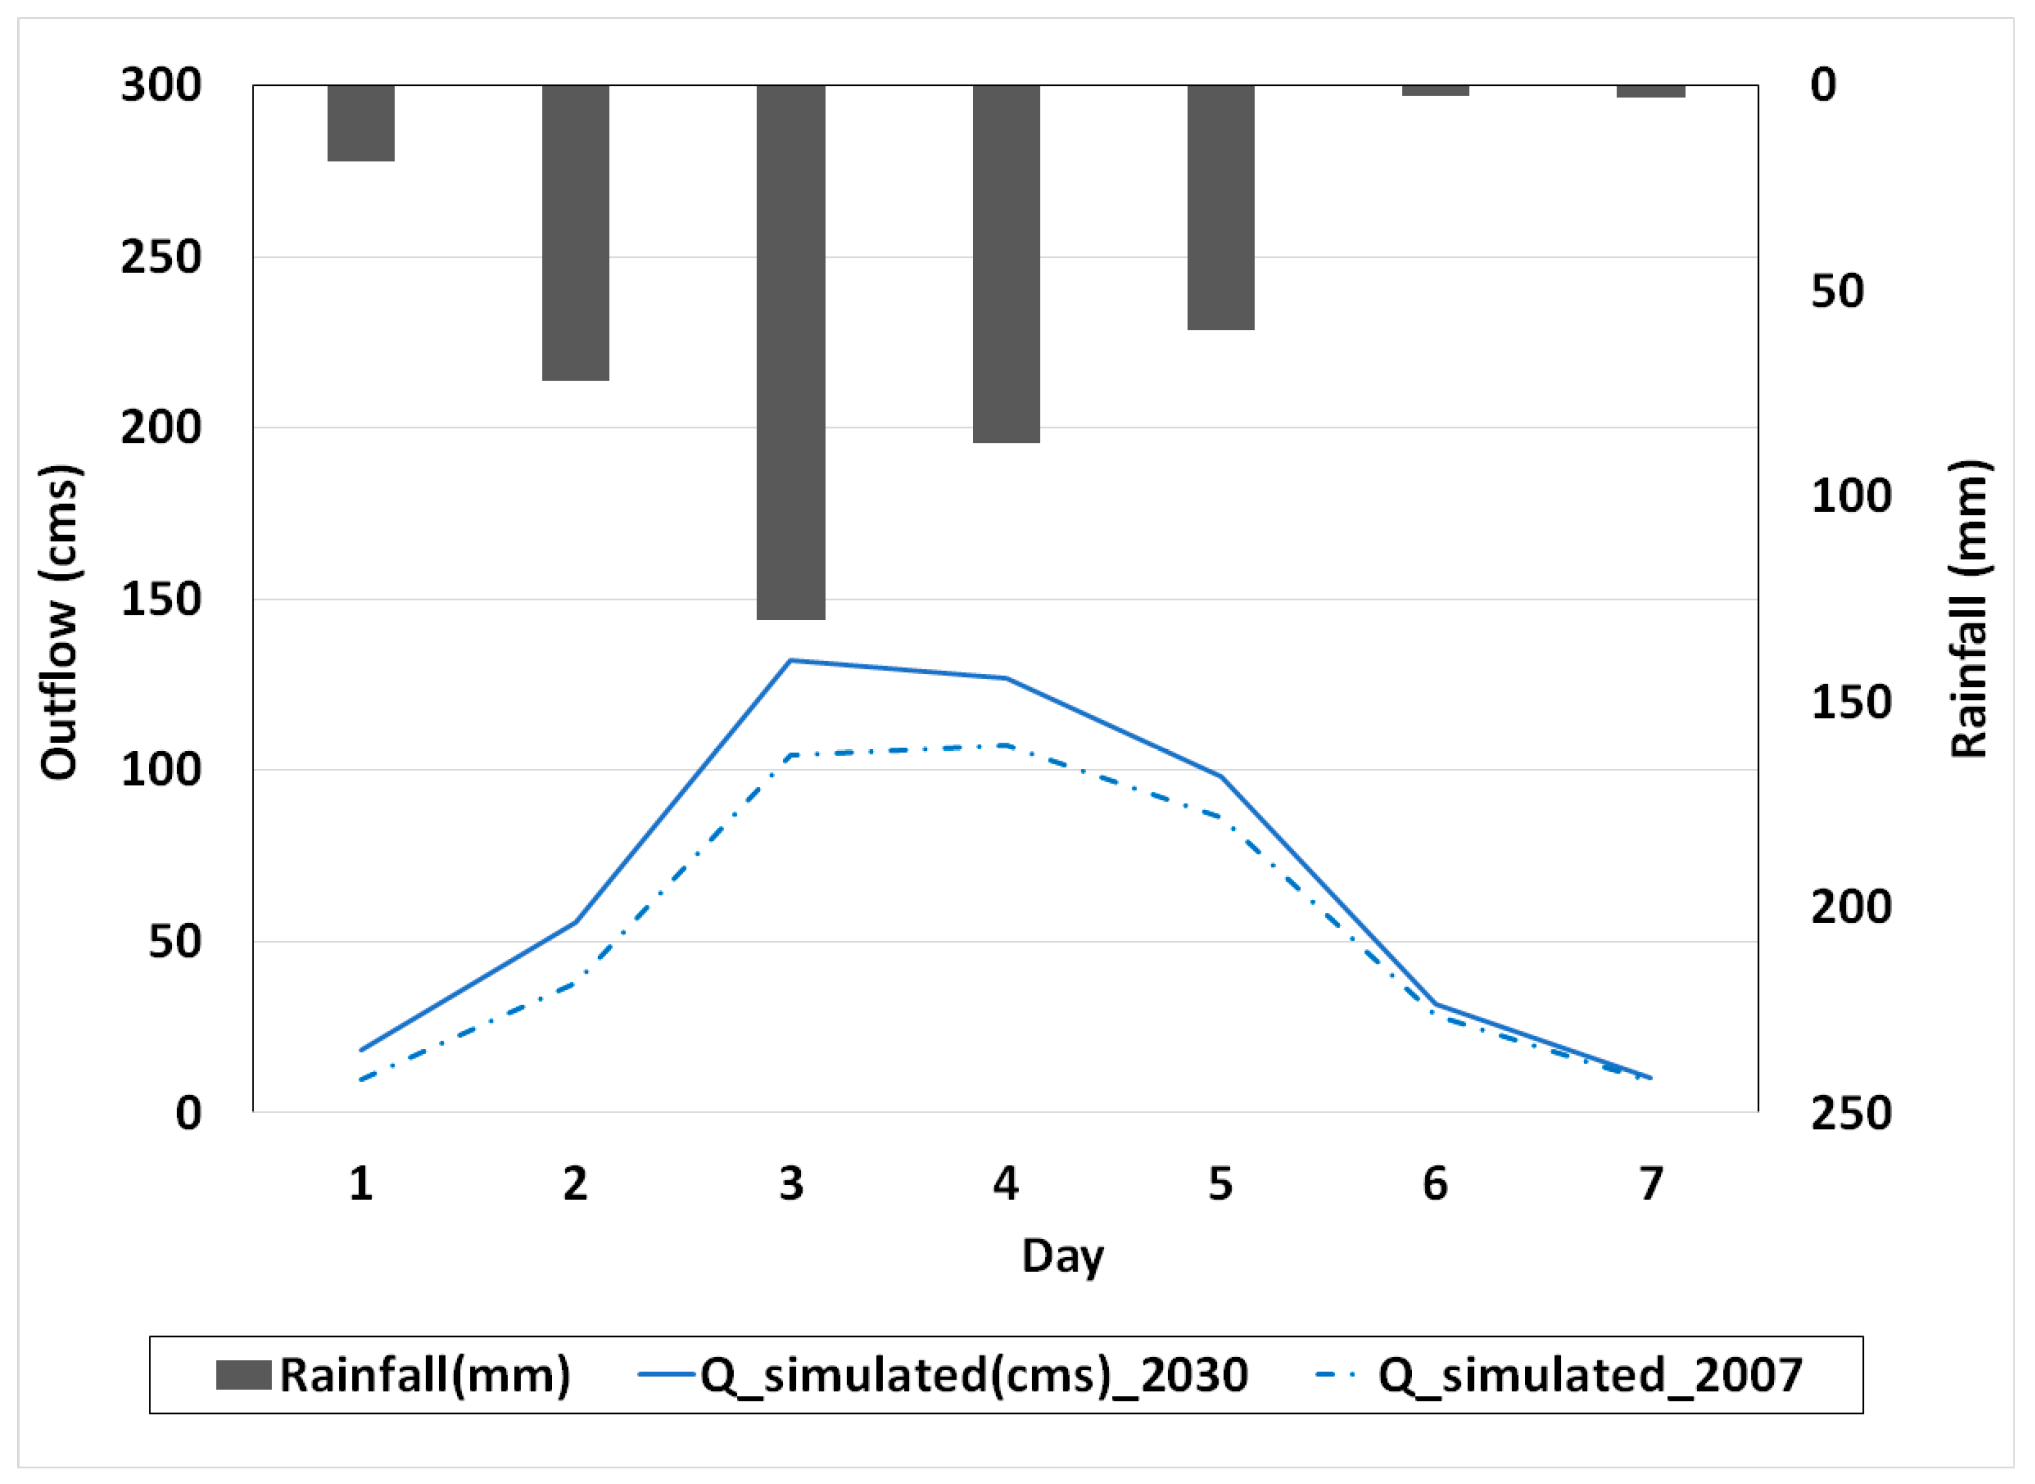
3.2. The Effects of Land-Use Changes on Discharge and Peak Flow

After calibrating and validating the model and estimating its performance, the effects of land-use changes on discharge and peak flow were simulated. The projected land-use in 2030 was selected for this purpose. The simulated result of discharge and peak flow using land-use in 2030 indicated that daily peak flow will increase by approximately 20% in 2030 compared to 2007 (Figure 4). It is important to note that we assumed the amount of rainfall to be equal to that of the calibration period for the comparison of the results of projected current land-use using the same rainfall events. Based on the projected land-use in 2030, forest area will decrease while the urban land will likely increase (Table 3). Rising urbanization would lead to an increase in the extent of impervious lands, resulting in more severe flood events. These results are comparable with those from Im et al. [39] in the Polecat Creek watershed in Caroline County, Virginia, and Hejazi and Markus [40] in Northeastern Illinois. The increase in flood peaks due to urban expansion is also discussed by Du et al. [11], wherein they revealed that impervious land in the Qinhuai River basin, China, will increase from 3% to 31% by 2018, resulting in an increase in daily peak discharge of approximately 14%.

3.3. Generation of Outflow

The calibrated model was used to estimate the river discharge for future heavy rain events based on projected land-use and climate data. Outflow at the outlet of the basin, Katulampa, was calculated based on the precipitation corresponding to the 50-year return period. Fifty-year storm return periods were calculated based on three-day accumulated rainfall of the period 1980–2010. Figure 5 shows the results of the 50-year storm return period based on historical and future rainfall data. As shown in the figure, the 3-day accumulated precipitations corresponding to the 50-year return period were calculated to be approximately 464 mm and 678 mm for the historical and future periods, respectively. Finally, the estimated precipitation values were fed into the calibrated HMS model to generate the peak flow at the outlet of the watershed.
Figure 6 shows the simulated discharge for the 50-year storm return periods for both the historical and future scenarios. The peak flows were 238 m3·s−1 and 550 m3·s−1 for the current and future scenarios, respectively, with an increase of 130% in 2030.

4. Summary and Conclusions

This research has attempted to use a hydrological model in conjunction with projected climate and land-use data to evaluate the effect of urbanization on the discharge and peak flow of the Bogor area, which is located upstream of the Ciliwung River, Indonesia. The HEC-HMS model, which is a semi distributed as well as a lumped hydrological model, was calibrated and validated using observed river discharge data from January 1996 and February 2007. The results showed that the daily peak flow and flood volumes will rise along with urbanization due to increases in impervious areas. Comparison of the simulated peak flows based on 50-year return periods for the historical and projected future climate data (CGCM3.2-RCP 4.5) revealed an increase in peak flow of up to 130% by the year 2030. This estimated peak flow and the relevance of flood volume should be considered when designing flood control systems in the region and optimizing the current flood management systems. Overall, land-use changes upstream of the basin altered hydrological behavior and may result in flooding downstream, where the city of Jakarta is located. Deforestation and urbanization are the main causes of rising flooding volume and peak flow in this watershed. Therefore, it is important to protect the forest in this area. Various studies have been done in the Ciliwung River Basin in terms of land-use and land-cover changes and flooding behaviors. However, they evaluated the whole basin, while we just focused on the upper part of the Ciliwung basin. Generally, the previous studies in the Ciliwung River Basin showed decreases of green area [4], rising urbanization [23] and increasing river discharge [18], surface runoff [41], and flooding events [23] in the Ciliwung river basin, and particularly in downstream areas, which are comparable with our results in the Bogor watershed, in the upper Ciliwung basin. As a whole, the previous studies of land-use changes in the Ciliwung basin are based on the historical landuse changes data, while we evaluated the land-use changes based on the Master Plan of Jakarta for future in the upper river basin.
One of the limitations of this study is to use the FAO map which is rather coarse. Therefore, it is suggested to use a regional soil map for further studies.
Finally, it is worth noting that the results of this study (discharge generations) will be used as input data for the further study of flood inundation modeling in the city of Jakarta.

Acknowledgments

The authors wish to thank the Ministry of the Environment, Government of Japan for their support to the Water and Urban Initiative Project of United Nations University—Institute for the Advanced Study of Sustainability. The work and opinions presented here are those of the authors and do not necessarily represent the official views of the organizations mentioned above.

Author Contributions

All authors designed the research. Ammar Rafiei Emam and Binaya Kumar Mishra were responsible for the simulations and analyses of the results. Ammar Rafiei Emam wrote the manuscript. All authors revised the manuscript.

Conflicts of Interest

The authors declare no conflict of interest.

References

  1. Ng, S. Governance beyond the government: Responding to a reactionary flood governance regime in Ayutthaya, Thailand. Habitat Int. 2016, 52, 11–19. [Google Scholar] [CrossRef]
  2. Guan, M.; Sillanpää, N.; Koivusalo, H. Modelling and assessment of hydrological changes in a developing 674 urban catchment. Hydrol. Process. 2015, 29, 2880–2894. [Google Scholar] [CrossRef]
  3. Sagala, S.; Lassa, J.; Yasaditama, H.; Hudalah, D. The Evolution of Risk and Vulnerability in Greater Jakarta: Contesting Government Policy in Dealing with a Megacity’s Exposure to Flooding. Available online: http://www.irgsc.org/pubs/wp/wp02.html (accessed on 21 November 2016).
  4. Ali, M.; Hadi, S.; Sulistyantara, B. Study on land cover change of Ciliwung downstream watershed with spatial dynamic approach. Procedia-Soc. Behav. Sci. 2016, 227, 52–59. [Google Scholar] [CrossRef]
  5. Hollis, G.E. The effect of urbanization on floods of different recurrence interval. Water Resour. Res. 1975, 11, 431–435. [Google Scholar] [CrossRef]
  6. Arnold, C.L.; Gibbons, C.J. Impervious surface coverage: The emergence of a key environmental indicator. J. Am. Plan. Assoc. 1996, 62, 243–258. [Google Scholar] [CrossRef]
  7. Smith, J.A.; Baeck, M.L.; Meierdiercks, K.L.; Nelson, P.A.; Miller, A.J.; Holland, E.J. Field studies of the storm event hydrologic response in an urbanizing watershed. Water Resour. Res. 2005, 41, W10413. [Google Scholar] [CrossRef]
  8. Dougherty, M.; Dymond, R.L.; Grizzard, T.J., Jr.; Godrej, A.N.; Zipper, C.E.; Randolph, J. Quantifying long term hydrologic response in an urbanizing basin. J. Hydrol. Eng. 2006, 12, 33–41. [Google Scholar] [CrossRef]
  9. Ogden, F.L.; Pradhan, N.R.; Downer, C.W.; Zahner, J.A. Relative importance of impervious area, drainage density, width function, and subsurface storm drainage on flood runoff from an urbanized catchment. Water Resour. Res. 2011, 47, W12503. [Google Scholar] [CrossRef]
  10. The Intergovernmental Panel on Climate Change (IPCC). Climate Change 2007: The Scientific Basis. Contribution of Working Group I to the Fourth Assessment Report of the Intergovernmental Panel on Climate Change; Cambridge University Press: Cambridge, UK, 2007. [Google Scholar]
  11. Du, J.; Qian, L.; Rui, H.; Zuo, T.; Zheng, D.; Xu, Y.; Xu, C.-Y. Assessing the effects of urbanization on annual runoff and flood events using an integrated hydrological modeling system for Qinhuai River basin, China. J. Hydrol. 2012, 464–465, 127–139. [Google Scholar] [CrossRef]
  12. Li, Y.K.; Wang, C.Z. Impacts of urbanization on surface runoff of the Dardenne Creek watershed, ST. Charles county, Missouri. Phys. Geogr. 2009, 30, 556–573. [Google Scholar] [CrossRef]
  13. Emam, A.R.; Kappas, M.; Hosseini, S.Z. Assessing the impact of climate change on water resources, crop production and land degradation in a semi-arid river basin. Hydrol. Res. 2015, 46, 854–870. [Google Scholar] [CrossRef]
  14. Im, S.J.; Kim, H.; Kim, C.; Jang, C. Assessing the impacts of land use changes on watershed hydrology using MIKE SHE. Environ. Geol. 2009, 57, 231–239. [Google Scholar] [CrossRef]
  15. The Intergovernmental Panel on Climate Change (IPCC). Climate Change 2013: The Physical Science Basis Exit EPA Disclaimer. Contribution of Working Group I to the Fifth Assessment Report of the Intergovernmental Panel on Climate Change; Stocker, T.F., Qin, D., Plattner, G.-K., Tignor, M., Allen, S.K., Boschung, J., Nauels, A., Xia, Y., Bex, V., Midgley, P.M., Eds.; Cambridge University Press: Cambridge, UK, 2013. [Google Scholar]
  16. Mahmood, R.; Jia, S.; Babel, M.S. Potential Impacts of Climate Change on Water Resources in the Kunhar River Basin, Pakistan. Water 2016, 8, 23. [Google Scholar] [CrossRef]
  17. Shrestha, M.; Koike, T.; Hirabayashi, Y.; Xue, Y.; Wang, L.; Rasul, G.; Ahmad, B. Integrated simulation of snow and glacier melt in water and energy balance-based, distributed hydrological modeling framework at Hunza River Basin of Pakistan Karakoram region. J. Geophys. Res. Atmos. 2015, 120, 4889–4949. [Google Scholar] [CrossRef]
  18. Poerbandono; Julian, M.M.; Ward, P.J. Assessment of the effects of climate and land cover changes on river discharge and sediment yield, and an adaptive spatial planning in the Jakarta region. Nat. Hazards 2014, 73, 507–530. [Google Scholar] [CrossRef]
  19. Halwatura, D.; Najim, M.M.M. Application of the HEC-HMS model for runoff simulation in a tropical catchment. Environ. Model. Softw. 2013, 46, 155–162. [Google Scholar] [CrossRef]
  20. Muis, S.; Güneral, B.; Jongman, B.; Aerts, J.C.J.H.; Ward, P.J. Flood risk and adaptation strategies under climate change and urban expansion: A probabilistic analysis using global data. Sci. Total Environ. 2015, 538, 445–457. [Google Scholar] [CrossRef] [PubMed]
  21. Meng, F.; Su, F.; Yang, D.; Tong, K.; Hao, Z. Impacts of recent climate change on the hydrology in the source region of the Yellow River basin. J. Hydrol. Reg. Stud. 2016, 6, 66–81. [Google Scholar] [CrossRef]
  22. Ranger, N.; Hallegatte, S.; Bhattacharya, S.; Bachu, M.; Priya, S.; Dhore, K.; Rafique, F.; Mathur, P.; Naville, N.; Henriet, F.; et al. An assessment of the potential impact of climate change on flood risk in Mumbai. Clim. Chang. 2011, 104, 139–167. [Google Scholar] [CrossRef] [Green Version]
  23. Remondi, F.; Burlando, P.; Vollmer, D. Exploring the hydrological impact of increasing urbanization on a tropical river catchment of the metropolitan Jakarta, Indonesia. Sustain. Cities Soc. 2016, 20, 210–221. [Google Scholar] [CrossRef]
  24. Center for Region Cimanuk-Cisanggarung River Basin (BBWSCC). Water Resources Management Pattern Ciliwung-Cisadane; Ministry of Public Works and Public Housing of Indonesia: Jakarta, Indonesia, 2012. [Google Scholar]
  25. Mishra, B.; Herath, S. Assessment of Future Floods in the Bagmati River Basin of Nepal Using Bias-Corrected Daily GCM Precipitation Data. J. Hydrol. Eng. 2015, 20, 05014027. [Google Scholar] [CrossRef]
  26. The Intergovernmental Panel on Climate Change (IPCC). Climate Change 2014: Synthesis Report. Contribution of Working Groups I, II and III to the Fifth Assessment Report of the Intergovernmental Panel on Climate Change; IPCC: Geneva, Switzerland, 2014. [Google Scholar]
  27. Mishra, B.; Herath, S. Climate projections downscaling and impact assessment on precipitation over upper Bagmati River Basin, Nepal. In Proceedings of the Third International Conference on Addressing Climate Change for Sustainable Development through Up-Scaling Renewable Energy Technologies, Kathmandu, Nepal, 12–14 October 2011; Institute of Engineering, Tribhuvan University: Kathmandu, Nepal, 2011; pp. 275–281. [Google Scholar]
  28. Feldman, A.D. Hydrologic Modeling System HEC-HMS, Technical Reference Manual; U.S. Army Corps of Engineers, Hydrologic Engineering Center (HEC): Davis, CA, USA, 2011. [Google Scholar]
  29. U.S. Army Corps of Engineers. Hydrologic Modeling System (HEC-HMS) Application Guide: Version 3.1.0; Institute for Water Resources, Hydrologic Engineering Center: Davis, CA, USA, 2008. [Google Scholar]
  30. Gumindoga, W.; Rwasoka, D.T.; Nhapi, I.; Dube, T. Ungauged runoff simulation in Upper Manyame Catchment, Zimbabwe: Applications of the HEC-HMS model. Phys. Chem. Earth 2016. [Google Scholar] [CrossRef]
  31. Singh, V.P. Elementary Hydrology; Prentice Hall of India: New Delhi, India, 1994. [Google Scholar]
  32. Muthukrishnan, S.; Harbor, J.; Lim, K.J.; Bernard, A.E. Calibration of a simple rainfall-runoff model for long-term hydrological impact evaluation. Urban Reg. Inf. Syst. Assoc. (URISA) J. 2006, 18, 35–42. [Google Scholar]
  33. Zhu, Z.; Chen, Z.; Chen, X.; He, P. Approach for evaluating inundation risks in urban drainage systems. Sci. Total Environ. 2016, 553, 1–12. [Google Scholar] [CrossRef] [PubMed]
  34. Nash, J.E.; Sutcliffe, J.V. River flow forecasting through conceptual models, part I: A discussion of principles. J. Hydrol. 1970, 10, 282–290. [Google Scholar] [CrossRef]
  35. U.S. Army Corps of Engineers. Hydrologic Modeling System (HEC-HMS) Technical Reference Manual; Institute for Water Resources, Hydrologic Engineering Center: Davis, CA, USA, 2000. [Google Scholar]
  36. Kamali, B.; Mousavi, S.J.; Abbaspour, K.C. Automatic calibration of HEC-HMS using single-objective and multi-objective PSO algorithms. Hydrol. Process. 2013, 27, 4028–4042. [Google Scholar] [CrossRef]
  37. Asadi, A. The Comparison of Lumped and Distributed Models for Estimating Flood Hydrograph (Study Area: Kabkian Basin) BY HMS. J. Electron. Commun. Eng. Res. 2013, 1, 7–13. [Google Scholar]
  38. Moriasi, D.N.; Arnold, J.G.; Liew, M.W.; Binger, R.L.; Harmel, R.D.; Veith, T.L. Model evaluation guidelines for systematic quantification of accuracy in watershed simulations. Trans. ASABE 2007, 50, 885–900. [Google Scholar] [CrossRef]
  39. Im, S.; Brannan, K.M.; Mostaghimi, S. Simulating hydrologic and water quality impacts in an urbanizing watershed. J. Am. Water Resour. Assoc. 2003, 39, 1465–1479. [Google Scholar] [CrossRef]
  40. Hejazi, M.I.; Markus, M. Impacts of urbanization and climate variability on floods in Northeastern Illinois. J. Hydrol. Eng. 2009, 14, 606–616. [Google Scholar] [CrossRef]
  41. Harto, A.B.; Kondoh, A.; Sakura, Y. The effect of land use changes on the water balance in the Ciliwung-Cisadane catchment, West java, Indonesia. In Proceedings of the International Symposium on Hydrology Water Resources and Management in Southeast Asia and the Pacific, Taegu, Korea, 10–13 November 1998.
Figure 1. The locations of the study area: the Ciliwung Basin and Bogor Basin. Hydrometric and climatological stations and hypsometric classes are also shown.
Water 08 00559 g001
Figure 2. Land-use and soil maps of the Bogor watershed, including: (a) land-use in 2009; (b) land-use in 2030; and (c) the soil map.
Water 08 00559 g002
Figure 3. Results of the (a) calibration, and (b) validation of river discharge/peak flow by the HEC-HMS model.
Water 08 00559 g003
Figure 4. The influence of land-use changes on outflow at the Katulampa station with the same rainfall intensity during 2007 and 2030.
Water 08 00559 g004
Figure 5. The calculation of the 50-year storm return period based on 3-day accumulated data for the (a) current; and (b) future projection.
Water 08 00559 g005
Figure 6. The river discharge/peak flow generation by HEC-HMS based on the 50-year return period for the (a) current scenario and (b) future scenario.
Water 08 00559 g006
Table 1. The necessity numerical input data to set up and calibrate the Hydrologic Modeling System (HEC-HMS).
NumberDataPeriod
1River discharge1–7 February 2007, 1–12 January 1996
2Rainfall1–7 February 2007, 1–12 January 1996
Table 2. Parameter optimizations in the HMS model.
ParametersSub-Basin/ReachLower BoundUpper Bound
CN5-sub-basins3570
Lag time (min)5-sub-basins50350
N-stream3-streams0.010.06
Notes: CN: Curve Number; N: Manning’s roughness coefficients.
Table 3. Land-use changes between 2009 and 2030 in the Bogor Basin, upstream of the Ciliwung Basin.
ClassLU-2009 (km2)LU-2030 (km2)Change %
Urban21.3731.7648.6
Agriculture35.7160.4469.3
Forest80.0744.95−43.9
Water0.480.480.0

