
A Comparative Review of Alternative Fuels for the Maritime Sector: Economic, Technology, and Policy Challenges for Clean Energy Implementation


Centre for Marine Sustainability, Faculty of Creative Industries, Architecture and Engineering, Solent University, East Park Terrace, Southampton SO14 0YN, UK
*
Author to whom correspondence should be addressed.
World 2021, 2(4), 456-481; https://doi.org/10.3390/world2040029
Submission received: 5 June 2021
/
Revised: 1 October 2021
/
Accepted: 11 October 2021
/
Published: 21 October 2021
Abstract
:Global maritime transportation is responsible for around 3% of total anthropogenic greenhouse gas emissions and significant proportions of SOx, NOx, and PM emissions. Considering the predicted growth in shipping volumes to 2050, greenhouse gas emissions from ships must be cut by 75–85% per ton-mile to meet Paris Agreement goals. This study reviews the potential of a range of alternative fuels for decarbonisation in maritime. A systematic literature review and information synthesis method was applied to evaluate fuel characteristics, production pathways, utilization technologies, energy efficiency, lifecycle environmental performance, economic viability, and current applicable policies. Alternative fuels are essential to decarbonisation in international shipping. However, findings suggest there is no single route to deliver the required greenhouse gas emissions reductions. Emissions reductions vary widely depending on the production pathways of the fuel. Alternative fuels utilising a carbon-intensive production pathway will not provide decarbonisation, instead shifting emissions elsewhere in the supply chain. Ultimately, a system-wide perspective to creating an effective policy framework is required in order to promote the adoption of alternative propulsion technologies.
1. Introduction
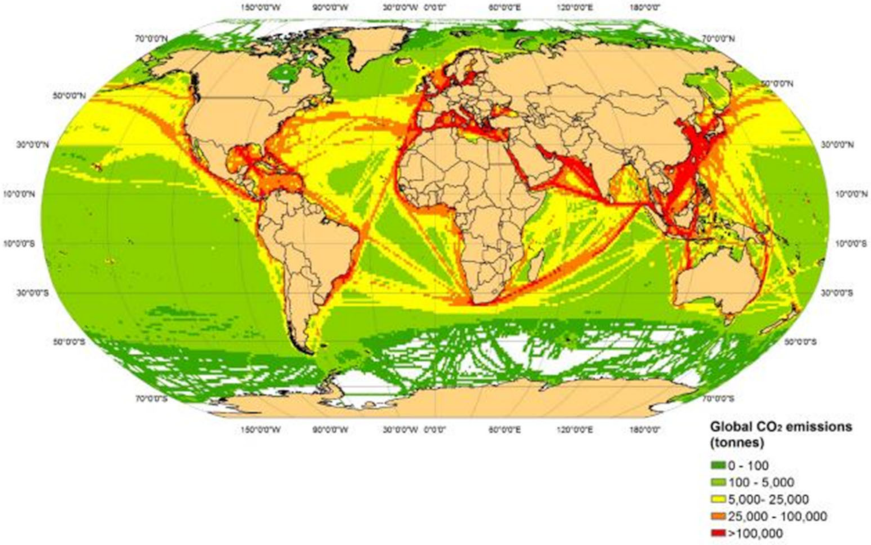
Maritime transportation plays a vital role in global economic development, representing 80–90% of international trade. Experiencing continuous growth over the past two decades, as of 2020 the global fleet, which is greater than 100 gross tons, represented 98,140 commercial vessels, with a capacity of 2.06 billion dwt, and was responsible for moving 11,076 m tons of cargo [1]. Compared to other forms of transport, ships are very efficient in terms of fuel per unit distance; however, the global maritime sector is responsible for approximately 3% of total anthropogenic greenhouse gas (GHG) emissions, emitting around 940 m tonnes of carbon dioxide (CO2) in 2012. To provide a sense of scale, this is higher than the emissions of Brazil and Germany, if the industry were considered as a country. Globally, it would be the 6th largest CO2 emitter [2]. The third International Maritime Organisation (IMO) GHG Study forecasts under a business-as-usual scenario with no further mitigation that GHG emissions from international shipping would increase between 50% and 250% by 2050. Furthermore, ships are the single largest emissions source for nitrogen oxide (NOx), sulphur oxide (SOx), and particulate matter (PM) in the transport sector and contributes significantly to emissions of carbon monoxide (CO) and hydrocarbons (HC). The average annual NOx and SOx emissions from international shipping were 20.9 m and 11.3 m tonnes for the period 2007 to 2015, respectively [3]. Importantly, these GHG and air pollution emissions are unevenly distributed, tending to be concentrated in major shipping lanes and port regions (Figure 1) [4,5,6]. Primary and secondary pollutants from shipping in these areas have been consistently linked to environmental damage and harm to human health among the exposed populations [7,8,9].
Responding to increasing environmental concerns on maritime pollution, policymakers, including those from the International Maritime Organization (IMO), European Union (EU), and United States, are tightening emission limits to curb NOx, SOx and CO2 emissions from vessels. Currently, the most influential air pollution control regulation is Annex VI of the International Convention for the Prevention of Pollution from Ships (MARPOL). Annex VI, first adopted in 1997, implements increasingly progressive restrictions to vessel emissions; and introduced emission control areas (ECAs) to further reduce those pollutants in designated sea areas. Originally focused on reduction of SOx emissions, several revisions have mandated progressive global reduction in emissions of SOx, NOx, CO2, and particulate matter, as well as the introduction of further ECAs.
The IMO currently aims to reduce ship emissions by 80% for both SOx and NOx emissions by means of these emission standards. The Annex set limits on the emissions of SOx from marine fuel oil in 2000, with progressively stricter limits being introduced since. The most recent limits set the sulphur cap in ECA zones to below 0.10% from 1 January 2015, and 0.5% in general sea areas from 2020. Furthermore, MARPOL also sets a progressive reduction of NOx emissions. Emission reduction is implemented using staged tiers: ‘Tier I’—ship constructed on or after 1st January 1990 but before 1 January 2000; ‘Tier II’—engines installed on ships constructed on or after 1st January 2011, and ‘Tier III’—ships constructed on or after 1st January 2016 and operating in the ECAs (North American Emission Control Area and the US Caribbean Sea Emission Control Area).
The focus of the IMO and much of the international maritime community is now on decarbonisation. The 2015 Paris Climate Conference (COP21) set a target to pursue efforts to limit global temperature rise to 1.5 °C. Reflecting this focus, the IMO announced during the Marine Environment Protection Committee (MEPC) in April 2018 that member state delegates had agreed on a target to cut the shipping sector’s overall CO2 output by 50% by 2050. Considering the predicted growth in shipping volumes up to 2050, GHG emissions from ships must be cut by 75–85% per ton-mile to meet the Paris Agreement goals. This transition to low carbon will be multifaceted. In the short term (to 2023), the IMO will review and strengthen the Energy Efficiency Design Index (EEDI), requiring international shipping to reduce 15% to 20% of GHG emissions against a 2010 level. In addition, a clear short-term strategy on reduction of GHG emissions from ships was announced during the 4th GHG Working Group (the ISWGGHG 4th Meeting) and MEPC 73. An operational indicator will be developed by the IMO before 2023 to guide shipowners and operators to reduce the speed of their ships and optimise the routes. In the medium (2023–2030) to long term (beyond 2030), the IMO is planning to introduce for the shipping industry both a new GHG reduction mechanism to be included among the operational indicators and also an implementation programme to encourage the use of low-carbon alternative fuels [10]. This paper presents an in-depth review of various alternative fuels which may comprise part of the transition to low carbon maritime. Fuels are considered from the perspectives of economic and environmental performance, technical feasibility, fuel availability, and the political context of their implementation. In the context of this paper we define “alternative fuel” to be any fuel and/or source of energy other than conventional fuel-oils used for the purpose of powering ships.
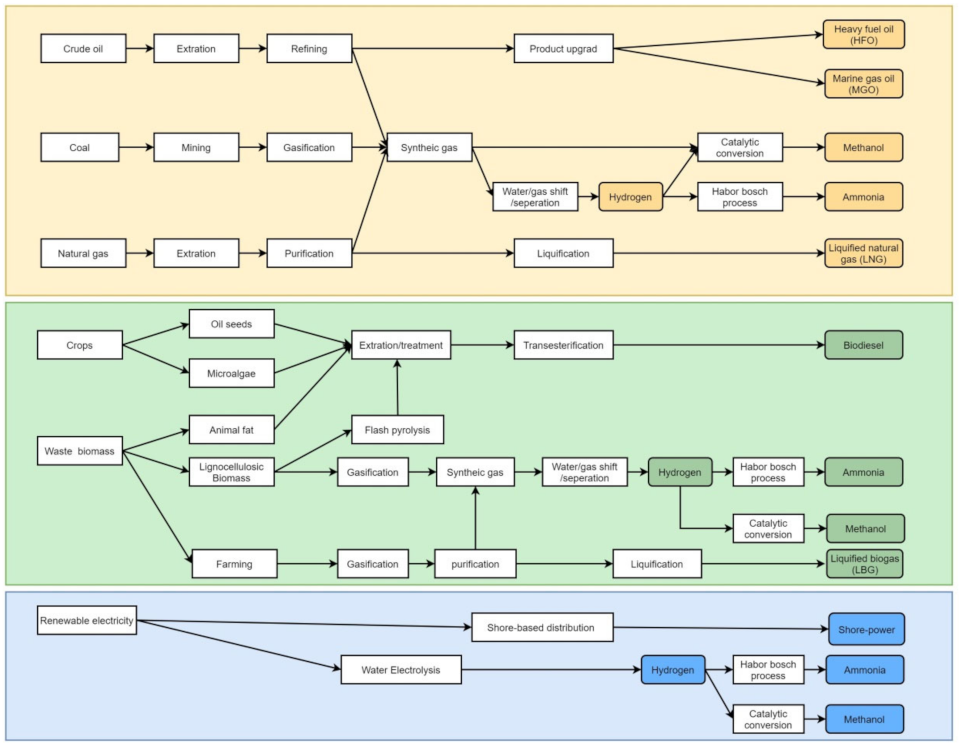
The fuels considered in this study include liquefied natural gas (LNG); liquefied biogas (LBG); biodiesel; methanol; ammonia; hydrogen; and electricity, all considered to be potentially feasible for use in the maritime sector. In the context of deep-sea shipping, renewable technologies such as wind and solar power systems are only viable for auxiliary and supplementary power and are therefore not included in this review. An overview of the potential alternative marine fuel systems is presented in Figure 2, which illustrates the production pathway of each alternative fuel, from primary energy sources/feedstocks, production methods, distribution, and bunkering pathways to its consumption onboard ship.
1.1. Methane
Liquefied Natural Gas (LNG) (over 95% methane) is one of the most frequently used marine alternative fuels for compliance with current SOx and NOx limits and to reduce CO2 emissions from ship operation. The LNG carrier industry has been utilising gas boil-off from LNG cargo for more than 40 years to reduce fuel and voyage costs. The use of LNG was limited to these niche capacities until the recent adoption of stricter emissions limits over the past decade. LNG is a colourless and non-toxic liquid, created from natural gas cooled to −162 °C. It typically comprises more than 95% methane (CH4), and less than 5% mix of other hydrocarbons (typically ethane, propane, and butanes) and nitrogen [11].
Methane can be obtained from both fossil-based sources and biomass. Fossil-based LNG is obtained from the extraction of natural gas from the reservoirs. The gas is processed to remove heavier hydrocarbon gases and other impurities and then cooled to cryogenic temperatures in an LNG train to convert its state from gas to liquid. Biomethane is mainly produced through anaerobic digestion (AE) or biomass gasification. Various feedstocks can be used for AE and biomass gasification, although there is a trend to recover energy from waste via gasification, for example, from agricultural wastes, organic wastes, manure, and sewage sludge. Biomethane has similar properties to fossil-based natural gas, therefore it can be liquefied and distributed by leveraging natural gas infrastructures. However, biogas produced from anaerobic digestion contains a large fraction of CO2, which must be purified to achieve a purity of biomethane over 95 vol% before use as a marine fuel. The costs of purification are relatively high due to the use of energy and chemicals in the process, and this is one of the main barriers for the wide adoption of biomethane as fuel [12,13].
1.2. Hydrogen
Hydrogen is the simplest and lightest element. It is recognised as one of the most promising future alternative energy sources for transportation decarbonisation due to several unique advantages. First, when using hydrogen as fuel, the only by-products are water and a minor amount of NOx. Second, hydrogen can be produced from a variety of renewable sources, including biomass, nuclear power, and non-bio renewable energy such as wind and solar photovoltaics (PV). Thirdly, hydrogen has a high energy-to-weight storage ratio, with the energy density of hydrogen between 120 and 142 KJ/kg [14]. Hydrogen has seen wide use as fuel in the aerospace sector; and attempts have been made by the shipping and inland transportation sectors to use hydrogen as fuel since the late 20th century [15,16].
One of the most abundant elements on Earth, hydrogen normally exists in compound form. Therefore, it can be extracted from diverse sources including fossil fuels, biomass, and water, or from a mix of sources. With the aforementioned sources, the production of hydrogen can be achieved via many different process technologies, including reforming (steam, partial oxidation, autothermal, plasma, and aqueous phase), gasification, and pyrolysis and water electrolysis [17,18,19]. The majority of hydrogen is currently produced from fossil fuels. Around three-quarters of the global demand for hydrogen is currently generated by steam methane reforming (SMR) with natural gas as a feedstock. Characterised by high efficiency and low-cost production, it also leads to large quantities of GHG emissions [20]. Electrolysis utilising renewable energy sources can deliver clean hydrogen production, however this currently only accounts for 3.9% of total global hydrogen production [21].
1.3. Biodiesel
Biodiesel can be used as a direct substitute for diesel fuel, produced from renewable or waste sources. The American Society for Testing and Materials defined biofuel as mono-alkyl esters of long-chain fatty acids resulting from edible oils, non-edible oils, and waste oils. Biodiesel presents in a liquid state at room temperature and with similar chemical characteristics to conventional diesel fuels. However, it contents no sulphur and has more free oxygen than conventional petrol diesel. Having more free oxygen results in complete combustion and less carbon monoxide emission, particulate matter, smoke, and hydrocarbons in combustion [22,23,24,25]. In addition, the higher flashpoint, biodegradability, non-toxicity, and inherent lubricity are other advantages worthy of mention when using biodiesel as a marine fuel [26]. Biodiesel is compatible with the majority of existing diesel-based engine systems, with little to no modification required. Therefore, it has the potential to be used as a drop-in replacement, low sulphur content fuel.
Biodiesel can be produced from a wide variety of feedstock resources from vegetable oils, waste cooking oils, sludge from factories, to animal fats and other oleaginous sources. The European Academies’ Science Advisory Council (EASAC) (2012) has classified biodiesels into four generations according to production feedstock. First generation biodiesel is produced from edible feedstocks (such as soybean oil, canola oil and rapeseed oil), non-edible oils (for example Neem oil, Jatropha curcas, Nagchampa oil, Karanja oil, honge oil) comprise the second generation, and biodiesel from waste oils the third generation. Fourth generation biodiesel is comprised of oil derived from synthetic biology technology, typically that which is still under development and not yet widely commercially available.
The main feedstocks for biodiesel production vary between regions depending on availability. For example, biodiesel in the US is mainly produced from canola oil, rapeseed oil in Europe, and palm oil in Malaysia. These first and second-generation biofuels often compete with agricultural lands and, directly and indirectly, impact biodiversity and the provision of ecosystem services [27,28,29]. Additionally, biodiesels obtained from different feedstocks have observable variations in purity, composition, and characteristics [30,31,32,33,34]. Therefore, regional and national standards were proposed to check the quality of biodiesels and their blends by determining several key parameters, such as EN 14214:2012 + A1:2014 in the EU and ASTM D6751-5a in the US [35,36,37].
1.4. Methanol
Methanol has been receiving increasing attention in the shipping industry over the past decade. Various studies and projects have been conducted to test the feasibility of using methanol as a marine fuel, for example, Effship, Spireth, Methaship, Leanships, Summeth, and Greenpilot [38]. Methanol (MeOH) is the simplest alcohol, also known as methyl alcohol or wood alcohol. It is a toxic, light, volatile, and flammable liquid at standard temperature and pressure. In comparison with marine diesel fuels, methanol has a higher H/C ratio, higher oxygen, and higher octane number (ON). The high oxygen content assists in producing more efficient combustion in the engine systems [39]. As a cleaner fuel, consumption in internal combustion engines generates nearly zero SOx and delivers reductions in CO2 and PM emissions relative to HFO and MGO [40]. One of the key advantages of methanol fuel in environmental performance is lower NOx forming potential from the low-in-cylinder combustion temperature. Ships could comply with stricter NOx emission regulations when using methanol as fuel [41,42,43,44]. Test data of the world’s first methanol fueled ship, the Stena Germanica suggested that switching from HFO to methanol could reduce SOx emissions by 99%, PM emissions by 95%, NOx by 60% and CO2 by 25% from the ship’s operation [45].
Methanol can be produced from numerous sources, including carbon-containing feedstocks, biomass, and non-bio renewable energy. Currently, most methanol worldwide is produced from catalytic conversion of synthesis gas (CO and H2) from natural gas reforming or from the gasification of coal [46,47]. Both of these two pathways are carbon intensive. To realize methanol as a viable alternative fuel for a low-carbon future, production routes will need to shift toward cleaner solutions, where more sustainable feedstocks are adopted or effectively capture the GHG emissions generated during the production process [48]. Much of the current research and initiative practices in the industry are focusing on the use of agricultural waste [49,50,51], forest biomass [52,53], and municipal solid waste (MSW) [54,55], and CO2 [47,56,57,58] as feedstocks for methanol production. The Canadian company Enerkem built a plant in Rotterdam capable of converting 350,000 metric tons of MSW into 270 million liters of methanol per annum [59]. The Swedish company Södra started the world’s first large-scale fossil-free biomethanol factory using Swedish forest biomass; the factory can produce 5250 tonnes of biomethanol per year, with quality equal to fossil-based methanol [60].
1.5. Ammonia
Ammonia (NH3), a carbon-free chemical compound, has gained significant attention as a potential alternative fuel for marine use. Similar to hydrogen, ammonia can be produced from renewable sources and potentially be consumed in an environmentally benign way, making it a promising clean alternative energy source and hydrogen storage medium. The biggest advantage of ammonia compared to hydrogen is easier storage and transportation [61,62]. The storage requirements of ammonia are similar to propane, at standard temperature (25 °C), ammonia is required to be pressurized to 8.6 bar vapor pressure to maintain its liquid form. The energy density of ammonia under standard storage status is around 22.5 MJ/kg, with 17.8% hydrogen content by weight. Moreover, ammonia fuel has a narrow flammability range. The flammability limit of ammonia is between 0.63 and 1.40, therefore it is generally considered non-flammable in the transportation process [63]. In addition, ammonia has a very strong odor, and the leakage of ammonia onboard is easy to detect, with a nose as low as ∼5 ppm [64].
Ammonia is currently produced worldwide by the Haber Bosch process, which uses an iron-based catalyst under high temperatures and pressures (450 °C, 200 bar) to combine atmospheric nitrogen (N2) and hydrogen to form ammonia [65]. In general, the primary pathway in ammonia generation is SMR with a natural gas source followed by coal gasification [66,67]. With the continuously increasing interest in emissions reduction, alternative sustainable ammonia production pathways are under investigation, including electrochemical and biological routes. The electrochemical and biological pathways can be conducted under lower pressure and temperature levels relative to the Haber Bosch process [68,69]. Adopting alternative pathways could potentially reduce the energy input in ammonia production and reduce operation and energy costs. The emissions from ammonia production can be further reduced by using hydrogen produced from renewable energy-based water electrolysis instead of fossil fuel-based reforming and gasification [70,71,72].
A drawback to the use of ammonia as a marine fuel is its toxicity and hazardous nature. Exposure to high concentrations of ammonia in the air can result in serious health issues such as blindness, lung damage, brain damage, and potentially death [73,74]. Therefore, leakage of ammonia can rapidly become a serious threat to accommodation space and onboard personnel. However, the toxicity problems have already been largely addressed in the use of ammonia in various sectors, especially in agriculture, chemicals, and refrigeration. Standards are well-established in ammonia handling, storage, and use in various forms to cope with ammonia toxicity [75,76,77]. Moreover, the incomplete combustion of ammonia could lead to an increase in NOx emissions. This issue is particularly related to internal combustion engine systems with the direct application of ammonia. The narrow flammability limits and low flame speed of ammonia can induce incomplete combustion in the engine system [78]. The incomplete combustion issue can be mitigated if ammonia is decomposed before injection into the engine; the mixture of hydrogen, nitrogen, ammonia, and air has combustion characteristics comparable to gasoline [79,80].
1.6. Shore Power and Plug-in Battery-Powered Ship (Electricity)
Shore power (SP) is an emissions mitigation strategy of replacing on-board fossil fuel with electricity supplied from shore. In terms of direct emissions, battery-powered ships with electricity could eliminate emissions resulting from the operational stage. However, SP is not a true zero-emission technology [81,82]. The provided SP comes from the local power grid, and the emissions of SP are highly related to the electricity generation process and sources used in electricity generation. The emissions are transferred from operational areas to the generating stations of the electricity away from the harbor areas. Therefore, to evaluate the environmental benefits of the ships with battery propulsion systems, it is imperative to include the production chain of the SP supply. Worldwide, electricity generation is still mainly based on fossil fuels. Acceding to the IEA, coal and natural gas are major electricity generation sources. Electricity generation in 2018 from coal was 38.8%, natural gas was 23.1%, nuclear was 10.6%, and hydro was at 16.4% [83]. With the continuing development of renewable electricity generation technologies, the share of renewable energy sources in the world electricity grid mix has continued to grow. A review of the electricity production data showed that the share of renewables in the electricity supply has reached nearly 28% in 2020, and up to 60% of the global electricity demand could be satisfied by renewable sources by 2050 [84,85]. The mix of electricity production varies between countries and very much depends on the availability of sources and the demands of each region. Statistics show renewable sources have taken more than half of the share in the 2018 electricity mix in countries including Austria (73%), Sweden (66%), Denmark (62%), Latvia (53%), and Portugal (52%) [86]. In line with policies toward mitigating the climate change issue, the goal of Denmark is to generate all of its electricity from renewable sources by 2050 [87]. Electricity in countries with a high share of renewable sources in the electricity mix can be recognized as a “green” alternative fuel for vessels [88].
2. Methodology
To compare the performance of alternative fuels and identify potential knowledge gaps in the literature, the review is conduced based on a three-step procedure. The review consists of (1) a systematic literature review and information synthesis, (2) a grouping of studies which have the most prospective and promising solutions, and (3) an assessment of accuracy and topic relevance. The literature search was completed by searching the scientific databases Scopus and Web of Science. Alternative fuels in the marine industry are varied in their chemical components, technical characteristics, economic and environmental performance, as well as safety, availability, storage requirement, and production sources. These elements from both the upstream and downstream of the supply chain of alternative fuels and fuel usage could potentially influence the adoption of the fuels in the marine industry. Therefore, various criteria have been proposed for evaluating the fuels and supporting the decision-making of the stakeholders.
Alternative fuels in this study were evaluated following the criteria established by [89,90]. Literature were eligible for inclusion in the review on the basis of the following main concepts, (1) technical feasibility: technology maturity, availability, and infrastructure development, (2) economic performance: investment costs of the systems, fuel price, and additional costs in operation, (3) environmental performance: global warming potential, acidification potential from well-to-tank (WTT) and tank-to-water (TTW), and (4) social perspective: compliance with regulations. We have limited the scope of the review by investigating studies published after the MARPOL Annex VI first came into effect in 2005. Peer-reviewed journal papers, conference proceedings and research reports published by research institutions and governments were included if they were published between the periods of 2005 to 2021 and written in English. The review focused on the reported results and not on the methods used. Studies without the full text of articles available were excluded from the review.
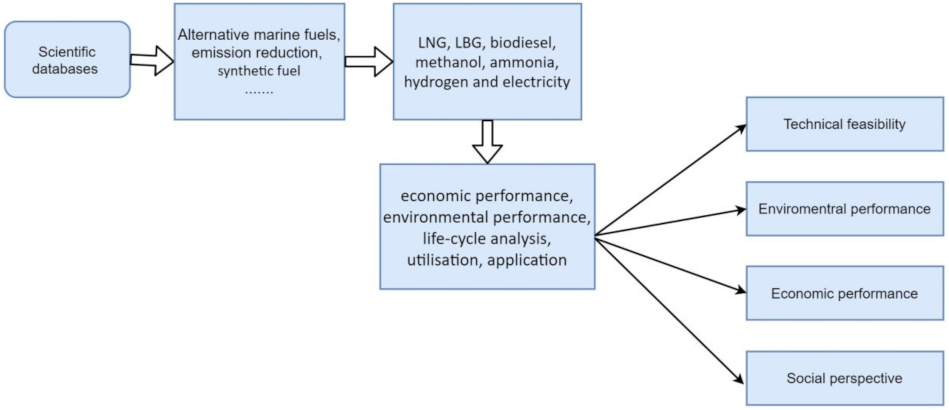
Figure 3 presents how the literature search was conducted in this work. The selected scientific databases were first searched using terms such as ‘alternative marine fuel’, ‘synthetic fuel’, ‘emission reduction’, by key word, title, and abstract. A large number of publications were found when these terms were searched, and most of the results were not directly relevant to the topic and objectives of this work. Therefore, additional refinement related to the field of energy has been applied with combination of the terms including ‘economic performance’, ‘environmental performance’, life-cycle assessment’, ‘utilisation’, and ‘application’. The alternative fuels reviewed were selected based on the obtained and synthesized results from the recent decade.
3. Utilisation Technologies
This section aims to review the utilisation technologies of the considered alternative fuels in marine application. The prime plants to use the fuels in the marine sector include the mono-fuel internal combustion engine (ICE), dual-fuel ICE, and fuel cells. In the past decade, due to the development of battery technology, increasing attention has been paid to pure battery-powered systems. A majority of the alternative fuels considered in the study have the potential to be consumed by various presented technologies. Less attention has been paid to the technologies and alternative fuels that are mature and already used commercially, while more attention is given to emerging technologies. Gas turbine technology is not included in this review due to its small share in the marine propulsion sector and the limited published works about its use.
Fuel cells are an electrochemical device that converts chemical energy from gaseous fuel into electrical energy; they have been successfully adopted in aerospace engineering, the automotive sector, and in power plants [91]. The one-step nature of the energy conversion process has brought some unique advantages to this technology compared to combustion technologies such as high energy conversion efficiency and low emissions [92]. Although the application of fuel cells is still limited in commercial ships, the technical feasibility of utilising fuel cells for ship propulsion and auxiliary power has been demonstrated by numerous studies (e.g., [93,94,95,96,97]). The fuel cells are classified according to the choice of electrolyte and fuel. Presently, six major different types of fuel cells are available, including: (1) proton exchange membrane fuel cells (PEMFC); (2) alkaline fuel cells (AFC); (3) phosphoric acid fuel cells (PAFC); (4) molten carbonate fuel cells (MCFC); (5) solid oxide fuel cells (SOFC); and (6) direct methanol fuel cells (DMFC) [98,99]. In principle, PEMFC and MCFC are considered as the most promising types of fuel cells to produce electricity onboard ships regarding the availability, efficiency and maturity in technology. In addition, SOFC is a potential option for marine use for medium to long-distance ship applications.
Ship electrification is not a new concept in the marine industry. The first golden age for electrically powered ships was in the period from the late 19th century to the early 20th century, and electrification has been recognised for decades as a potential solution for reducing emissions from shipping activities. In recent years, with the improvement of battery performance and successful implementation of batteries in the automotive industry, there has been an acceleration in development of battery powered ships. The first large-size pure battery-powered ferry, Norled’s Ampere, was put into operation in 2015. The ferry is equipped with a 1 MWh battery system and capable of carrying 120 cars and 350 passengers [100]. Since 2015, further pure battery-powered vessels have been launched with increasing tonnage and battery capacity, for example, Ellen (4.3 MWh), Project e5 (4 MWh), Guangzhou (2.4 MWh), AIDAperla (10 MWh) and Stena Jutlandica (50 MWh) [101]. Battery-powered propulsion systems are more energy-efficient than ICE and FC [102]. However, the technology is currently not feasible for deep sea-going ships due to the low mass and volumetric density of the battery systems. Table 1 presents an overview of the utilisation efficiency of the selected alternative fuels associated with the different propulsion systems. For a more detailed description of the different types of utilisation technology please see accompanying Supplementary Information.
4. Environmental Performance of Marine Alternative Fuels
The assessment of alternative fuels considering whether they can genuinely support reductions in exhaust gas emissions and associated impacts from shipping activities must consider not only direct emissions generated onboard, but also the emissions from the whole production chain, including production, storage, transportation and distribution to end-users. The alternative fuels presented in this work have a common feature, that being that all fuels can be produced through different methods and from a range of primary sources. The effectiveness, efficiency, and emissions generated from fuel production are varied based on these different pathways. Therefore, in this study, a comparison between different fuel production pathways throughout their energy value chain has been presented. Through evaluation and comparison of the emissions generated from both the WTT and TTW phases, the advantages, disadvantages, and potential opportunities of alternative marine fuels in marine decarbonisation and emissions reduction can be identified. However, it should be noted that existing regulations in the marine sector are only applied to direct emissions generated from shipping activities. Upstream or out-of-sector emissions are not typically considered in the existing legal frameworks.
4.1. Greenhouse Gas Emissions
Global warming potential (GWP) refers to the ability of a greenhouse gas to contribute to global warming in the atmosphere relative to a reference gas, CO2. The life cycle GWP results for typical alternative fuel production pathways are shown in Table 2. Hydrogen, electricity, and ammonia show a noticeable advantage in the TTW GWP results; greenhouse gas emissions are eliminated when consuming these alternative fuels with FC or in pure battery-powered systems. For carbon containing fuels, no obvious advantage has been identified for direct GHG emissions. Among all the carbon content alternative fuels, LNG and LBG perform best in the TTW phase due to the smaller carbon content. Results from the literature showed that consuming LNG fuel with ICE could bring a 20–30% reduction in CO2 emissions compared with conventional marine oil [117]. Nevertheless, concerns are apparent regarding rogue emissions from methane, or ‘methane slip’, primarily as a result of poor fuel combustion due to low operational fuel-air ratios. Methane is the dominant component of LNG and has been estimated to have 28 times the GWP of CO2 over 100 years [118]. Any significant methane slips can wipe out the advantage of LNG in GHG emission reduction.
In the well-to-tank phase, GHG emissions of alternative fuels are varied significantly from the different production pathways and prime energy sources for fuel production. The well-to-wake (WTW) emissions of alternative fuels with no carbon content could be even higher than conventional marine oil when produced from fossil-based sources. LNG, hydrogen, ammonia, and methanol produced from natural gas have a similar lifecycle GWP magnitude as conventional marine fuel oil, while a noticeable reduction in life cycle GHG emissions can be identified from pathways of bio-diesel, bio-methanol, bio-methane, and hydrogen, and ammonia from renewable sources. The reason for the significant reduction in lifecycle GHG emissions for bio-based alternative fuels is mainly the carbon offset from bio-mass growth. CO2 released from bio-based fuel consumption is offset by the CO2 absorbed during the growing cycle of bio-mass sources for fuel production. Plug-in battery-powered ships with shore-based power are potentially game-changing in the pursuit of the decarbonisation of the shipping industry. Percic, Ančić and Vladimira [119] evaluated and compared the life cycle of GHG emissions of battery-powered hybrid systems with other alternative fuels and identified the battery-powered system from shore-based electricity as the lowest environmentally impacting alternative. Pure battery powered ships generate no GHG emissions in the operational phase; however, it should not be assumed that electricity is a true zero-emission alternative fuel for marine use. The life cycle emissions of battery-powered ships significantly depend on the process of electricity generation. The existing literature highlights the influences of the process and energy sources used in electricity generation on the life cycle emission results. When the fossil-based sources take the majority share of the electricity grid mix, the electricity has a limited advantage relative to conventional fuel oil [120,121,122]. The high share of renewables in the electricity supply in EU countries makes electricity a promising alternative fuel in the EU region.
4.2. Other Regulated Emissions
Ahead of the 0.1% limit within SECAs, results from all alternative fuel options indicated straightforward compliance. The options of hydrogen, ammonia, electricity, and LNG show a significant advantage in SOx emissions. SOx emissions are eliminated in the TTW phase when consuming these fuels onboard due to zero sulphur content in the fuel. With respect to NOx emissions, the results show a clear distinction between hydrogen, methanol, ammonia, and electricity on one hand, and conventional liquid fuels and bio-diesel on the other. A major environmental concern of using biodiesel is high NOx emissions. The NOx emissions of neat biodiesel and its blends have been recognised as higher than that of ordinary diesel fuel (see [123,124,125,126]). Up to a 15.5% increase in NOx emissions has been identified from pure biodiesel systems when compared with marine diesel [127]. LNG fuel has been reported to have the potential to effectively reduce NOx emissions from the TTW phase. However, the degree of reduction depends largely on the type of engine used. Stenersen and Thonstad [128] tested four main gas engine types in the market, which are lean-burn spark ignited engines (LBSI-), low-pressure dual-fuel engines (LPDF), low-pressure dual-fuel engines (LPDF-) and high-pressure gas injection (HPDF). Only the lean-burn and the low-pressure gas engine systems have been found to help effectively reduce the NOx emissions (70–90%) from their operation. In contrast, the higher pressure engine system can help achieve only up to 30% in NOx emissions reduction compared with diesel operation.

Table 2.
Summary of the emissions from well-to-tank and tank-to-water. Data: L1: liquefied natural gas from fossil, L2: liquefied natural gas from biomass; [129,130,131]; M1: methanol from natural gas [132]; M2: methanol from biomass [133,134,135,136]; H1:hydrogen from SMR [137,138,139]; H2: hydrogen from wind-powered electrolysis [140,141]; A1:ammonia from natural gas [142,143,144]; A2:ammonia from biomass [142,143,145,146]; B1: Biodiesel from rapeseed FAME [147,148]; B2: Biodiesel form soy oil hydrotreated [148,149].
| Emission Factor (g/MJ) | L1 | L2 | M1 | M2 | H1 | H2 | A1 | A2 | B1 | B2 |
|---|---|---|---|---|---|---|---|---|---|---|
| Emission to Air Well-to-Tank | ||||||||||
| CO | 0.0027 | 0.0096 | 0.0063 | 0.025 | 0.01- 0.074 | 0.0075 | 0.0037 | |||
| CO2 (fossil fuel origin) | 8.3–26.73 | 27 | 20 | 17 | 77.98–84.16 | 7.90–9.66 | 64.89–84.44 | 18.57–29.78 | 19 | 15 |
| CO2 (biogenic carbon uptake) | - | 97 | 120 | 67 | 67 | |||||
| SOx | 0.00083–0.0233 | 0.073 | 0.0021 | 0.048 | 0.038–0.07 | 0.051–0.064 | 0.00044 | 0.04 | 0.03 | |
| N2O | 0.00016 | 0.00033 | 0.00029 | 0.00022 | 0.00025–0.0025 | 0.00041 | 0.00045 | 0.00045 | 0.087 | 0.001 |
| NOx | 0.0095–0.091 | 0.053 | 0.046 | 0.056 | 0.034–0.098 | 0.030–0.039 | 0.044 | 0.044 | 0.06 | 0.15 |
| CH4 | 0.033 | 0.018 | 0.011 | 0.042 | 0.15-0.49 | 0.0025–0.0031 | 0.0053 | 0.03 | 0.02 | |
| Emission to Air Tank-to-Water | ||||||||||
| CO | 0.13–0.27 | 0.13–0.27 | ||||||||
| CO2 (fossil fuel origin) | 54–58 | 69 | ||||||||
| CO2 (biomass origin) | 52–58 | 69 | 73 | 77 | ||||||
| SOx | 0.00056–0.57 | 0.00056–0.57 | 0.0002–0.1 | 0.0001–0.1 | ||||||
| N2O | 0 | 0 | Need further research | Need further research | 0.003 | 0.003 | ||||
| NOx | 1.22 (HPDF) 0.11–0.37 (LPDF) | 1.22 (HPDF) 0.11–0.37 (LPDF) | 0.28–0.4 | 0.28–0.4 | Need further research | Need further research | Need further research | 0.17–1.7 | 0.17–1.7 | |
| CH4 | 0.00139 (HPDF) 0.71 (LPDF) | 0.00139 (HPDF) 0.79 (LPDF) | 0.01 | 0.01 | ||||||
5. Economic Performance
In addition to the life-cycle environmental impacts and technical feasibility issues surveyed in this work, the commercial viability of alternative fuels will also play an important role in determining their level of deployment. In this section, a costs analysis of the selected alternative fuels has been performed across the different fuel production pathways (Table 3). In addition, costs for construction/purchase propulsion systems are combined with costs of onboard fuel storage systems to determine the total capital investment costs for the alternative fuel-based systems (Table 4).
5.1. Fuel Price
The most noticeable difference today between the LNG price and the crude oil price is that the former varies significantly between different regions. Yegorov [150] explained that differences in gas prices can come from the gas itself, from market influences, and from the pricing mechanisms used by local markets. The gas industry today still lacks universal pricing mechanisms. The Asia Pacific region is now the largest market for LNG imports, but this does not bring these countries any benefit in terms of LNG import price. The Asia Pacific region currently has the most expensive gas spot prices among all the major gas markets in the world. After the 2008 economic crisis, the North American shale gas boom and resultant fall in gas price has largely increased the viability of LNG as a marine fuel. The LNG price in the North American market dropped from more than 12 US$/MMBtu (million British Thermal Units) in December 2007 to around 3 US$/MMBtu in 2017, and it has remained at a low level [151]. When using LNG as a marine fuel, bunkering charge should also be taken into consideration. Algell et al. [152] carried out a detailed analysis of LNG bunker changes, and the study concluded that cost differences in bunker methods and the building of LNG bunker infrastructures in port could today lead to significant differences in LNG bunker price; the additional supply cost of this fuel could vary from 50 US$/ton of LNG up to 630 US$/ton.
This review considers the price of hydrogen, ammonia, and methanol from the perspective of two different production pathways—conventional (SMR from fossil-based natural gas or coal) and renewable (electrolysis based on renewable energy sources). In general, fuel production costs depend heavily on the price of the energy inputs. Cloete and Hirth [153] concluded that the price of hydrogen produced from the SMR pathway with 80% conversion efficiency can be presented as 1.25× the natural gas price plus 0.72 US$/kg for capital and other operating costs. To produce low price hydrogen from SMR, it is important for producers to access low price natural gas sources. Low gas prices in the Middle East, Russia, and North America give these countries and regions an advantage in the production of hydrogen from SMR. Conversely, gas importers in Asia, such as Japan and China, have to contend with higher gas import prices, which makes for higher hydrogen production costs. Research conducted by the Hydrogen Council indicated that the optimal costs of hydrogen from SMR plus carbon capture and storage (CCS) systems, with about 60% carbon capture could drop to below 1.20 US$/kg before 2025 in the low gas price geographic locations. In regions like the EU, hydrogen from SMR with CCS cost around 2.1 US$/kg, and this is expected to fall to 1.8 US$/kg by 2030 [154]. For renewable hydrogen from electrolysis, the costs of hydrogen production will depend upon the economics and scale of production, with the most crucial factor being the price of renewable energy inputs. According to the IEA, the production costs of green hydrogen from water electrolysis can be low as approximately 1.6 US$/kg using solar energy in the Middle East [155]. For the UK, the long-term renewable electricity price is around 65 £/MWh (around 92 US$/MWh),which would correspond to a low-carbon hydrogen production cost, by water electrolysis, of 3.25–3.66 £/kg (around 4.61–5.19 US$/kg). The production costs of ammonia and methanol follow the same trends as hydrogen. The geographical market price of the feedstock is the dominant cost driver for conventional ammonia and methanol production. The cost of feedstock could account for approximately 65–85% of the total production costs [156].
The production costs of biodiesel are largely attributed to the chemical technology employed in the production plant and the costs of feedstock. Some reports to date have estimated biodiesel production costs from different value chains, for example, [157,158,159]. Today, global biodiesel production is concentrated in regions of the EU, the US, Indonesia, and Brazil, which together contributed over three-quarters of the biodiesel produced in the year 2019 [160]. Biodiesel from soybean in the USA and Brazil costs around 0.42 US$/L and 0.64 USD/L [161]. The typical production costs of biodiesel based on palm oil in Indonesia is 0.68 US$/L, while rapeseed-based European production is 0.75 US$/L [162,163]. See Table 3 for a summary of the selected production cost ranges for alternative fuels.
Table 3.
Summary of the literature on the selected production cost ranges for alternative fuels. Note that the average MGO price in the global 20 ports between 2018 and 2021 has been used as a benchmark in comparison. The relative costs of each fuel are compared on a $/MJ of energy content. Price multiple is calculated based on the production price of alternative fuels compared to the benchmark (average MGO price in the global 20 ports) to evaluate competitiveness in the current market. Data: MGO [164], LNG [165,166], LBG [13,151,167], Methanol [149,168,169,170], Hydrogen [19,171,172,173,174], Ammonia [175,176,177,178,179].
| Fuel Pathway | Feed Stock | Estimated Fuel Production Costs/Import Price ($/MJ) | Fossil Fuel Price ($/MJ) | Price Multiple |
|---|---|---|---|---|
| LNG | Natural gas | 0.0022–0.0092 | 0.014 | 0.16–0.66 |
| LBG | Biomass | 0.0081–0.032 | 0.57–2.29 | |
| Biodiesel | Soybean, palm oil, rapeseed | 0.013–0.027 | 0.92–1.93 | |
| Methanol | Biomass | 0.021–0.037 | 1.50–2.64 | |
| Methanol | Natural gas | 0.006–0.022 | 0.43–1.57 | |
| Hydrogen SMR | Natural gas | 0.0063–0.035 | 0.45–2.5 | |
| Hydrogen electrolysis | Wind-power, water | 0.025–0.08 | 1.78–5.71 | |
| Hydrogen electrolysis | Nuclear energy, water | 0.019–0.045 | 1.36–3.21 | |
| Ammonia | Natural gas | 0.0093–0.036 | 0.66–2.57 | |
| Ammonia | Wind-power | 0.021–0.037 | 1.50–2.64 |
5.2. Capital Investment Costs for Propulsion and Fuel Storage System
5.2.1. ICE
To consume LNG/LBG fuel onboard, vessels are required to have a gas-powered engine system. Existing MGO/HFO (fossil heavy fuel oil) engines can be converted to use liquid methane fuels, but the retrofit cases are limited thus far and mainly concentrated in small ships due to the high costs and the complexity of retrofit. We selected the unit price of the gas-powered engine system provided by [180,181], 387 US$/kW and 850 US$/kW are reported for new build four-stroke and two-stroke dual-fuel engines and 818 US$/kW was reported for a system retrofit. As with LNG and LBG, hydrogen used as an Otto fuel can also be consumed in spark-ignited, as well as different types of dual-fuel engines. The hydrogen-based marine ICE system has not yet been widely commercialised; the costs of the systems are considered the same as the LNG/LBG systems.
The technology of converting a conventional diesel-fuelled engine system to consume methanol is mature, and low retrofitting costs are assigned to this technology. Experimental research and existing cases indicated that the methanol-based/duel fuel systems converted from a conventional system could achieve similar or even higher efficiency [182]. The detail of system conversion can be found in [115]; the authors highlighted the issue of different velocities of methanol and marine diesel oil in retrofitting, and estimated retrofitting costs at 328 US$/kW. Ammonia ICE is a relatively novel concept in the marine sector. Marine vessels use large size ammonia engines that are not commercialised yet, but the price of an ammonia ICE system was to be evaluated based on DEM ICE systems. The price of low-flash injection engines is estimated to be 400–530€/kW (around 487–640 US$/kW) by [183].
5.2.2. Fuel Cell
The high capital investment costs of FC systems are one of the primary barriers limiting the wide adoption of the technology in the marine sector. At the current production volume, the cost of marine FC systems is often estimated in the existing literature to be over 1000 US$/kW. The possibility of using FCs onboard has been analysed in [184], and the issues of high capital investment costs and relatively short expected lifetimes were highlighted. The present factory costs for the SOFC system are reported as 9000 US$/kW in [185], 5500$/kW in [99], and 4000–9000$/kW in [186]. According to some estimates, FC system costs tend to go lower with increasing production volume. However, as there is large uncertainty in future costs and degradation, the projected costs of marine FC systems ranges widely in the literature. For PEMFC, best cost assessments for FC stake varied from $40 at annual production volume reaching 500,000 units to $500/kW for 20,000 units/y. For SOFC [187] suggested 2650€/kW (around 3200 US$/kW) for 2030, [180] proposed 1280€/kW (around 1560 US$/kW), and the United States Department of Energy (DOE)’s target is 900 US$/kW between 2025–2030 [188]. Additional onboard costs may need to be considered for equipment such as reforming (cracking), and the evaporator, gearbox and electrical systems [189].
5.2.3. Fuel Storage
Fuel storage is one of the main challenges for the wider application of hydrogen in the marine sector. Numerous techniques for storing hydrogen onboard have been suggested, from pure physical storage (compressed hydrogen storage, liquid hydrogen storage) to chemical storage (desorbed hydrogen storage, reversible hydrides storage). A general trend going with the hydrogen storage technologies is that hydrogen under chemical storage is less easily available than physical storage, higher energy or temperatures are required to release hydrogen from chemical storage [190,191]. LNG and LBG also struggle with low volumetric density. LNG/LBG onboard is stored in a specially designed energy storage system to keep LNG in its liquid state. The IMO has defined three basic tank types (type A, B, C), in addition to membrane tanks for marine use. Type A, B and membrane tanks are non-pressurised and designed for high volume LNG storage, type C pressurised tanks are generally used on small vessels due to the small capacity and no requirement for a secondary barrier and boil-off gas (BOG) treatment system. The estimated costs for a type IV 700 bar H2 storage system is between 515 $/kg at production volume of 500,000 systems/year and 868 US$/kg for 10,000 systems/year [192]. For a large-size storage tank, the costs for Type IV 700 bar tank configuration with 220 kg H2 storage is reported as 76,851 US$/vessel (around 349$/kg) [193]. The low-pressure membrane LNG/LBG tanks are estimated to cost 380 US$/m3 between 15,000–20,000 m3 and 420 US$/m3 for 10,000–15,000 m3 [194].
The economic disadvantages of plug-in battery systems are mainly related to the high capital cost of the battery system. In comparison to automotive battery systems, battery systems on marine vessels are estimated to have a higher cost due to the stricter requirements on the insulation and cooling of equipment, as well as the requirement for additional fire safety measures. As such, the current costs of a high capacity lithium iron phosphate (LPF) marine battery system as suggested by an EMSA study is 500–1000 US$/kWh [195]. The price of lithium nickel manganese cobalt oxide (NMC) batteries, which are suitable for marine applications, was considered to be 1000 US$/kWh in [196].
Table 4.
Capital investment costs of installing fuel technologies to new ships and to retrofitting existing ships. Values in 2021 US Dollars. The ‘price multiple’ is calculated considering the production price of the fuel compared to the average MGO price (across 20 global ports). Data from: ICE [2,114,179,182,189], Fuel cell [195,196,197] Fuel storage [187,192,193,194,198,199,200].
| Component | Retrofit Cost (US$/kW) | New Build Cost (US$/kW) | Lifetime |
|---|---|---|---|
| Propulsion systems | |||
| ICE Diesel, Biodiesel | - | 240/460 a | 30 years |
| ICE, Methanol | 328 | 265/505 a | 30 years |
| ICE, Ammonia | 370/600 a | 30 years | |
| ICE, LNG, LBG, Hydrogen | 900 | 387/850 a | 30 years |
| Fuel cell, SOFC | - | 4000–9000 | 7–12 years |
| Fuel cell, PEMFC | - | 730–2860 | 7–12 years |
| Electrical and generator, LNG, LBG, Hydrogen | - | 400 | 30 years |
| Electric motor | - | 250 | 30 years |
| Fuel storage system | |||
| Gas supply system + tank, LNG, LBG (USD$/kg) | 270–420 | 270–420 | 30 years |
| Gas supply system + high pressure tank (700 bar), Hydrogen (USD$/kg) | 576–868 | 30 years | |
| Battery, Nickel manganese cobalt oxide (NMC) (USD/kWh) | - | 400–1000, and expected to fall to 124 in 2030 | 3000–4000 cycles (8–11 years) |
| Battery, lithium–iron–phosphate (LPF) (USD/kWh) | - | 210–1000, and expected to fall to 70 in 2030 | 2000–5000 cycles (7–13 years) |
a Four-stroke engine/two-stroke engine.
6. Current Challenges and Future Policy Trends
The review in this work indicates that presently there are numerous challenges for greater adoption of alternative fuels in the marine sector. Firstly, the availability of fossil fuels and price differences across regional markets makes it hard for alternative fuels to be globally cost-competitive. The prices of some alternative fuels, such as hydrogen and LNG, in the global market currently have strong regional differentiation. A lower feedstock price in the local market offers a noticeable advantage to the local development of an alternative fuel bunkering service. Alternative fuels produced from fossil feedstocks are generally cheaper than fuels from biomass or renewable energy sources and have greater availability. The prices of alternative fuels from conventional pathways are competitive compared with conventional low-sulphur content fuel oil in the regions with cheap fossil feedstocks; however, the important sustainability concerns related to fossil-based production pathways may outweigh their low price. Biodiesel is the next cheapest alternative fuel followed by fossil-based methanol and ammonia, and has already been commercialised in the vehicle sector. The main challenge that may be an obstacle to the wide application of biodiesel in the marine sector is the debate on “food versus fuel”. Crops are still the main feedstocks for biodiesel production, and it can be argued that fulfilling increasing demands for marine applications with the biodiesel from first-generation (oil and food crops) may threaten supplies for the food industry and increase competition in the biodiesel industry. In recent years, increasing attention has been paid to new generations of biodiesel oils such as waste oil, Neem, and algae. However, these fuels have not yet been produced at commercial volumes and will require stable incentives and long-term policy to scale up. Overall, we found that, absent strong policy support, it is unlikely that alternative fuels from renewable sources can be cost-competitive with conventional, petroleum-based marine fuels for the foreseeable future.
This analysis found that the GHG savings from using alternative fuels vary widely depending on the feedstocks. This review demonstrates that no widely available alternative fuel currently exists to deliver a noticeable reduction in GHG emissions across the whole fuel supply chain. Hydrogen, electricity, and ammonia generate no GHG emissions in operation, but the total decarbonisation of the fuels relies on low-carbon energy input and feedstock materials. “Green” hydrogen and ammonia from renewable sources cannot currently support the volumes required by the maritime industry. The life cycle GWP of biomass-based fuels is better than that of conventional marine fuels when considering carbon offsets. Nevertheless, a key barrier that limits their application is the difficulties in expanding production. As shown in the examples presented in Section 4, the crucial obstacles that keep alternative fuels from achieving true decarbonisation are mainly located in the upstream of their supply chain. The ways to overcome these challenges reside beyond the scope of the marine sector itself, and stakeholders are lacking motivation to adopt true low carbon alternative fuels without legal requirements or other external incentives.
There are risks inherent to fuel selection within climate policies. Generally, there are two main ways to assist policymakers to achieve goals in emission control: traditional measures (“command and control”) and market-based measures (MBMs) [201]. For the traditional policy measures, at MEPC 70 in October 2016, the IMO approved a road map for developing an ‘IMO strategy’ for GHG reductions with a view to adoption in 2023. Following this, three additional measures, the Energy Efficiency Design Index for Existing Ships (EEXI), a mandatory Carbon Intensity Indicator (CII), and the Enhanced Ship Energy Efficiency Management Plan (SEEMP) were approved at MEPC 75, and are expected to enter into force in 2023. A detailed description of the international and regional “command and control” approaches has been presented in [202,203]. The command-and-control environmental measures have been largely responsible for emission reduction from international shipping operations in the past decade and applying a stringent global emission cap may encourage the industry to re-rout towards sustainable pathways. However, the difficulties and limits of the command-and-control approach have also been highlighted in the literature. Standard economic theory concludes that command and control regulation gives little or no incentive to innovation and improves the quality of the performance beyond the limits set by the particular standards [204]. When command and control systems are introduced for pollution control, retrofit of existing systems that allow compliance is generally observed, rather than the adoption of innovative technologies to improve the situation. In turn, MBMs are more flexible and have the potential to encourage the development and adoption of cheaper and innovative clean technology [205].
By 2010, a total of eleven MBM proposals have been submitted to the IMO. Norway recommended a global emission trading system (ETS). The system uses an auctioning system while it releases emissions allowances (corresponding to the cap) into the market yearly. France and the UK submitted similar proposals, but with different methods on the emission cap determination and auctioning design. Japan and the World Shipping Council (WSC) have proposed an energy incentive scheme (EIS) as opposed to an ETS or bunker levy. The efficiency and emission standards in the scheme are mirrors of the EEDI baseline, and administer supplementary costs to be charged to ship-owners, operators, or consumers in line with the amount of fuel consumed for non-compliance [206]. The discussion on MBMs at the IMO continued until 2013 and was suspended with no decision reached. There have been some recent actions taken by nations and organizations. The ICS and Bimco et al. proposed in 2020 the establishment of an International Maritime Research and Development Board (IMRB), a non-governmental mandatory contribution fund to accelerate the introduction of zero-emission technologies for maritime transport. The IMRB will be financed by shipping companies through a mandatory R&D contribution of 2 US$/tonne of marine fuel purchased. The total revenues are estimated at US$5 bn [207]. The EU made a statement in 2016 that shipping will be brought into the EU-ETS by 2023 in the absence of action from the IMO by 2021 [208]. A wide discussion has been conducted in the literature with regard to the design and potential influence of MBM systems such as the Bunker Levy [209,210,211], GHG Fund [2,212], and Global Maritime ETS [212,213,214].
7. Conclusions
This study has reviewed a multitude of alternative fuels with potential to reduce emissions from global shipping, including the characteristics of fuels, production pathways, utilization technologies, energy efficiency, lifecycle environmental performance, economic viability, and policies.
With the rapid growth in the bunkering infrastructure, LNG is currently the main alternative to marine diesel and heavy fuel oil (MDO and HFO). It offers significant advantages in local pollution emissions over traditional marine petroleum fuels. Switching from marine petroleum fuels to LNG will reduce important air pollutants (e.g., SOx, NOx and PM10) substantially and comply with all current and proposed emission reduction requirements. However, LNG has limited potential in reducing GHG emissions from ship operations. The actual GHG benefit of LNG is around 8–20% compared with HFO and MGO when methane slip is into account. The 50% GHG emissions reduction target cannot be achieved by switching to LNG alone, but must be combined with other efforts such as slow steaming or blended with LBG.
Biodiesels as an alternative to petroleum fuels have already been commercialised for terrestrial use. This review has identified that the technical and economic barriers to the use of biodiesels in the marine sector are low. Biodiesels can be directly consumed by existing marine engine systems with only minor retrofits. However, the complication in ensuring sustainability across the full fuel life cycle and the debate on “food versus fuel” brings uncertainties in expending the use of biodiesels in the marine sector. The GHG savings from using biodiesels varies widely depending on the feedstocks used. Biodiesels from west oils and renewable sources are considered to have higher potential in GHG reduction. However, these fuels are not yet produced at commercial volumes.
Chemicals including hydrogen and ammonia were considered as an alternative fuel for various utilisation technologies. High energy density and low emission in use make hydrogen a potential solution for shipping decarbonisation. However, main barriers such as the high capital investment costs and uncertainty in fuel supply will hinder the wider adoption of hydrogen in the short term. Under current volumes, when accounting for costs of the fuel storage system onboard, hydrogen is one of the most expensive fuel-propulsion combinations. In addition, new infrastructures and distribution networks are required for the greater deployment of hydrogen. The existing LNG infrastructures may potentially be transformed for hydrogen distribution, but the feasibility needs to be proven by further research. Ammonia, which has a high hydrogen gravimetric density and is easily stored and distributed, has received increasing attention from researchers. For ammonia-fuelled shipping to become reality, several key technical hurdles and safety issues must be overcome in the design of ammonia propulsion systems, including poor combustion properties and toxicity risks.
With an increasing share of renewable electricity in the global mix grid, running ships with shore-based electricity presents potential environmental and economic benefits. Where a battery-electric ship is charged with renewable electricity, it will have very low climate impact across the whole fuel chain, and will have essentially no exhaust emissions in operation. In recent years, progress has been made in the development of battery-powered ships, but technical difficulties including low energy density in volumetric and gravimetric terms and relatively short lifetimes still need to be overcome for large-scale commercial use. This makes battery propulsion systems more suitable for light-duty shore-based ships or for use as an auxiliary power onboard.
Methane has been known as a potential alternative for some time. Methanol demonstrates economic advantages due to low production, storage, and system retrofit costs. Storage of methanol is subject to substantially the same provisions as those used for petroleum oil storage. Methanol could be stored in tanks made from mild steel or stainless steel and without pressurization; existing HFO/MGO storage tanks can be transformed to handle methanol with only minor modifications. In most cases, conventional diesel-fuelled engine systems can be converted to consume methanol with retrofitting costs of around 300$/kW.
GHG savings from using alternative fuels vary widely depending on the feedstocks for production. The results indicate that switching to low carbon content alternative fuels from the carbon-intensive production pathways would not provide reductions to total GHG emissions, but shifts emissions from ship operation to the fuel generation plants. The decarbonisation of fuels like hydrogen, electricity, and ammonia rely on low-carbon energy input and feedstock materials. The ways to overcome these challenges may reside beyond the scope of the marine sector itself. Currently, there are no policy incentives for stakeholders to adopt alternative fuels from low carbon/renewable pathways.
Alternative fuels are essential to the decarbonisation of international shipping. However, there is no single route currently able to deliver a noticeable emission reduction over the whole fuel supply chain in a manner which is cost-competitive compared to conventional petroleum-based marine fuels. A long-term, consistent, and effective policy framework is required to promote the adoption of alternative propulsion technologies. While efforts to control emissions from shipping under the IMO leadership over the past decade have been paramount, in order to achieve the goal of net-zero in the shipping industry the IMO and its member states must consider a multitude of public and private initiatives in parallel with command and control measures. Policy experimentation in market-based measures, such as inclusion of shipping into the EU-ETS from 2022 and the NOx tax imposed by the Norwegian government provide learning at different scales on best practices in policy design, implementation, and enforcement.
Supplementary Materials
The Supplementary Materials are available online at https://www.mdpi.com/article/10.3390/world2040029/s1.
Author Contributions
Conceptualization, Y.W. and L.A.W.; methodology Y.W. and L.A.W.; formal analysis, Y.W.; data curation, Y.W.; writing—original draft preparation, Y.W.; writing—review and editing, L.A.W.; supervision, L.A.W.; project administration, L.A.W.; funding acquisition, L.A.W. All authors have read and agreed to the published version of the manuscript.
Funding
This research was funded by the European Union, European Regional Development Fund, under the Interreg 2 Seas Program, project award Implementation of Ship Hybridisation (ISHY) and the APC was kindly waived by the journal.
Institutional Review Board Statement
Not applicable.
Informed Consent Statement
Not applicable.
Data Availability Statement
No new data were created or analyzed in this study. Data sharing is not applicable to this article.
Conflicts of Interest
The authors declare no conflict of interest.
References
- UNCTAD. Review of Maritime Transportation 2020. 2020. Available online: https://unctad.org/system/files/official-document/rmt2020_en.pdf (accessed on 22 May 2020).
- Balcombe, P.; Brierley, J.; Lewis, C.; Skatvedt, L.; Speirs, J.; Hawkes, A.; Staffell, L.; Adam, H.; Iain, S. How to decarbonise international shipping: Options for fuels, technologies and policies. Energy Convers. Manag. 2019, 182, 72–88. [Google Scholar] [CrossRef]
- ICCT. Greenhouse Gas Emissions from Global Shipping, 2013–2015. 2017. Available online: https://theicct.org/sites/default/files/publications/Global-shipping-GHG-emissions-2013-2015_ICCT-Report_17102017_vF.pdf (accessed on 25 March 2021).
- Chen, J.; Fei, Y.; Wan, Z. The relationship between the development of global maritime fleets and GHG emission from shipping. J. Environ. Manag. 2019, 242, 31–39. [Google Scholar] [CrossRef] [PubMed]
- Sardain, A.; Sardain, E.; Leung, B. Global forecasts of shipping traffic and biological invasions to 2050. Nat. Sustain. 2019, 2, 274–282. [Google Scholar] [CrossRef]
- Chen, D.; Zhao, N.; Lang, J.; Zhou, Y.; Wang, X.; Li, Y.; Zhao, Y.; Guo, X. Contribution of ship emissions to the concentration of PM2.5: A comprehensive study using AIS data and WRF/Chem model in Bohai Rim Region, China. Sci. Total Environ. 2018, 610–611, 1476–1486. [Google Scholar] [CrossRef]
- Psaraftis, H.N. Decarbonization of maritime transport: To be or not to be? Marit. Econ. Logist. 2019, 21, 353–371. [Google Scholar] [CrossRef]
- Ytreberg, E.; Åström, S.; Fridell, E. Valuating environmental impacts from ship emissions—The marine perspective. J. Environ. Manag. 2021, 282, 111958. [Google Scholar] [CrossRef] [PubMed]
- Chen, J.; Wang, Y.; Song, M.; Zhao, R. Analyzing the decoupling relationship between marine economic growth and marine pollution in China. Ocean Eng. 2017, 137, 1–12. [Google Scholar] [CrossRef]
- Mallouppas, G.; Yfantis, E.A. Decarbonization in Shipping Industry: A Review of Research, Technology Development, and Innovation Proposals. J. Mar. Sci. Eng. 2021, 9, 415. [Google Scholar] [CrossRef]
- Kuczyński, S.; Łaciak, M.; Szurlej, A.; Włodek, T. Impact of Liquefied Natural Gas Composition Changes on Methane Number as a Fuel Quality Requirement. Energies 2020, 13, 5060. [Google Scholar] [CrossRef]
- Li, H.; Mehmood, D.; Thorin, E.; Yu, Z. Biomethane production via anaerobic digestion and biomass gasification. Energy Procedia 2017, 105, 1172–1177. [Google Scholar] [CrossRef]
- Gissén, C.; Prade, T.; Kreuger, E.; Nges, I.A.; Rosenqvist, H.; Svensson, S.E.; Lantz, M.; Mattsson, J.E.; Börjesson, P.; Björnsson, L. Comparing energy crops for biogas production—Yields, energy input and costs in cultivation using digestate and mineral fertilisation. Biomass Bioenergy 2014, 64, 199–210. [Google Scholar] [CrossRef]
- Cano, Z.P.; Banham, D.; Ye, S.; Hintennach, A.; Lu, J.; Fowler, M.; Chen, Z. Batteries and fuel cells for emerging electric vehicle markets. Nat. Energy 2018, 3, 279–289. [Google Scholar] [CrossRef]
- Andujar, J.M.; Segura, F. Fuel cells: History and updating. A walk along two centuries. Renew. Sustain. Energy Rev. 2009, 13, 2309–2322. [Google Scholar] [CrossRef]
- Bockris, J.O.M. The hydrogen economy: Its history. Int. J. Hydrogen Energy 2013, 38, 2579–2588. [Google Scholar] [CrossRef]
- Kalamaras, C.M.; Efstathiou, A.M. Hydrogen Production Technologies: Current State and Future Developments. In Proceedings of the Power Options for the Eastern Mediterranean Region, Limassol, Cyprus, 19–21 November 2012. [Google Scholar]
- Holladay, J.D.; Hu, J.; King, D.L.; Wang, Y. An overview of hydrogen production technologies. Catal. Today 2009, 139, 244–260. [Google Scholar] [CrossRef]
- Qyyum, M.A.; Dickson, R.; Shah, S.F.A.; Niaz, H.; Khan, A.; Liu, J.J.; Lee, M. Availability, versatility, and viability of feedstocks for hydrogen production: Product space perspective. Renew. Sustain. Energy Rev. 2021, 145, 110843. [Google Scholar] [CrossRef]
- IEA. The Future of Hydrogen. 2019. Available online: https://www.iea.org/reports/the-future-of-hydrogen (accessed on 25 May 2021).
- IRENA. Global Energy Transformation: A Roadmap to 2050. 2018. Available online: https://www.irena.org/publications/2019/Apr/Global-energy-transformation-A-roadmap-to-2050-2019Edition (accessed on 25 May 2021).
- Mofijur, M.; Masjuki, H.H.; Kalam, M.A.; Atabani, A.E.; Rizwanul Fattah, I.M.; Mobarak, H.M. Comparative evaluation of performance and emission characteristics of Moringa oleifera and Palm oil based biodiesel in a diesel engine. Ind. Crops Prod. 2014, 53, 78–84. [Google Scholar] [CrossRef]
- Silitonga, A.S.; Masjuki, H.H.; Mahlia, T.M.I.; Ong, H.C.; Chong, W.T. Experimental study on performance and exhaust emissions of a diesel engine fuelled with Ceiba pentandra biodiesel blends. Energy Convers. Manag. 2013, 76, 828–836. [Google Scholar] [CrossRef]
- Demirbas, A. Importance of biodiesel as transportation fuel. Energy Policy 2007, 35, 4661–4670. [Google Scholar] [CrossRef]
- Hasan, M.M.; Rahman, M.M. Performance and emission characteristics of biodiesel–diesel blend and environmental and economic impacts of biodiesel production: A review. Renew. Sustain. Energy Rev. 2017, 74, 938–948. [Google Scholar] [CrossRef] [Green Version]
- Knothe, G. Designer biodiesel: Optimizing fatty ester composition to improve fuel properties. Energy Fuels 2008, 22, 1358–1364. [Google Scholar] [CrossRef]
- Correa, D.F.; Beyer, H.L.; Fargione, J.E.; Hill, J.D.; Possingham, H.P.; Thomas-Hall, S.R.; Schenk, P.M. Towards the implementation of sustainable biofuel production systems. Renew. Sustain. Energy Rev. 2019, 107, 250–263. [Google Scholar] [CrossRef]
- Immerzeel, D.J.; Verweij, P.; Hilst, F.; Faaij, A.P. Biodiversity impacts of bioenergy crop production: A state of the art review. GCB Bioenergy 2014, 6, 183–209. [Google Scholar] [CrossRef] [Green Version]
- Singh, D.; Sharma, D.; Soni, S.L.; Sharma, S.; Sharma, P.K.; Jhalani, A. A review on feedstocks, production processes, and yield for different generations of biodiesel. Fuel 2020, 262, 116553. [Google Scholar] [CrossRef]
- Pinto, A.C.; Guarieiro, L.L.N.; Rezende, M.J.C.; Ribeiro, N.M.; Torres, E.A.; Lopes, W.A.; Pereira, P.A.P.; Andrade, J.B. Biodiesel: An overview. J. Braz. Chem. Soc. 2005, 16, 1313–1330. [Google Scholar] [CrossRef] [Green Version]
- Ellabban, O.; Abu-Rub, H.; Blaabjerg, F. Renewable energy resources: Current status, future prospects and their enabling technology. Renew. Sustain. Energy Rev. 2014, 39, 748–764. [Google Scholar] [CrossRef]
- Fazal, M.; Haseeb, A.; Masjuki, H. Biodiesel feasibility study: An evaluation of material compatibility; performance; emission and engine durability. Renew. Sustain. Energy Rev. 2011, 15, 1314–1324. [Google Scholar] [CrossRef]
- Mahlia, T.M.I.; Syazmi, Z.A.H.S.; Mofijur, M.; Pg Abas, A.E.; Bilad, M.R.; Ong, H.C.; Silitonga, A.S. Patent landscape review on biodiesel production: Technology updates. Renew. Sustain. Energy Rev. 2020, 118, 109526. [Google Scholar] [CrossRef]
- Tabatabaei, M.; Aghbashlo, M.; Dehhaghi, M.; Panahi, H.K.S.; Mollahosseini, A.; Hosseini, M.; Soufiyan, M.M. Reactor technologies for biodiesel production and processing: A review. Prog. Energy Combust. Sci. 2019, 74, 239–303. [Google Scholar] [CrossRef]
- ATSM. ASTM D6751-15a. Standard Specification for Biodiesel Fuel Blend Stock (B100) for Middle Distillate Fuels. 2015. Available online: https://www.astm.org/DATABASE.CART/HISTORICAL/D6751-15A.htm (accessed on 30 March 2021).
- BSI. BS EN 14214:2012+A1:2014. Liquid Petroleum Products—Fatty Acid Methyl Esters (FAME) for Use in Diesel Engines and Heating Applications—Requirements and Test Methods. 2014. Available online: https://infostore.saiglobal.com/preview/98708742874.pdf?sku= (accessed on 30 March 2021).
- Shimamoto, G.G.; Tubino, M. Alternative methods to quantify biodiesel in standard diesel-biodiesel blends and samples adulterated with vegetable oil through UV–Visible spectroscopy. Fuel 2016, 186, 199–203. [Google Scholar] [CrossRef]
- Ellis, J. Methanol—An Alternative Fuel for Shipping? In Workshop: Marine Fuels beyond LNG—Methanol as an Alternative? SSPA: Goteborg, Sweden, 2016; Available online: https://www.sspa.se/alternative-fuels/methanol-alternative-fuel-greener-shipping (accessed on 8 April 2021).
- Zincir, B.; Deniz, C.; Tunér, M. Investigation of environmental, operational and economic performance of methanol partially premixed combustion at slow speed operation of a marine engine. J. Clean. Prod. 2019, 235, 1006–1019. [Google Scholar] [CrossRef]
- Chen, C.; Yao, A.; Yao, C.; Wang, B.; Lu, H.; Feng, J.; Feng, L. Study of the characteristics of PM and the correlation of soot and smoke opacity on the diesel methanol dual fuel engine. Appl. Therm. Eng. 2019, 148, 391–403. [Google Scholar] [CrossRef]
- Wei, L.; Yao, C.; Wang, Q.; Pan, W.; Han, G. Combustion and emission characteristics of a turbocharged diesel engine using high premixed ratio of methanol and diesel fuel. Fuel 2015, 140, 156–163. [Google Scholar] [CrossRef]
- Pan, W.; Yao, C.; Han, G.; Wei, H.; Wang, Q. The impact of intake air temperature on performance and exhaust emissions of a diesel methanol dual fuel engine. Fuel 2015, 162, 101–110. [Google Scholar] [CrossRef]
- Valera, H.; Agarwal, A.K. Methanol as an Alternative Fuel for Diesel Engines. In Methanol and the Alternate Fuel Economy. Energy, Environment, and Sustainability; Agarwal, A., Gautam, A., Sharma, N., Singh, A., Eds.; Springer: Singapore, 2019. [Google Scholar]
- Chen, Z.; Chen, H.; Wang, L.; Geng, L.; Zeng, K. Parametric study on effects of excess air/fuel ratio, spark timing, and methanol injection timing on combustion characteristics and performance of natural gas/methanol dual-fuel engine at low loads. Energy Convers. Manag. 2020, 210, 112742. [Google Scholar] [CrossRef]
- ETIP Bioenergy. Use of Biofuels in Shipping. Biofuelstp.eu. 2020. Available online: https://www.etipbioenergy.eu/?option=com_content&view=article&id=294 (accessed on 8 April 2021).
- Frei, M.S.; Mondelli, C.; García-Muelas, R.; Kley, K.S.; Puértolas, B.; López, N.; Safonova, O.V.; Stewart, J.A.; Ferré, D.C.; Pérez-Ramírez, J. Atomic-scale engineering of indium oxide promotion by palladium for methanol production via CO2 hydrogenation. Nat. Commun. 2019, 10, 3377. [Google Scholar] [CrossRef] [Green Version]
- Dalena, F.; Senatore, A.; Marino, A.; Gordano, A.; Basile, M.; Basile, A. Chapter 1—Methanol Production and Applications: An Overview. In Methanol; Basile, A., Dalena, F., Eds.; Elsevier: Amsterdam, The Netherlands, 2018; pp. 3–28. [Google Scholar]
- Bellotti, D.; Rivarolo, M.; Magistri, L.; Massardo, A.F. Feasibility study of methanol production plant from hydrogen and captured carbon dioxide. J. CO2 Util. 2017, 21, 132–138. [Google Scholar] [CrossRef]
- Petersen, A.M.; Farzad, S.; Görgens, J.F. Techno-economic assessment of integrating methanol or Fischer-Tropsch synthesis in a South African sugar mill. Bioresour. Technol. 2015, 183, 141–152. [Google Scholar] [CrossRef]
- Patel, S.K.S.; Gupta, R.K.; Kalia, V.C.; Lee, J. Integrating anaerobic digestion of potato peels to methanol production by methanotrophs immobilized on banana leaves. Bioresour. Technol. 2021, 323, 124550. [Google Scholar] [CrossRef]
- Ishak, N.A.I.M.; Kamarudin, S.K.; Timmiati, S.N.; Karim, N.A.; Basri, S. Biogenic platinum from agricultural wastes extract for improved methanol oxidation reaction in direct methanol fuel cell. J. Adv. Res. 2021, 28, 63–75. [Google Scholar] [CrossRef]
- Yadav, P.; Athanassiadis, D.; Yacout, D.M.M.; Tysklind, M.; Upadhyayula, V.K.K. Environmental Impact and Environmental Cost Assessment of Methanol Production from wood biomass. Environ. Pollut. 2020, 265, 114990. [Google Scholar] [CrossRef] [PubMed]
- Lythcke-Jørgensen, C.E.; Clausen, L.R.; Algren, L.; Bavnhøj Hansen, A.; Münster, M.; Gadsbøll, R.Ø.; Haglind, F. Optimization of a flexible multi-generation system based on wood chip gasification and methanol production. Appl. Energy 2017, 192, 337–359. [Google Scholar] [CrossRef] [Green Version]
- Laloui-Carpentier, W.; Li, T.; Vigneron, V.; Mazéas, L.; Bouchez, T. Methanogenic diversity and activity in municipal solid waste landfill leachates. Antonie Van Leeuwenhoek 2006, 89, 423–434. [Google Scholar] [CrossRef] [PubMed]
- Niziolek, A.M.; Onel, O.; Hasan, M.M.F.; Floudas, C.A. Municipal solid waste to liquid transportation fuels—Part II: Process synthesis and global optimization strategies. Comput. Chem. Eng. 2015, 74, 184–203. [Google Scholar] [CrossRef]
- Kiss, A.A.; Pragt, J.J.; Vos, H.J.; Bargeman, G.; De-Groot, M.T. Novel efficient process for methanol synthesis by CO2 hydrogenation. Chem. Eng. J. 2016, 284, 260–269. [Google Scholar] [CrossRef] [Green Version]
- Pérez-Fortes, M.; Schöneberger, J.C.; Boulamanti, A.; Tzimas, E. Methanol synthesis using captured CO2 as raw material: Techno-economic and environmental assessment. Appl. Energy 2016, 161, 718–732. [Google Scholar] [CrossRef]
- Leonzio, G.; Zondervan, E.; Foscolo, P.U. Methanol production by CO2 hydrogenation: Analysis and simulation of reactor performance. Int. J. Hydrogen Energy 2019, 44, 7915–7933. [Google Scholar] [CrossRef]
- Enerkem. Reducing Greenhouse Gas Emissions and Making Everyday Products Greener While Offering a Sustainable Alternative to Landfilling, Incineration, and Other Technologies. 2021. Available online: https://enerkem.com/process-technology/technology-comparison/ (accessed on 9 April 2021).
- Södra. Refuelling the Future. 2020. Available online: https://www.sodra.com/en/global/Bioproducts/biomethanol/ (accessed on 9 April 2021).
- Christensen, C.H.; Johannessen, T.; Sorensen, R.Z.; Norskov, J.K. Towards an ammonia-mediated hydrogen economy? Catal. Today 2006, 111, 140–144. [Google Scholar] [CrossRef]
- Zamfirescu, C.; Dincer, I. Using ammonia as a sustainable fuel. J. Power Source 2008, 185, 459–465. [Google Scholar] [CrossRef]
- NIST: National Institute of Standards and Technology. Chemistry WebBook, SRD 69, Thermophysical Properties of Fluid Systems. 2020. Available online: http://webbook.nist.gov/chemistry/fluid/ (accessed on 9 April 2021).
- Zamfirescu, C.; Dincer, I. Ammonia as a green fuel and hydrogen source for vehicular applications. Fuel Process. Technol. 2009, 90, 729–737. [Google Scholar] [CrossRef]
- Aziz, M.; Putranto, A.; Biddinika, M.K.; Wijayanta, A.T. Energy-saving combination of N2 production, NH3 synthesis, and power generation. Int. J. Hydrogen Energy 2017, 42, 27174–27183. [Google Scholar] [CrossRef]
- Ozturk, M.; Dincer, I. An integrated system for ammonia production from renewable hydrogen: A case study. Int. J. Hydrogen Energy 2021, 46, 5918–5925. [Google Scholar] [CrossRef]
- Liu, X.; Elgowainya, A.; Wanga, M. Life cycle energy use and greenhouse gas emissions of ammonia production from renewable resources and industrial by-products. Green Chem. 2020, 22, 5751–5761. [Google Scholar] [CrossRef]
- Baltrusaitis, J. Sustainable Ammonia Production. ACS Sustain. Chem. Eng. 2017, 5, 9527. [Google Scholar] [CrossRef] [Green Version]
- Bicer, Y.; Dincer, I.; Vezina, G.; Raso, F. Impact Assessment and Environmental Evaluation of Various Ammonia Production Processes. Environ. Manag. 2017, 59, 842–855. [Google Scholar] [CrossRef]
- Zhang, H.; Wang, L.; Herle, J.V.; Maréchal, F.; Desideri, U. Techno-economic comparison of green ammonia production processes. Appl. Energy 2020, 259, 114135. [Google Scholar] [CrossRef]
- Giddey, S.; Badwal, S.P.S.; Kulkarni, A. Review of electrochemical ammonia production technologies and materials. Int. J. Hydrogen Energy 2013, 38, 14576–14594. [Google Scholar] [CrossRef]
- Frattini, D.; Cinti, G.; Bidini, G.; Desideri, U.; Cioffi, R.; Jannelli, E. A system approach in energy evaluation of different renewable energies sources integration in ammonia production plants. Renew. Energy 2016, 99, 472–482. [Google Scholar] [CrossRef]
- Braissant, O.; McLin, V.A.; Cudalbu, C. Ammonia toxicity to the brain. J. Inherit. Metab. Dis. 2013, 36, 595–612. [Google Scholar] [CrossRef] [Green Version]
- Zhang, M.; Li, M.; Wang, R.; Qian, Y. Effects of acute ammonia toxicity on oxidative stress, immune response and apoptosis of juvenile yellow catfish Pelteobagrus fulvidraco and the mitigation of exogenous taurine. Fish Shellfish Immunol. 2018, 79, 313–320. [Google Scholar] [CrossRef]
- Kojima, Y.; Yamaguchi, M. Ammonia storage materials for nitrogen recycling hydrogen and energy carriers. Int. J. Hydrogen Energy 2020, 45, 10233–10246. [Google Scholar] [CrossRef]
- Lu, B.; Jin, Q.; Chu, L.; Pan, Y.; Tao, X.; Yang, L.; Shen, Y. Ammonia storage/release characteristics of CeSnWBaOx/TiO2 catalyst in solving the problem of ammonia slip. Process Saf. Environ. Prot. 2020, 138, 67–75. [Google Scholar] [CrossRef]
- Lamb, K.E.; Dolan, M.D.; Kennedy, D.F. Ammonia for hydrogen storage; A review of catalytic ammonia decomposition and hydrogen separation and purification. Int. J. Hydrogen Energy 2019, 44, 3580–3593. [Google Scholar] [CrossRef]
- Cardoso, J.S.; Silva, V.; Rocha, R.C.; Hall, M.J.; Costa, M.; Eusébio, D. Ammonia as an energy vector: Current and future prospects for low-carbon fuel applications in internal combustion engines. J. Clean. Prod. 2021, 296, 126562. [Google Scholar] [CrossRef]
- Comotti, M.; Frigo, S. Hydrogen generation system for ammonia–hydrogen fuelled internal combustion engines. Int. J. Hydrogen Energy 2015, 40, 10673–10686. [Google Scholar] [CrossRef]
- Lee, D.; Song, H.H. Development of combustion strategy for the internal combustion engine fueled by ammonia and its operating characteristics. J. Mech. Sci. Technol. 2018, 32, 1905–1925. [Google Scholar] [CrossRef]
- Peng, Y.; Li, X.; Wang, W.; Wei, Z.; Bing, X.; Song, X. A method for determining the allocation strategy of on-shore power supply from a green container terminal perspective. Ocean Coast. Manag. 2019, 167, 158–175. [Google Scholar] [CrossRef]
- Sciberras, E.A.; Zahawi, B.; Atkinson, D.J.; Juandó, A.; Sarasquete, A. Cold ironing and onshore generation for airborne emission reductions in ports. Proc. Inst. Mech. Eng. Part M J. Eng. Marit. Environ. 2016, 230, 67–82. [Google Scholar] [CrossRef] [Green Version]
- IEA. Global Electricity Generation Mix by Scenario, 2018, Stated Policies and Sustainable Development Scenarios 2040. 2019. Available online: https://www.iea.org/data-and-statistics/charts/global-electricity-generation-mix-by-scenario-2018-stated-policies-and-sustainable-development-scenarios-2040 (accessed on 12 April 2021).
- IEA. Global Energy Review 2020. 2020. Available online: https://www.iea.org/reports/global-energy-review-2020/electricity (accessed on 12 April 2021).
- Hsieh, I.; Pan, M.S.; Chiang, Y.; Green, W.H. Learning only buys you so much: Practical limits on battery price reduction. Appl. Energy 2019, 239, 218–224. [Google Scholar] [CrossRef]
- Eurostate. Wind and Water Provide Most Renewable Electricity. 2020. Available online: https://ec.europa.eu/eurostat/web/products-eurostat-news/-/DDN-20200129-1 (accessed on 12 April 2021).
- The Danish Ministry of Climate. Our Future Energy: The Danish Government 2011; The Danish Ministry of Climate: Copenhagen, Denmark, 2012. Available online: http://www.ens.dk/sites/en.sdk/files/policy/danish-climate-energy-policy/our_future_energy.pdf (accessed on 13 April 2021).
- DNV. Decarbonization in Shipping. 2021. Available online: https://www.dnv.com/maritime/insights/topics/decarbonization-in-shipping/regulatory-overview.html (accessed on 19 May 2021).
- Hansson, J.; Månsson, S.; Brynolf, S.; Grahn, M. Alternative marine fuels: Prospects based on multi-criteria decision analysis involving Swedish stakeholders. Biomass Bioenergy 2016, 126, 159–173. [Google Scholar] [CrossRef]
- Kim, K.; Roh, G.; Kim, W.; Chun, K. A Preliminary Study on an Alternative Ship Propulsion System Fueled by Ammonia: Environmental and Economic Assessments. J. Mar. Sci. Eng. 2020, 8, 183. [Google Scholar] [CrossRef] [Green Version]
- Thiam, H.S.; Daud, W.R.W.; Kamarudin, S.K.; Mohamad, A.B.; Kadhum, A.A.H.; Loh, K.S.; Majlan, E.H. Performance of direct methanol fuel cell with a palladium–silica nanofibre/Nafion composite membrane. Energy Convers. Manag. 2013, 75, 718–726. [Google Scholar] [CrossRef]
- Sharaf, O.Z.; Orhan, M.F. An overview of fuel cell technology: Fundamentals and applications. Renew. Sustain. Energy Rev. 2014, 32, 810–853. [Google Scholar] [CrossRef]
- Tse, L.K.C.; Wilkins, S.; McGlashan, N.; Urban, B.; Martinez-Botas, R. Solid oxide fuel cell/gas turbine trigeneration system for marine applications. J. Power Sources 2011, 196, 3149–3162. [Google Scholar] [CrossRef]
- Welaya, Y.M.A.; Mosleha, M.; Ammar, N.R. Thermodynamic analysis of a combined gas turbine power plant with a solid oxide fuel cell for marine applications. Int. J. Naval Arch. Ocean Eng. 2013, 5, 529–545. [Google Scholar] [CrossRef] [Green Version]
- DimopoulosIason, G.G.; Nikolaos, C.S.; Kakalis, M.P. Exergy analysis and optimisation of a marine molten carbonate fuel cell system in simple and combined cycle configuration. Energy Convers. Manag. 2016, 107, 10–21. [Google Scholar] [CrossRef]
- Nakajima, H.; Kitahara, T. Real-time electrochemical impedance spectroscopy diagnosis of the solid oxide fuel cell for marine power applications. Heat Mass Transf. 2018, 54, 2551–2558. [Google Scholar] [CrossRef]
- Leo, T.J.; Durango, J.A.; Navarro, E. Exergy analysis of PEM fuel cells for marine applications. Energy 2010, 35, 1164–1171. [Google Scholar] [CrossRef]
- Mekhilef, S.; Saidur, R.; Safaria, A. Comparative study of different fuel cell technologies. Renew. Sustain. Energy Rev. 2013, 16, 981–989. [Google Scholar] [CrossRef]
- Berit, L.V.; Godjevac, M.; Visser, K.; Aravind, P.V. A review of fuel cell systems for maritime applications. J. Power Sources 2016, 327, 356–364. [Google Scholar]
- Nordregio. Ampere, the World’s First Electric Ferry. Ship Technology. 2021. Available online: https://archive.nordregio.se/en/Publications/Publications-2016/GREEN-GROWTH-IN-NORDIC-REGIONS-50-ways-to-make-/Clean-tech-and-renewable-energy--/Amper/index.html (accessed on 14 April 2021).
- Macola, I.G. Electric Ships: The World’s Top Five Projects by Battery Capacity. Ship Technology. 2020. Available online: https://www.ship-technology.com/features/electric-ships-the-world-top-five-projects-by-battery-capacity/ (accessed on 14 April 2021).
- Alnes, O.; Eriksen, S.; Vartdal, B.J. Battery-powered ships: A class society perspective. IEEE Electrif. Mag. 2017, 5, 10–21. [Google Scholar] [CrossRef]
- Stančin, H.; Mikulčić, H.; Wang, X.; Duić, N. A review on alternative fuels in future energy system. Renew. Sustain. Energy Rev. 2020, 128, 109927. [Google Scholar] [CrossRef]
- Vandebroek, L.; Berghman, J. Safety Aspects of the use of LNG for Marine Propulsion. Procedia Eng. 2012, 45, 21–26. [Google Scholar] [CrossRef] [Green Version]
- Veldhuis, I.J.S.; Richardson, R.N.; Stone, H.B.J. Hydrogen fuel in a marine environment. Int. J. Hydrogen Energy 2007, 32, 2553–2566. [Google Scholar] [CrossRef]
- Kobayashi, H.; Hayakawa, A.; Somarathne, K.D.K.A.; Okafor, E.C. Science and technology of ammonia combustion. Proc. Combust. Inst. 2019, 37, 109–133. [Google Scholar] [CrossRef]
- Ghorbani, A. A comparative study of combustion performance and emission of biodiesel blends and diesel in an experimental boiler. Appl. Energy 2011, 88, 4725–4732. [Google Scholar] [CrossRef]
- Coronado, C.R.; Carvalho, J.A.; Yoshioka, J.T.; Silveira, J.L. Determination of ecological efficiency in internal combustion engines: The use of biodiesel. Appl. Therm. Eng. 2009, 29, 1887–1892. [Google Scholar] [CrossRef]
- Siddiqui, O.; Ishaq, H.; Dincer, I. Experimental investigation of improvement capability of ammonia fuel cell performance with addition of hydrogen. Energy Convers. Manag. 2020, 205, 112372. [Google Scholar] [CrossRef]
- Wang, Y.; Gu, Y.; Zhang, H.; Yang, J.; Wang, J.; Guan, W.; Chen, J.; Chi, B.; Jia, L.; Muroyama, H.; et al. Efficient and durable ammonia power generation by symmetric flat-tube solid oxide fuel cells. Appl. Energy 2020, 270, 115185. [Google Scholar] [CrossRef]
- Ye, F.; Wang, Z.; Xu, C.; Yuan, M.; Liu, P.; Yang, W.; Liu, G. Mechanism and kinetic study of pulse electrodeposition process of Pt/C catalysts for fuel cells. Renew. Energy 2020, 145, 514–520. [Google Scholar] [CrossRef]
- Huo, S.; Jiao, K.; Park, J.W. On the water transport behavior and phase transition mechanisms in cold start operation of PEM fuel cell. Appl. Energy 2019, 233–234, 776–788. [Google Scholar] [CrossRef]
- DNV. Maritime Forecast to 2050—Energy Transition Outlook. 2018. Available online: https://eto.dnv.com/2018/maritime (accessed on 18 May 2021).
- Gallucci, M. Why the Shipping Industry Is Betting Big on Ammonia. IEEE Spectrum. 2021. Available online: https://spectrum.ieee.org/transportation/marine/why-the-shipping-industry-is-betting-big-on-ammonia (accessed on 28 April 2021).
- Andersson, K.; Salazar, C.M.; Methanol as a Marine Fuel. FCBI Energy. 2015. Available online: https://www.methanol.org/wp-content/uploads/2018/03/FCBI-Methanol-Marine-Fuel-Report-Final-English.pdf (accessed on 27 May 2021).
- Noor, C.W.; Noor, M.M.; Mamat, R. Biodiesel as alternative fuel for marine diesel engine applications: A review. Renew. Sustain. Energy Rev. 2018, 94, 127–142. [Google Scholar] [CrossRef]
- Thomson, H.; Corbett, J.J.; Winebrake, J.J. Natural gas as a marine fuel. Energy Policy 2015, 87, 153–167. [Google Scholar] [CrossRef] [Green Version]
- IPCC. Fifth Assessment Report. 2014. Available online: https://www.ipcc.ch/assessment-report/ar5/ (accessed on 28 May 2021).
- Perčić, M.; Ančić, I.; Vladimir, N. Life-cycle cost assessments of different power system configurations to reduce the carbon footprint in the Croatian short-sea shipping sector. Renew. Sustain. Energy Rev. 2020, 131, 11002. [Google Scholar] [CrossRef]
- Lombardi, L.; Tribioli, L.; Cozzolino, R.; Bella, G. Comparative environmental assessment of conventional, electric, hybrid, and fuel cell powertrains based on LCA. Int. J. Life Cycle Assess. 2017, 22, 1989–2006. [Google Scholar] [CrossRef]
- Pereira, L.; Posen, I.D. Lifecycle greenhouse gas emissions from electricity in the province of Ontario at different temporal resolutions. J. Clean. Prod. 2020, 270, 122514. [Google Scholar] [CrossRef]
- Barros, M.V.; Salvador, R.; Piekarski, C.M.; Francisco, A.C.; Freire, F.M.C.S. Life cycle assessment of electricity generation: A review of the characteristics of existing literature. Int. J. Life Cycle Assess. 2020, 25, 36–54. [Google Scholar] [CrossRef]
- Hoekman, S.K.; Robbins, C. Review of the effects of biodiesel on NOx emissions. Fuel Process. Technol. 2012, 96, 237–249. [Google Scholar] [CrossRef]
- Palash, S.M.; Kalam, M.A.; Masjuki, H.H.; Masum, B.M.; Rizwanul Fattah, I.M.; Mofijur, M. Impacts of biodiesel combustion on NOx emissions and their reduction approaches. Renew. Sustain. Energy Rev. 2013, 23, 473–490. [Google Scholar] [CrossRef]
- Agarwal, D.; Sinha, S.; Agarwal, A.K. Experimental investigation of control of NOx emissions in biodiesel-fueled compression ignition engine. Renew. Energy 2006, 31, 2356–2369. [Google Scholar] [CrossRef]
- Varatharajan, K.; Cheralathan, M. Influence of fuel properties and composition on NOx emissions from biodiesel powered diesel engines: A review. Renew. Sustain. Energy Rev. 2012, 16, 3702–3710. [Google Scholar] [CrossRef]
- Gokalp, B.; Buyukkaya, E.; Soyhan, H. Performance and emissions of a diesel tractor engine fueled with marine diesel and soybean methyl ester. Biomass Bioenergy 2011, 35, 3575–3583. [Google Scholar] [CrossRef]
- Stenersen, D.; Thonstad, O. GHG and NOx Emissions from Gas Fuelled Engines; SINTEF: Trondheim, Norway, 2017; Available online: https://midc.be/wp-content/uploads/2018/06/methane-slip-from-gas-engines-mainreport-1492296.pdf (accessed on 4 May 2021).
- Sharafian, A.; Blomerus, P.; Mérida, W. Natural gas as a ship fuel: Assessment of greenhouse gas and air pollutant reduction potential. Energy Policy 2019, 131, 332–346. [Google Scholar] [CrossRef]
- Jang, H.; Jeong, B.; Zhou, P.; Ha, S.; Nam, D. Demystifying the lifecycle environmental benefits and harms of LNG as marine fuel. Appl. Energy 2021, 292, 116869. [Google Scholar] [CrossRef]
- Gonzalez-Fernandez, C.; Barreiro-Vescovo, S.; de Godos, I.; Fernandez, M.; Zouhayr, A.; Ballesteros, M. Biochemical methane potential of microalgae biomass using different microbial inocula. Biotechnol. Biofuels 2018, 11, 184. [Google Scholar] [CrossRef] [PubMed]
- Lerner, A.; Brear, M.J.; Lacey, J.S.; Gordon, R.L.; Webley, P.A. Webley, Life cycle analysis (LCA) of low emission methanol and di-methyl ether (DME) derived from natural gas. Fuel 2018, 220, 871–878. [Google Scholar] [CrossRef]
- Svanberg, M.; Ellis, J.; Lundgren, J.; Landälv, I. Renewable methanol as a fuel for the shipping industry. Renew. Sustain. Energy Rev. 2018, 94, 1217–1228. [Google Scholar] [CrossRef]
- Verhelst, S.; Turner, J.; Sileghem, L.; Vancoillie, J. Methanol as a fuel for internal combustion engines. Prog. Energy Combust. Sci. 2019, 70, 43–88. [Google Scholar] [CrossRef] [Green Version]
- Ammar, N.R. An environmental and economic analysis of methanol fuel for a cellular container ship. Transp. Res. Part D Transp. Environ. 2019, 69, 66–76. [Google Scholar] [CrossRef]
- Eggemann, L.; Escobar, N.; Peters, R.; Burauel, P.; Stolten, D. Life cycle assessment of a small-scale methanol production system: A Power-to-Fuel strategy for biogas plants. J. Clean. Prod. 2020, 271, 122476. [Google Scholar] [CrossRef]
- Salkuyeh, Y.K.; Saville, B.A.; MacLean, H.L. Techno-economic analysis and life cycle assessment of hydrogen production from natural gas using current and emerging technologies. Int. J. Hydrogen Energy 2017, 42, 18894–18909. [Google Scholar] [CrossRef]
- Wang, Z.; Li, L.; Zhang, G. Life cycle greenhouse gas assessment of hydrogen production via chemical looping combustion thermally coupled steam reforming. J. Clean. Prod. 2018, 179, 335–346. [Google Scholar] [CrossRef]
- Siddiqui, O.; Dincer, I. A well to pump life cycle environmental impact assessment of some hydrogen production routes. Int. J. Hydrogen Energy 2019, 44, 5773–5786. [Google Scholar] [CrossRef]
- Valente, A.; Iribarren, D.; Dufour, J. Comparative life cycle sustainability assessment of renewable and conventional hydrogen. Sci. Total Environ. 2021, 756, 144132. [Google Scholar] [CrossRef] [PubMed]
- Cetinkaya, E.; Dincer, I.; Naterer, G.F. Life cycle assessment of various hydrogen production methods. Int. J. Hydrogen Energy 2012, 37, 2071–2080. [Google Scholar] [CrossRef]
- Cox, B.; Treyer, K. Environmental and economic assessment of a cracked ammonia fuelled alkaline fuel cell for off-grid power applications. J. Power Sources 2015, 275, 322–335. [Google Scholar] [CrossRef]
- Arora, P.; Hoadley, A.F.A.; Mahajani, S.M.; Ganesh, A. Multi-objective optimization of biomass based ammonia production—Potential and perspective in different countries. J. Clean. Prod. 2017, 148, 363–374. [Google Scholar] [CrossRef]
- Bicer, Y.; Dincer, I.; Zamfirescu, C.; Vezina, G.; Raso, F. Comparative life cycle assessment of various ammonia production methods. J. Clean. Prod. 2016, 135, 1379–1395. [Google Scholar] [CrossRef]
- Gilbert, P.; Alexander, S.; Thornley, P.; Brammer, J. Assessing economically viable carbon reductions for the production of ammonia from biomass gasification. J. Clean. Prod. 2014, 64, 581–589. [Google Scholar] [CrossRef]
- Arora, P.; Hoadley, A.; Mahajani, S. Sustainability Assessment of the Biomass Gasification Process for Production of Ammonia. In Coal and Biomass Gasification; De, S., Agarwal, A., Moholkar, V., Thallada, B., Eds.; Springer: Singapore, 2018; pp. 351–367. [Google Scholar]
- Bengtsson, S.; Fridell, E.; Andersson, K. Environmental assessment of two pathways towards the use of biofuels in shipping. Energy Policy 2012, 44, 451–463. [Google Scholar] [CrossRef]
- Tanzer, S.E.; Posada, J.; Geraedts, S.; Ramírez, A. Lignocellulosic marine biofuel: Technoeconomic and environmental assessment for production in Brazil and Sweden. J. Clean. Prod. 2019, 239, 117845. [Google Scholar] [CrossRef]
- ICCT. The Potential of Liquid Biofuels in Reducing Ship Emissions. 2020. Available online: https://theicct.org/sites/default/files/publications/Marine-biofuels-sept2020.pdf (accessed on 24 May 2021).
- Yegorov, Y. Socio-economic influences of population density. Chin. Bus. Rev. 2009, 8, 1–12. [Google Scholar]
- EIA. Henry Hub Natural Gas Spot Price. 2021. Available online: https://www.eia.gov/dnav/ng/hist/rngwhhdm.htm (accessed on 11 May 2021).
- Algelli, J.; Bakosch, A.; Forsman, B. Feasibility Study on LNG Fuelled Short Sea and Coastal Shipping in the Wider Caribbean Region; SSPA: Goteborg, Sweden, 2012; Available online: http://www.wpci.nl/lng/sites/default/files/2012,%20SSPA%20Feasibility%20study%20on%20LNG%20fuelled%20short%20sea%20and%20coastal%20shipping%20in%20the%20wider%20Caribbean%20Region.pdf (accessed on 13 May 2021).
- Cloete, S.; Hirth, L. Flexible power and hydrogen production: Finding synergy between CCS and variable renewables. Energy 2020, 192, 116671. [Google Scholar] [CrossRef]
- Hydrogen Council. Path to Hydrogen Competitiveness: A Cost Perspective. 2020. Available online: https://hydrogencouncil.com/wp-content/uploads/2020/01/Path-to-Hydrogen-Competitiveness_Full-Study-1.pdf (accessed on 11 May 2021).
- IEA. World Energy Outlook 2020. 2020. Available online: https://www.iea.org/reports/world-energy-outlook-2020 (accessed on 12 April 2021).
- IEA. Outlook for Biogas and Biomethane: Prospects for Organic Growth. 2020. Available online: https://www.iea.org/reports/outlook-for-biogas-and-biomethane-prospects-for-organic-growth/sustainable-supply-potential-and-costs (accessed on 12 May 2021).
- Gaurav, A.; Ng, F.T.T.; Rempel, G.L. A new green process for biodiesel production from waste oils via catalytic distillation using a solid acid catalyst—Modeling, economic and environmental analysis. Green Energy Environ. 2016, 1, 62–74. [Google Scholar] [CrossRef] [Green Version]
- Apostolakou, A.A.; Kookos, I.K.; Marazioti, C.; Angelopoulos, K.C. Techno-economic analysis of a biodiesel production process from vegetable oils. Fuel Process. Technol. 2009, 90, 1023–1031. [Google Scholar] [CrossRef]
- Colombo, K.; Ender, L.; Barros, A.A.C. The study of biodiesel production using CaO as a heterogeneous catalytic reaction. Egypt. J. Pet. 2017, 26, 341–349. [Google Scholar] [CrossRef] [Green Version]
- Mizik, T.; Gyarmati, G. Economic and Sustainability of Biodiesel Production—A Systematic Literature Review. Clean Technol. 2021, 3, 19–36. [Google Scholar] [CrossRef]
- Cremonez, P.A.; Feroldi, M.; Nadaleti, W.C.; de Rossi, E.; Feiden, A.; de Camargo, M.P.; Cremonez, F.E.; Klajn, F.F. Biodiesel production in Brazil: Current scenario and perspectives. Renew. Sustain. Energy Rev. 2015, 42, 415–428. [Google Scholar] [CrossRef]
- European Commission. Directive (EU) 2015/1513 of the European Parliament and of the council of 9 September 2015 amending Directive 98/70/EC relating to the quality of petrol and diesel fuels and amending Directive 2009/28/EC on the promotion of the use of energy from renewable sources. Off. J. Eur. Union 2015, 239, 1–29. [Google Scholar]
- OECD/FAO. OECD-FAO Agricultural Outlook 2020–2029. 2020. Available online: https://www.oecd-ilibrary.org/agriculture-and-food/oecd-fao-agricultural-outlook-2020-2029_1112c23b-en (accessed on 11 May 2021).
- Ship & Bunker. Global Average 20 Ports Bunker Prices. Available online: https://shipandbunker.com/prices/emea/nwe/nl-rtm-rotterdam#MGO (accessed on 27 May 2021).
- Fulwood, M. Asia LNG Price Spike: Perfect Storm or Structural Failure? Oxford Institute for Energy Studies: Oxford, UK, 2021; Available online: https://www.oxfordenergy.org/publications/asia-lng-price-spike-perfect-storm-or-structural-failure/ (accessed on 27 May 2021).
- Steuer, C. Outlook for Competitive LNG Supply; Oxford Institute for Energy Studies: Oxford, UK, 2019; Available online: https://www.oxfordenergy.org/wpcms/wp-content/uploads/2019/03/Outlook-for-Competitive-LNG-Supply-NG-142.pdf (accessed on 27 May 2021).
- Auburger, S.; Petig, E.; Bahrs, E. Assessment of grassland as biogas feedstock in terms of production costs and greenhouse gas emissions in exemplary federal states of Germany. Biomass Bioenergy 2017, 101, 44–52. [Google Scholar] [CrossRef]
- Blumberg, T.; Tsatsaronis, G.; Morosuk, T. On the economics of methanol production from natural gas. Fuel 2019, 256, 115824. [Google Scholar] [CrossRef]
- Li, J.; Ma, S.; Liu, H.; Zhang, X. Life cycle assessment and economic analysis of methanol production from coke oven gas compared with coal and natural gas routes. J. Clean. Prod. 2018, 185, 299–308. [Google Scholar] [CrossRef]
- Pellegrini, L.A.; Soave, G.; Gamba, S.; Langè, S. Economic analysis of a combined energy–methanol production plant. Appl. Energy 2011, 88, 4891–4897. [Google Scholar] [CrossRef]
- Lemus, R.G.; Duart, J.M.M. Updated hydrogen production costs and parities for conventional and renewable technologies. Int. J. Hydrogen Energy 2010, 35, 3929–3936. [Google Scholar] [CrossRef]
- Nikolaidis, P.; Poullikkas, A. A comparative overview of hydrogen production processes. Renew. Sustain. Energy Rev. 2017, 67, 597–611. [Google Scholar] [CrossRef]
- Jechura, J. Hydrogen from Natural Gas via Steam Methane Reforming; Colorado School of Mines: Golden, CO, USA, 2015; Available online: https://inside.mines.edu/~jjechura/EnergyTech/07_Hydrogen_from_SMR.pdf (accessed on 12 May 2021).
- Lee, B.; Chae, H.; Choi, N.H.; Moon, C.; Moon, S.; Lim, H. Economic evaluation with sensitivity and profitability analysis for hydrogen production from water electrolysis in Korea. Int. J. Hydrogen Energy 2017, 42, 6462–6471. [Google Scholar] [CrossRef]
- Fasihi, M.; Weiss, R.; Savolainen, J.; Breyer, C. Global potential of green ammonia based on hybrid PV-wind power plants. Appl. Energy 2021, 294, 116170. [Google Scholar] [CrossRef]
- Boulamanti, A.; Moya, J.A. Production costs of the chemical industry in the EU and other countries: Ammonia, methanol and light olefins. Renew. Sustain. Energy Rev. 2017, 68, 1205–1212. [Google Scholar] [CrossRef]
- Armijo, J.; Philibert, C. Flexible production of green hydrogen and ammonia from variable solar and wind energy: Case study of Chile and Argentina. Int. J. Hydrogen Energy 2020, 45, 1541–1558. [Google Scholar] [CrossRef]
- Nayak-Luke, R.; Alcántara, R.B. Techno-economic viability of islanded green ammonia as a carbon-free energy vector and as a substitute for conventional production. Energy Environ. Sci. 2020, 13, 2957–2966. [Google Scholar] [CrossRef]
- Nayak-Luke, R.; Alcántara, R.B.; Wilkinson, I. “Green” Ammonia: Impact of Renewable Energy Intermittency on Plant Sizing and Levelized Cost of Ammonia. Ind. Eng. Chem. Res. 2018, 57, 14607–14616. [Google Scholar] [CrossRef] [Green Version]
- Faber, J.; Nelissen, D.; Ahdour, S.; Harmsen, J.; Toma, S.; Lebesque, L. Study on the Completion of an EU Framework on LNG-Fuelled Ships and Its Relevant Fuel Provision Infrastructure; European Commission: Bruxelles, Belgium, 2015; Available online: https://ec.europa.eu/transport/sites/transport/files/2015-12-lng-lot3.pdf (accessed on 17 May 2021).
- Baldi, F.; Brynolf, S.; Maréchal, F. The cost of innovative and sustainable future ship energy systems. In Proceedings of the ECOS 2019—32nd International Conference of Efficiency, Cost, Optimization, Simulation and Environmental Impact of Energy Systems, Wroclaw, Poland, 23–28 June 2019. [Google Scholar]
- Kryshtopa, S.; Górski, K.; Longwic, R.; Smigins, R.; Kryshtopa, L. Increasing Parameters of Diesel Engines by Their Transformation for Methanol Conversion Products. Energies 2021, 14, 1710. [Google Scholar] [CrossRef]
- Lloyd’s Register. Techno-Economic Assessment of Zero-Carbon Fuels. Lloyd’s Register. 2020. Available online: https://www.lr.org/en/insights/global-marine-trends-2030/techno-economic-assessment-of-zero-carbon-fuels/ (accessed on 19 May 2021).
- Xing, H.; Stuart, C.; Spence, S.; Chen, H. Fuel Cell Power Systems for Maritime Applications: Progress and Perspectives. Sustainability 2021, 13, 1213. [Google Scholar] [CrossRef]
- Troya, J.J.; Álvarez, C.; Fernández-Garrido, C.; Carral, L. Analysing the possibilities of using fuel cells in ships. Int. J. Hydrogen Energy 2016, 41, 2853–2866. [Google Scholar] [CrossRef]
- Kim, H.; Koo, K.Y.; Joung, T. A study on the necessity of integrated evaluation of alternative marine fuels. J. Int. Marit. Saf. Environ. Aff. Shipp. 2020, 4, 26–31. [Google Scholar]
- Horvath, S.; Fasihi, M.; Breyer, C. Techno-economic analysis of a decarbonized shipping sector: Technology suggestions for a fleet in 2030 and 2040. Energy Convers. Manag. 2018, 164, 230–241. [Google Scholar] [CrossRef]
- Vora, S.D. U.S. DOE Office of Fossil Energy Solid Oxide Fuel Cell Program. Available online: https://netl.doe.gov/coal/fuel-cells (accessed on 25 May 2021).
- Korberg, A.D.; Brynolf, S.; Grahn, M.; Skov, I.R. Techno-economic assessment of advanced fuels and propulsion systems in future fossil-free ships. Renew. Sustain. Energy Rev. 2021, 142, 110861. [Google Scholar] [CrossRef]
- Jensen, J.O.; Vestbø, A.P.; Li, Q.; Bjerrum, N.J. The energy efficiency of onboard hydrogen storage. J. Alloys Compd. 2007, 446–447, 723–728. [Google Scholar] [CrossRef] [Green Version]
- Ananthachar, V.; Duffy, J.J. Efficiencies of hydrogen storage systems onboard fuel cell vehicles. Sol. Energy 2005, 78, 687–694. [Google Scholar] [CrossRef]
- James, B.D.; Houchins, C.; Huya-Kouadio, J.M.; DeSantis, D.A. Final Report: Hydrogen Storage System Cost Analysis. Available online: https://www.osti.gov/servlets/purl/1343975 (accessed on 18 May 2021).
- Houchins, C.; James, B.D. 2020 DOE Hydrogen and Fuel Cells Program Review. Strategic Analysis. 2020. Available online: https://www.hydrogen.energy.gov/pdfs/review20/st100_houchins_2020_o.pdf (accessed on 18 May 2021).
- Wang, Y.; Wright, L.; Zhang, P. Economic feasibility of LNG fuel for trans ocean-going ships: A case study of container ships. Marit. Technol. Res. 2021, 3, 202–222. [Google Scholar] [CrossRef]
- EMSA. Study on Electrical Energy Storage for Ships. 2020. Available online: file:///C:/Users/tune/Downloads/study%20electrical%20energy%20storage%20for%20ships%20(2).pdf (accessed on 22 May 2021).
- MDA, A.; Coleiro, J.; Jayasinghe, S.D.G.; Enshaei, H.; Garaniya, V.; Baguley, C.; Madawala, U. Techno-Economic Feasibility Study of Battery- Powered Ferries. In Proceedings of the 4th Southern Power Electronics Conference (SPEC 2018), Singapore, 10–13 December 2018; pp. 1–7. [Google Scholar]
- DOE. Manufacturing Cost Analysis of 100 and 250 kW Fuel Cell Systems for Primary Power and Combined Heat and Power Applications. 2016. Available online: https://www.energy.gov/sites/prod/files/2016/07/f33/fcto_battelle_mfg_cost_analysis_pp_chp_fc_systems.pdf (accessed on 27 May 2021).
- Haidl, P.; Buchroithner, A.; Schweighofer, B.; Bader, M.; Wegleiter, H. Lifetime Analysis of Energy Storage Systems for Sustainable Transportation. Sustainability 2019, 11, 6731. [Google Scholar] [CrossRef] [Green Version]
- Hasanuzzaman, H.; Zubir, U.S.; Ilham, N.I.; Che, H. Global electricity demand, generation, grid system, and renewable energy polices: A review. Wiley Interdiscip. Rev. Energy Environ. 2017, 6, e222. [Google Scholar] [CrossRef]
- Penisa, X.N.; Castro, M.T.; Pascasio, J.D.A.; Esparcia, E.A., Jr.; Schmidt, O.; Ocon, J.D. Projecting the Price of Lithium-Ion NMC Battery Packs Using a Multifactor Learning Curve Model. Energies 2020, 13, 5276. [Google Scholar] [CrossRef]
- Wang, Z.; Carriveau, R.; Ting, D.S.K.; Xiong, W.; Wang, Z. A review of marine renewable energy storage. Spec. Issue Prog. Energy Storage Syst. 2019, 43, 6108–6150. [Google Scholar] [CrossRef]
- Lee, T.; Nam, H.A. Study on Green Shipping in Major Countries: In the View of Shipyards, Shipping Companies, Ports, and Policies. Asian J. Shipp. Logist. 2017, 33, 253–262. [Google Scholar] [CrossRef]
- Traut, M.; Larkin, A.; Anderson, K.; McGlade, C.; Sharmina, M.; Smith, T. CO2 abatement goals for international shipping. Clim. Policy 2018, 18, 1066–1075. [Google Scholar] [CrossRef] [Green Version]
- Guerin, K. Property Rights and Environmental Policy: A New Zealand Perspective. 2003. Available online: https://ideas.repec.org/p/nzt/nztwps/03-02.html (accessed on 18 May 2021).
- Puja, S. Environmental Regulations: Lessons from the Command-and-Control Approach. Available online: https://www.econstor.eu/bitstream/10419/182229/1/1030541922.pdf (accessed on 20 May 2020).
- IMO. Efficiency Incentive Scheme (EIS) Submitted by Japan and the World Shipping Council. 2011. Available online: https://www.worldshipping.org/industry-issues/environment/air-emissions/Efficiency_Incentive_Scheme_-EIS-_-Japan_and_WSC-_MEPC_63-5-3.pdf (accessed on 20 May 2021).
- ICS. Shipping Industry Welcomes IMO Decision to Give Further Consideration to USD 5 Billion Fund to Accelerate Decarbonisation. 2021. Available online: https://www.ics-shipping.org/press-release/shipping-industry-welcomes-imo-decision-to-give-further-consideration-to-usd-5-billion-fund-to-accelerate-decarbonisation/ (accessed on 27 May 2021).
- European Commission. Reducing Emissions from the Shipping Sector. Available online: https://ec.europa.eu/clima/policies/transport/shipping_en (accessed on 27 May 2021).
- Psaraftis, H.N. Speed optimization versus speed reduction: Are speed limits better than a bunker levy? Marit. Econ. Logist. 2019, 21, 524–542. [Google Scholar] [CrossRef]
- Chai, K.H.; Lee, X.N.; Gaudin, A.A. Systems Perspective to Market–Based Mechanisms (MBM) Comparison for International Shipping; National University of Singapore: Singapore, 2019; Available online: https://www.researchgate.net/profile/Antoine-Gaudin/publication/331366907_A_Systems_Perspective_to_Market_-_Based_Mechanisms_MBM_Comparison_for_International_Shipping/links/602f36624585158939b48217/A-Systems-Perspective-to-Market-Based-Mechanisms-MBM-Comparison-for-International-Shipping.pdf (accessed on 21 May 2021).
- Kosmas, V.; Acciaro, M. Bunker levy schemes for greenhouse gas (GHG) emission reduction in international shipping. Transp. Res. Part D Transp. Environ. 2017, 57, 195–206. [Google Scholar] [CrossRef]
- Shi, Y. Reducing greenhouse gas emissions from international shipping: Is it time to consider market-based measures? Mar. Policy 2016, 64, 123–134. [Google Scholar] [CrossRef]
- Gritsenko, D. Regulating GHG Emissions from shipping: Local, global, or polycentric approach? Mar. Policy 2017, 84, 130–133. [Google Scholar] [CrossRef] [Green Version]
- Gu, Y.; Wallace, S.W.; Wang, X. Can an Emission Trading Scheme really reduce CO2 emissions in the short term? Evidence from a maritime fleet composition and deployment model. Transp. Res. Part D Transp. Environ. 2019, 74, 318–338. [Google Scholar] [CrossRef] [Green Version]
Figure 1.
Global distribution of shipping CO2 emissions in 2015 [3].
Figure 1.
Global distribution of shipping CO2 emissions in 2015 [3].

Figure 2.
Overview of alternative fuels from different production pathways.

Figure 3.
Flow of methodology for literature review.

Table 1.
Summary of marine alternative fuel characteristics in use. Data: Calorific Value [103], storage requirement [104,105], Utilisation efficiency and by-products [103,106,107,108,109,110,111,112], availability of use [113,114,115,116].
| Fuel Type | Calorific Value (MJ/kg) | Storage Requirement Onboard | Utilisation Efficiency | Utilisation by-Products | Availability of Utilisation Technologies in Commercial Use | |
|---|---|---|---|---|---|---|
| FC (Electric Efficiency) | ICE | |||||
| Natural Gas (liquefied) | 50–55 | −163 °C (Pressurised or unpressurised) | 45–60% (SOFC) 35–45%(PEMFC) | 35–40% | CO2, H2O, NOx(ICE) | ICE: Yes, available for wide commercial use FC: Underdevelopment, no commercial case in marine application |
| Hydrogen | 120–140 | 350–700 bar (gases), −252.8 °C (liquefied), Material-based storage | 50–60% (PEMFC/SOFC) | 30–35% | H2O, NOx(ICE) | ICE: Yes, available for commercial use FC: Yes, available for commercial use |
| Ammonia | 22.5 | 21 °C under 8.8 bar or −33 °C under atmospheric pressure | 30–60% (SOFC) 15–30%(AFC) | 35–40% | H2O, N2, NOx(ICE) | ICE: underdevelopment FC: underdevelopment, no commercial case in marine application |
| Methanol | 22.7 | liquid at ambient temperature | 30–50%(SOFC) 20–30%(DMFC) | Up to 40% | CO2, H2O, CO(ICE), NOx(ICE) | ICE: Yes, available for wide commercial use FC: Underdevelopment, no commercial case in marine application |
| Bio-diesel | 38–46 | liquid at ambient temperature | 10–30% (SOFC) | Varies | CO2, H2O, CO(ICE), NOx(ICE) | ICE: Yes, available for wide commercial use FC: Underdevelopment, no commercial case in marine application |
| Electricity | _ | High energy density battery systems such as: NMC, LFP, NCA and solid state battery | _ | _ | _ | Yes, currently only available for small size shore-based ship |
Publisher’s Note: MDPI stays neutral with regard to jurisdictional claims in published maps and institutional affiliations. |
© 2021 by the authors. Licensee MDPI, Basel, Switzerland. This article is an open access article distributed under the terms and conditions of the Creative Commons Attribution (CC BY) license (https://creativecommons.org/licenses/by/4.0/).
Share and Cite
MDPI and ACS Style
Wang, Y.; Wright, L.A. A Comparative Review of Alternative Fuels for the Maritime Sector: Economic, Technology, and Policy Challenges for Clean Energy Implementation. World 2021, 2, 456-481. https://doi.org/10.3390/world2040029
AMA Style
Wang Y, Wright LA. A Comparative Review of Alternative Fuels for the Maritime Sector: Economic, Technology, and Policy Challenges for Clean Energy Implementation. World. 2021; 2(4):456-481. https://doi.org/10.3390/world2040029
Chicago/Turabian StyleWang, Yifan, and Laurence A. Wright. 2021. "A Comparative Review of Alternative Fuels for the Maritime Sector: Economic, Technology, and Policy Challenges for Clean Energy Implementation" World 2, no. 4: 456-481. https://doi.org/10.3390/world2040029