

Abstract
The origin of expanded single Shockley-type stacking faults in forward-current degradation of 4H-SiC p–i–n diodes was investigated by the stress-current test. At a stress-current density lower than 25 A cm−2, triangular stacking faults were formed from basal-plane dislocations in the epitaxial layer. At a stress-current density higher than 350 A cm−2, both triangular and long-zone-shaped stacking faults were formed from basal-plane dislocations that converted into threading edge dislocations near the interface between the epitaxial layer and the substrate. In addition, the conversion depth of basal-plane dislocations that expanded into the stacking fault was inside the substrate deeper than the interface. These results indicate that the conversion depth of basal-plane dislocations strongly affects the threshold stress-current density at which the expansion of stacking faults occurs.
Export citation and abstract BibTeX RIS
1. Introduction
Silicon carbide (SiC) has attracted significant attention owing to its potential use as a next-generation power semiconductor material because of its high electric-field breakdown strength, high-temperature operation, and high thermal conductivity.1,2) In recent years, SiC has been employed in power electronics products; however, their reliability has been a crucial issue because SiC wafers have many crystallographic defects.2–5) Among these defects, basal-plane dislocations (BPDs) are known to be the source of forward-current degradation in 4H-SiC bipolar devices.6–13) A BPD is composed of two parallel Shockley partial dislocations (PDs) and a single Shockley-type stacking fault (1SSF) on the basal plane. Under forward-current operation of 4H-SiC bipolar devices, minority carriers are injected into a drift layer and recombine with majority carriers. A Si-core PD constituting BPD migrates owing to the electron–hole recombination energy, which expands 1SSFs. This phenomenon increases the resistance of SiC power devices, resulting in the increase in on-voltage. Therefore, reduction in the number of BPDs is very important to ensure the long-term reliability of SiC power devices. It has been reported that most BPDs in a substrate are converted into threading edge dislocations (TEDs) during the epitaxial growth process.14–18) This phenomenon suppresses the propagation of BPDs in the drift layer formed by the epitaxial growth. In previous studies, the ratio of conversion from BPDs into TEDs can be increased to nearly 100% by optimizing the epitaxial growth condition and using a low-off cut-angle substrate. However, it has been reported that 1SSFs expand from BPDs that converted into TEDs near the interface between the epitaxial layer and the substrate.12,13,19) In our previous study, the original area of 1SSFs expanded by applying forward current to 4H-SiC p–i–n diodes was observed by transmission electron microscopy (TEM) with high spatial resolution.20) TEM observation has clarified that 1SSF expands into the substrate when high-density minority carriers are injected into the substrate. This means that although the BPD-TED conversion is effective in suppressing BPDs in the epitaxial layer, other techniques, such as inserting a recombination-enhanced layer at the interface between the epitaxial layer and the substrate, are necessary to reduce the density of minority carriers injected into BPDs in the substrate.21) Hence, it is important to understand the mechanism of 1SSF expansion for optimization of the device structures and operation conditions to overcome the forward-current degradation. We investigated the dependence of the origin of the expanded 1SSF on the stress current applied to 4H-SiC p–i–n diodes.22) In this paper, we present these experimental results in more detail and discuss the relationship between stress-current density and the 1SSF expansion origin.
2. Experimental procedure
For the fabrication of the p–i–n diode shown in Fig. 1, an epitaxial layer with a thickness of 10 µm and a dopant concentration (n) of 1.0 × 1016 cm−3 was grown on a commercially available 345-µm-thick n-type (N-doped, n = 6.4 × 1018 cm−3) 4H-SiC (0001) substrate with an offcut angle of 4° toward the ![$[11\bar{2}0]$](https://content.cld.iop.org/journals/1347-4065/57/4S/04FR07/revision1/SS17083if001.gif) direction. A p+ anode region with a dopant concentration (p) of 3.0 × 1020 cm−3 was formed by Al implantation at 500 °C, and then activation annealing was performed at 1620 °C for 3 min. Finally, anode and cathode electrodes were formed on both sides of a sample. A constant-current stress test of p–i–n diodes was carried out by applying a stress-current density (J) from 25 to 600 A cm−2. The increments of J were 25 A cm−2 in the first step and then 50 A cm−2 in every step until J = 600 A cm−2. For the in situ observation of 1SSF expansion, the electroluminescence (EL) of p–i–n diodes during the stress-current test was observed under an optical microscope.9) The electrodes of degraded p–i–n diodes were removed after the stress-current test, and photoluminescence (PL) imaging was conducted using a 420 nm band-pass filter to investigate the structure and shapes of 1SSFs.23,24) In addition, grazing-incidence monochromatic X-ray topography (XRT) with a 0.15 nm wavelength was performed under the diffraction conditions of
direction. A p+ anode region with a dopant concentration (p) of 3.0 × 1020 cm−3 was formed by Al implantation at 500 °C, and then activation annealing was performed at 1620 °C for 3 min. Finally, anode and cathode electrodes were formed on both sides of a sample. A constant-current stress test of p–i–n diodes was carried out by applying a stress-current density (J) from 25 to 600 A cm−2. The increments of J were 25 A cm−2 in the first step and then 50 A cm−2 in every step until J = 600 A cm−2. For the in situ observation of 1SSF expansion, the electroluminescence (EL) of p–i–n diodes during the stress-current test was observed under an optical microscope.9) The electrodes of degraded p–i–n diodes were removed after the stress-current test, and photoluminescence (PL) imaging was conducted using a 420 nm band-pass filter to investigate the structure and shapes of 1SSFs.23,24) In addition, grazing-incidence monochromatic X-ray topography (XRT) with a 0.15 nm wavelength was performed under the diffraction conditions of  ,
,  ,
,  , and
, and  .25–27) The original area of expanded 1SSFs after the stress-current test was determined using these techniques. The specimens including those used for TEM observations to determine the origins of expanded 1SSFs were fabricated by a focused-ion-beam (FIB) method. TEM observations were carried out under operating conditions of an acceleration voltage of 1,000 kV with
  ,
,  , and
, and  . The Burgers vector of the original BPD (bBPD) was determined by the g · b contrast analysis in TEM observations and the contrast of TEDs in XRT images with
  and
and  .25–29) In addition, scanning electron microscopy (SEM) was used for observation of the interface between the epitaxial layer and the substrate.

Fig. 1. Schematic diagram of a p–i–n diode.
Download figure:
Standard image High-resolution image3. Results and discussion
A PL image of the degraded p–i–n diode is shown in Fig. 2(a). 1SSFs expanded by the stress current were clearly observed. 1SSF shapes were classified into two types (i.e., triangular and long-zone) as shown in Figs. 2(b) and 2(c), respectively. The widths of triangular and long-zone-shaped 1SSFs were both 143 µm in the step-flow direction, which indicated that 1SSFs expanded along the basal plane over the entire epitaxial layer. The distribution of expanded 1SSFs as a function of J is shown in Fig. 3 with coloring by 1SSF shape. From this figure, the J values at which 1SSF expansion occurs are divided into those lower than 25 A cm−2 and those higher than 350 A cm−2. At J values lower than 25 A cm−2, only triangular 1SSFs were formed. In contrast, both triangular and long-zone-shaped 1SSFs were observed at J values higher than 350 A cm−2. In order to clarify the key factor for the relationship between J and 1SSF shape, the original area of expanded 1SSFs was observed by XRT.

Fig. 2. (a) PL image of the degraded p–i–n diode taken using a 420 nm band-pass filter after removing electrodes. 1SSFs expanded to be one of two types, triangular and long-zone-shaped, as shown in enlarged views of (b) and (c), respectively.
Download figure:
Standard image High-resolution image
Fig. 3. Distribution of expanded 1SSFs as a function of J with coloring by 1SSF shape. The total number of observed 1SSFs is 31, and these 1SSF shapes are observed in the PL image shown in Fig. 2. From the viewpoint of 1SSF expansion types, this distribution can be divided into J values lower than 25 A cm−2 and J values higher than 350 A cm−2. Only triangular 1SSFs were observed at J values lower than 25 A cm−2, but both triangular and long-zone-shaped 1SSFs were observed at J values higher than 350 A cm−2.
Download figure:
Standard image High-resolution imageXRT images of samples at  before and after the stress test are shown in Figs. 4(a)–4(c) and Figs. 4(d)–4(f), respectively. In addition, Fig. 5 shows schematic diagrams of 1SSFs and dislocations shown in Fig. 4. From these figures, it was clarified that original BPDs of expanded 1SSFs could be classified into three types. The first type includes BPDs that propagated from the substrate into the epitaxial layer (hereafter, "BPDepi"), as shown in Figs. 4(a) and 5(a). A BPD alone was only observed near the original area in Figs. 4(a) and 4(d). Therefore, the structure of the original BPD and expanded 1SSF are drawn in Figs. 5(a) and 5(d). These indicate that the BPD in the substrate propagates through the epitaxial layer from the substrate to the epitaxial layer surface, and the BPD is the origin of 1SSF expansion. The second type includes BPDs converted into TEDs in the epitaxial layer (hereafter, "BPDTEDepi") shown in Figs. 4(b) and 5(b). The TED was observed on one side of a triangle in Fig. 4(e). This indicates that the depth of BPD-TED conversion is in the epitaxial layer, as shown in Fig. 5(b), and the positional relationship between the 1SSF and TED is shown in Fig. 5(e). The third type includes BPDs converted into TEDs near the interface between the epitaxial layer and the substrate (hereafter, "BPDTEDint") shown in Figs. 4(c) and 5(c). In BPDTEDint, a TED was observed on a triangular apex, as shown in Fig. 4(f). This suggests that the 1SSF expanded from near the BPD-TED conversion point, as shown in Fig. 5(f).

Fig. 4. XRT images of the area with 1SSFs (a)–(c) before and (d)–(f) after the stress test. These images were taken at  . Original BPDs can be classified into the following three types: BPDepi is shown in (a) and (d), BPDTEDepi in (b) and (e), and BPDTEDint in (c) and (f).
Download figure:
Standard image High-resolution image
Fig. 5. Schematic diagrams of 1SSFs and dislocations. These diagrams show three original BPDs corresponding to those in Fig. 4; BPDepi in (a) and (d), BPDTEDepi in (b) and (e), and BPDTEDint in (c) and (f).
Download figure:
Standard image High-resolution imageThe distribution of the expanded 1SSF as a function of J is shown in Fig. 6 with coloring by original BPD type. The number of original BPDs increased in the order of BPDTEDepi, BPDepi, and BPDTEDint. This result suggests that most BPDs convert into TEDs at the initial stage of epitaxial film growth in this experiment. At J values lower than 25 A cm−2, the expansion origins were BPDepi and BPDTEDepi, as shown in Figs. 4(a) and 4(b). 1SSF expansion is caused by electron–hole recombination.10) Minority carriers are easily injected into a BPD at a small depth, which results in 1SSF expansion from the BPD in the epitaxial layer at a lower J. As shown in Fig. 3, only triangular 1SSFs were formed at J values lower than 25 A cm−2. The shape of the expanded 1SSF depends on the Burgers vector of PDs (bPD).13) In 1SSF expansion under forward-current operation, a 30° Si-core PD migrates with the formation of the 30 °C-core, and as a result, the 1SSF expands with a diamond shape.10) Regarding 1SSF expansion from the interface between the epitaxial layer and the substrate toward the epitaxial layer surface, the relationship between 1SSF shape and bPD is shown in Fig. 7. PDs with ![$b_{\text{PD}} = \pm 1/3[01\bar{1}0]$](https://content.cld.iop.org/journals/1347-4065/57/4S/04FR07/revision1/SS17083if016.gif) and
and ![$ \pm 1/3[10\bar{1}0]$](https://content.cld.iop.org/journals/1347-4065/57/4S/04FR07/revision1/SS17083if017.gif) migrate toward the
migrate toward the ![$[\bar{1}100]$](https://content.cld.iop.org/journals/1347-4065/57/4S/04FR07/revision1/SS17083if018.gif) and
and ![$[1\bar{1}00]$](https://content.cld.iop.org/journals/1347-4065/57/4S/04FR07/revision1/SS17083if019.gif) directions with the diamond shape, as shown in Figs. 7(a) and 7(b), respectively. A triangular 1SSF is formed since PD migration reaches the epitaxial layer surface. On the other hand, the migration of PDs with
directions with the diamond shape, as shown in Figs. 7(a) and 7(b), respectively. A triangular 1SSF is formed since PD migration reaches the epitaxial layer surface. On the other hand, the migration of PDs with ![$b_{\text{PD}} = \pm 1/3[1\bar{1}00]$](https://content.cld.iop.org/journals/1347-4065/57/4S/04FR07/revision1/SS17083if020.gif) formed a long-zone-shaped 1SSF, as shown in Fig. 7(c). From these expansion behaviors, the bBPD, bPD, and expanded 1SSF shapes are summarized in Table I. Because part of the BPDs with
formed a long-zone-shaped 1SSF, as shown in Fig. 7(c). From these expansion behaviors, the bBPD, bPD, and expanded 1SSF shapes are summarized in Table I. Because part of the BPDs with ![$b_{\text{BPD}} = \pm 1/3[11\bar{2}0]$](https://content.cld.iop.org/journals/1347-4065/57/4S/04FR07/revision1/SS17083if039.gif) propagate through the epitaxial layer from the substrate, it is suggested that the bBPD of BPDepi and BPDTEDepi is
propagate through the epitaxial layer from the substrate, it is suggested that the bBPD of BPDepi and BPDTEDepi is ![$ \pm 1/3[11\bar{2}0]$](https://content.cld.iop.org/journals/1347-4065/57/4S/04FR07/revision1/SS17083if040.gif) .18) 1SSFs that originated from BPDs with
.18) 1SSFs that originated from BPDs with ![$b_{\text{BPD}} = \pm 1/3[11\bar{2}0]$](https://content.cld.iop.org/journals/1347-4065/57/4S/04FR07/revision1/SS17083if041.gif) expand to form the triangular shape, as shown in Table I. Therefore, 1SSFs expanded to form only the triangular shape from BPDs in the epitaxial layer with
expand to form the triangular shape, as shown in Table I. Therefore, 1SSFs expanded to form only the triangular shape from BPDs in the epitaxial layer with ![$b_{\text{BPD}} = \pm 1/3[11\bar{2}0]$](https://content.cld.iop.org/journals/1347-4065/57/4S/04FR07/revision1/SS17083if042.gif) at J values lower than 25 A cm−2. In contrast, the origin of the majority of expanded 1SSFs was BPDTEDint at J values higher than 350 A cm−2, as shown in Fig. 6. Under this condition, higher-density minority carriers are injected into the BPD near the interface between the epitaxial layer and the substrate. Therefore, BPDTEDint became the 1SSF expansion origin. Additionally, the bBPD of BPDTEDint is either
at J values lower than 25 A cm−2. In contrast, the origin of the majority of expanded 1SSFs was BPDTEDint at J values higher than 350 A cm−2, as shown in Fig. 6. Under this condition, higher-density minority carriers are injected into the BPD near the interface between the epitaxial layer and the substrate. Therefore, BPDTEDint became the 1SSF expansion origin. Additionally, the bBPD of BPDTEDint is either ![$ \pm 1/3[11\bar{2}0]$](https://content.cld.iop.org/journals/1347-4065/57/4S/04FR07/revision1/SS17083if043.gif) ,
, ![$ \pm 1/3[1\bar{2}10]$](https://content.cld.iop.org/journals/1347-4065/57/4S/04FR07/revision1/SS17083if044.gif) , or
, or ![$ \pm 1/3[\bar{2}110]$](https://content.cld.iop.org/journals/1347-4065/57/4S/04FR07/revision1/SS17083if045.gif) . The long-zone-shaped 1SSFs are formed from BPDs with
. The long-zone-shaped 1SSFs are formed from BPDs with ![$b_{\text{BPD}} = \pm 1/3[1\bar{2}10]$](https://content.cld.iop.org/journals/1347-4065/57/4S/04FR07/revision1/SS17083if046.gif) or
or ![$ \pm 1/3[\bar{2}110]$](https://content.cld.iop.org/journals/1347-4065/57/4S/04FR07/revision1/SS17083if047.gif) because of the migration of 30° Si-core PDs with
because of the migration of 30° Si-core PDs with ![$b_{\text{PD}} = \pm 1/3[\bar{1}100]$](https://content.cld.iop.org/journals/1347-4065/57/4S/04FR07/revision1/SS17083if048.gif) , as shown in Fig. 7(c) and Table I. Then, BPDTEDint expanded to triangular or long-zone-shaped 1SSFs at higher J values. At J values from 50 to 300 A cm−2, the density of minority carriers is suggested to be insufficient for the 1SSF expansion that originated from BPDTEDint in this experiment. These results suggest that the threshold J of 1SSF expansion depends on the depth of original BPDs. In order to clarify the depth of BPD-TED conversion in more detail, the original area of a 1SSF that expanded from BPDTEDint was observed by TEM.
, as shown in Fig. 7(c) and Table I. Then, BPDTEDint expanded to triangular or long-zone-shaped 1SSFs at higher J values. At J values from 50 to 300 A cm−2, the density of minority carriers is suggested to be insufficient for the 1SSF expansion that originated from BPDTEDint in this experiment. These results suggest that the threshold J of 1SSF expansion depends on the depth of original BPDs. In order to clarify the depth of BPD-TED conversion in more detail, the original area of a 1SSF that expanded from BPDTEDint was observed by TEM.
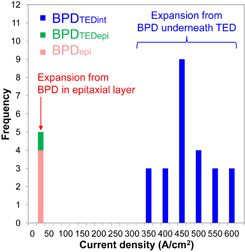
Fig. 6. Distribution of expanded 1SSFs as a function of J with coloring by the original BPD type. The original areas of the same 1SSFs shown in Fig. 3 were observed using XRT, as shown in Fig. 4. At J values lower than 25 A cm−2, BPDepi and BPDTEDepi were observed at the original areas of expanded 1SSFs. The origins of 1SSF expansion were BPDTEDint at J values higher than 350 A cm−2.
Download figure:
Standard image High-resolution image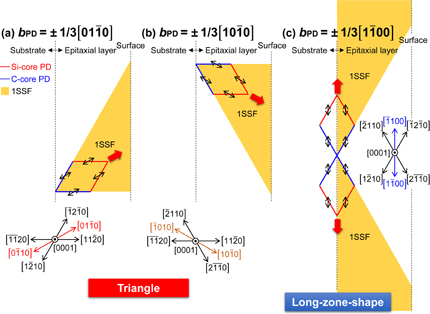
Fig. 7. Schematic diagram of the relationship between 1SSF shape and bPD. These figures show the migration of PDs in the case of 1SSF expansion that originated from the interface between the epitaxial layer and the substrate toward the epitaxial layer surface. 1SSF shapes are determined by the Burgers vector of migrated PDs. The triangular 1SSF is formed by migration of PDs with ![$b_{\text{PD}} = \pm 1/3[01\bar{1}0]$](https://content.cld.iop.org/journals/1347-4065/57/4S/04FR07/revision1/SS17083if013.gif) or
or ![$ \pm 1/3[10\bar{1}0]$](https://content.cld.iop.org/journals/1347-4065/57/4S/04FR07/revision1/SS17083if014.gif) , as shown in (a) and (b), and a long-zone-shaped 1SSF is formed by the migration of PDs with
, as shown in (a) and (b), and a long-zone-shaped 1SSF is formed by the migration of PDs with ![$b_{\text{PD}} = \pm 1/3[\bar{1}100]$](https://content.cld.iop.org/journals/1347-4065/57/4S/04FR07/revision1/SS17083if015.gif) , as shown in (c).
, as shown in (c).
Download figure:
Standard image High-resolution imageTable I. Relationship between bBPD, bPD, and 1SSF shape.
| Burgers vector of BPD bBPD | Burgers vector of PD bPD | Shape of expanded 1SSF |
|---|---|---|
![$1/3[11\bar{2}0]$](https://content.cld.iop.org/journals/1347-4065/57/4S/04FR07/revision1/SS17083if021.gif) |
![$1/3[01\bar{1}0]$](https://content.cld.iop.org/journals/1347-4065/57/4S/04FR07/revision1/SS17083if022.gif) |
Triangle |
![$1/3[10\bar{1}0]$](https://content.cld.iop.org/journals/1347-4065/57/4S/04FR07/revision1/SS17083if023.gif) |
Triangle | |
![$1/3[\bar{1}\bar{1}20]$](https://content.cld.iop.org/journals/1347-4065/57/4S/04FR07/revision1/SS17083if024.gif) |
![$1/3[0\bar{1}10]$](https://content.cld.iop.org/journals/1347-4065/57/4S/04FR07/revision1/SS17083if025.gif) |
Triangle |
![$1/3[\bar{1}010]$](https://content.cld.iop.org/journals/1347-4065/57/4S/04FR07/revision1/SS17083if026.gif) |
Triangle | |
![$1/3[1\bar{2}10]$](https://content.cld.iop.org/journals/1347-4065/57/4S/04FR07/revision1/SS17083if027.gif) |
![$1/3[1\bar{1}00]$](https://content.cld.iop.org/journals/1347-4065/57/4S/04FR07/revision1/SS17083if028.gif) |
Long-zone-shape |
![$1/3[0\bar{1}10]$](https://content.cld.iop.org/journals/1347-4065/57/4S/04FR07/revision1/SS17083if029.gif) |
Triangle | |
![$1/3[\bar{1}2\bar{1}0]$](https://content.cld.iop.org/journals/1347-4065/57/4S/04FR07/revision1/SS17083if030.gif) |
![$1/3[\bar{1}100]$](https://content.cld.iop.org/journals/1347-4065/57/4S/04FR07/revision1/SS17083if031.gif) |
Long-zone-shape |
![$1/3[01\bar{1}0]$](https://content.cld.iop.org/journals/1347-4065/57/4S/04FR07/revision1/SS17083if032.gif) |
Triangle | |
![$1/3[\bar{2}110]$](https://content.cld.iop.org/journals/1347-4065/57/4S/04FR07/revision1/SS17083if033.gif) |
![$1/3[\bar{1}010]$](https://content.cld.iop.org/journals/1347-4065/57/4S/04FR07/revision1/SS17083if034.gif) |
Triangle |
![$1/3[\bar{1}100]$](https://content.cld.iop.org/journals/1347-4065/57/4S/04FR07/revision1/SS17083if035.gif) |
Long-zone-shape | |
![$1/3[2\bar{1}\bar{1}0]$](https://content.cld.iop.org/journals/1347-4065/57/4S/04FR07/revision1/SS17083if036.gif) |
![$1/3[10\bar{1}0]$](https://content.cld.iop.org/journals/1347-4065/57/4S/04FR07/revision1/SS17083if037.gif) |
Triangle |
![$1/3[1\bar{1}00]$](https://content.cld.iop.org/journals/1347-4065/57/4S/04FR07/revision1/SS17083if038.gif) |
Long-zone-shape |
Figure 8 shows PL and XRT images of the long-zone-shaped 1SSF. From the XRT images shown in Figs. 8(b)–8(d), both a BPD and TED were observed at the original area of expansion. From the diffraction contrast of TED at  and
and  shown in Figs. 8(c) and 8(d), the Burgers vector of the TED (bTED) was determined to be either
 ![$b_{\text{TED}} = 1/3[\bar{2}110]$](https://content.cld.iop.org/journals/1347-4065/57/4S/04FR07/revision1/SS17083if054.gif) or
or ![$1/3[\bar{1}2\bar{1}0]$](https://content.cld.iop.org/journals/1347-4065/57/4S/04FR07/revision1/SS17083if055.gif) .25,26) A plan-view TEM image of the expansion original area surrounded by a dashed frame in Fig. 8(a) is shown in Fig. 9(a). A BPD composed of two PDs and a TED converted from the BPD were clearly observed from the enlarged views shown in Figs. 9(b) and 9(c). From these results, it was confirmed that the long-zone-shaped 1SSF expanded from BPDTEDint. Then, bBPD was determined to be
.25,26) A plan-view TEM image of the expansion original area surrounded by a dashed frame in Fig. 8(a) is shown in Fig. 9(a). A BPD composed of two PDs and a TED converted from the BPD were clearly observed from the enlarged views shown in Figs. 9(b) and 9(c). From these results, it was confirmed that the long-zone-shaped 1SSF expanded from BPDTEDint. Then, bBPD was determined to be ![$ \pm 1/3[\bar{2}110]$](https://content.cld.iop.org/journals/1347-4065/57/4S/04FR07/revision1/SS17083if058.gif) by the g · b contrast analysis of the TEM observations. On the basis of the results obtained from XRT and TEM observations, it was clarified that the 1SSF expansion originated from a BPD converted into a TED with
by the g · b contrast analysis of the TEM observations. On the basis of the results obtained from XRT and TEM observations, it was clarified that the 1SSF expansion originated from a BPD converted into a TED with ![$b_{\text{BPD}} = b_{\text{TED}} = 1/3[\bar{2}110]$](https://content.cld.iop.org/journals/1347-4065/57/4S/04FR07/revision1/SS17083if059.gif) . The black arrows in Fig. 9 show the determined Burgers vectors. A cross section at the TED position in Fig. 9(c) is observed in the large arrow direction. Dislocations such as TED and PD were clearly observed on the dark-field scanning TEM (STEM) image shown in Fig. 10(a). Figure 10(b) is an SEM image of the same cross section as that in Fig. 10(a). The epitaxial layer and the substrate were observed with different contrasts. Figure 10(c) shows a STEM image overlapped with SEM contrasts. From this figure, the BPD-TED conversion depth was determined to be 272 nm in the substrate from the epitaxial layer and substrate interface. It has been reported that a TED glides towards the up-step direction during the BPD-TED conversion process.30,31) This phenomenon occurs on BPDs through the sample surface by annealing during the epitaxial film growth process because of the imaging force applied to BPDs near the sample surface. Therefore, the BPD-TED conversion point should be in the substrate near the interface between the epitaxial layer and the substrate before the stress-current test in Figs. 9 and 10. This indicated that the 1SSF shown in Figs. 8–10 expanded from BPD in the substrate. Although it is necessary to observe some 1SSFs that extended from BPDTEDint, it is suggested that 1SSFs that originated from the BPDTEDint are expanded from the BPDs in the substrate at J values higher than 350 A cm−2. From these results, it is experimentally clarified that the BPDs in the substrate could be the origin of expanded 1SSFs at a high density of carrier injection into the substrate.
. The black arrows in Fig. 9 show the determined Burgers vectors. A cross section at the TED position in Fig. 9(c) is observed in the large arrow direction. Dislocations such as TED and PD were clearly observed on the dark-field scanning TEM (STEM) image shown in Fig. 10(a). Figure 10(b) is an SEM image of the same cross section as that in Fig. 10(a). The epitaxial layer and the substrate were observed with different contrasts. Figure 10(c) shows a STEM image overlapped with SEM contrasts. From this figure, the BPD-TED conversion depth was determined to be 272 nm in the substrate from the epitaxial layer and substrate interface. It has been reported that a TED glides towards the up-step direction during the BPD-TED conversion process.30,31) This phenomenon occurs on BPDs through the sample surface by annealing during the epitaxial film growth process because of the imaging force applied to BPDs near the sample surface. Therefore, the BPD-TED conversion point should be in the substrate near the interface between the epitaxial layer and the substrate before the stress-current test in Figs. 9 and 10. This indicated that the 1SSF shown in Figs. 8–10 expanded from BPD in the substrate. Although it is necessary to observe some 1SSFs that extended from BPDTEDint, it is suggested that 1SSFs that originated from the BPDTEDint are expanded from the BPDs in the substrate at J values higher than 350 A cm−2. From these results, it is experimentally clarified that the BPDs in the substrate could be the origin of expanded 1SSFs at a high density of carrier injection into the substrate.

Fig. 8. (a) PL and (b)–(d) XRT images of the long-zone-shaped 1SSF. XRT images were observed at g = (b)  , (c)
, (c)  , and (d)
  .
.
Download figure:
Standard image High-resolution image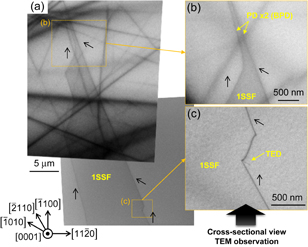
Fig. 9. Plan-view TEM image of the original area of an expanded 1SSF surrounded by a dashed frame in Fig. 8(a). Enlarged views of the area containing a BPD and TED are shown in (b) and (c), respectively. The bPD indicated by black arrows was determined by the g · b contrast analysis of TEM and the TED contrast in Figs. 8(c) and 8(d). The long-zone-shaped 1SSF originated from BPDs with ![$b_{\text{BPD}} = 1/3[\bar{2}110]$](https://content.cld.iop.org/journals/1347-4065/57/4S/04FR07/revision1/SS17083if056.gif) and was formed by the migration of PDs with
and was formed by the migration of PDs with ![$b_{\text{PD}} = 1/3[\bar{1}100]$](https://content.cld.iop.org/journals/1347-4065/57/4S/04FR07/revision1/SS17083if057.gif) .
.
Download figure:
Standard image High-resolution image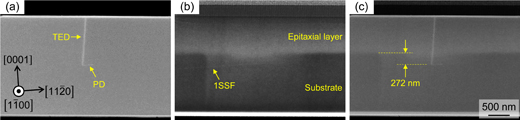
Fig. 10. (a) Dark-field STEM and (b) SEM images of the cross section near the BPD-TED conversion position shown in Fig. 9(c). Panels (a) and (b) are overlapped as shown in (c). The BPD-TED conversion position was observed in the substrate from the interface between the epitaxial layer and the substrate.
Download figure:
Standard image High-resolution image
4. Conclusion
In forward-current degradation of 4H-SiC p–i–n diodes, the relationship between J and the expansion origin was investigated by PL, XRT, and TEM analyses. 1SSFs expanded to form a triangular shape from BPDs with ![$b_{\text{BPD}} = \pm 1/3[11\bar{2}0]$](https://content.cld.iop.org/journals/1347-4065/57/4S/04FR07/revision1/SS17083if060.gif) in the epitaxial layer at a low J. At a high J, the origins of expanded triangular and long-zone-shaped 1SSFs were the BPDs that converted into TEDs near the interface between the epitaxial layer and the substrate. In one of the 1SSFs that expanded from BPDs that converted into TEDs, the BPD-TED conversion depth was 272 nm from the epitaxial layer and substrate interface. These results clarify that the structures of the original BPDs strongly affect 1SSF expansions.
in the epitaxial layer at a low J. At a high J, the origins of expanded triangular and long-zone-shaped 1SSFs were the BPDs that converted into TEDs near the interface between the epitaxial layer and the substrate. In one of the 1SSFs that expanded from BPDs that converted into TEDs, the BPD-TED conversion depth was 272 nm from the epitaxial layer and substrate interface. These results clarify that the structures of the original BPDs strongly affect 1SSF expansions.
Acknowledgements
This work was supported by the Council for Science, Technology and Innovation (CSTI), Cross-ministerial Strategic Innovation Promotion Program (SIP), "Next-generation power electronics/consistent R&D of next-generation SiC power electronics" (Funding agency: NEDO). Part of this work was conducted at Nagoya University, supported by the Nanotechnology Platform (Microstructure Analysis) of the Ministry of Education, Culture, Sports, Science and Technology, Japan (MEXT). Synchrotron X-ray topography experiments were performed at beam-line BL15 in the Kyushu Synchrotron Light Research Center (SAGA-LS).