

COVID-19: a new deep learning computer-aided model for classification
- Published
- Accepted
- Received
- Academic Editor
- Robertas Damaševičius
- Subject Areas
- Bioinformatics, Computational Biology, Artificial Intelligence, Computer Vision, Data Mining and Machine Learning
- Keywords
- Deep convolutional neural network, X-ray images, COVID-19, Classification
- Copyright
- © 2021 Elzeki et al.
- Licence
- This is an open access article distributed under the terms of the Creative Commons Attribution License, which permits unrestricted use, distribution, reproduction and adaptation in any medium and for any purpose provided that it is properly attributed. For attribution, the original author(s), title, publication source (PeerJ Computer Science) and either DOI or URL of the article must be cited.
- Cite this article
- 2021. COVID-19: a new deep learning computer-aided model for classification. PeerJ Computer Science 7:e358 https://doi.org/10.7717/peerj-cs.358
Abstract
Chest X-ray (CXR) imaging is one of the most feasible diagnosis modalities for early detection of the infection of COVID-19 viruses, which is classified as a pandemic according to the World Health Organization (WHO) report in December 2019. COVID-19 is a rapid natural mutual virus that belongs to the coronavirus family. CXR scans are one of the vital tools to early detect COVID-19 to monitor further and control its virus spread. Classification of COVID-19 aims to detect whether a subject is infected or not. In this article, a model is proposed for analyzing and evaluating grayscale CXR images called Chest X-Ray COVID Network (CXRVN) based on three different COVID-19 X-Ray datasets. The proposed CXRVN model is a lightweight architecture that depends on a single fully connected layer representing the essential features and thus reducing the total memory usage and processing time verse pre-trained models and others. The CXRVN adopts two optimizers: mini-batch gradient descent and Adam optimizer, and the model has almost the same performance. Besides, CXRVN accepts CXR images in grayscale that are a perfect image representation for CXR and consume less memory storage and processing time. Hence, CXRVN can analyze the CXR image with high accuracy in a few milliseconds. The consequences of the learning process focus on decision making using a scoring function called SoftMax that leads to high rate true-positive classification. The CXRVN model is trained using three different datasets and compared to the pre-trained models: GoogleNet, ResNet and AlexNet, using the fine-tuning and transfer learning technologies for the evaluation process. To verify the effectiveness of the CXRVN model, it was evaluated in terms of the well-known performance measures such as precision, sensitivity, F1-score and accuracy. The evaluation results based on sensitivity, precision, recall, accuracy, and F1 score demonstrated that, after GAN augmentation, the accuracy reached 96.7% in experiment 2 (Dataset-2) for two classes and 93.07% in experiment-3 (Dataset-3) for three classes, while the average accuracy of the proposed CXRVN model is 94.5%.
Introduction
On 31 December 2019, pneumonia of unknown cause found in Wuhan, China, was first confirmed to China’s WHO Country Office, and the disease was named COVID-19 by WHO (World Health Organization, 2020). The WHO declared the Chinese outbreak of COVID-19 on 30 January 2020 to be a public health emergency of international concern posing a high risk to countries with weak healthcare systems. The emergency committee reported that COVID-19 could be stopped by early detection, isolation, timely care, and the implementation of a reliable communication monitoring system (World Health Organization, 2020; Sohrabi et al., 2020). An essential step in combating COVID-19 is the successful monitoring of infected patients, enabling those infected to seek prompt diagnosis and care, as well as being isolated to reduce the spread of the virus. Reverse transcriptase-polymerase chain reaction (RT-PCR) is the principal screening tool used to identify COVID19 cases (Wang, Ng & Brook, 2020).
Smart healthcare systems can assist in improving healthcare worldwide via employing artificial intelligence (AI) and machine learning techniques in different ways, for example, detection, identification, and monitoring of the disease. AI allows doctors to diagnose, discover, and monitor diseases in early stages. In turn, it becomes easier to overcome obstacles and issues in traditional methods such as time consumption and extra effort wasting. From cancer screening and disease tracking to tailored treatment, recommendations are a wide variety of topics and applications in healthcare. These applications depend on different and various sources of today-radiological imaging data (X-ray, CT and MRI scans), pathology imaging, and, more recently, genomic sequences for being used during service(s) implementation (Li et al., 2020; Razzak, Naz & Zaib, 2018; Xu et al., 2014) .
Due to the recent pandemic, the opportunity of smart healthcare expansion is exponentially increasing and attracting many researchers to find a cure or medication to benefit billions of people around the world. Therefore, COVID-19 detection and classification is a critical application in smart healthcare systems (Ting et al., 2020; Ienca & Vayena, 2020; Wang et al., 2020).
In this article, we are motivated to propose an approach that is based on deep learning (DL) technology as a potential tool to assist healthcare workers to be timely to detect the presence of COVID-19 from CXR images.
The main contributions of this article are as follows:
-
CXRVN: A novel Chest, X-ray COVID-19 Network architecture, is designed, implemented, trained, optimized, and evaluated to detect infected cases easily, accurately, and rapidly.
-
We crawled a novel dataset from different resources, which include COVID-19, Pneumonia, and Normal cases.
-
Fine-tuned and transferred learning pre-trained models for feature extraction and image classification.
-
Augmentation of the COVID-19 dataset is performed using a designed GANs architecture.
In the rest of this article, we recall the recent scientific researches in literature in “Related Work”. “Materials and Methods” discusses the design principles, learning criteria, and optimization algorithms for our CXRVN model. Validation and verification of the CXRVN model are illustrated using different experimental studies in “Evaluation of Experimental Results”. “Discussion” discusses the results and insights of the experimental studies and compares the performance of CXRVN with recent literature. Finally, “Conclusions” concludes the proposed method and research impacts and highlights additional research questions in the hotspot research point.
Materials and Methods
Deep learning
Generally, deep neural network (DNN) inspired by the human brain consists of neurons, synapses, and much more, the formulation of DNN seems like hierarchical neural networks to improve the process of classifying supervised patterns (Hinton & Salakhutdinov, 2006; Ciregan, Meier & Schmidhuber, 2012). DL is a methodology of stacking multi-hidden layers that can significantly learn objects. DL can classify, extract the features, and make a decision ineffective and precise fashion after an efficient training process. The training process includes “fine-tuning” where DNN slightly adjusts the weights found in pre-training during backpropagation (Hinton et al., 2012; Yosinski et al., 2014). Hence, we need optimizers during parameters update and cost minimization. Mini-batch gradient decent (MBGD) and Adam optimizers are the most common optimizers to speed up the learning process and further enhance the value of the objective function. However, recently transfer learning plays a useful and powerful tool to enable the training of large-scale datasets without overfitting problem results from the target dataset that is much smaller than the raw dataset (Lu et al., 2015; Ahmed, Jones & Marks, 2015).
MBGD and adam optimizers
The presence of redundancy of data is beneficial to use the MBGD as an optimizer algorithm. Since the learning rate changes from relatively large to the relatively small that is called schedule. Therefore, it is requiring to estimate the parameters to be convergence by futzing the parameters, ultimately (Le et al., 2011). The stochastic gradient descent (SGD) is used to minimize the objective function for extensive training sets. The traditional gradient descent becomes a costly procedure (Ruder, 2016). Assume that the hypothesis for x input features is given by Eq. (1) (Dean et al., 2012; Maas, Hannun & Ng, 2013).
(1) where is the current initial case for the input x for the n training set, then the training set of hypothesis h called is given by half number of the m training examples multiplied by the average square error, as given in Eq. (2).
(2) where the difference, , is the square error of the ith training instances such that the parameters of theta in the inner loop of the gradient descent are updated repeatedly as in Eq. (3), and that is commonly called Batch Gradient Descent (BGD).
(3) where is the learning rate for j = 0, 1, 2, …, n, the updated theta is the difference between the old theta and the partial derivative . The parameters are firstly initialized, then different iteration of the batch gradient descent will likely result in local minimum through the data trajectory. For a large scale, data BGD accumulates the sums, and it will consume much time, and the system complexity will be very high. Therefore, both SGD and MBGD is more reliable than BGD in large scale optimization approaches, and with the systems requires different parameters. Moreover, there is no need, to sum up, all the training sets. Mini-batch Gradient Descent looks at the mini-batch instances. Also, SGD is more likely to escape from local optima than BGD, not guaranteed global optima. As the MBGD takes the batch reasonability straight-line trajectory to get the local minimum. The cost of SGD is given by Eq. (4) such that for random shuffle dataset the trained is the sum of the cost function to the number of the trained examples m, as shown in Eq. (5). Hence, the updated does not depend on the accumulated summation, as shown in Eq. (6). During the learning process, it is preferred to use the largest number of iterations for optimizing the accuracy of the model. Starting from the first iteration may take the parameter in the direction and move the parameters in the direction of the local minima (Abadi et al., 2016; Lee et al., 2011). While BGD used all m examples in each iteration, and SGD used a single example in each iteration, the MBGD uses b examples in each iteration such that b is the mini-batch size as shown in Eq. (7) (Hinton, Srivastava & Swersky, 2012; Goyal et al., 2017; Jain et al., 2017). Moreover, Adam optimizer presented by Kingma & Ba (2014) depends on optimizing lower-order moments with a little memory requirement is applied in this work to boost the cost function as well as to get reliable results after MBGD. A mathematical proof of the convergence Adam optimizer is stated in Tran (2019).
(4)
(5)
(6)
(7)
Generative adversarial networks (GANs)
Generative Adversarial Networks (GANs) are recently used for the generation of images, video, and voice. GANs are algorithmic architectures that use two DNN architectures, to build new simulated instances of data that can be transferred to real data (Goodfellow et al., 2014). GAN is one of the most common architecture algorithms for image data augmentation by which the samples can be stacked with random cropping to further in-rate the data collection (Samangouei, Kabkab & Chellappa, 2018; Frid-Adar et al., 2018).
In Waheed et al. (2020) the authors presented GAN architecture for a limited number of COVID-19 CXR dataset that consists of 192 images and their architecture achieved accuracies 85% and 95% before and after GAN augmentation, respectively. The taxonomy of image data augmentation that shows the different types recently used in image augmentation is shown in Fig. 1 (Shorten & Khoshgoftaar, 2019). In image data augmentation, there are two types; the first type is image manipulation, while the second is DL approaches. In image manipulation, there are two types in general, which are geometry transformation and mixing images. In contrast, the DL approaches are classified into GANs and neural transfer. In this work, we present GAN architecture, which belongs to DL approaches to produce meta-learning data augmentation of the enrolled CXR images.
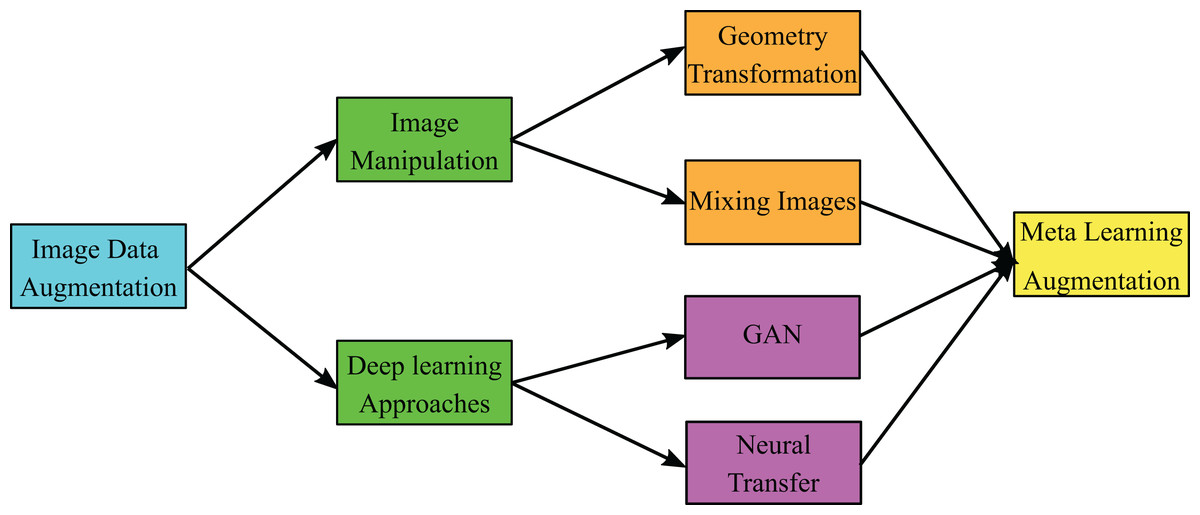
Figure 1: General taxonomy of image data augmentation.
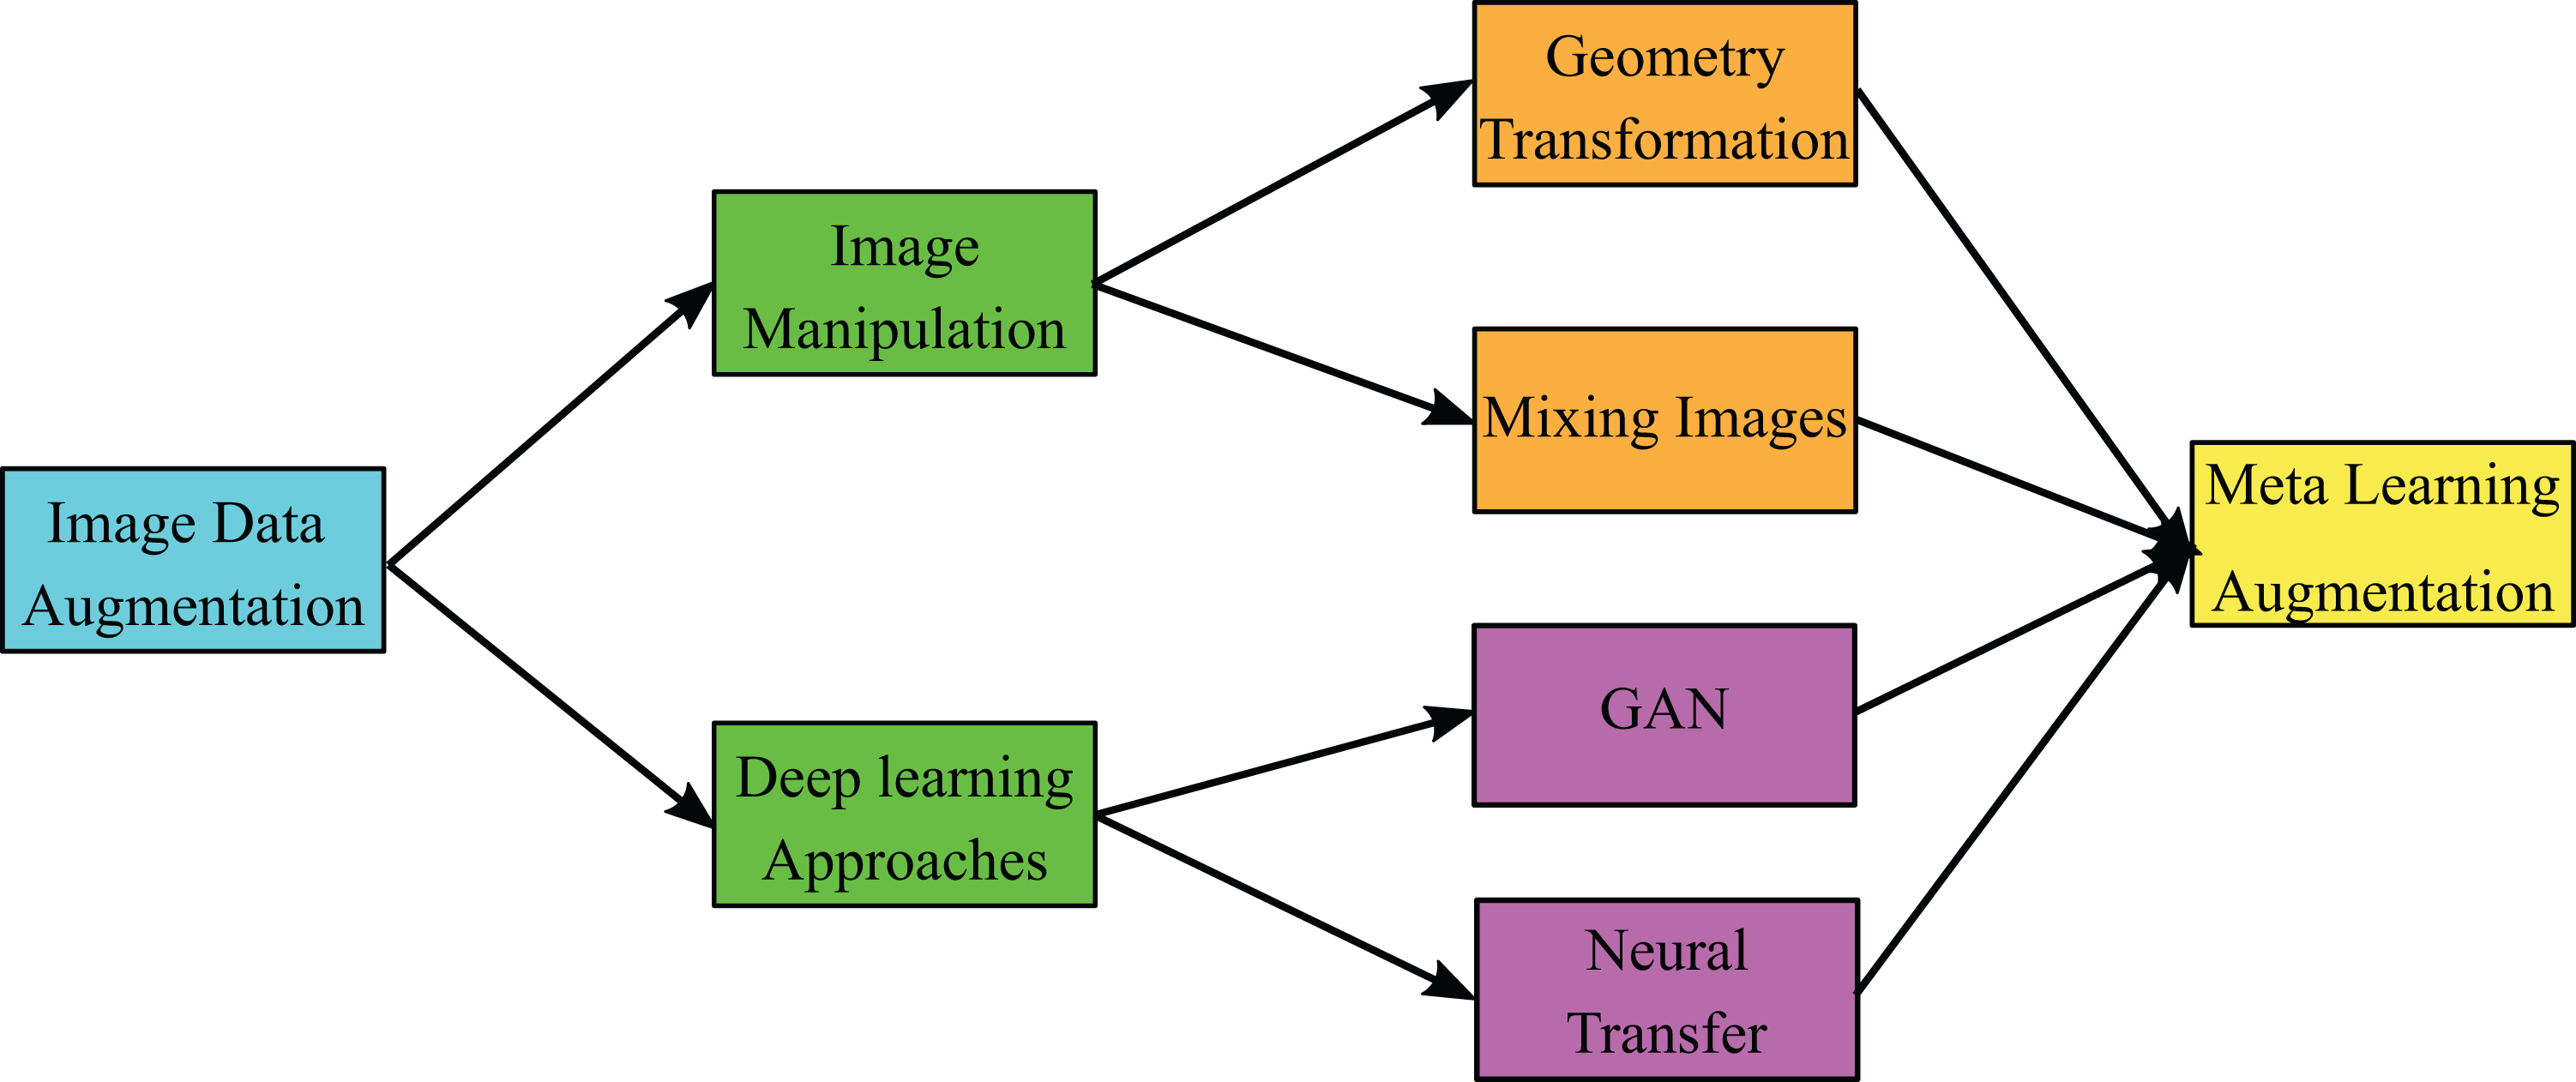
The proposed CXRVN architecture
In this article, we build a novel architecture to classify the input COVID-19 CXR images into normal and abnormal categories. The proposed network is called Chest X-Ray COVID-19 Network (CXRVN) is considered as the first specialized deep neural network for analyzing chest X-ray images against the pandemic COVID-19. Our network architecture is summarized in Fig. 2. Generally, CXRVN consists of four convolution layers, three pooling layers, and one fully connected layer. Next, we describe the main features of our architecture and their importance for diagnosis COVID19 patients.
Figure 2: The proposed CXRVN architecture for COVID-19 classification using fully connected DCNN.
The CXR images were downloaded from Kaggle under a CC0 1.0 license.
Since the saturating nonlinearities are much slower than the non-saturating nonlinearity during the training time with gradient descent, we use the rectified linear unit (ReLU) as the activation function. Besides, we concern about preventing overfitting when using ReLU, so the observed effect is different from the accelerated ability to fit the training set. Besides, using ReLU during the training procedure leads to relatively rapid learning of the network.
The ReLU is the activation function used in the hidden layer so that for the input convoluted feature x, the ReLU allows faster learning, which significantly affects the output of large models trained on large datasets, and does not require normalization of inputs to avoid saturation of the learning.
Although some training examples produce a positive input to a ReLU of a neuron, causing the learning process to happen in that neuron, we still find the importance of local normalization scheme in generalization aids. The batch normalization that determines the mean and variance for the input feature x is determined as in Calik et al. (2019) by which the mean of the expected value of x is determined. Moreover, the variance is the expected value the determined as the square of each enrolled features x subtracted from the mean of the whole features . Then the normalized value of x is calculated by Eq. (8) as follows:
(8) where is a very small number which protects zero division for batch normalization via deep learning platform codes.
For the score vectors of an input COVID-19 X-Ray input images that denoted by , the probability of the scored values are given as in Eq. (9)
(9) Typically, we find that models with concurrent pooling are much more challenging to overfit during the training models. Because of the pooling layers in our CNNs, the architecture summarizes the outputs in the same kernel map of neighboring groups of neurons. A pooling layer can, therefore, be viewed as a grid of pooling units spaced between pixels, each of which summarizes a neighborhood of size z × z centered at the pooling unit position. The use of overlapping pooling layers decreases error levels compared to the non-overlapping system, which generates equal dimensional outputs.
In the proposed architecture, we use four convolutional layers. Each layer contains a batch normalization and ReLU activation function. The batch normalization is applied for the mini-batch set of the learned parameters of the convoluted features so that it brings the mini-batch data to zero means and normalizes variance.
For the abnormal cases that required the percentage of the existence of the COVID-19 virus inside the image, the proposed system determines the abnormal probability infection using the SoftMax activation function. The algorithm steps of the proposed CXRVN is shown in Algorithm 1.
| Input Image_COVID-19_Set imds |
| Output CXRVN |
|
We train our models using MBGD with a mini-batch size b=32 and a weight decay of 0.0003. This small amount of weight decay is essential for practical training as it is not only a regularization strategy but also it reduces the model’s training error. Furthermore, we apply Adam optimizer based on the same hyper-parameters to boost and ensure the system’s reliability in speed computation time and minimum memory.
On the other hand, we adopt GANs to construct artificial instances for further data augmentation. In Algorithm 2, we summarize the steps of the proposed trained GAN augmentation model.
| Input Image_COVID-19_Set imds, Generator Layers GeLayers, Discriminator Layers DiLayers |
| Output Generator GEN, Discriminator DISC |
|
The excellent success of GANs has led to an increased focus on how they can be applied to the data increment mission. In this article, we take the real images in the dataset, and the discriminator compares it with the generated images represented by the applied noise that represents the difference of the enrolled real images to predict the labels. The generator is applied as input to a given vector of random values (latent inputs), and the network generates data with the same structure as the training data. Discriminator, given batches of data containing both the training data and the generated data from the generator, is trying to classify the observations as “real” or “generated.” Training to produce data that “fools” the discriminator. Train the discriminator to differentiate between real and produced data (Wang, Wang & Wang, 2018; Salehinejad et al., 2018). Due to the limited and variable number of the collected database from different sources, in this work, we collected a database and made GAN augmentation available on the Mendeley website (Shams et al., 2020a).
As we present a CXR COVID-19 Network CXRVN that is build from scratch to identify, recognize and classify chest X-ray images in a simple and very fast manner. Moreover, the proposed methodology used GAN network to augment the limited number of imabalanced dataset from different sources and handled it in an efficient and reliable manner. The comparison of the proposed method compared with the state of the art approaches stated the reliability of the proposed system in terms of accuracy and loss function before and after GAN augmentation.
Evaluation of experimental results
This section is dedicated to exploring the effectiveness of the proposed approach. Due to the variability of the updated standard datasets versions COVID-19 X-ray images, two different experimental studies are carried out, discussed, and analyzed in detail.
All experiments were carried out using the MATLAB 2019b software package running on Microsoft machine with Core i7 processor, 16-RAM, and NVIDIA 4G- GT 740m GPU environment.
Dataset characteristics
There are three datasets we are used in this article; the first one is called Dataset-1 from (Faizan, 2020) which contains 25 normal cases (negative cases) and 25 COVID-19 (positive cases). Smfai presents 50 images and he claims that COVID-19 cases reached to 100% recognized at a time and 80% for negative cases or normal cases. The second one named Dataset-2 from (Mooney, 2020; Bachir, 2020). It is noticed that Dataset-2 collected from two different independent sources, the first one Paul moony (Mooney, 2020) presented 5,863 chest x-ray images with two class labels pneumonia and normal cases. The collected chest-x-ray images also known as (posterior-anterior) were selected from retrospective cohorts of pediatric patients of one to five years old from Guangzhou Women and Children’s Medical Center, Guangzhou. All chest X-ray imaging was performed as part of patients’ routine clinical care. We used only 234 normal cases selected from 1,341 image with percentage (17.44%) and 148 pneumonia cases out of 3,875 trained cases. The second one is which has 221 COVID-19 cases selected from 314 images with percentage (70.38 %). The dataset is collected from 205 male and female patients with ages in between 120 and 88 years old.
The third dataset called Dataset-3 was uploaded in Menedely (Shams et al., 2020a). This collected data contains 603 chest-x-ray images with three class labels normal, COVID-19, and pneumonia cases which are 234, 221 and 148 respectively. We further augment the dataset using GANs, which produce 6,030 images; 2,340, 2,210, 1,480 for normal, COVID-19, and pneumonia images, respectively. The details of all datasets are summarized in Table 1. We used the dataset collected by Toğaçar, Ergen & Cömert (2020) for comparison study.
| Dataset name | # of Instances | # of Classes | Labels | Balance |
|---|---|---|---|---|
| Dataset-1 | 50 | 2 | Normal: 25 | 1.0 |
| COVID-19: 25 | ||||
| Dataset-2 | 455 | 2 | Normal: 234 | 0.94 |
| COVID-19: 221 | ||||
| Dataset-3 | 603 | 3 | Normal: 234 | 0.8 |
| COVID-19: 221 | ||||
| Pneumonia: 148 | ||||
| Toğaçar, Ergen & Cömert (2020) | 458 | 3 | Normal: 295 | 0.7 |
| COVID-19: 65 | ||||
| Pneumonia: 98 |
Parameters optimization
In this part, we attempt to optimize the proposed CXRVN architecture using the Bayesian algorithm to minimize the scalar objective function. We need to update the Gaussian process model to find a new point that is required for maximizing the acquisition function by sampling thousands of pints with the variable bounds. Therefore, in this work, we propose to use MBGD to find the local minima that satisfy constraints. Moreover, the proposed CXRVN architecture is fitted to overcome the additive noise with minimum loss after GAN augmentation using both MBGD and Adam optimizers.
All experiments were done based on the following parameters. The hyper-parameter values of the proposed DCNN architecture, as shown in Table 2.
| Parameter | Value |
|---|---|
| Learning Rate | 0.01 |
| Batch Size | 32 |
| Momentum | 0.8 |
| Weight Decay | 0.0003 |
| Max no. of iterations | 600 |
Performance measures
To evaluate the performance of the proposed DCNN architecture, the well-known performance measures for the evaluation are used, in terms of, the sensitivity, specificity, precision, accuracy and F1score from the confusion matrix based on the following Equations:
(10)
(11)
(12)
(13)
(14) where TP, TN, FP, and FN are true positive, true negative, false positive, and false negative, respectively.
Evaluation of the proposed CXRVN
The evaluation of the proposed CXRVN was performed to get the final decision of the trained model. Initially, the datasets, which contain the normal, COVID-19, and pneumonia cases, are collected and enrolled. Afterward, the datasets are splitted into training and testing sets. The trained images are then applied to the GAN augmentation process, which takes the trained sets of the enrolled image and generates the synthesized image datasets to produce an augmented COVID-19 dataset.
We used the k-fold cross-validation strategy with k = 10 cross validation. Specifically, we train on k−1 folds and validate on the remaining 1-fold. Then we calculate the average from n iterations as shown in detail in Fig. 3. We able to control the number of iteration of the trained COVID-19 chest X-ray images to be compared with tested images to obtain the final evaluation.
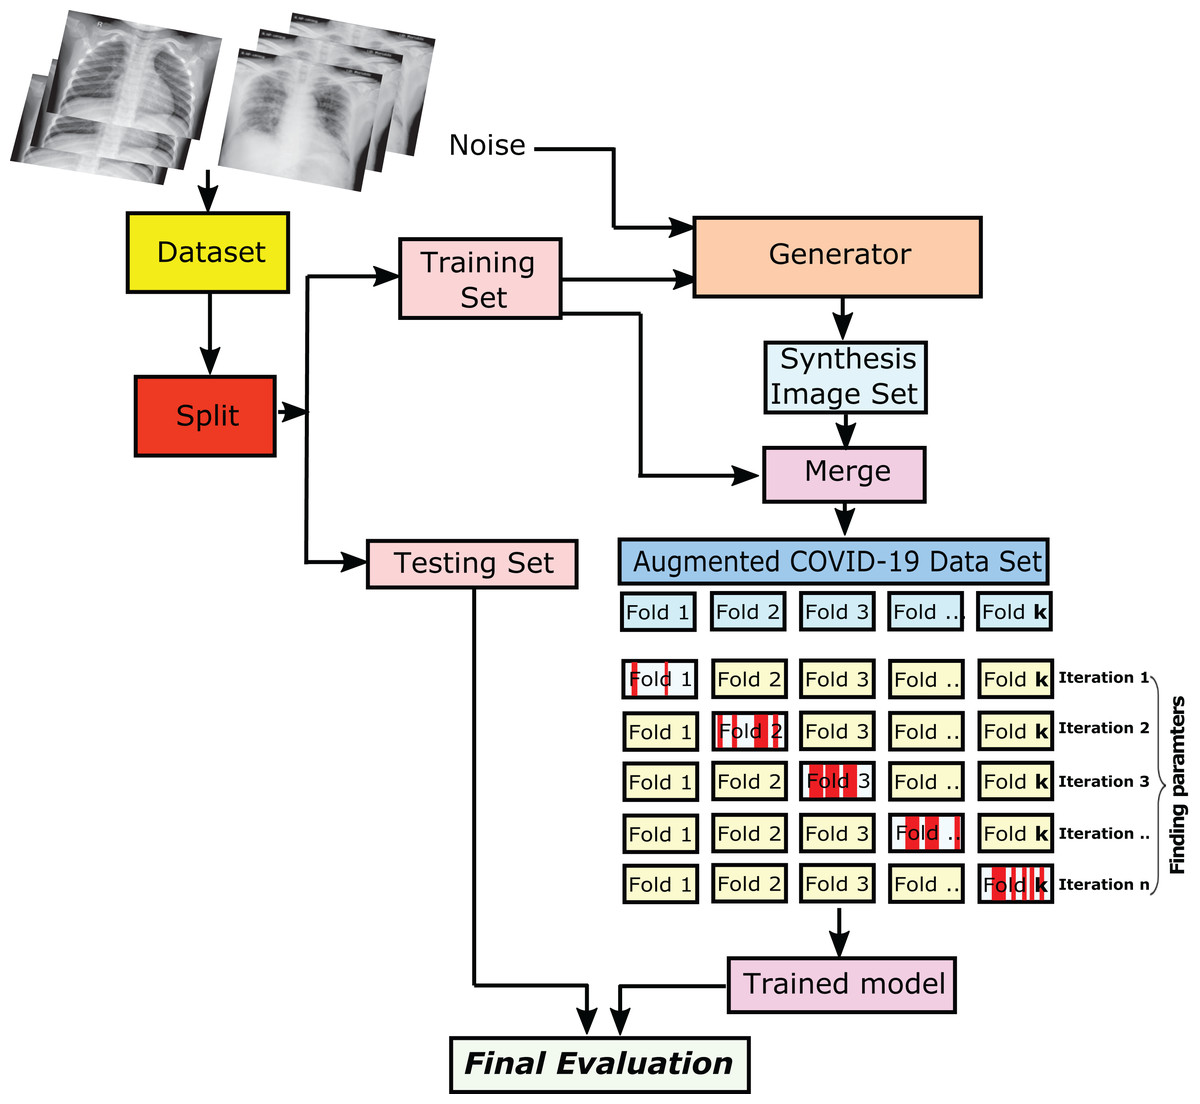
Figure 3: The steps of getting the final evaluation results of the trained/tested augmented COVID-19 chest X-ray images.
The CXR images were downloaded from Kaggle under a CC0 1.0 license.
The collected datasets consist of normal cases and COVID-19 ones. These datasets are splitted into two sets, and they are the training and testing sets. To overcome the overfitting problem, We split the datasets into 80% for the trained images, and the remaining 20% is for the testing ones. Subsequently, the training sets are augmented via the use of GAN. Therefore, the hyper-parameters values of the training sets have learned and proceeded with the evaluation to produce the validation set. Every iteration of the shuffled fold is split by generating an independent number of the trained/tested image.
Experiment (I): Dataset-1
The first experiment was conducted using dataser-1. This experiment is performed using the same parameters mentioned in Table 2. Subsequently, we used the proposed architecture shown in Fig. 2 by enrolling all 50 grayscale images to the system. The enrolled images are with size 128 × 128 × 1. Furthermore, we used the mini-batch gradient descent optimizer for the trained convoluted input features. Afterward, the maximum pooling of the convoluted images to produce the fully connected layer that contains 1 × 1 × 1,024. Finally, the CXRVN classify the results either to normal or COVID-19 case. A sample of the dataset is shown in Fig. 4. This experiment is considered as an initial experiment to prove the ability of the proposed architecture to handle and solve the classification problem based on the small collected dataset. The accuracy and loss function of the proposed CXRVN architecture for a given hyper-parameter value is shown in Fig. 5.
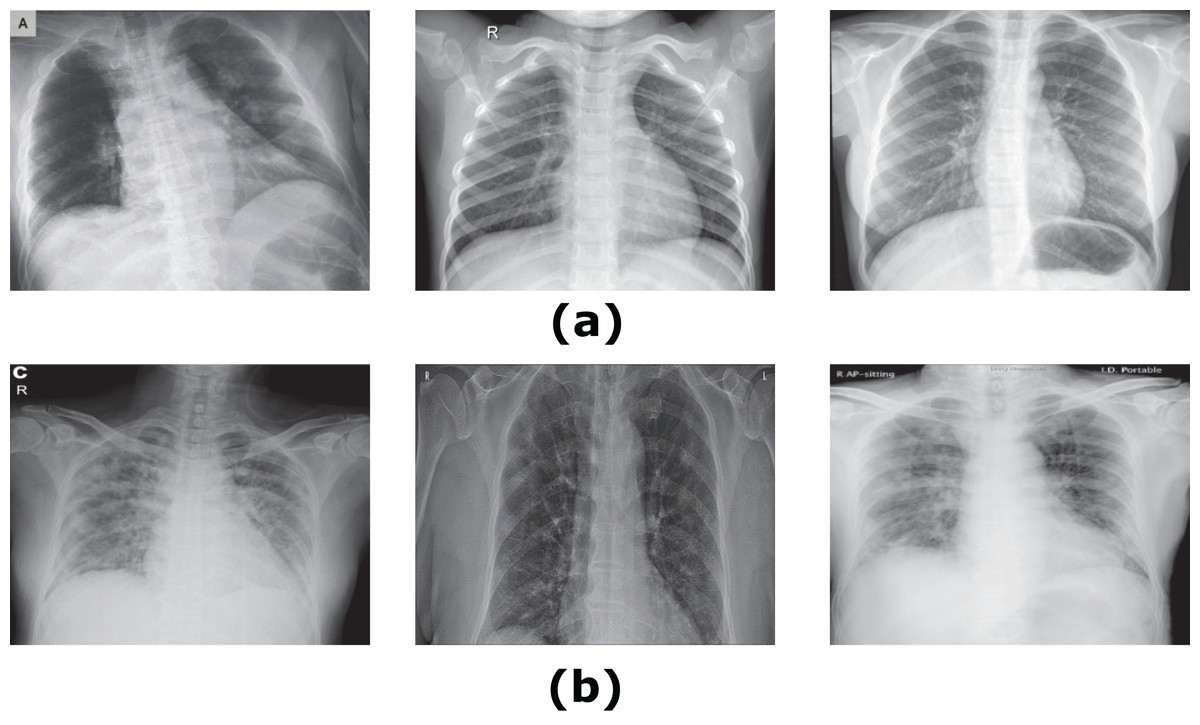
Figure 4: Samples of Dataset-1 (Faizan, 2020).
(A) Normal X-Ray images, (B) infected COVID-19 X-Ray images. The CXR images were downloaded from GitHub under a CC0 1.0 license.
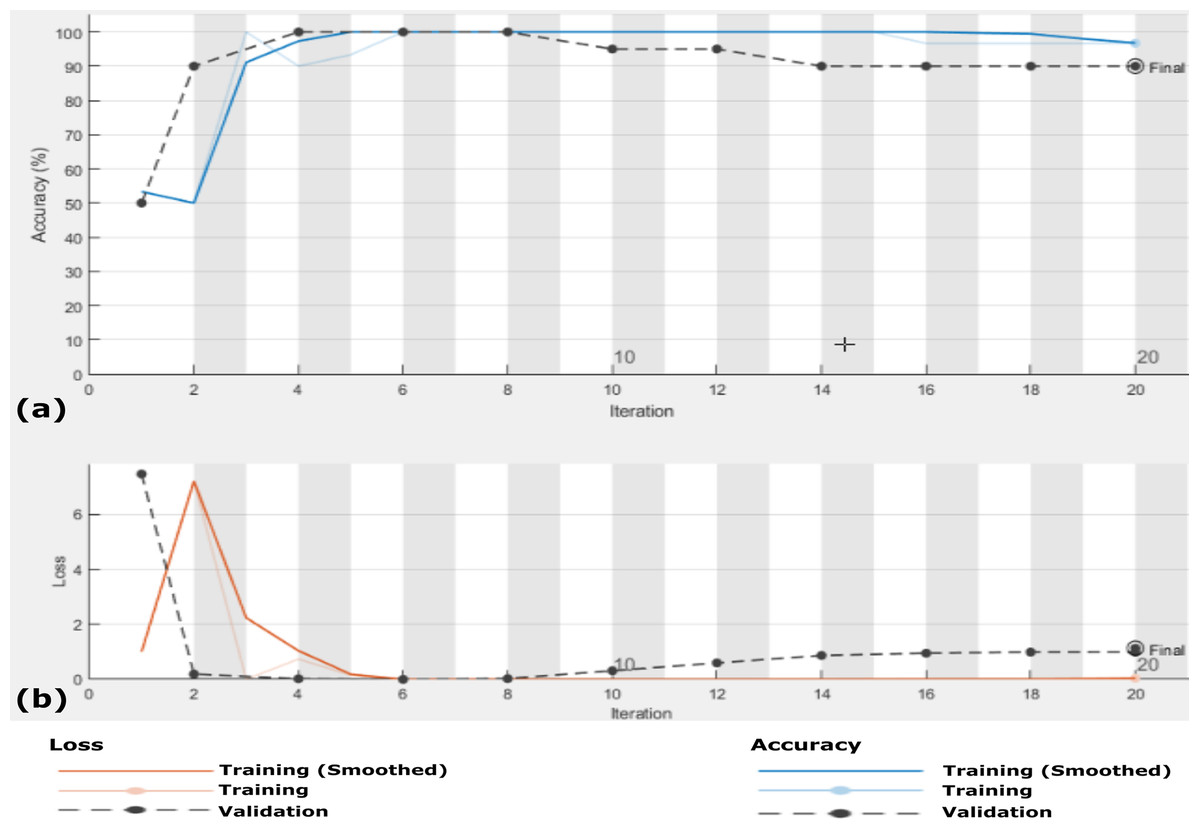
Figure 5: Accuracy and loss of the proposed CXRVN architecture for the testing X-ray images in Dataset-1 (A) Accuracy reaches 88% of the testing images, (B) loss enhancement after 20 iteration.
In this experiment we used k-fold cross-validation (k = 10) for all stacked 50 X-ray images. The confusion matrices of the achieved results are shown in Fig. 6, which show that the proposed system accuracy achieved for testing, training, and cross-validation are 90.0%, 92.5% and 88%, respectively. The confusion matrix measurements, including sensitivity, specificity, accuracy, precision and F1 score in both cross validation, training, and testing phases are summarized in Table 3. We notice that, the average results of the proposed CXRVN architecture is 92.85% in the testing phase.
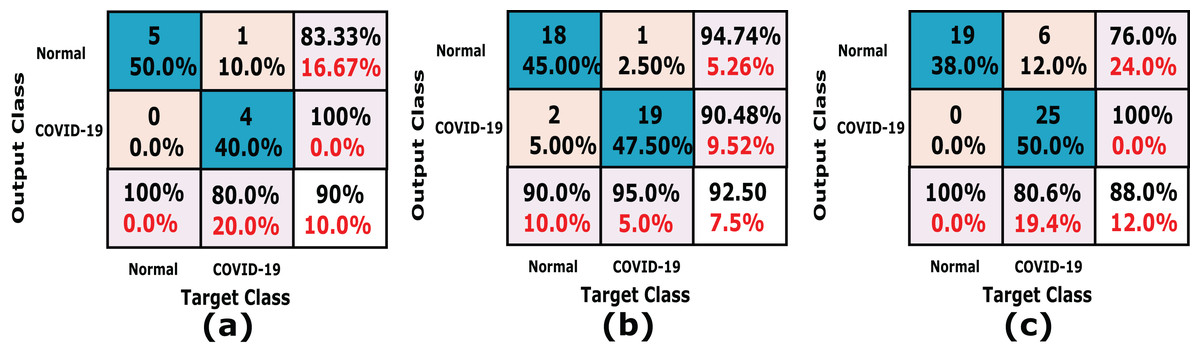
Figure 6: A detailed confusion matrix results of the proposed CXRVN system.
(A) Testing (20%). (B) training (80%) (C) 10-fold Cross Validation.
| Dataset-1 | |||
|---|---|---|---|
| CXRVN-architecture | Validation Methodology | ||
| Cross Validation | Holdout | ||
| 10-fold cross validation (%) | Training (80%) | Testing (20%) | |
| Sensitivity | 76.00 | 94.74 | 83.33 |
| Specificity | 100.00 | 90.48 | 100.00 |
| Precision | 100.00 | 90.00 | 100.00 |
| Accuracy | 88.00 | 92.50 | 90.00 |
| F1score | 86.36 | 92.31 | 90.91 |
| Average | 90.07 | 92.01 | 92.85 |
Intuitively, only 50 X-Ray images are not sufficient to prove the reliability and robustness of the proposed system. Therefore, we have to expand the data of the X-ray COVID-19 images. Furthermore, enhancement of the augmentation process by applying GAN augmentation for the input images is urgently required.
Experiment (II): Dataset-2
In this experiment, we utilize Dataset-2 based on the same hyper-parameter values mentioned in Table 2 for normal and COVID-19 X-ray images. Furthermore, for image data augmentation, GAN is used in the preprocessing stage to ensure the reliability of the proposed system and to enhance the results in a large-scale standard dataset with the same hyper-parameter values. The validation is processed every two iterations; also, every ten cycles, the data is shuffled (10-fold cross validation). In this experiment, afterward, the data shuffled and using MBGD, the regulator rate is 0.0001 given that the number of the trained images is 364, and the number of validated images 91, and we used the evaluation results based on 80% training and the remaining 20% for testing. Figures 7 and 8 show the samples of the dataset used (Mooney, 2020, at https://www.kaggle.com) and (Bachir, 2020, at https://www.kaggle.com) respectively.
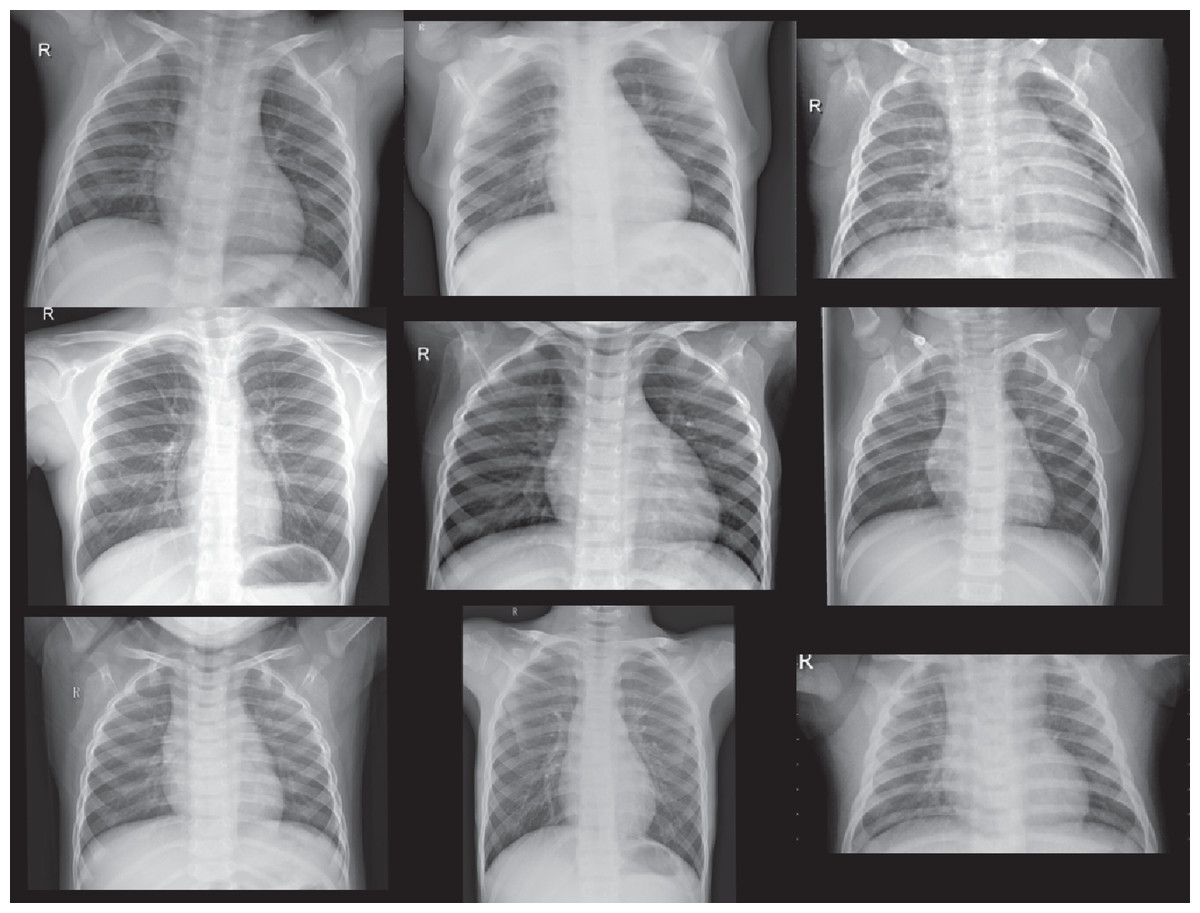
Figure 7: Normal Cases out of Dataset-2 from (Mooney, 2020).
The CXR images were downloaded from Kaggle under a CC0 1.0 license.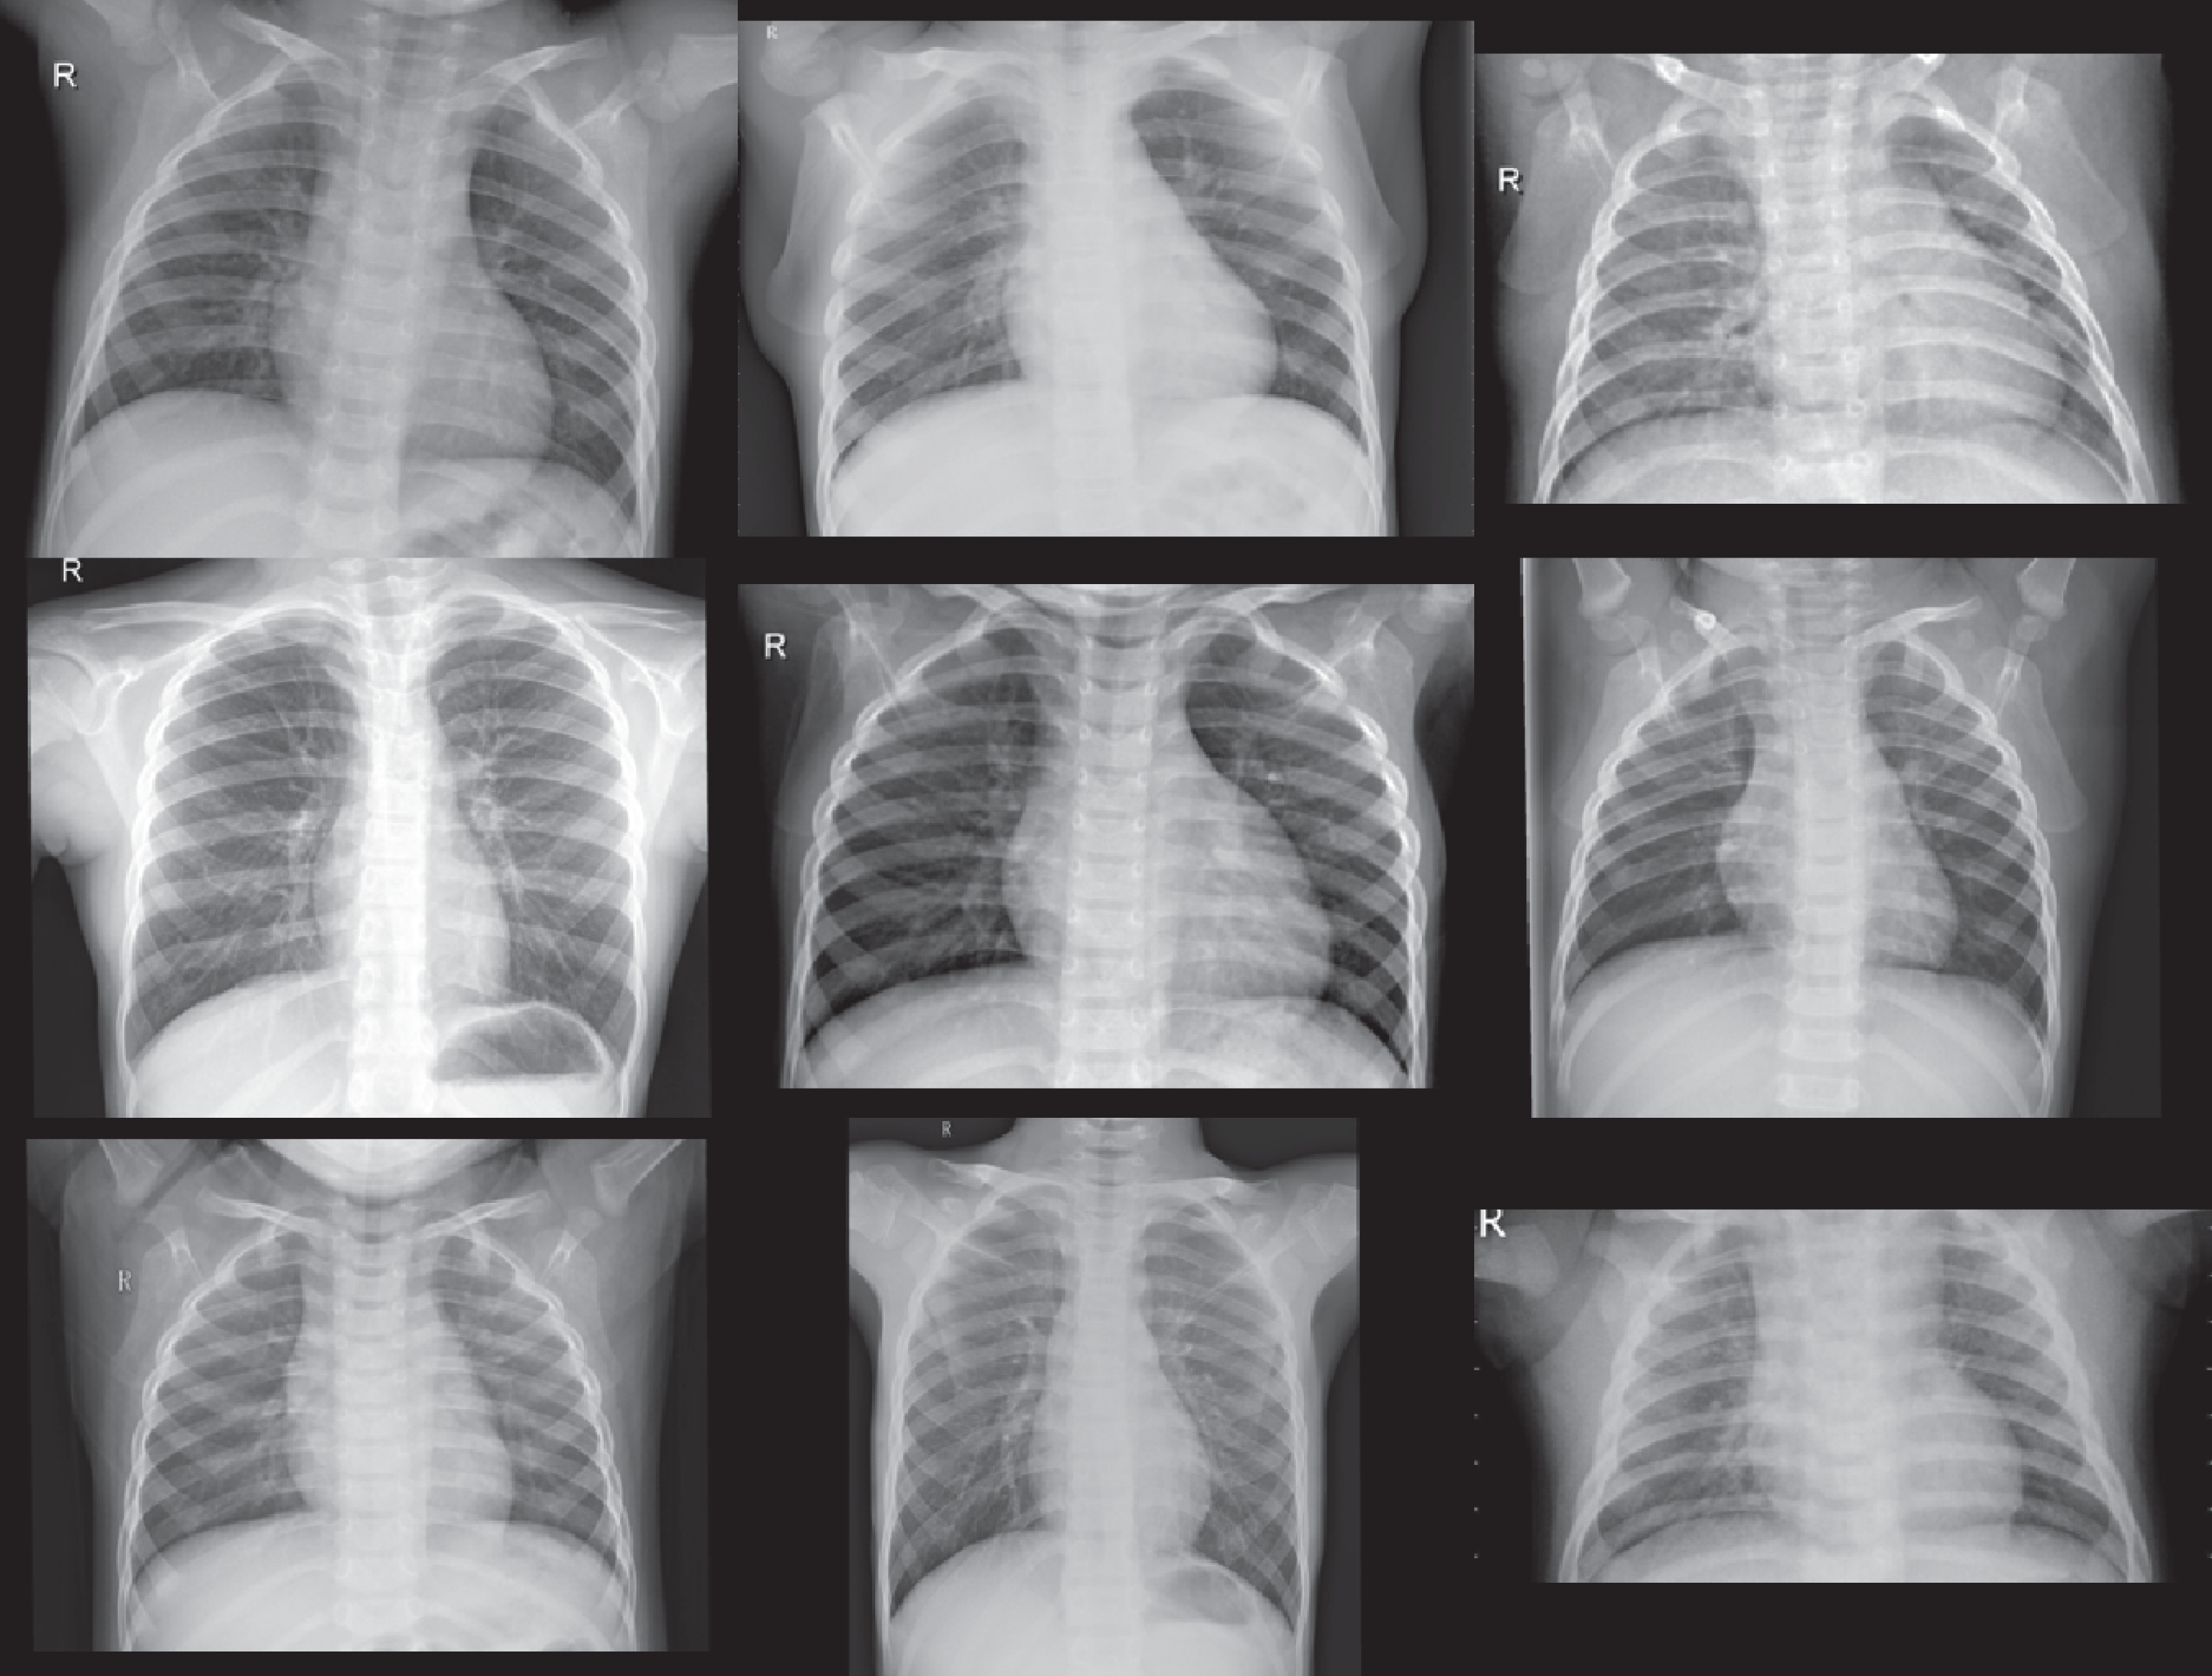
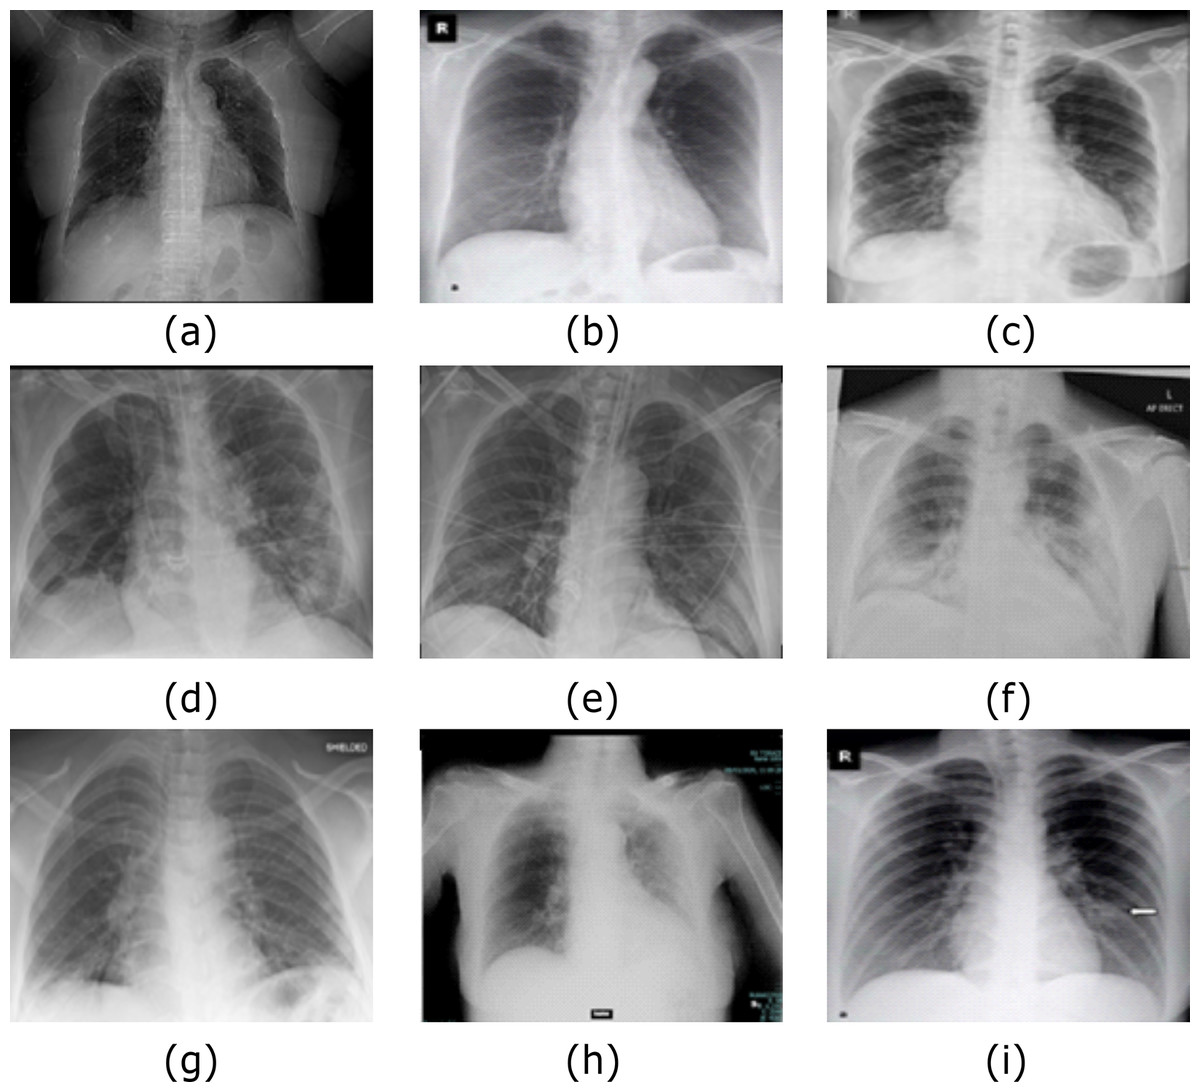
Figure 8: Samples of COVID-19 Cases (A–I) out of Dataset-2 from (Bachir (2020).
The CXR images were downloaded from Kaggle under a CC0 1.0 license.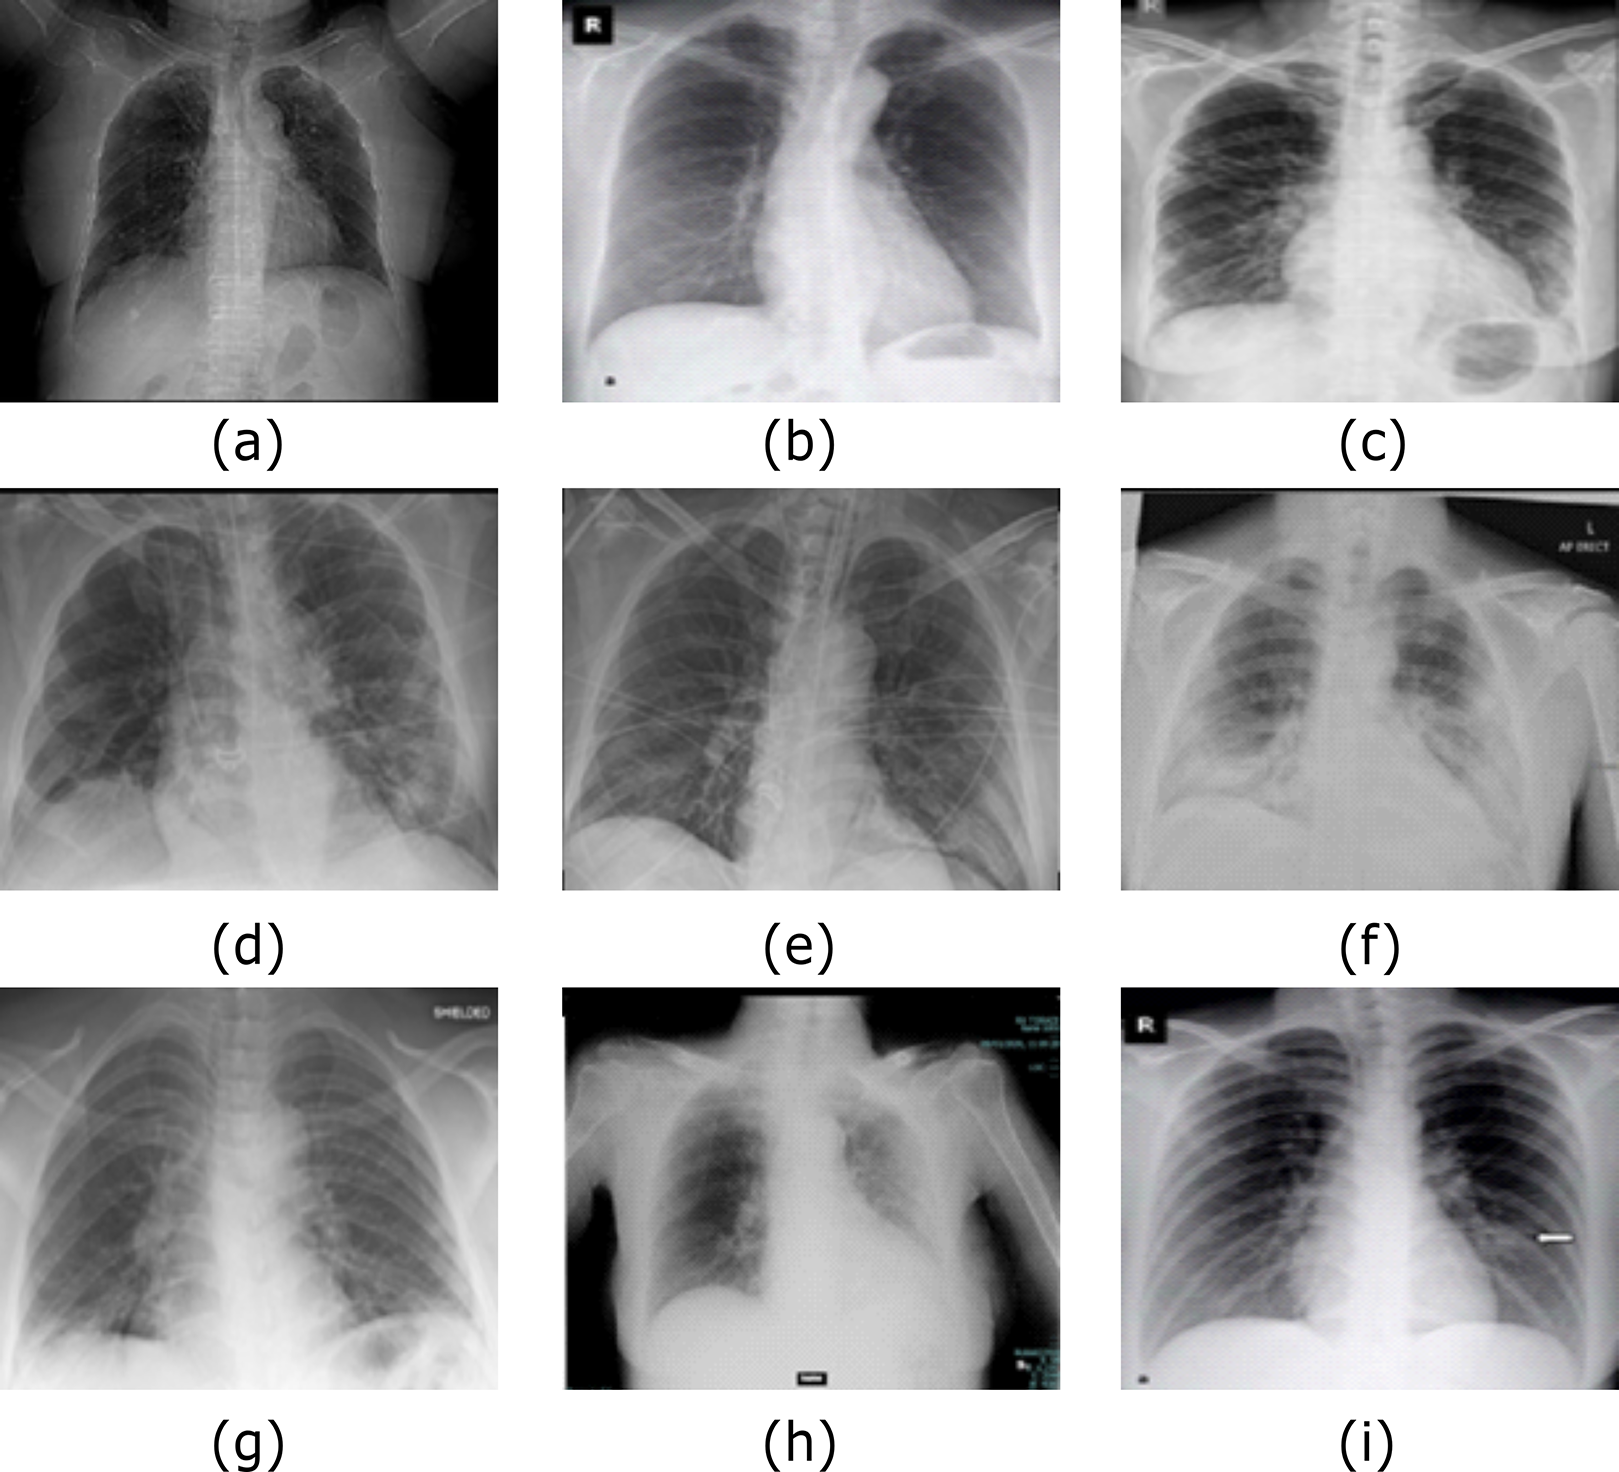
We perform this experiment in two scenarios. The first scenario is using Dataset-2 without augmentation, that is, using only 455 images. The second scenario is after GAN augmentation, which generates 4,550 images based on the hyper-parameter values listed in Table 2. The results of the two scenarios are summarized in Table 4, which prove the system reliability. The CXRVN-architecture has critical advantages, including the reliability and stability of the running process. During changing the datasets, the CXRVN shows the solidity of architecture against a source of dataset and size. The accuracy and loss function of the proposed system architecture for phase 1 without data image augmentation is shown in Fig. 9. In this experiment the final result that represents the accuracy of the tested 91-X-ray images is 96.70% after 160 iteration. It is very clear that, the loss function is slightly high after 20–40 iteration and it becomes more stable with minimum value after 160 iteration. In this experiment we used MBGD optimizer before augmentation with b = 32. Therefore, we need to enhance the loss and accuracy at the same time. To boost the results obtained and produce enhancement accuracy with a minimum loss, Adam optimizer with MBGD is applied in the X-ray image augmentation based on GAN architecture.
| Dataset-2 | ||
|---|---|---|
| CXRVN-architecture | Scenario 1 without augmentation (%) | Scenario 2 augmentation using GAN (%) |
| Sensitivity | 97.83 | 98.91 |
| Specificity | 95.56 | 96.24 |
| Precision | 95.74 | 96.38 |
| Accuracy | 96.70 | 97.58 |
| F1score | 96.77 | 97.63 |
| Average | 96.52 | 97.35 |
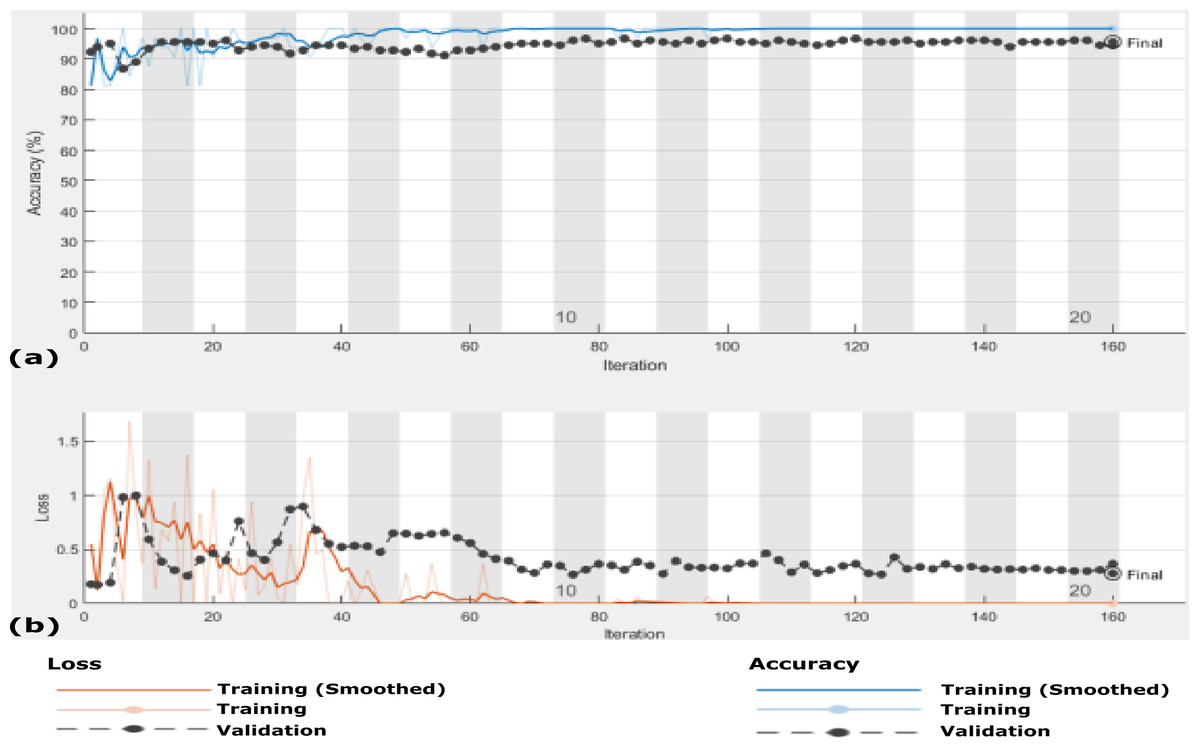
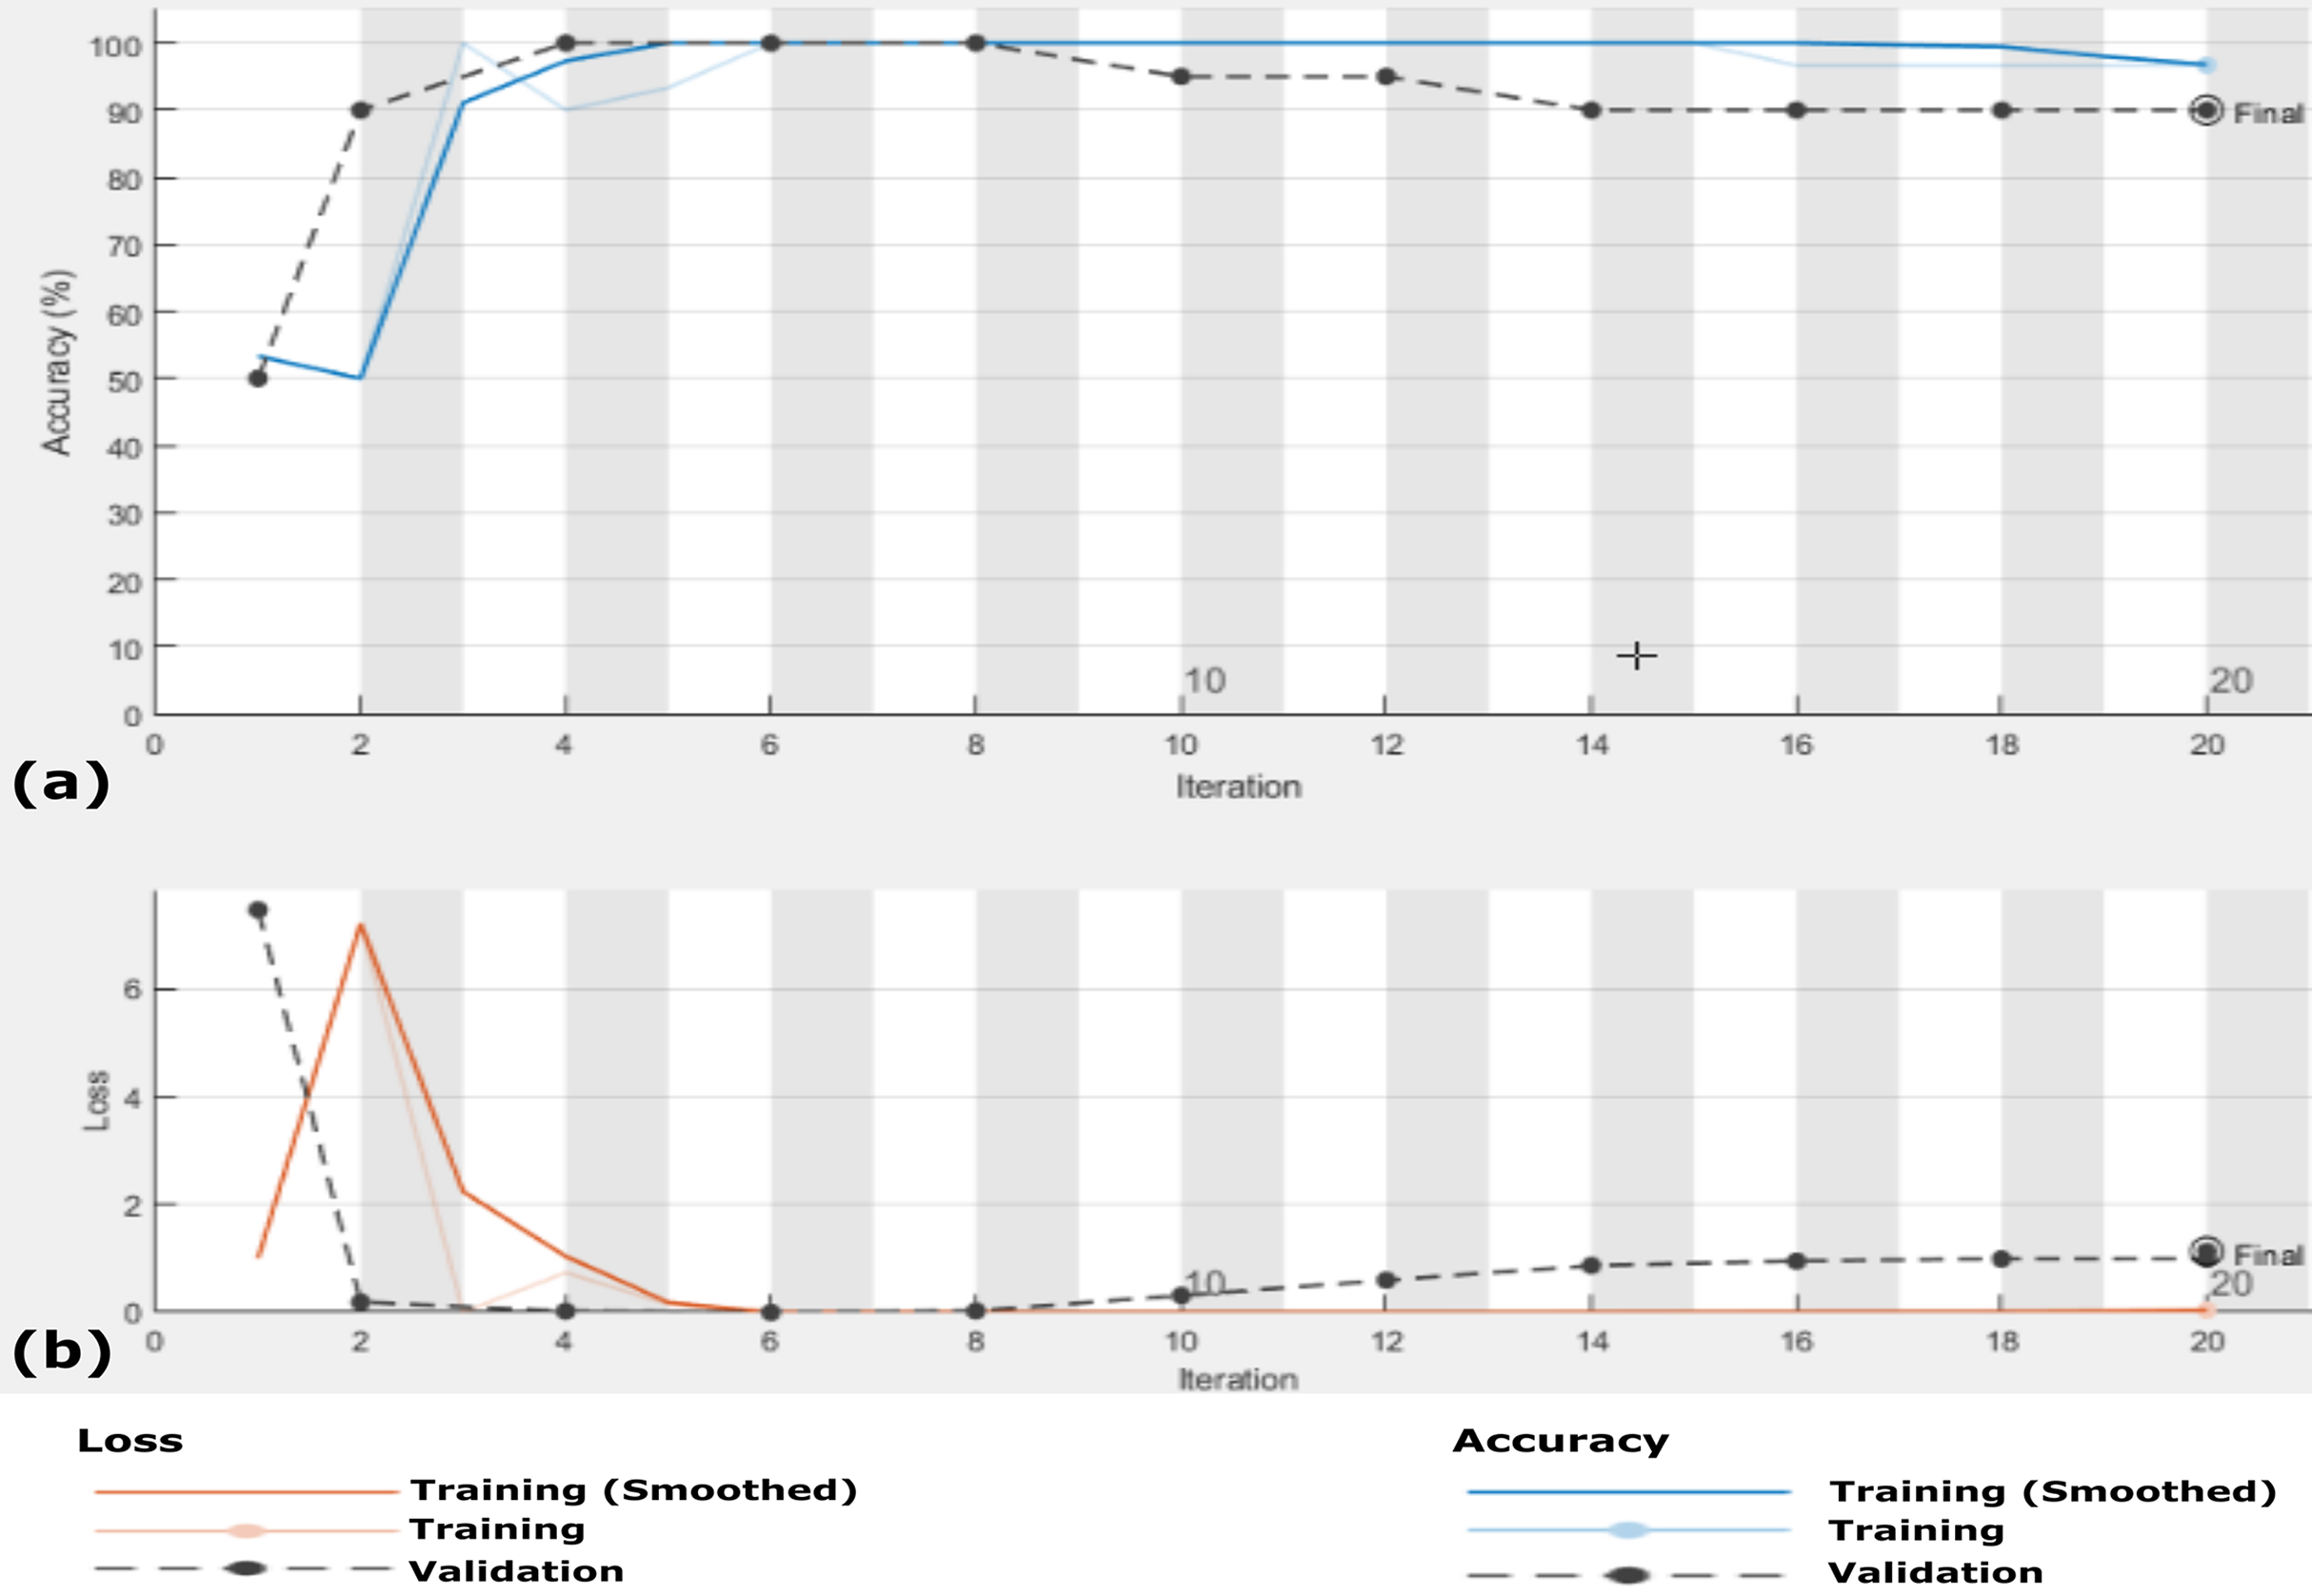
Figure 9: The accuracy and loss of the proposed CXRVN architecture for scenario 1 in Dataset-2 without GAN augmentation in testing.
(A) The accuracy (96.70%) and (B) loss after 160 iteration.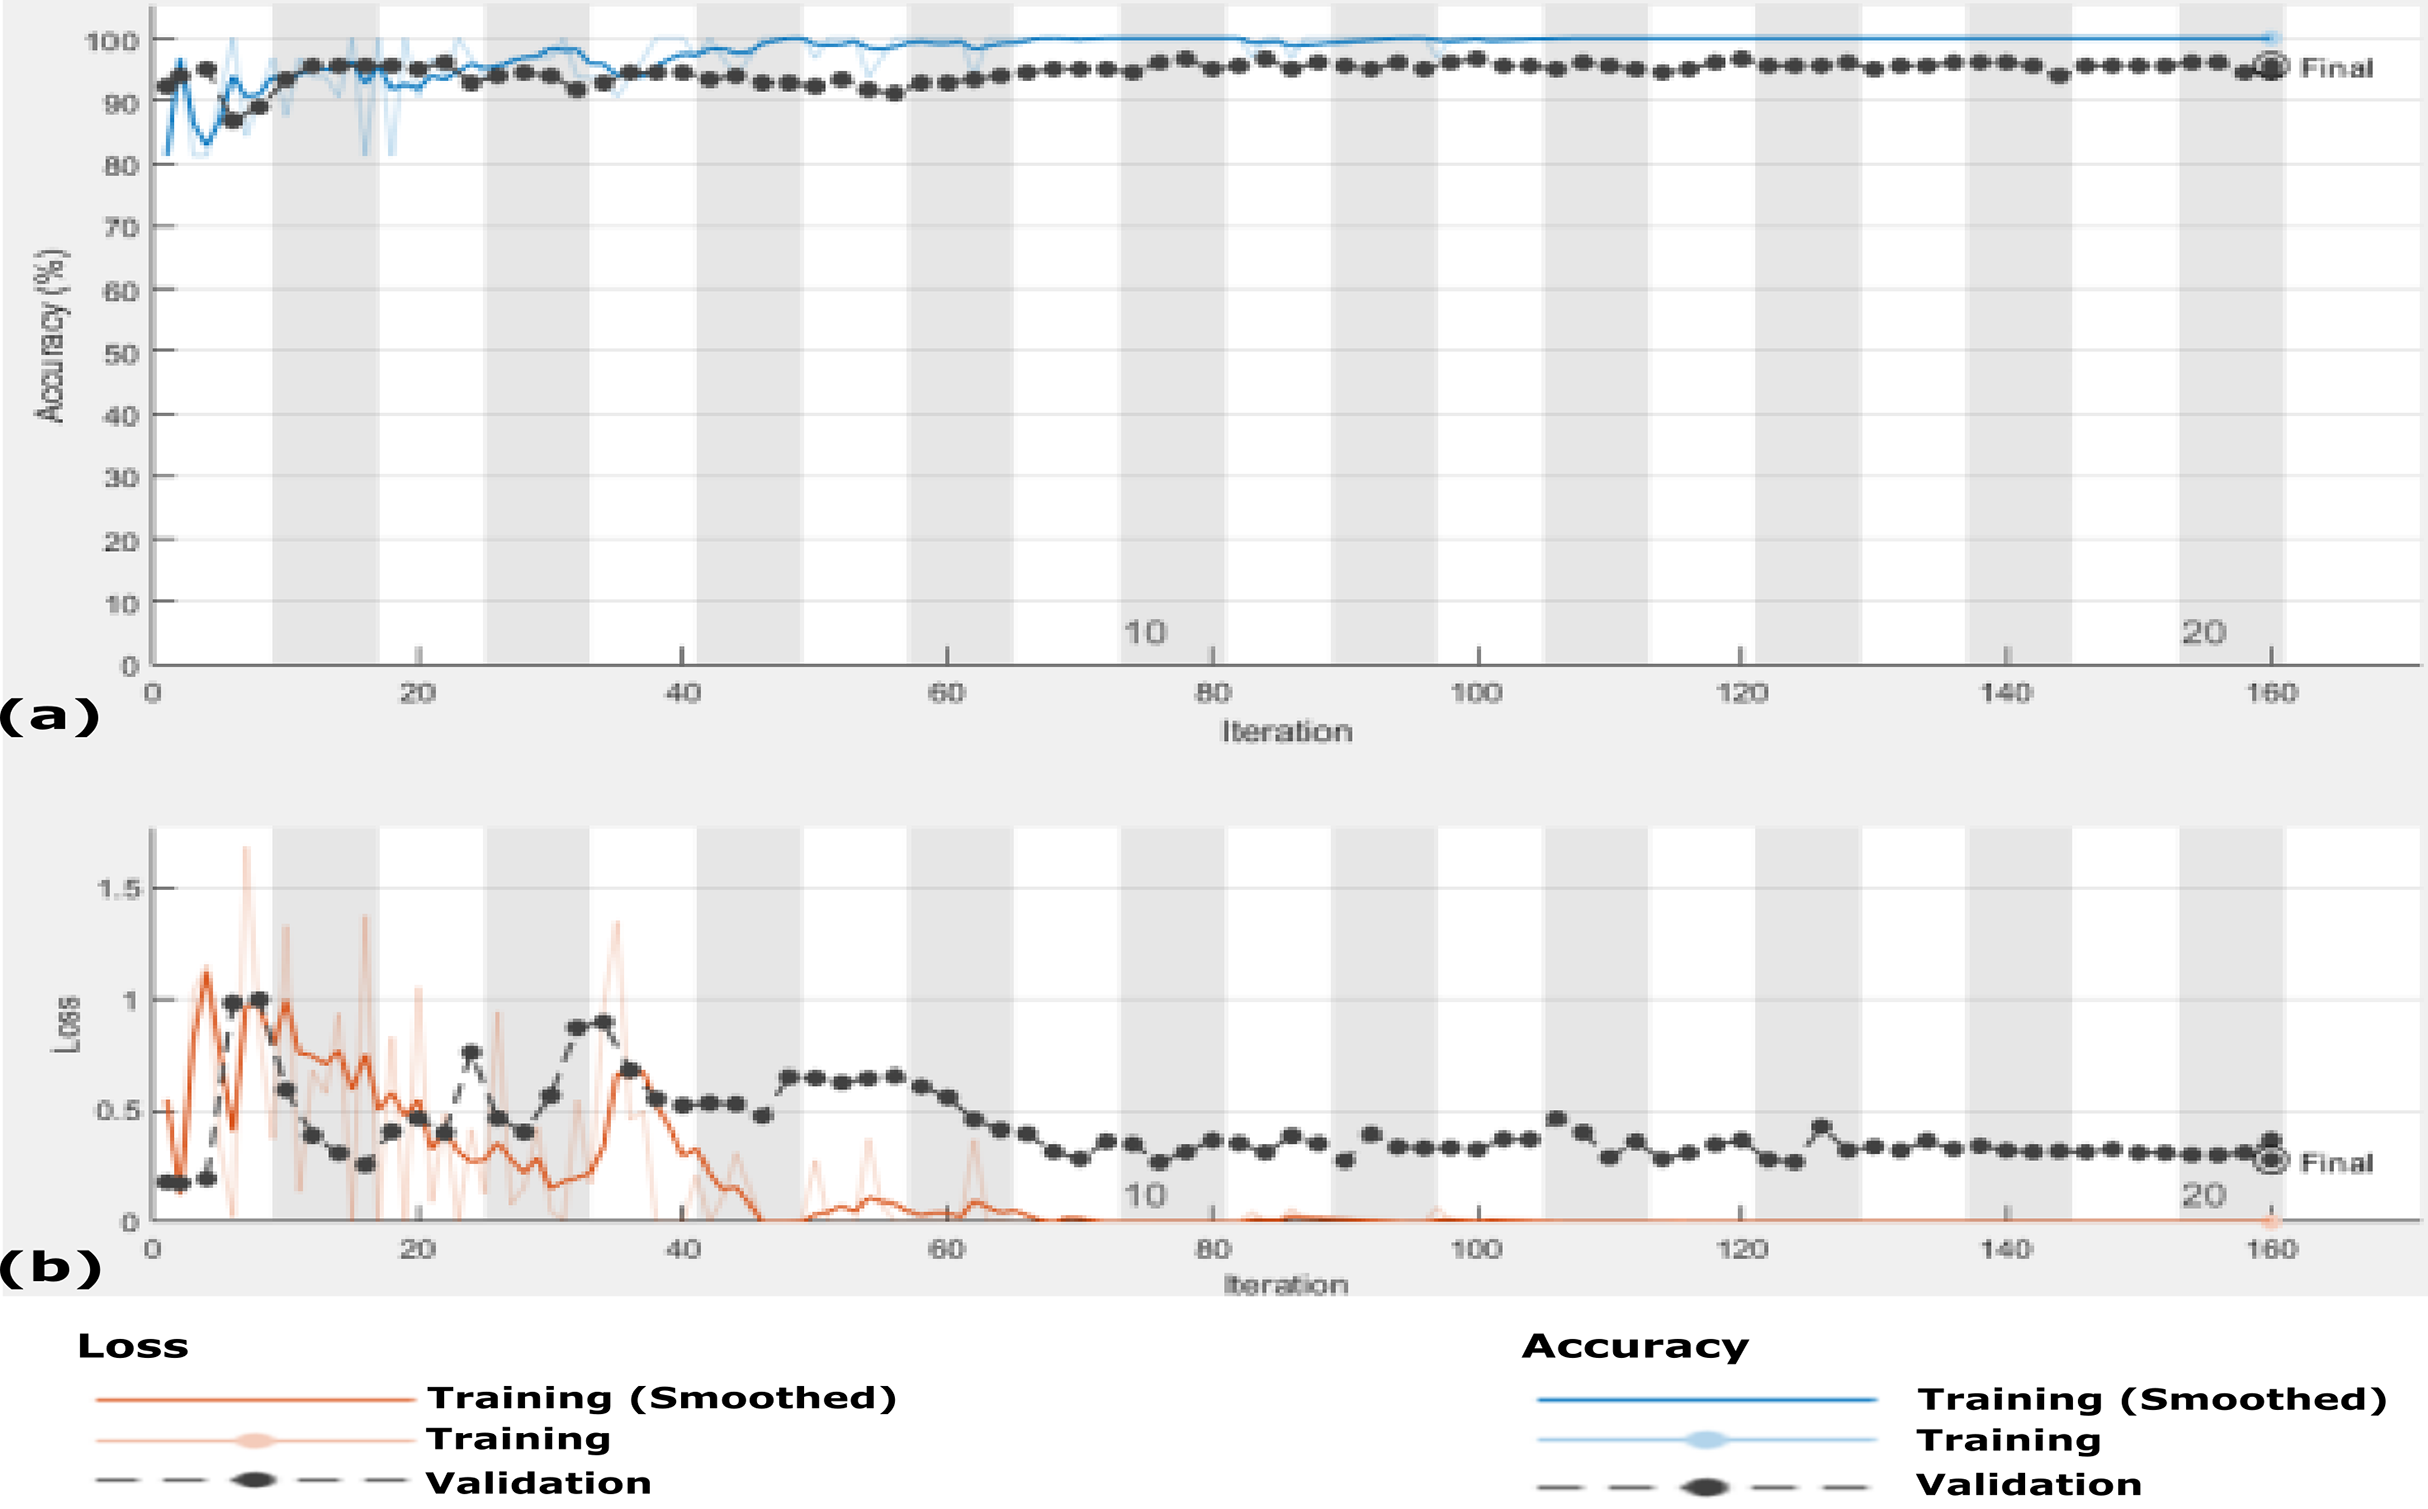
Scenario 2
In this scenario, we use the same 455 X-ray images that is, Dataset-2 and the data are enlarged 10 times to generate 4,550 X-ray images using GAN augmentation architecture. In this experiment, same hyper-parameter values in Table 2 are used but with MBGD instead of Adam optimizer, and the maximum number of iteration was 220. Figure 10 shows the accuracy and loss function of the proposed CXRVN architecture on the 4,550 X-ray images after GAN augmentation using Adam optimizer.
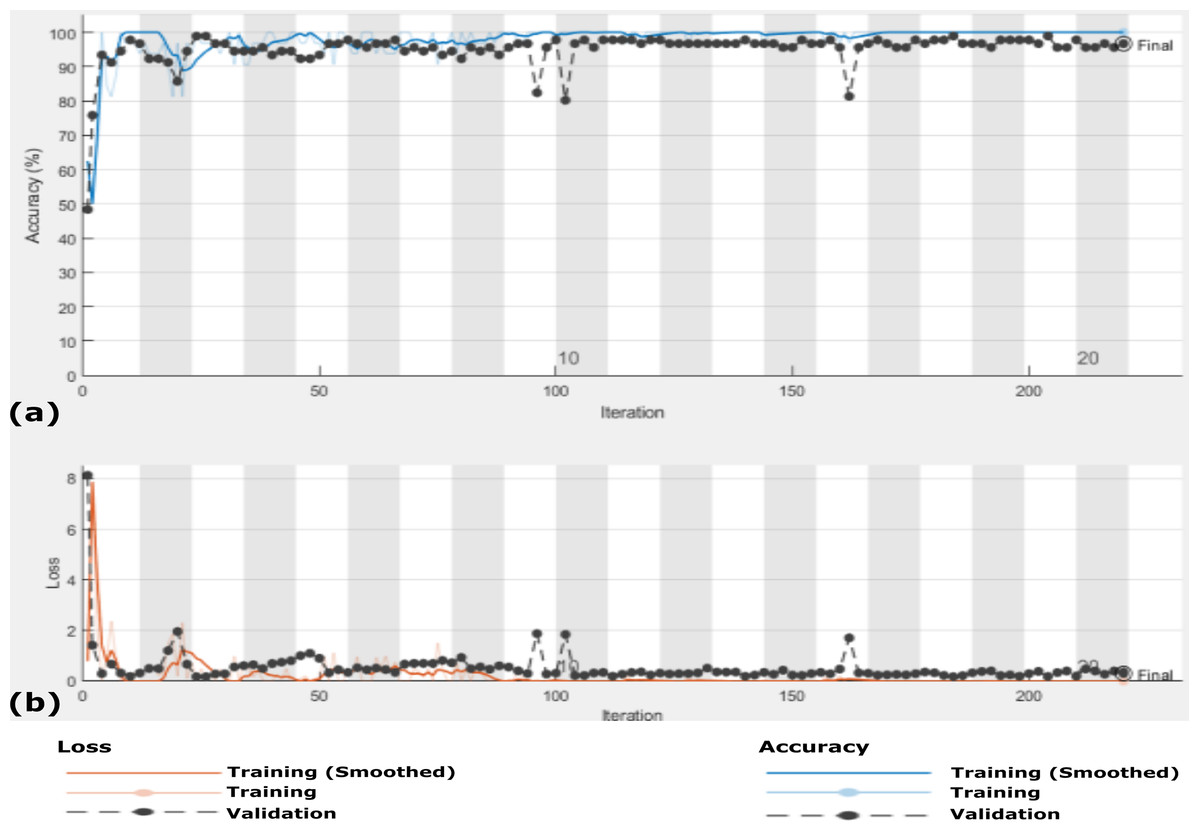
Figure 10: The accuracy and loss of the proposed CXRVN architecture for phase 2 After GAN augmentation in testing phase.
(A) The accuracy reached to 97.35% and (B) the loss after 220 iterations.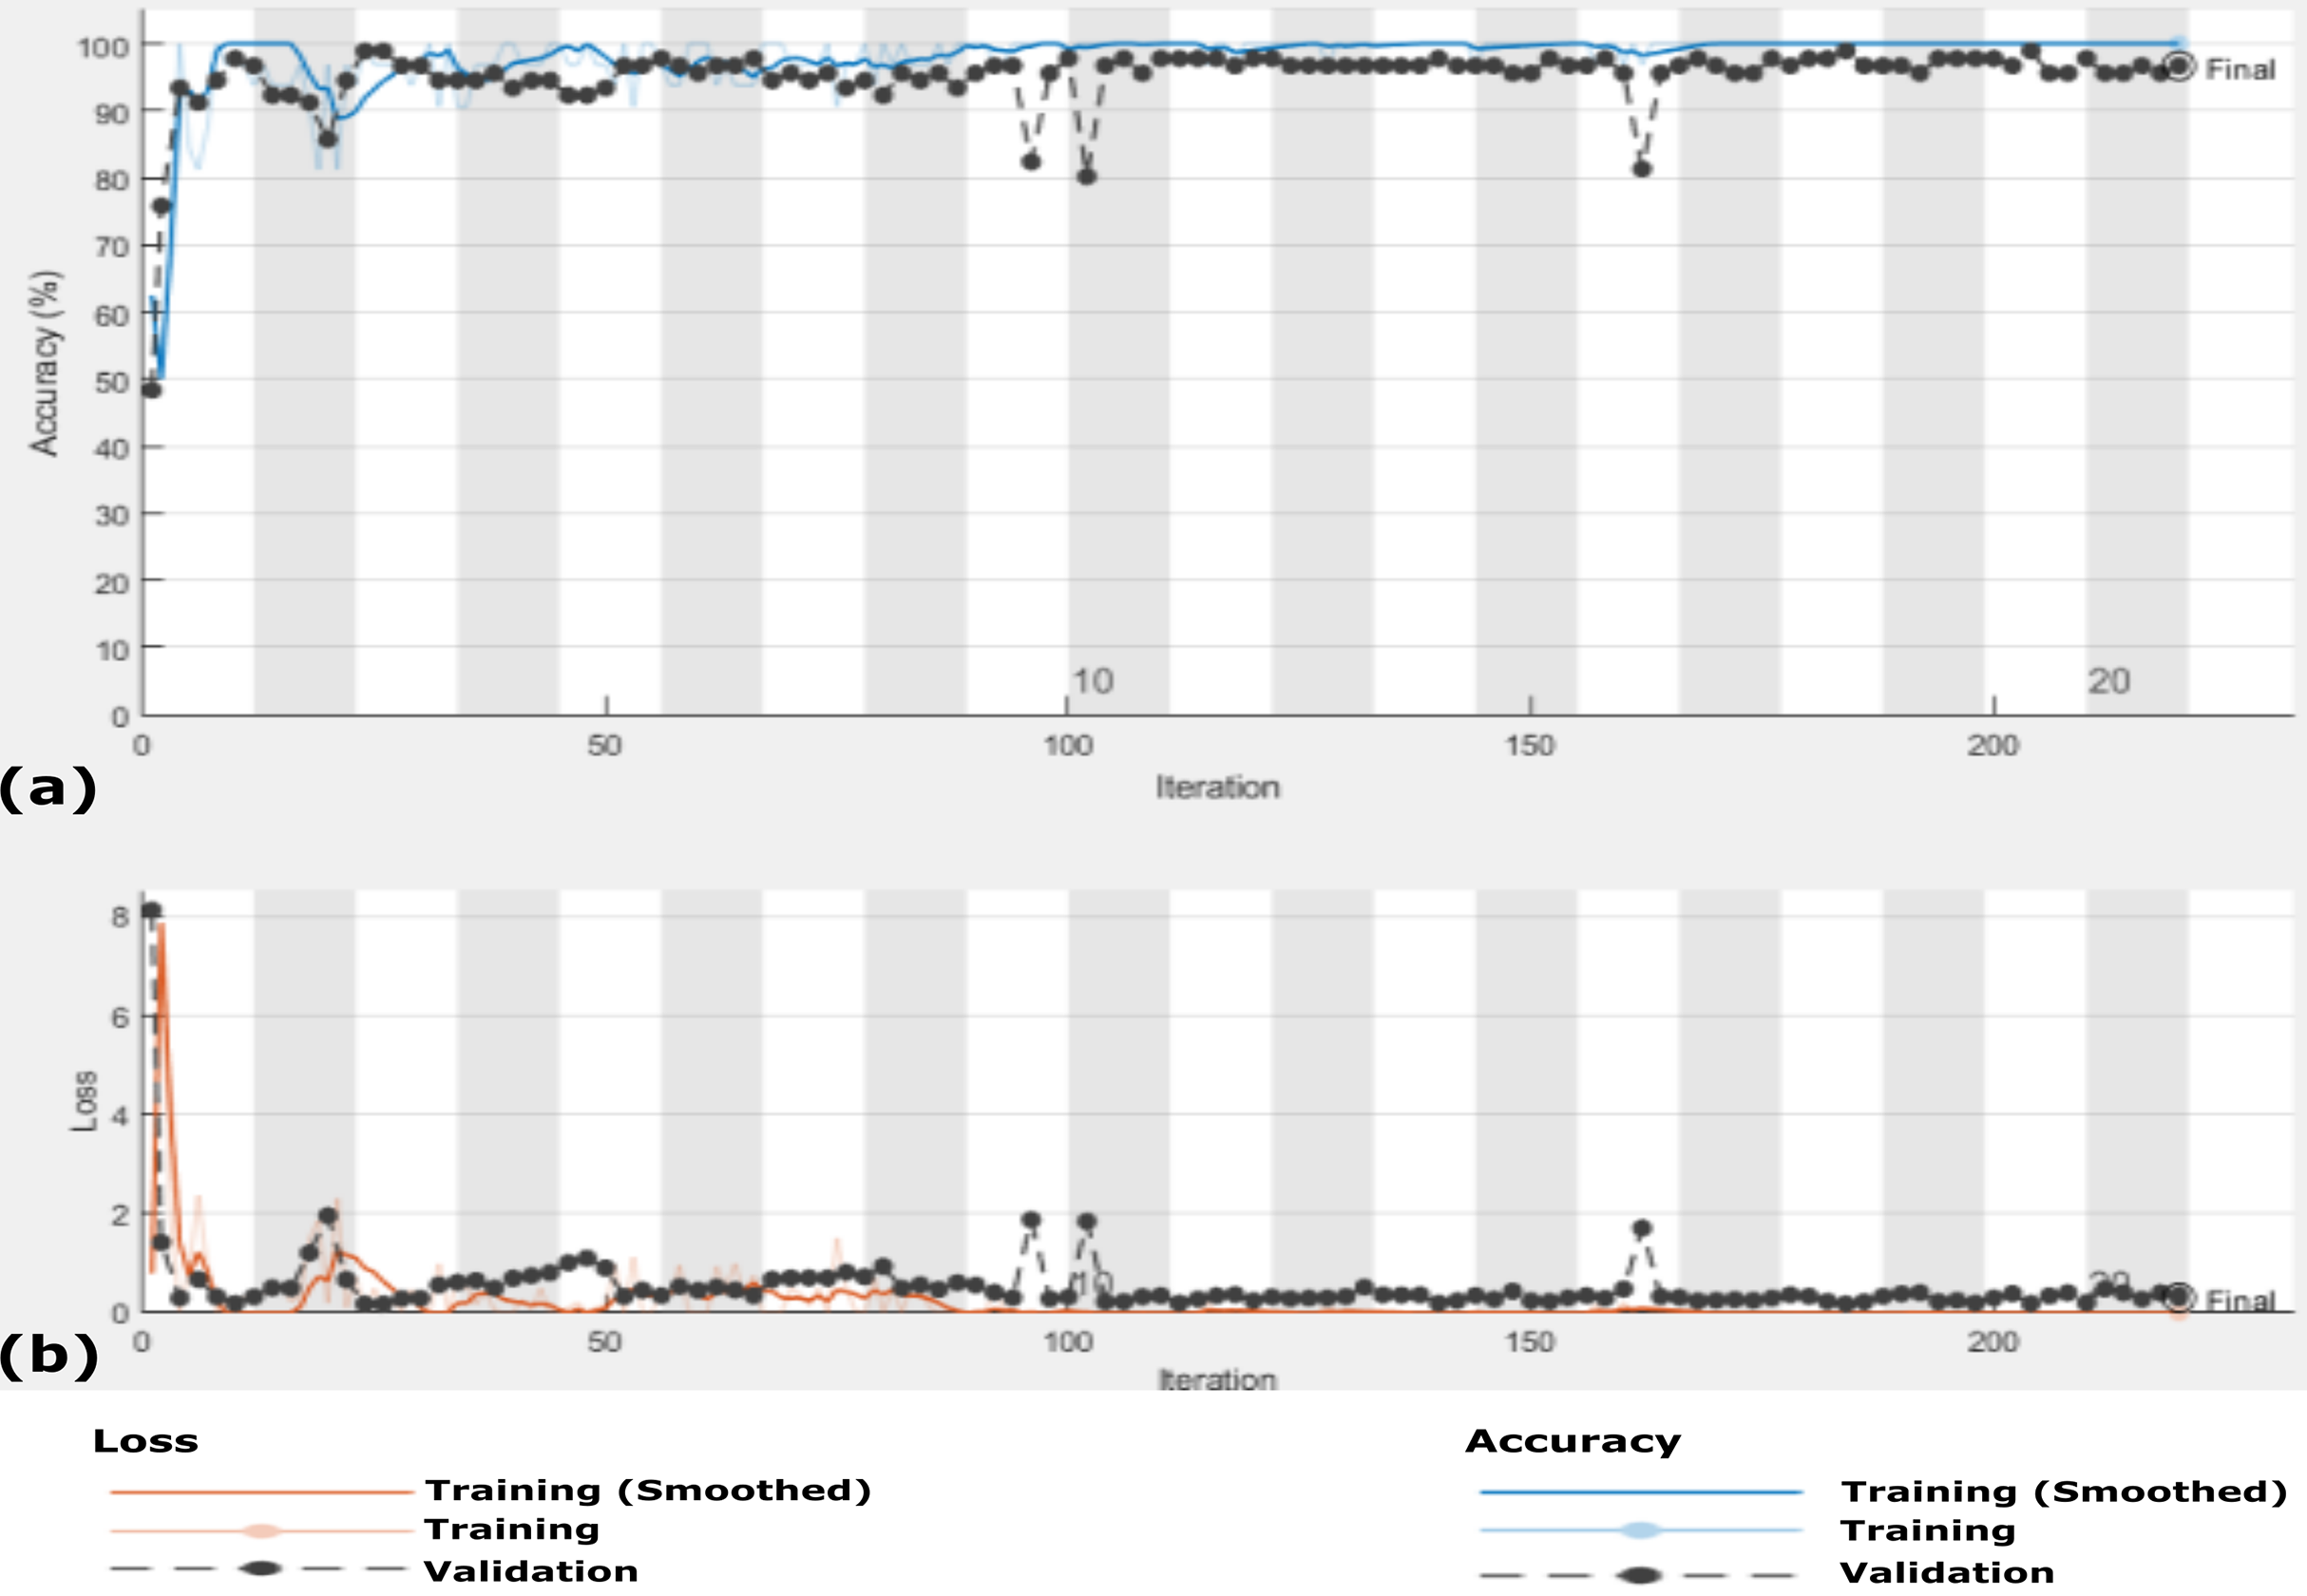
It is noteworthy that, high accuracy of 97.58% is obtained after GAN augmentation with a minimum and stable loss after 220 iterations. Further, we prove the ability of the proposed CXRVN in the presence of big datasets of normal and COVID-19 X-Ray images. The confusion matrices of the two scenarios with and without data augmentation are shown in Fig. 11 for 91 and 910 tested X-ray images out of 455 and 4,550, respectively.
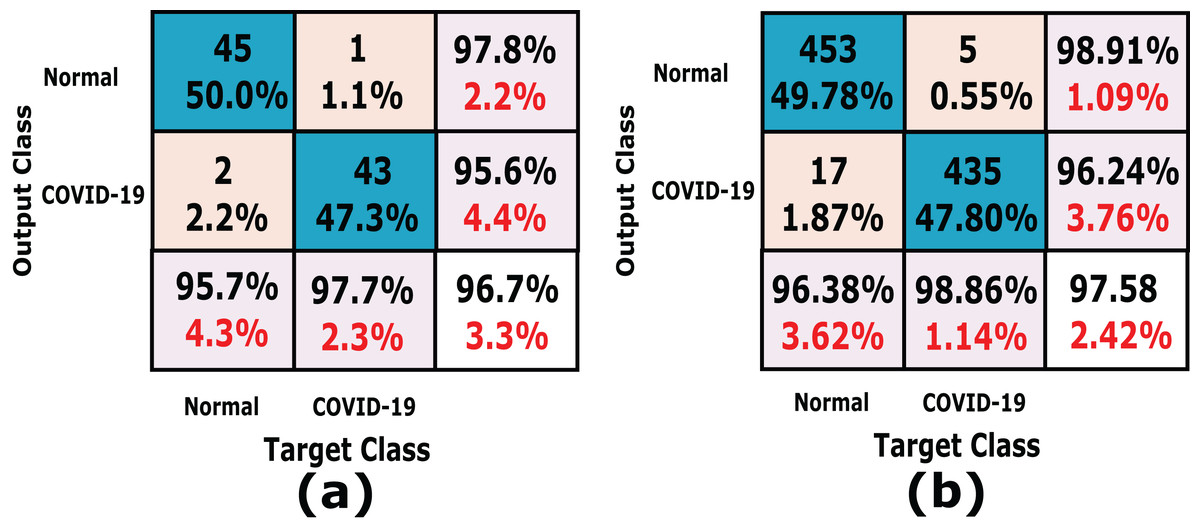
Figure 11: A detailed confusion matrix results of the proposed CXRVN architecture for experiment 2 applied on Dataset-2.
(A) A total of 91 tested X-ray out of 455 images before augmentation for two classes normal, and COVID-19, respectively. (B) A total of 910 tested X-ray out of 4,550 images after GAN augmentation for two classes normal, and COVID-19, respectively.
Experiment (III): Dataset-3
In this experiment, the proposed CXRVN is evaluated based on three class labels as mentioned in details in Table 5. The data are collected from Dataset-2 except we modify 148 pneumonia datasets. The source of our collect dataset is uploaded on Mendeley website (Shams et al., 2020a). In this experiment the number of trained datasets are 482 and the remaining 121 are used for testing. The augmentation based on the proposed GAN architecture is performed to produce 6,030 augmented images 4,820 (80%) for training and 1210 (20%) for testing. The confusion matrixes of the three class labels are shown in Fig. 12A that shows the accuracy of our model which reaches 91.7% before augmentation.
| No | Class label | Raw dataset | Augmented GAN dataset | ||
|---|---|---|---|---|---|
| Train | Test | Train | Test | ||
| 1 | COVID-19 | 177 | 44 | 1770 | 440 |
| 2 | Normal | 187 | 47 | 1870 | 470 |
| 3 | Pneumonia | 118 | 30 | 1180 | 300 |
| Total | 482 | 121 | 4820 | 1210 | |
| 603 | 6030 | ||||
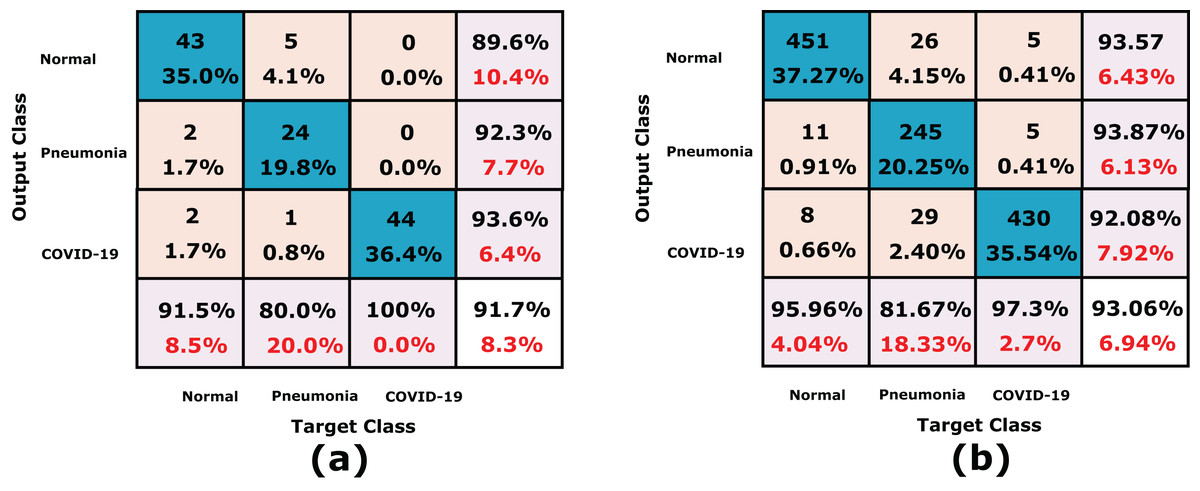
Figure 12: A detailed confusion matrices of the proposed CXRVN architecture for experiment 3 applied in Dataset-3.
(A) A total of 91 tested X-ray out of 455 images before augmentation for two classes normal, and COVID-19, respectively. (B) A total of 910 tested X-ray out of 4550 images after GAN augmentation for two classes normal, and COVID-19, respectively.
On the other hand, the accuracy of the proposed CXRVN based GAN augmentation achieved improved accuracy of 93.06% on the tested 1210 augmented X-ray images for three classes as shown in Fig. 12B. It is obvious that, there is slight decrease in accuracy of the three class labels compared with the two classes. This is because the presence of three classes that collected from different sources that is, imbalance dataset. On the contrary, there is an improvement of the loss function as shown in Fig. 13. To improve the loss and classification accuracy we utilize GAN architecture for augmentation. Figure 12 shows the evaluation results related to experiment (III) of the three classes; COVID-19, normal, and pneumonia. It can be noticed that, a great enhancement of results after GAN augmentation is achieved by using Adam optimizer based on MBGD.
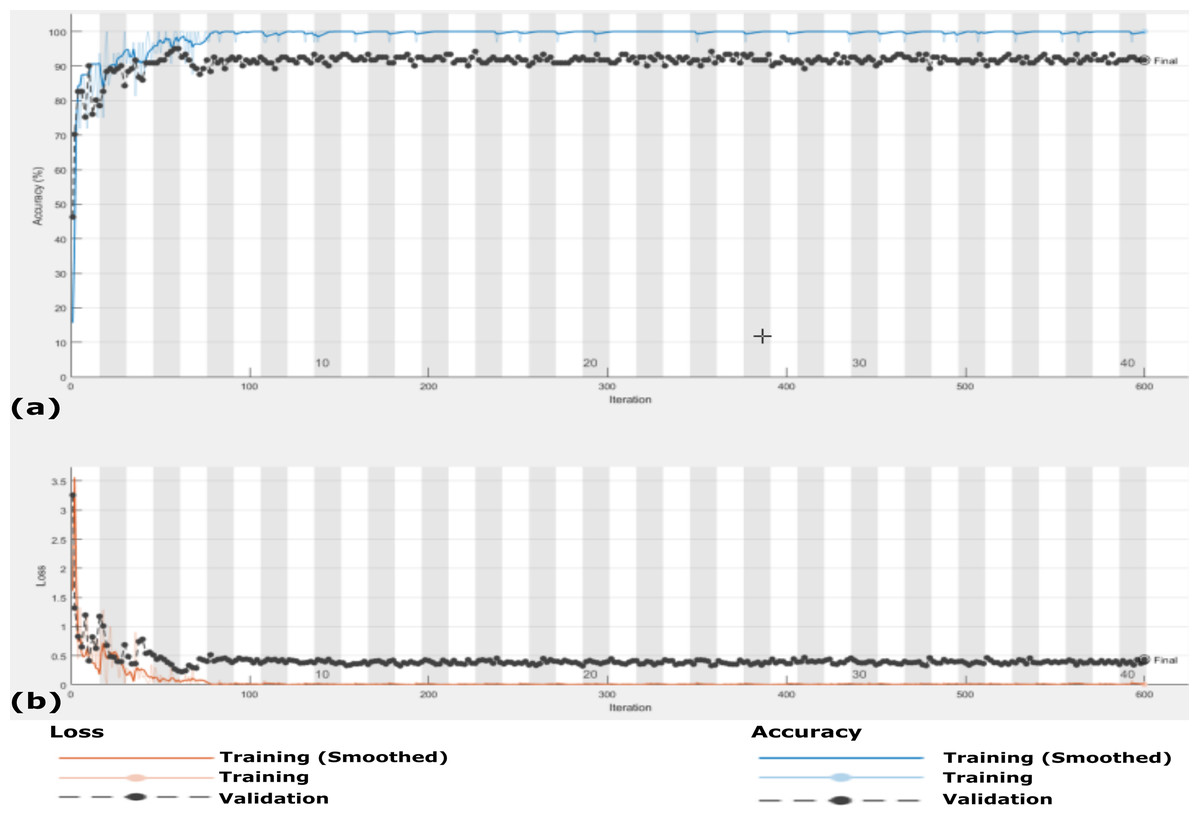
Figure 13: The accuracy and loss of the proposed CXRVN architecture for the three class label normal, pneumonia, and COVID-19.
(A) The accuracy reached to 93.07% and (B) loss after 600 iterations and GAN augmentation.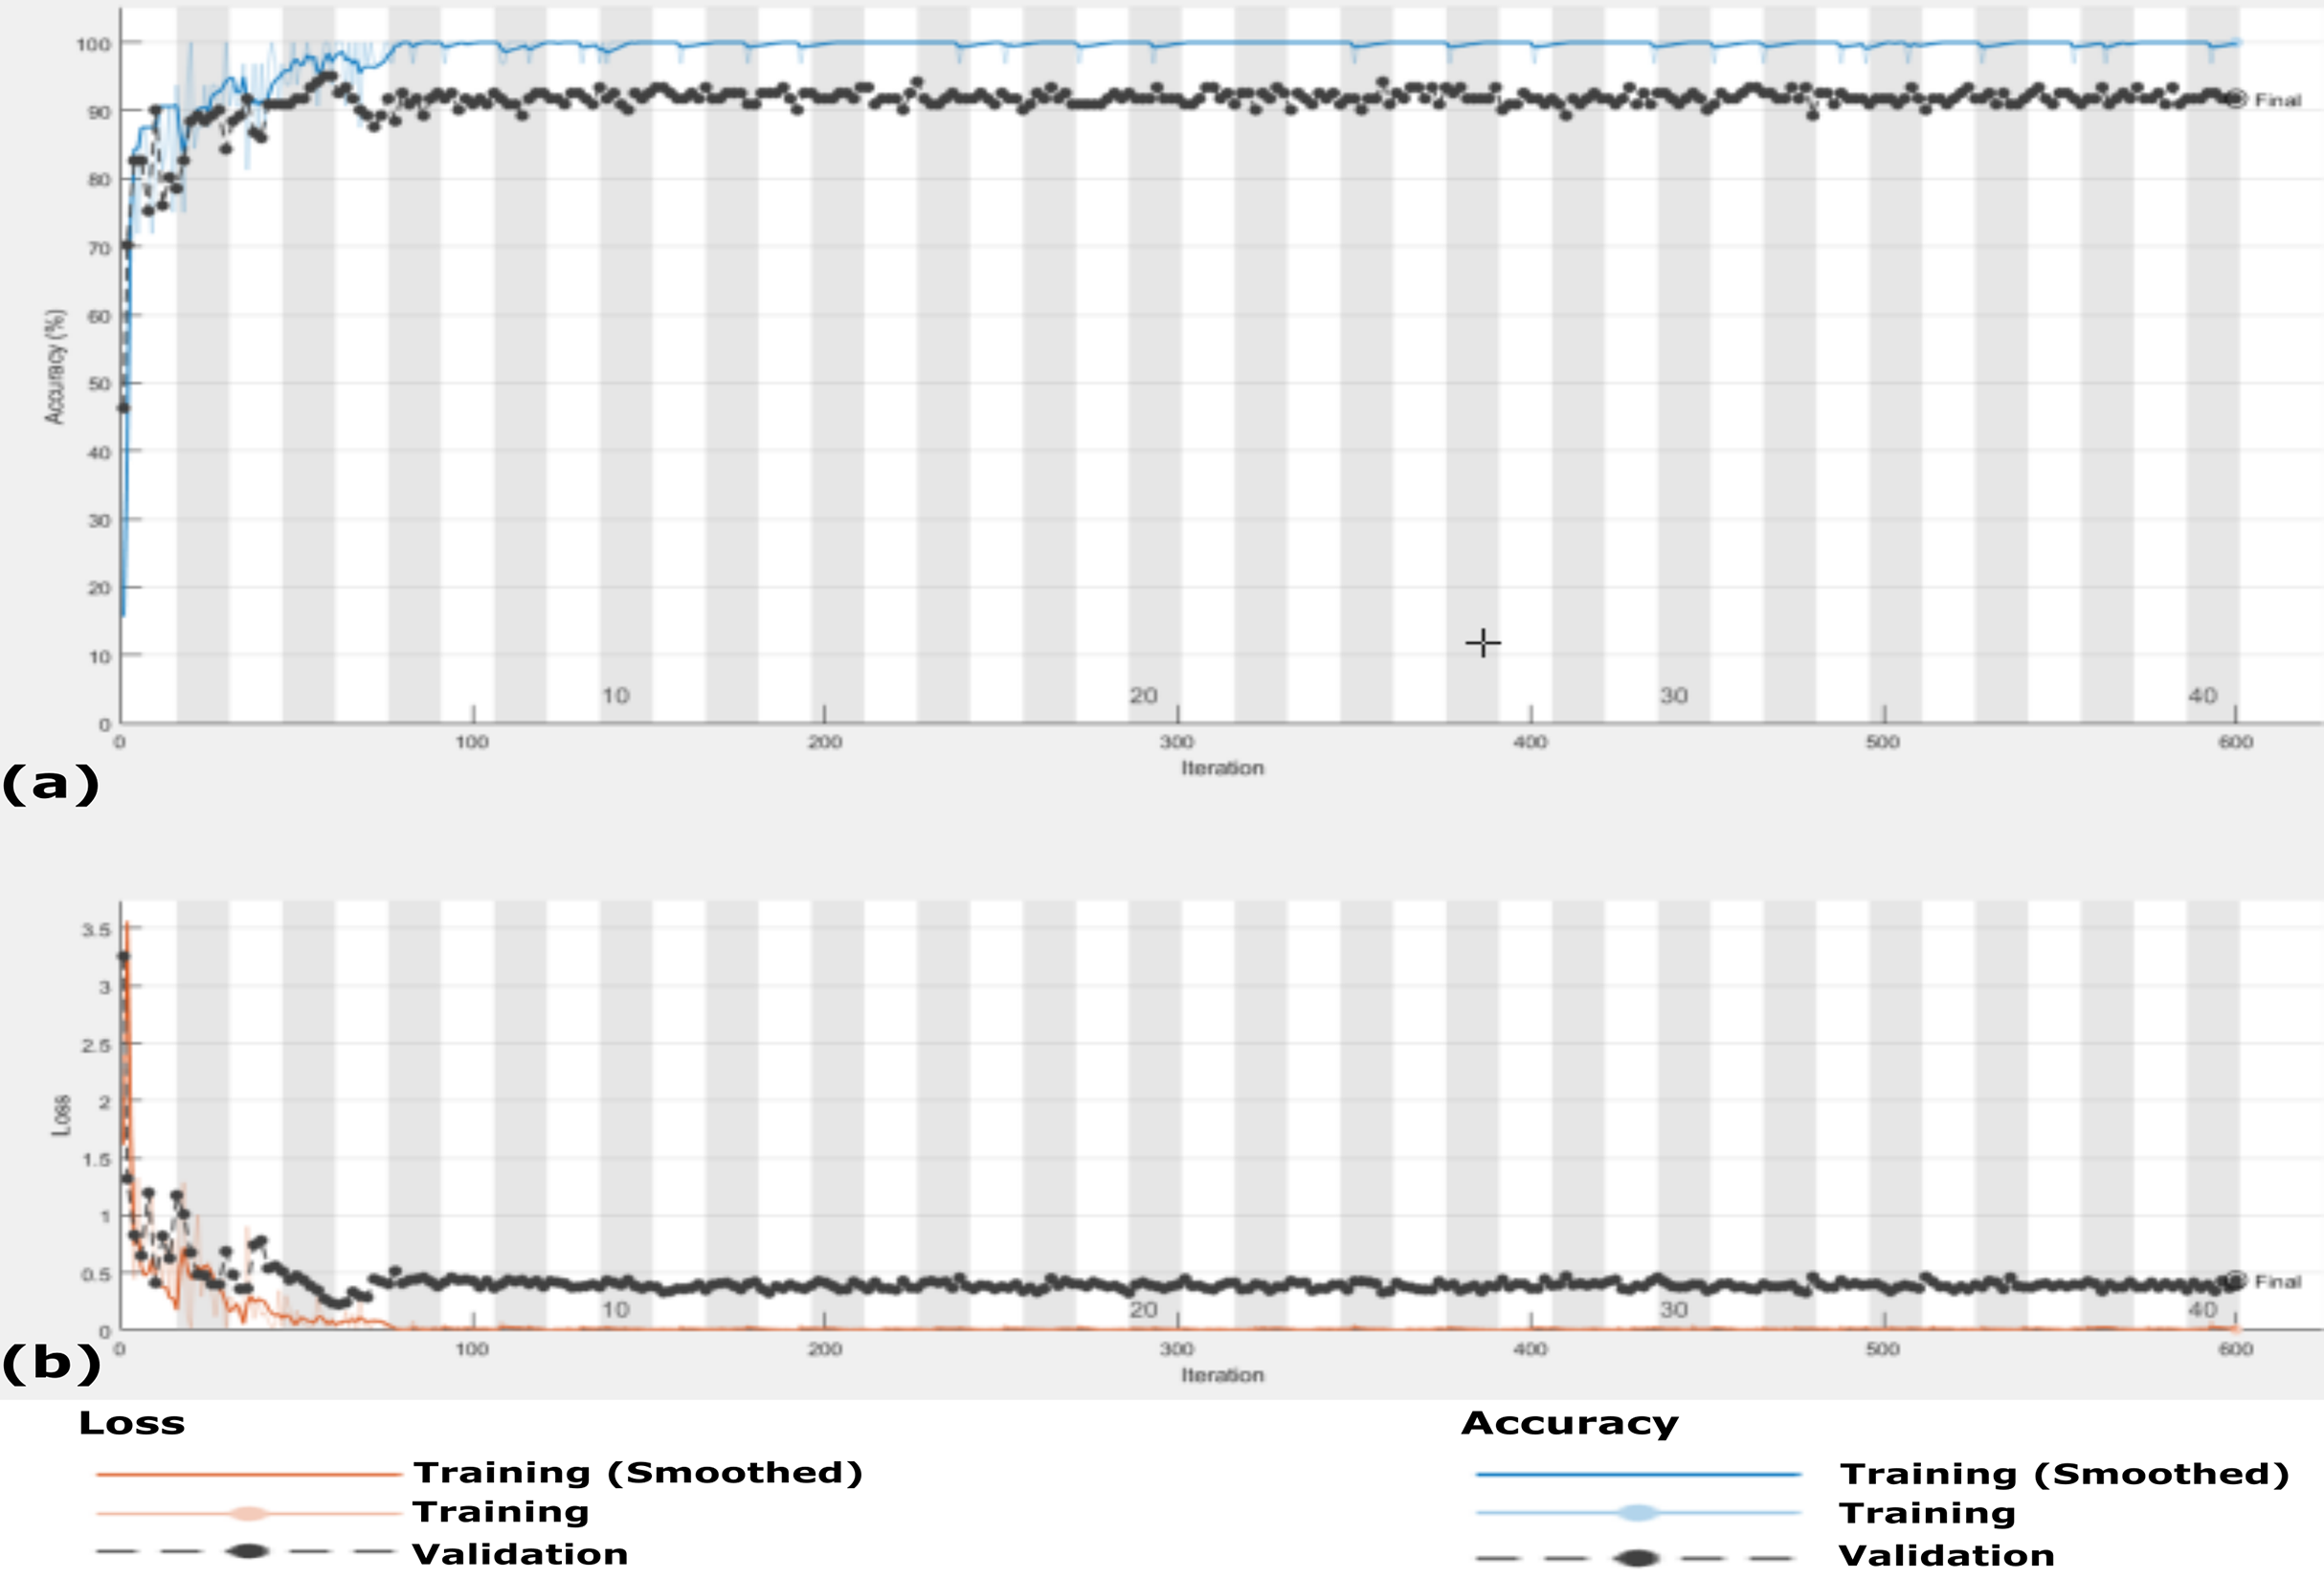
The accuracy and loss of the proposed CXRVN architecture based on GAN X-ray image augmentation are shown in Fig. 13. We notice that, the final result is 93.06% after 600 iteration based on Adam optimizer with mini-batch size 20. Moreover, enhancement and stability of the loss function during the experiment reach 600 iterations. We used the same parameter values listed in Table 2. Table 6 summarizes the recall, precision and accuracy of the proposed CXRVN architecture before and after GAN augmentation.
| No | Class label | Before augmentation | After GAN augmentation | ||||
|---|---|---|---|---|---|---|---|
| Recall | Precision | Accuracy | Recall | Precision | Accuracy | ||
| 1 | COVID-19 | 100 | 100.00 | 91.7 | 100 | 100 | 93.07 |
| 2 | Normal | 89.58 | 91.49 | 93.57 | 95.96 | ||
| 3 | Pneumonia | 100 | 96.00 | 98.,00 | 89.42 | ||
Comparative analysis
To compare the proposed CXRVN architecture with the recent approaches, we need a normalized standard dataset. Moreover, that is not possible because of the variability and updated standard datasets for COVID-19 X-Ray images. Therefore, the proposed approach is firstly compared with the state-of-the-art deep learning models. Namely, the GoogLeNet, VGG-16, Resnet-18 and AlexNet. Although, these models are basically proposed for computer vision tasks, we made some modifications to be adaptive with the enrolled classes as a transfer learning models. The accuracy of the proposed method against these models on Datasets 2 and 3 are given in Table 7. This comparison is performed based on the same hyper-parameter values listed in Table 2 for databset-2. Moreover, we also perform a comparison on Dataset-3 that consists of three classes which are normal, COVID-19, and pneumonia. The comparison is performed based on the same hyper-parameter values in Table 2 except we used 40 epochs and the maximum number of iteration was 600. Table 7 summarizes the comparison evaluation in the testing phase for Dataset-3 based on three classes.
| Method name | Class label | Google net | VGG-16 | Res net-18 | Alex net | Proposed CXRVN |
|---|---|---|---|---|---|---|
| Dataset-2 2-Classes |
Normal COVID-19 |
92.20 | 90.75 | 93.20 | 91.10 | 97.85 |
| Dataset-3 3-Classes |
Normal COVID-19 pneumonia |
91.01 | 89.35 | 91.65 | 92.21 | 93.06 |
We further compare our method the dataset collected by Toğaçar, Ergen & Cömert (2020) which consists of 458 chest X-ray images for three class labels; normal (65), COVID-19 (295) and pneumonia (98) shown in Table 8. For fair comparison with (Toğaçar, Ergen & Cömert, 2020), we used 70% and 30% for training and testing, respectively, as reported by the authors. The confusion matrix of our proposed CXRVN on (Toğaçar, Ergen & Cömert, 2020) dataset is shown in Fig. 14. Table 9 investigate the detailed comparison between (Toğaçar, Ergen & Cömert, 2020) and our CXRVN architecture.
| No | Class label | Raw dataset | |
|---|---|---|---|
| Train | Test | ||
| 1 | COVID-19 | 207 | 88 |
| 2 | Normal | 46 | 19 |
| 3 | Pneumonia | 69 | 29 |
| Total | 322 | 136 | |
| 458 | |||
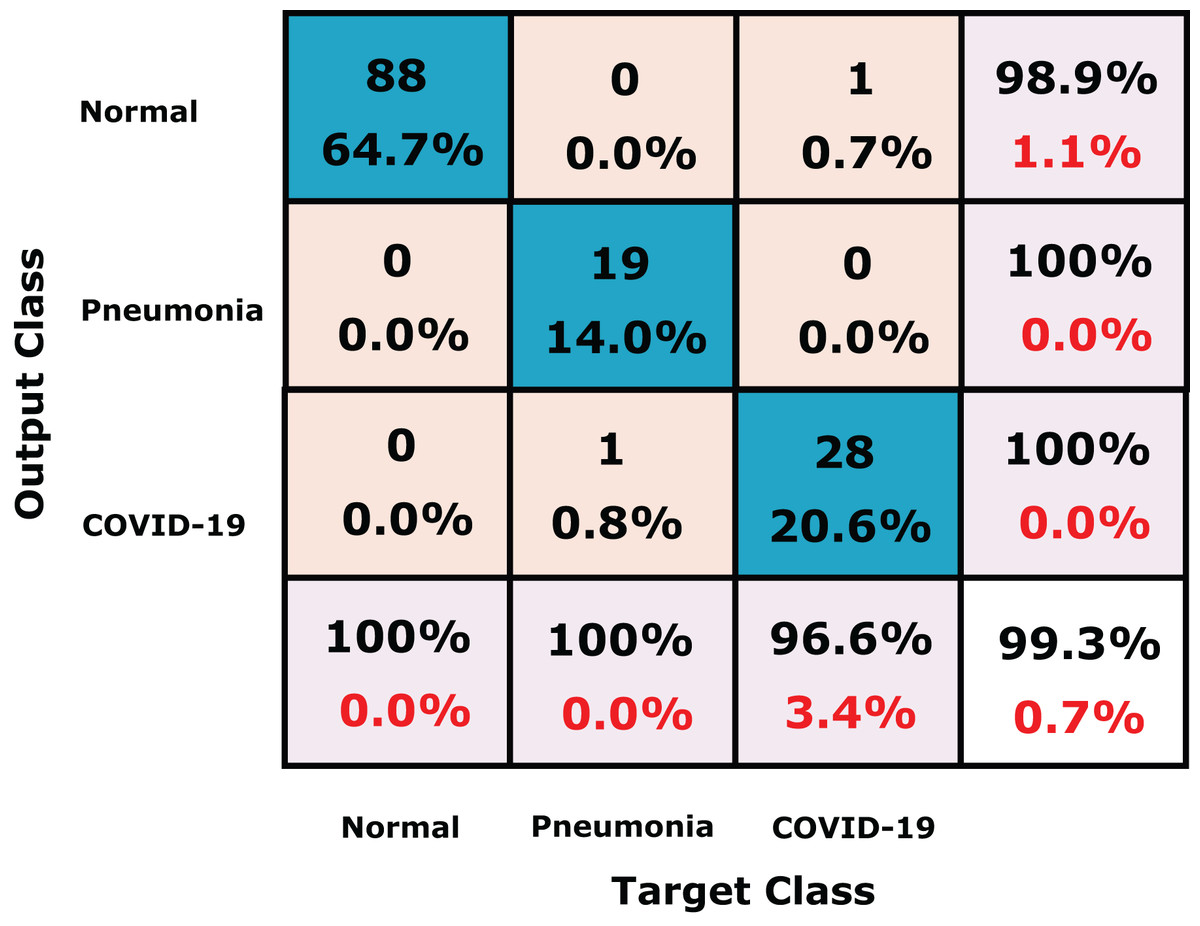
Figure 14: The confusion matrix of the dataset (Toğaçar, Ergen & Cömert, 2020) using CXRVN architecture.
| Class label | Methodology | Accuracy (%) |
|---|---|---|
| COVID-19 Normal Pneumonia |
SqueezeNet [18] | 97.81 |
| MobileNetV2 [18] | 98.54 | |
| Proposed CXRVN | 99.30 |
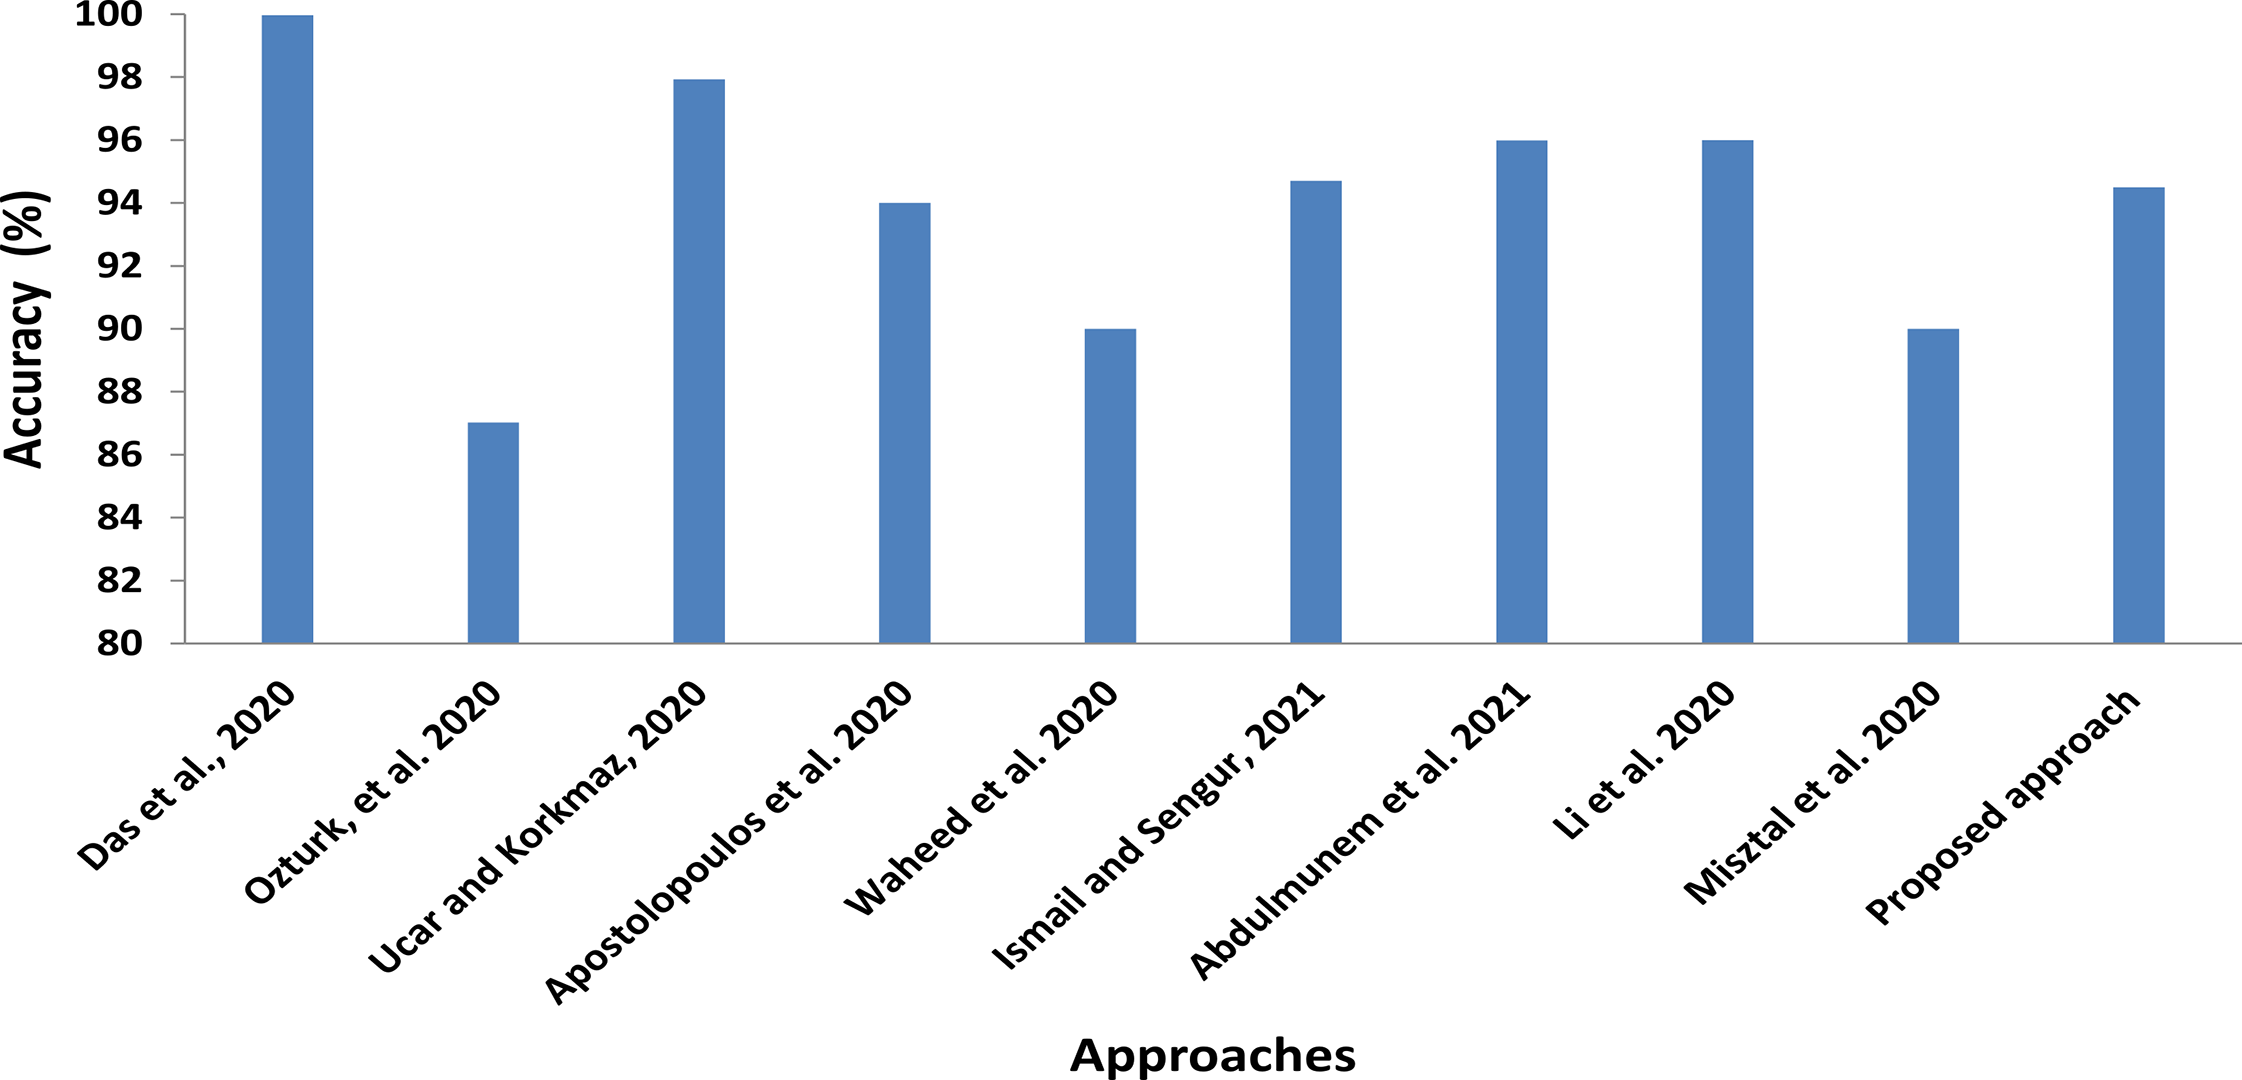
In addition to comparisons with shared computer vision deep models, we also roughly compare our proposed CXRVN architecture with the state-of-the-art methods of COVID-19 detection and classification, as illustrated in Fig. 15 and Table 10. In this comparison, we show the class label, modality used, that is, X-ray and CT, number of cases, and the methodology used. Further, in Table 11 the running time for each scenario and dataset used are determined.
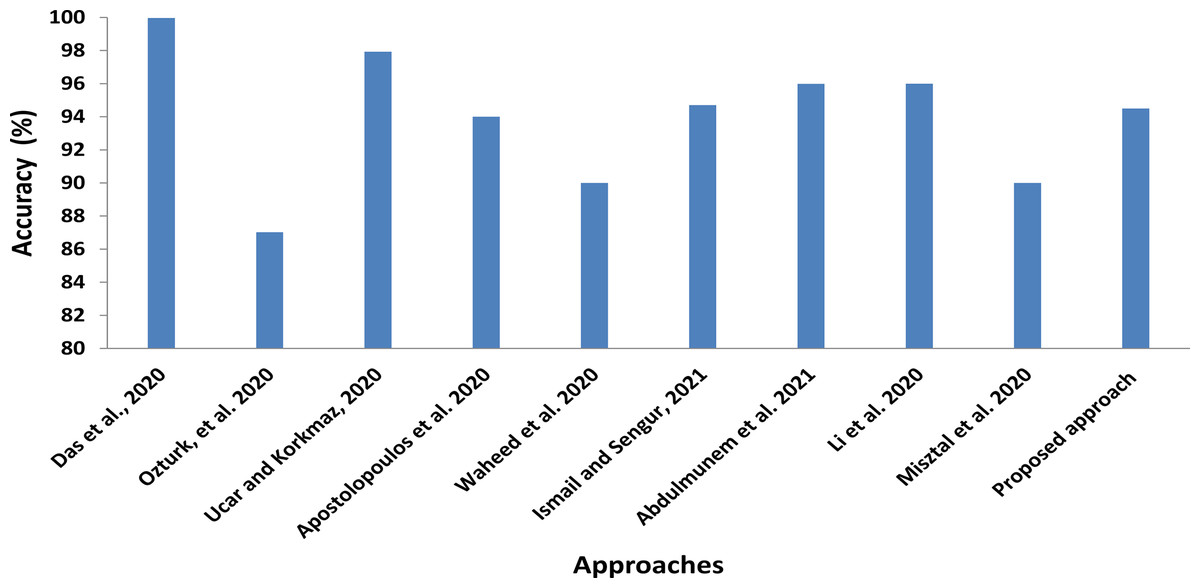
Figure 15: Statistical analysis of the average accuracy of the proposed approaches compared to the state-of-the-art methods.
| Author | Class label | Modality type of images | Number of cases | Methodology | Accuracy(%) |
|---|---|---|---|---|---|
| Das, Santosh & Pal (2020) | COVID-19 Pneumonia TB (China) TB (USA) |
Chest X-Ray | 162 4280 342 58 |
Truncated Inception Network | 99.96 |
| Ozturk et al. (2020) | COVID-19 Pneumonia No-finding |
Chest X-Ray | 125 COVID-19 500 Pneumonia 500 No-finding |
DarkCovidNet | 87.02 |
| Ucar & Korkmaz (2020) | COVID-19 Pneumonia Normal |
Chest X-Ray | 76 COVID-19 4290 Pneumonia 1583 Normal |
deep Bayes-SqueezeNet | 97.93 |
| Apostolopoulos, Aznaouridis & Tzani (2020) | COVID-19 Pneumonia Normal |
Chest X-Ray | 224 COVID-19 714 Pneumonia 504 Normal |
MobileNet VGG-19 |
94.72 93.84 |
| Waheed et al. (2020) | COVID-19 Normal |
Chest X-Ray | 72 COVID-19 120Normal |
Before GAN After GAN |
85.00 95.00 |
| Ismael & Şengür (2021) | COVID-19 Normal |
Chest X-Ray | 95 End-to-end Training | Resnet-50 | 94.7 |
| Abdulmunem, Abutiheen & Aleqabie (2021) | COVID-19 Normal |
Chest X-Ray | 25 COVID-19 25 Normal |
Resnet-50 | 95.99 |
| Li et al. (2020) | COVID-19 CAP Non- Pneumonia |
Chest CT | 1296 COVID-19 1735 Pneumonia 1325 Normal |
Detection neural network (COVNet) | 96.00 95.00 98.00 |
| Misztal et al. (2020) | CT and Radiograph | Chest CT | Self-contained Dataset 6000 |
Dense net for data stock Dense net for multiclass |
92.00 87.00 |
| Perumal, Narayanan & Rajasekar (2020) | Bacterial Pneumonia Viral pneumonia Normal |
Chest X-Ray, and CT |
Bacterial Pneumonia 2,538 Viral pneumonia 1,345 Normal 1,349 |
Haralick+ VGG16, Resnet50 and Inception V3 |
93.8 89.2 82.4 |
| Sahlol et al. (2020) | COVID-19 Normal |
Chest X-Ray | Datasets 1 and 2 Kaggle.com |
FO-MPA+ CNN |
98.70 98.20 99.60 99.00 |
| Proposed architecture | COVID-19 Normal |
Chest X-Ray | Dataset-1 25 COVID-19 25 Normal |
CXRVN | 92.85 |
| Dataset-2 221 COVID-19 234 Normal |
CXRVN | 96.70 | |||
| Dataset-2- GAN augmentation 2210 COVID-19 2340 Normal |
CXRVN | 97.58 | |||
| COVID-19 Pneumonia Normal Chest X-Ray |
Chest X-Ray | Dataset-3 221 COVID-19 234 Normal 148 Pneumonia |
CXRVN | 91.70 | |
| Dataset-3- GAN augmentation 2210 COVID-19 2340 Normal 1480 Pneumonia |
CXRVN | 93.07 |
| Classes | Modality | Dataset and scenario | Resulting accuracy | Running time |
|---|---|---|---|---|
| 2 COVID-19 Normal |
Chest X-Ray | Dataset-1 25 COVID-19 25 Normal |
92.85 | 2 min 35 s |
| Dataset-2 221 COVID-19 234 Normal |
96.70 | 20 min and 50 s | ||
| Dataset-2- GAN augmentation 2210 COVID-19 2340 Normal |
97.58 | 45 min and 30 s | ||
| 3 COVID-19 Pneumonia Normal |
Chest X-Ray | Dataset-3 221 COVID-19 234 Normal 148 Pneumonia |
91.07 | 80 min and 47 s |
| Dataset-3- GAN augmentation 2210 COVID-19 2340 Normal 1480 Pneumonia |
93.06 | 135 min and 58 s |
Discussion
The proposed approach is evaluated based two types of datasets, the first is Dataset-1 which is a balanced dataset, while the second is Dataset-2 which is an imbalanced one. For Dataset-1, we used only 50 cases; 50% normal and 50% are COVID-19 infected cases X-ray images. The results indicated that the accuracy of the proposed CXRVN is 92.85%. Furthermore, due to the variability and updated version of COVID-19 datasets, we collect a large-scale dataset from two sources for both normal and COVID-19. The GANs are used for image data augmentation to enlarge the collected datasets, and the experiment is performed in two phases.
Furthermore, two scenarios are presented, in the first one, which is done without augmentation, the accuracy reached to 96.70%, while the second one is based on the GANs augmentation, the accuracy reached to 97.58%. We not only used two class labels to validate the proposed method, but also we used three classes, including normal, COVID-19, and pneumonia. In experiment three applied in the collected Dataset-3 (Shams et al., 2020a), the accuracies are 91.07, and 93.06 before and after GAN augmentation, respectively. The comparisons between the proposed CXRVN and the most recent deep learning models are performed on our collected dataset, and the results indicate the superiority of our architecture. Moreover, we compare our method on the dataset collected by Toğaçar, Ergen & Cömert (2020) with the same parameter settings, and the results attain better performance, especially after GAN augmentation. Finally, rough comparisons between CXRVN and the state-of-the-art deep learning methods are performed and investigated in Table 10.
In Fig. 15 the statistical average values of the accuracy of the compared approaches with the proposed CXRVN average value. We clearly found that the average accuracy of the proposed approaches is not the top value that is because we used different imbalanced dataset than others. Moreover, we augmented the CXR images using GAN which increase the stability and accuracy of the proposed system (Shams et al., 2020b).
The technical motivation of the proposed CXRVN architecture can be summarized as follows:
-
CXRVN classification architecture using the presence of chest X-ray images available allows diagnosis patients.
-
The elapsed time to diagnosis the patients are decreased, and it will take a few seconds to classify the patient’s cases.
-
The adaptability of the proposed CXRVN architecture in classification multi-class not only binary classes.
-
In the proposed work, the model capable of handling large scale datasets by using GAN for augmentation.
-
Mini-batch gradient descent and Adam optimizers are applied for GAN optimization.
-
The available balanced and imbalanced of chest X-ray images are used as the input datasets.
We present a novel architecture that is trained from scratch with some modifications and improvements as follows:
-
The network architecture is adaptive in its procedure parameter for the enrolled X-ray chest images.
-
The architecture uses two optimizers for the augmented images, which are MBGD and Adam.
-
The architecture can classify noisy X-ray images and produce promising layers as five convoluted layers with batch, and RelU activation functions are applied.
-
The architecture deals with balanced, imbalanced, and augmented GAN datasets.
-
The architecture can classify three classes normal, COVID, and pneumonia.
From the results mentioned above, it could be concluded the following points;
-
Deep learning plays an essential role in detecting COVID-19 cases, smoothly.
-
The role of GANs to produce different numbers of images helped to improve the overall accuracy of the proposed approach.
-
The proposed approach would be used as transfer learning.
Threads and limitations
Although the proposed method achieved superior performance to the state-of-the-art methods, it still has some limitations. The first one is that radiologists tested the accuracy of the proposed approach for clinical usage. The second limitation is the limited COVID-19 dataset, which is considered one of the most critical issues for training deep models. Using a big X-ray dataset for the training phase can potentially improve the performance of the proposed method. More extracted features of the X-ray images are required in order to test the X-ray images for more details that may be helpful for the updated cases in COVID-19 patients. Since CT scanners are not always available, usually have a high cost, and come after long acquisition time, X-ray remains the standard imaging modality for chest, particularly in isolated areas and developing countries.
Future directions and Open challenge
There are different challenges related to the medical sector. They could be summarized in the following points. During the COVID-19 pandemic. Lots of challenges are faced
Dataset
Medical datasets are very limited, which is more difficult for any researcher to reach to these data. In the face of the epidemic Covid-19, the lack of images of the chest of various kinds. Researchers can use methods to enlarge the number of images, which contributes to a fair test of the different methods presented by researchers and research centers
Software
The diagnosis chest scan suffers the lack of ready programs for detecting the injury cases. Deep learning will play and still play an essential and vital role in contributing to the diagnosis of COVID-19 and others.
Conclusions
Machine learning techniques, especially classification and regression, are considered as one of the essential tools to fight the spread COVID-19. In this article, a DCNN architecture to classify the input X-Ray COVID-19 images called CXRVN is proposed. The architecture can handle the extracted feature from each convoluted layer, and the results indicate the robustness and superiority of the proposed system compared with the state-of-the-art methods. We performed many different experiments based on availability and the applied dataset. The first experiment used a balanced dataset of 50 X-ray images for two classes (Dataset-1), normal and COVID-19, and the accuracy was 92.85% in the testing phase, while the second experiment was performed using an imbalanced dataset (Dataset-2) that consists of 455 X-ray images for two classes, and the accuracy was 96.70%. In the third experiment, we used 603 X-ray images for three class labels; COVID-19, normal, and pneumonia (Dataset-3), and the accuracy reached 91.70% in the testing phase. To prove the ability of the proposed CXRVN architecture on a large scale, we present image data augmentation based on GANs that leads to a significant enhancement of the proposed architecture. The evaluation results based on sensitivity, precision, recall, accuracy, and F1 score demonstrated that, after GAN augmentation, the accuracy reached 96.7% in experiment 2 (Dataset-2) for two classes and 93.07% in experiment-3 (Dataset-3) for three classes. Comparisons were performed to prove the robustness and reliability of the proposed architecture against the contemporary architectures. For future direction, we plan to use CT-images and study different updated cases of the COVID-19 X-Ray image. Furthermore, for the promising obtained results, the proposed architecture can be utilized in other medical images classification and diagnosis issues.