Why should we trust climate models? Trust in a model comes through testing, evaluation and validation of the model. Evaluation requires comparisons against observations. Both the observations and the model may be uncertain, and this uncertainty must be addressed. Observational and model uncertainties are described in detail. An essential part of climate science uses models to make projections. Projections of historical time periods allow evaluation of models against the observational record. Success in representing the past increases our confidence in future predictions. Weather forecasting and seasonal climate prediction improve our ability to validate climate models. The different way models are run is described in detail. When we run models for the future, we make either projections or forecasts, and these are different and need to be understood. A projection is usually dependent on an assumed scenario for model inputs, like future emissions of greenhouse gases. As an example of model evaluation, we discuss the evaluation of models in the assessment and projection of ozone depletion.
The preceding chapters gave an overview of the climate system and its components as well as a primer on how we simulate those components, but even so we’ve just skimmed the surface. Why should we trust a climate model? Generally, we gain trust in a model through evaluation and validation of the model. We then use the model to make projections of the future. In this chapter, we describe the basics of how climate models are evaluated and how they are tested. The language and terms used in this discussion can be confusing. For example, the terms validation and evaluation are often used to mean different things, and a projection is not the same as a forecast. We will see why shortly. Testing models is a critical part of the development process.
9.1 Evaluation Versus Validation
Evaluation is the process of understanding a model and how well it works for a specific purpose. It is the process of ascertaining the value of a model. Since a model (whether a blueprint or a physical model of an object like a car or an engine) is a representation of an object, it is usually not an exact replica in some way. In other words, the model contains some simplifications. Validation is the process of ascertaining or testing the “truth” of a model. And since all models are incomplete representations of reality, we are not really seeking a perfect representation of the truth. Instead, we are seeking the value to be found in an imperfect representation provided by a model. Often the key aspect of value comes from knowing how good or bad the model is relative to observations. The goal is really to figure out what value a model has (by evaluation). The value depends on the application, as we make clear in this and later chapters.
Anzeige
Look at common models in the world around us. A picture, even a photo, is an imperfect representation of a three-dimensional object, but our brains use pictures as a model to understand objects. The picture or model is not the actual object. It might be a scale model of a building, or a schematic picture of two parts of a piece of furniture that will fit together. Thus, all models are incomplete or wrong in some way. For example, you can’t sit in a scale model of a chair, and the strength-to-weight ratio of a scale model is probably very different from that of the actual chair. But most models are useful, even if they are wrong in some way. They tell us something about the object or system being represented. In other words, a model of a structure is built so that we can better understand what something will look like. Schematic diagrams help us understand how to put two pieces together. We evaluate models to understand how well they represent particular aspects of the system: These representations have value. The better the model for a particular metric, the greater its value for a particular purpose.
9.1.1 Evaluation and Missing Information
The evaluation process is usually indirect, and there is often uncertainty in what we are evaluating the model against. We have to evaluate a climate model against the climate system using imperfect and incomplete or missing information. Generally, we do not have a complete and accurate description of the climate system. Because climate is a statistical measure (the distribution), we have to build up statistics. Our statistics may not be complete, especially for extreme events. For instance, what is a 1 % chance of having a certain amount of rain (a lot or a little) in a season? If we only have 50 years of records, we do not really know: The lowest or highest seasonal rainfall is a 2 % chance if it is random (1/50).
We generally have distributions that are not well described. We may be missing critical information. For climate, we need information in the past, and we cannot go back and collect more information. If we are concerned with the climate somewhere, but we have no records, it is hard to describe the distribution of climate. This is incomplete information that cannot be taken again.
In addition to the lack of information, the observations we do have are generally not perfect: Observations contain errors. If the errors in observations are known, they can be corrected for. A great deal of work is done to test and evaluate observations to understand errors and ensure accuracy. Where it can be difficult is if the errors are unknown, and if the errors (particularly unknown errors) change over time.
Anzeige
A good example of observational error is the measurement of temperature. Of course records can simply be missing: There were no records of temperature before a practical thermometer was invented and used in the Middle Ages.1 Galileo Galilei was one of the first, in the late 16th or early 17th century, to develop a liquid-filled tube that changed volume with temperature. But it took another 100 years or so to agree on a standard unit of measurement. Daniel Fahrenheit (1724)2 and Anders Celsius (1742)3 both proposed scales that are still in use (with some variations) today. But thermometers have changed over time, and although temperature records exist back to 1800 or so, their accuracy is very different from thermometers in use today. Even modern instruments are different from each other and change over time (discussed later in this chapter). How does this affect climate records? Suppose a temperature measurement is conducted over many years at the same place. Suppose there is a systematic error, maybe the liquid in the thermometer doesn’t rise or expand as expected, and it reads a colder temperature than the true temperature. If a new and more accurate thermometer replaces it, then the more recent records will record a higher temperature, and we might conclude the temperature has warmed. But the error in the measurement has just changed.
To evaluate a climate model, we simulate the climate of a particular point in the system with a model and then compare that simulation against a set of observations. Recall that climate is the distribution of something like temperature or precipitation at a particular point. Thus, models are evaluated against the distribution of possible states, not just the mean state. Often what we really care about is how the model simulates extreme events such as floods, heat waves, droughts, or tropical cyclones. We may not care about the mean.
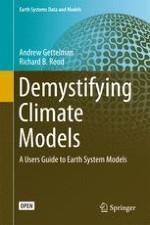
We construct a distribution of temperature or precipitation observations to compare our model against. But those observations may have either systematic errors (like a bias in the observation, shifting the mean of the distribution), or there may be random errors in the observed distribution (see Chap. 1). The observed distribution may be undersampled, particularly for extreme events (see Fig. 9.1). Figure 9.1a is a sparse distribution. There are a small number of points (25) drawn randomly from a distribution, where the probability (vertical axis) of a value (horizontal axis) is what we want to find out. The distribution has a most likely value at 100. Figure 9.1b shows the probability distribution function from the sparse sample: There are no points greater than 104 or less than 97. Figure 9.1c shows 3000 samples from the same distribution, whose probability distribution function is represented in Fig. 9.1d. Now it is clear the most likely value is 100, and a small but significant number of points have values less than 97 or greater than 104. The problem represented in this figure is similar to the question: If we are trying to represent the extremes of a distribution that occur infrequently (once every 100 or 500 years, for example, like for a “500-year flood”), how do we know what those probabilities are from 50 years of data? This is a problem particularly for understanding and evaluating extreme events.
Fig. 9.1
Sampled distributions. Points representing individual observations are randomly sampled from a distribution with a mean of 100 and a standard deviation of 2. a Sample with 25 points. b The probability distribution function (PDF) of these points. c Same distribution with a sample of 3000 points. d The PDF of these points
×
What does it mean to evaluate a model for prediction? If the model is wrong in some way, you need to know that. The key question is whether the model is accurate for what you want to predict. If you want to predict the climate in the tropics, you might not need a detailed model of sea ice or of snow cover. If you are in polar regions, it is critical to have a detailed representation of snow and how it absorbs and reflects energy from the sun. But the climate system is interconnected, so there are limits to what can be ignored, and climate models seek to represent consistently the entire possible set of states of the system. Here’s another example. Say that you want to predict the weather for a few days. You can probably fix the carbon dioxide concentration in the model. You may also not need to worry about small errors in the energy budget in such a model. We need to evaluate models for a purpose and assess whether they are useful for a particular purpose. The weather prediction model that does not conserve energy may be fine for 48-h forecasts, but it is likely not a great climate model.
Evaluation of models also involves comparison of different models. There are about 25 different climate models of varying complexity that help inform our understanding of global climate. In Chap. 11, we discuss details of how these models are related or independent, but they represent the best estimates of the climate system. Each estimate will be different since the representation of the system is quite different. We can also evaluate models against each other.
9.1.2 Observations
For models, the primary evaluation method is to evaluate the processes or results of models against observations. Observational uncertainty is a key problem. Observations are biased due to samplinguncertainty (gaps in records), as illustrated in Fig. 9.1, but also due to systematic errors in measurement. It is often as important to know the uncertainty of a measurement as it is to know the numeric value of the measurement. Sometimes, knowing the uncertainty is even more valuable: If you do not understand the uncertainty in an observation, it is not possible to understand if a model is statistically the same (correct) or different (wrong) compared to an observation. If the mean temperature is 68 °F (20 °C), and a model predicts 72 °F (22 °C), is the model wrong? If the expected error or uncertainty in the observation is ±4 °F (2 °C) or larger, the model is correct. If the observed uncertainty is smaller than ±4 °F (2 °C), then the model is wrong.
Figure 9.1 addressed the sampling uncertainty of not knowing the “true” distribution. Figure 9.2 illustrates the difference in distributions. If there is a lot of variability or spread about the mean (which can be measured statistically by the standard deviation; see Chap. 10) in the model and observations, then the model is not statistically different from the observations at some level of probability. Separating the black and blue curves is hard; separating the red and blue curves is easier, even though the red and black curves have the same mean.
Fig. 9.2
Probability distribution functions. Different symmetric distributions: Broad with the same width (black and blue) but different means and sharply peaked (red) but with a different standard deviation. Red mean of 9 and standard deviation of 1.5. Black, mean of 9 and standard deviation of 3, Blue mean of 11 and standard deviation of 3
×
Scientists often try to estimate a confidence level, or confidence interval, for a distribution as a way of understanding the expected error. If an observation has uncertainty, a 95 % confidence interval indicates we are 95 % certain to be within a given range. In Fig. 9.1d, this range is about 95–105, so 5 % of the observations fall outside this range. When comparing models to observations, if the confidence interval for the model overlaps the observation, then the model is not significantly different (statistically) from the observation. Often the model statistics are better known (sampled) than observation statistics (the observations are sparse). For example, if we have 25 years of observations, we get the samples in Fig. 9.1a. But with a model, we can run it for 3,000 years to get the samples in Fig. 9.1c.
Models are evaluated not just on the mean state, but also on their representation of variability. Refer to the distribution functions in Fig. 9.2. You can match a distribution function mean value (the black curve) with another distribution with the same mean, but very different width or variance (the red curve). Even the shape can be different (symmetric or skewed). The mean may be the same for the red and black curves in Fig. 9.2, but the black curve has twice the spread of the red curve (higher variance). Thus, the black curve has a higher probability of extreme events than the narrow red distribution. Even if the means are similar, if the distribution represents temperature, for example, the climate is a lot different.
The key to evaluating models is to collect observations and the uncertainty in the observations, and then compare the model as closely as possible to the observations. Getting the different statistics (mean, variability) correct is critical. Which statistics are important will depend on the application.
It is also critical to compare like elements of a model with their corresponding observations. One should not compare apples with oranges, meaning like for like comparisons are critical. What does this mean in the context of climate observations?
Often observations are not what we think they are. Most observations contain a model themselves. Consider the following examples, all of which are trying to measure the same thing: the surface temperature of the ocean.
1.
A liquid thermometer contains a substance like alcohol or mercury that expands and contracts with temperature. This thermometer measures expansion (volume). To convert this change into a reading, the thermometer needs a scale: a model for how the material should expand or contract with temperature. Put alcohol (often colored red) in a mercury thermometer (silver liquid), and you get the wrong answer.
2.
An electronic thermometer contains a piece of metal (called a thermocouple) that has different electrical properties (usually resistance) with temperature. This thermometer measures electrical resistance. The device has a “model” of how a different resistance corresponds to temperature. The model has uncertainty in it. How much? That may or may not be known.
3.
A satellite orbiting the earth sees the emission of the sea surface at a given wavelength of light as an electronic current generated when a number of photons (light particles) of a given wavelength (in the infrared, in this case) hit the detector (usually like a fancy digital camera). The detector converts photons into electrical charge (current). This thermometer measures electrical current. The number of photons received is a function of the surface temperature of the ocean over a given volume, but also of the atmosphere above it. A model is built to understand the temperature. It is supposed to correspond to the electronic or liquid thermometer stuck into the ocean at the same point, or at all points over the region where the satellite is sensing.
4.
You can also build a thermometer like the satellite that senses energy in a distinct wavelength to read the temperature (an infrared thermometer). This device may perform more like the satellite, but it is seeing only a few square feet (1 square meter) of ocean, whereas a satellite may be collecting photons from many square miles. This thermometer also measures electrical current.
All of these measurements contain models that translate a measurement (volume, resistance, current) into temperature. These observation models are different, and they may contain errors. These errors may be due to the imprecise nature of measuring volume for example, or they may result from the distribution of temperatures in the field of view of the satellite.
Each observation is measuring a different mass of water. For example, the thermometer is measuring the small region of water around the “bulb.” The thermocouple has a similar sampling area, but maybe a different response time to reach a constant temperature, and maybe it is stuck deeper or shallower in water. The infrared thermometer may measure a region that is 1–20 ft (0.3–6 m) across on the surface rather than, say, 1–3 in. below it, and the satellite is measuring the surface emission of maybe 0.6–30 miles (1–50 km) of the ocean. Even if all of these temperatures are correct, they measure the thermal energy of different water molecules.
So what temperature does a climate model use for the ocean surface? The model might have a temperature of the top layer of the ocean, but that layer might be 30 ft (10 m) thick. A satellite or infrared thermometer at the surface sees the emission from just a small thickness of the surface. As anyone who has been in a stratified lake or ocean knows, the average temperature of a thick layer of water below the surface may be much colder than the temperature at the top. The model is representing the heat content of the entire layer. Often models have a “skin” temperature to more closely match observations. Another way to do the comparison is to estimate not the temperature from the model, but rather the thermal emission of photons that would result from that temperature, and this can be compared directly to the satellite values before a temperature conversion.
The direct simulation of an observation (simulated numbers of photons, as in the example above) is a particularly useful means of comparison when comparing complex observations. Consider the properties of clouds. The model that the satellite uses to turn photons in a wavelength into a description of a cloud (like the amount of liquid water) can be used in reverse to take the climate model cloud and determine how many photons at a wavelength it should emit. This makes the comparison more robust (like comparing red apples to green apples).
The process of evaluating a model, and especially a climate model, thus has several steps. First is to collect observations and then to analyze and understand the observations. Understanding includes accuracy of the observations, and the uncertainty in the observations, which comes from the length of the observational record (the sampling in time) and the sampling in space as well. There are likely to be many different observations to compare with a model. Some observations may be the same quantity, such as several sets of temperature observations. Some observations will be different quantities, such as temperature, precipitation, wind, or soil moisture. Once we have a set of comparisons with observations, we know how different a model is from observations in many ways. We can decide the value of the model and whether the model is adequate by having a value higher than some threshold, such as a sufficiently low error in comparison to an observation. And if not, or if we are not satisfied, then we seek to improve the model. In a theoretical sense, since all models are wrong in some way, they can always be improved. Of course, the same could be said for observations. Understanding the uncertainty in the observations, including the models that go into the observations, and the difference between what the observations and the model represents is critical for evaluation.
9.1.3 Model Improvement
Specifically for climate models, there are many different ways to approach model improvement. The methods come from an understanding of where the model error comes from. Models are a series of components (atmosphere, ocean, land) coupled together. Each component model is a series of processes (e.g., radiative heating, motions, transformations of water, plant growth) described by parameterizations of processes (condensation, evapotranspiration, etc.). The processes themselves may not be represented well. Perhaps the major issue is not describing the basic physics or chemistry of a problem, but rather the variability below the model scale. An example might be a chemical reaction with a defined reaction rate. These rates are measured usually in a laboratory with pure substances. But approximating the same rate in a large volume of atmosphere, which is not well mixed, may be very difficult to get right. Thus, parameterizations of processes can be improved, often with detailed observations of the world around us to see if we can reproduce particular times and places. Comparisons can be made for individual events, or for many events to generate an “observed” and “simulated” climate (or climatology) of a particular place or many places.
Model errors (model uncertainty) can also arise from the complex coupling of the system rather than from individual processes. Individually the atmosphere can be driven by surface observations, or it can be coupled to the land and ocean. Often there are errors in the coupling or the translation that can lead to biases. More frequently, there are biases in one component or process that affect others, and often compensating errors arise where one process may be too large, and a competing process too small, with the result being right, but for the wrong reasons. For example, if there are too many clouds shading an ice-covered surface, but the surface is darker than it should be, then you can get the right surface energy balance, but for the wrong reason. The model appears fine compared to observations. But how this incorrect balance changes may be different. The hope is that with sufficient observations (e.g., also measuring the brightness or albedo of the surface), these biases can be eliminated.
When evaluating models, we typically find that they differ from each other, as well as from the observations. This is actually useful. Different climate models contain different representations of different processes, coupled together in different ways. It is not surprising that answers will be statistically different when compared. This applies not just to large-scale climate predictions like the global average mean temperature well into the future, but also to evaluation of individual events. The differences are useful, in the same way that the different models of temperature from a mercury thermometer or an infrared thermometer may be useful for understanding the uncertainty and variability of temperature.
9.2 Climate Model Evaluation
It is not always straightforward to envision how a climate model is evaluated. The concept of evaluation involves comparing a climate model to observations. Climate is a distribution, so the process of evaluation is a comparison of distributions, for example, a distribution of temperature, between a model and a set of observations. We have discussed how observations are taken, but how are climate model data generated to create a distribution? There are different ways to perform a simulation experiment that integrates a climate model. Since climate models are computer programs, performing a simulation is usually called running the model (as in running a computer program).
Climate models are generally run in different ways for evaluation against observations in the present and past, than for prediction of the future (for which there are no observations). We discuss some of these ways in the sections that follow. The different types of simulations are designed to test different parts of climate models against different types of observations. Understanding the ways that simulations are run is important for understanding and evaluating model output, and for understanding the results.
9.2.1 Types of Comparisons
There are several different types of simulations for evaluation of climate models. Typically parts of a climate model (like the atmosphere) are constrained in some way (some inputs are specified, such as the ocean surface temperature beneath the model) to evaluate them against some type of observations for the present or the past. These can be observations of individual events or case studies. They can also be representations of climate (averages, variability) over short or long periods of time, from years to centuries.
Representing individual events is one way to test models. We can try to estimate individual events such as a particular tropical cyclone (i.e., Hurricane Katrina or Hurricane Sandy) by starting up the models with observations from just before an event, and comparing how the model does. Weather forecast models are typically evaluated routinely in this way: How well did they do in “predicting” the weather 1 day (or 2 or 10 days) in advance? Such hindcasts are also valuable for improving parameterizations and representations of processes in a model, maybe changing how the surface exchange between the atmosphere and ocean makes a better representation (i.e., better surface wind speed or precipitation) of a particular storm. Maybe this applies to all tropical cyclones. Weather models typically undergo rigorous testing in this manner to generate error statistics and improved forecasts. For some of the key aspects of climate models, we do not have complete verification of our forecasts. We cannot easily evaluate feedbacks due to climate forcing, for example. The verification piece is hard and has to be approximated.
We can also apply the same comparison to multiple models. For example, what is the range of model simulations of a particular event or storm, or all storms? Evaluation is typically conducted for a purpose, since we cannot evaluate everything. If you want to know how tropical cyclones might change in response to forced climate change, then evaluating the representation of cyclones in current models is quite important.
These types of experiments can be performed as well with other components of an earth system model. Observed temperatures and precipitation can be fed to a land surface model to try to reproduce observations of soil moisture. Or an ocean model can use specified air temperature and winds to try to reproduce ocean currents.
All of these comparisons can be done for long or short periods of time. For long periods of time (20 years of observations, for example), the models are used to generate climate statistics (probability distribution functions) that can be compared to observed distributions. But models (even climate models) can also be evaluated using short-term forecasts to try to predict the details of weather events within the timescale of a few days (just as weather models are evaluated). It is often easier to focus on particular well-observed locations and evaluate specific cases, or a set of cases. In these evaluations, models are run like weather forecast models for a few days, and the statistics of the agreement are evaluated. Using many forecasts (starting every 6 h) and running for only a few days can be fruitful. Many of the errors in processes in climate models (like clouds) show up in just a few simulated days. So different parameterizations can be rapidly tested using short simulations.
9.2.2 Model Simulations
We have described different ways to run climate models for evaluations. These usually involve constraining the climate model in some way to better represent the observations. Or one component is replaced with observations (e.g., fixed sea surface temperatures), and the rest of the model is “forced” to use observations as boundary conditions. Ultimately, none of the components is fixed and the model runs with all its components coupled together. But there is still forcing of the system, usually provided by parts the model doesn’t simulate, such as specifying greenhouse gases like carbon dioxide and methane, or estimates of the emissions of sulfur gas (sulfur dioxide) by volcanoes, or even small variations in the solar energy that reaches the earth. In this way, model simulations can be designed to try to reproduce the past of the entire climate system.
Reproducing the past can mean reproducing the last 100 years or so when we have some observations or even the last 5 years. It can also mean reproducing the past a long time ago: before measurements were available directly. The oldest records from thermometers go back to about 1750 or so in a few locations. Before this, only proxy records are available. Proxy records are indirect records of a process sensitive to a climate variable (usually temperature or precipitation). For example, the width of tree rings is often proportional to seasonal temperature and/or precipitation at a location. Assuming the trees respond the same way in the past as they do now, records from tree cores can provide seasonal climate information going back hundreds or even a few thousand years. Present climate can be related to tree ring growth rates over the last 100 years. The relationship (as a statistical model) can then be used to estimate temperature and precipitation records at locations in the past where there are tree core records, but before instrumental records. The longest lived trees go back nearly 5,000 years (bristlecone pines) but such proxies are more common for several hundred years (a Ponderosa pine tree can live 600 years).
Figure 9.3 shows a series of different proxies related to the instrumental record that goes back to 1750. Boreholes are deep holes that measure the temperature down for several hundred feet (100–200 m). Since heat moves slowly in the ground, these borehole temperatures can measure variations in local temperature back 500 years or so. Historical records come from human histories about drought, famine, volcanoes, or other historical events that might impact climate. For example: the eruption of Mount Vesuvius in 79 A.D. Ice core records go back 500,000–800,000 years. Coral reefs and the remains of coral go back nearly a million years, as do sediment records in lakes, oceans, and coastal regions. These sediments contain different species of microorganisms that survive well in different temperature conditions.
Fig. 9.3
Paleoclimate proxy records. Different types of proxies are shown with the time space (in years before present) covered by the proxy on the horizontal axis. The time scale is logarithmic. Data from the National Oceanic and Atmospheric Administration Paleoclimate Program
×
For proxy records like tree rings, there is always a model that translates the proxy into a climate variable, such as how the width of tree rings translates into precipitation and temperature. Proxies are calibrated on present-day conditions but then extrapolated to different conditions in the past or future. Note the dangerous word extrapolate. The assumption is that the past behaves like the future.
Ice cores can also provide some estimates of temperatures, because the isotopic composition of the water molecules in the ice is related to the formation temperature (see Chap. 3). Heavier isotopes (atoms with extra neutrons: hydrogen with a proton and neutron, 2H, instead of just a proton, 1H or just H) move differently between liquid and ice phases as a function of temperature. Ice cores also provide past records of stable gases in the atmosphere like carbon dioxide and methane in gas bubbles trapped in ice. These records go back up to 800,000 years (see Chap. 3, Fig. 3.2). Records of sediments (such as pollens) can go back even farther. These records of paleoclimate (paleo—comes from the Greek word for “ancient”) are not direct measurements of climate, but are proxy records related to climate. So comparing them to models set up to run for the past is instructive but subject to the apples-and-oranges problems discussed earlier, and usually take a fairly complex model (often a statistical model) to interpret. But it is useful for climate models to find other climates in the past to simulate, as a way of evaluating models for their representation of the future.
9.2.3 Using Model Evaluation to Guide Further Observations
An important aspect of testing observations is knowing what to measure and where to evaluate a model. Models can help us understand what to measure. By looking at where a model is most sensitive—that is, where small changes in the model itself or the initial conditions result in big changes in results—we can find the places and conditions where we need observations to be able to evaluate (and constrain) a model. In weather forecasting, for example, there are certain situations where we know that small uncertainties can lead to big errors. A classic example is for tropical cyclones: Small differences in the temperature and pressure field around a storm govern how it will intensify or weaken, and in what direction it will move. To improve forecasts, aircraft fly around the storms and take additional observations. These aircraft are guided by forecast models that identify where additional information can make the most difference to the accuracy of a forecast.
In a climate context, we often do similar things on a larger scale: What climate phenomena do we not understand? And what observations would better constrain the phenomena? We know, for example, that clouds are an important uncertainty in models. We also know they are poorly sampled. This guides field projects into critical cloud regions for climate (such as low clouds over the ocean, or in the Arctic). It also motivates long-term or global observation programs to better evaluate climate and climate models over time, for example, with better satellite instruments to measure clouds.
9.3 Predicting the Future: Forecasts Versus Projections
One of the ultimate goals of building a model is to use it for prediction of the future. Prediction is done in two ways, and these methods—forecasts and projections—are important to understand when considering climate model results.
9.3.1 Forecasts
A forecast is something that we think will occur, usually assigned a probability representing our confidence in the forecast. This is common for weather forecasts (e.g., a weather prediction may call for a 50 % chance of rain at a given place and time). Some climate predictions are forecasts: a forecast of the next season or for next year based on what we know now. For events with a long lead time, like El Niño, we can make forecasts, and some of them have pretty good skill for weeks or even months in advance. For forecasting, the present state (initial condition) almost always has an impact on the forecast.
9.3.2 Projections
When we are predicting climate over long timescales, we are really talking about a projection. Why is a projection different from a forecast? A projection is usually dependent on things that we do not know about the future. For a weather forecast, we can assume we know all the important things that can force the weather on the scale of a few days: the composition of greenhouse gases in the atmosphere, for example. There may be important uncertainties in the fine-scale distribution, but the broad emissions are known. But in 50 years, what will the level of carbon dioxide be? That depends on what humans do, and thus we must estimate important parts of the system. We do this by constructing scenarios of the inputs needed for a coupled climate model: those things that force the climate system, such as the solar output or the composition of the atmosphere. Forcing usually implies effects on climate that are outside the model, like the sun. Solar output changes slightly over the course of the 11-year solar cycle, and we can estimate the change in output based on past solar cycles. Greenhouse gas emissions occur from natural sources, and these can be projected forward, but they also come from human emissions. How do we know what they will be? That requires coming up with estimates of the future evolution of the climate system forcing, and this is done with scenarios.
Scenarios are used to specify uncertain future inputs. When models are run with forcing from these scenarios, the results are not forecasts, but projections of the future, given assumptions about what might happen. The key is that the assumptions that impact the projection are outside of the realm of the model. Most climate models do not try to predict the human emissions of greenhouse gases. Integrated assessment models however (see Chaps. 7 and 8) try to predict human emissions. But these models also depend on scenarios. An integrated assessment model may generate emissions from economic activity, but even that is dependent on a scenario, of population growth, for example.
The common method is to have a series of projections spanning what we think are the possible states. For current climate models, it is common to have several scenarios of future emissions of different gases, based on assumptions about human systems, for example, economic growth and development. Each scenario used to force a climate model results in a projection. It is not really a forecast. The range of possible outcomes (projections from probable scenarios) are broadly the forecast: what we think will happen. So mostly we are considering climate projections of the future dependent on specific assumptions (scenarios) about what might happen. It is important in using models to be clear about what is imposed by scenarios and what the model is calculating. Otherwise, you might end up comparing two model projections that are different because of scenario differences, not model differences.
9.4 Applications of Climate Model Evaluation: Ozone Assessment
Perhaps the most comprehensive evaluation of climate models is conducted as part of the climate science assessment by the Intergovernmental Panel on Climate Change (IPCC). Model simulations are run by many modeling centers and evaluated by teams of scientists against observations. The IPCC scenarios are discussed more in Chap. 10, and the results are discussed in Chap. 11, with further application examples. But climate model simulations are also used to project the evolution of the stratospheric ozone layer, which has been damaged by inadvertent emissions of chemical refrigerants containing chlorine. When these chlorine containing molecules break down in the upper atmosphere (the stratosphere), the chlorine acts to destroy stratospheric ozone, increasing the penetration of ultraviolet light to the surface. The reactions occur most readily on the unique surface of clouds in the stratosphere that occur only in polar regions, mostly in the Antarctic, giving rise to a springtime (September) ozone deficit or ozone hole.
Climate models are evaluated for their ability to be able to reproduce the conditions for the distribution of ozone, and their chemistry. A comprehensive report was produced in 2010 for the analysis of the different climate models.4 In particular, the report focused on evaluation of critical processes in the models and how they were represented compared to observations. For assessing the impact of chlorine species on ozone at high latitudes, several different processes need to be represented. First, the model must simulate the actual chemical reactions and the distribution of chlorine. But the presence of clouds in the stratosphere in the Antarctic spring is also necessary, and these cloud processes and their distribution were evaluated. The clouds are dependent on the water vapor and temperature environment. At each step, different observations were used to analyze the models. The results indicated a few models that had processes that were incorrect (wrong reactions with chlorine, for example), or that had better or worse cloud distributions. This information was used in the 2010 scientific assessment of ozone depletion, particularly in the executive summary of the assessment5 to “select” model projections and limit the projections shown to the models shown by evaluation to have the correct representation of key processes.
9.5 Summary
Evaluation of models is targeted for a purpose: What are models good for and why? Models that are good for one purpose may not be good for other purposes. Understanding the uncertainty and, hence, the utility of a model—any model, but especially climate models—requires extensive testing against observations.
Evaluation of climate models requires some fundamental understanding of the observations themselves. What is the uncertainty and accuracy in the observations? As we discuss in detail in Chap. 10, knowing the uncertainty in our observations is an important part of being able to evaluate the uncertainty in models.
Evaluating climate models is done in many ways but is often done similar to weather models. Models are evaluated on their representation of past events, either a single event or a statistical series of events. Evaluation of climate models can also show where critical processes need to be better understood to constrain climate model projections. For example, since cloud processes and responses to environmental changes are uncertain, better representation and evaluation of clouds in climate models is critical.
Predicting the future is often more of a projection than a forecast. A projection is dependent on outside factors, such as emissions dependent on economic growth and population. Thus, it is not truly a forecast because the outcome is dependent on factors outside of the model. This is a source of uncertainty that is partially outside of our knowledge of the climate system, and independent of our ability to design climate models to predict the system.
Understanding uncertainty is one of the keys to prediction, the subject of Chap. 10.
Key Points
Proper evaluation of models requires observations and estimates of observational uncertainty.
Observations also contain uncertain models.
Climate models can be evaluated on many past events, or even a single past event.
Projections of the future depend on scenarios that force climate models.
Open Access This chapter is distributed under the terms of the Creative Commons Attribution-Noncommercial 2.5 License (http://creativecommons.org/licenses/by-nc/2.5/) which permits any noncommercial use, distribution, and reproduction in any medium, provided the original author(s) and source are credited.
The images or other third party material in this chapter are included in the work’s Creative Commons license, unless indicated otherwise in the credit line; if such material is not included in the work’s Creative Commons license and the respective action is not permitted by statutory regulation, users will need to obtain permission from the license holder to duplicate, adapt or reproduce the material.
For a description of the development of the thermometer, see McGee, T. D. (1988). Principles and Methods of Temperature Measurement. New York: Wiley Interscience.
If your Latin is good, see Fahrenheit, D. G. (1724). “Experimenta et Observationes de Congelatione aquae in vacuo factae.” Philosophical Transactions of the Royal Society, 33(381–391): 78. doi:10.1098/rstl.1724.0016.
See Erying, V., Shepherd, T., & Waugh, D., eds. (2010). SPARC Report on the Evaluation of Chemistry-Climate Models. SPARC Report 5, WCRP-132, WMO/TD-1526. Stratospheric Processes and Their Role In Climate, World Meteorological Organization, http://www.sparc-climate.org/publications/sparc-reports/sparc-report-no5/.
World Meteorological Organization. (2011). “Executive Summary: Scientific Assessment of Ozone Depletion: 2010.” In Scientific Assessment of Ozone Depletion: 2010, Global Ozone Research and Monitoring Project–Report No. 52. Geneva: Switzerland: Author.