This paper examines some properties of concrete, such as strength, oxygen permeability and sorptivity using starch [cassava (CA) and maize (MS)] as admixtures. Concrete cubes containing different percentages of the CA and MS by weight of cement (0, 0.5, 1.0, 1.5 and 2.0 %) were cast. Compressive strength tests were carried out after 3, 7, 14, 21, 28, 56, 90, 180, 270 and 365 days of curing. Oxygen permeability and sorptivity tests were carried out on another set of concrete specimens with the same percentages of starch at 7, 28, 90, 180, 270 and 365 days. Oxygen permeability and sorptivity tests data obtained were subjected to Kruskal–Wallis one-way analysis of variance by ranks. The strength increase after 1 year over the control for CA 0.5 and CA 1.0 are 2.7 and 3.8 % respectively, while MS 0.5 and MS 1.0 gave 1.5 % increase over control. These results showed a decrease in oxygen permeability and rates of sorptivity, with concretes containing starch as admixtures giving better performance than the control concretes.
1 Introduction
Concrete structures according to Baroghel-Bouny et al. (2009) should be able to serve the purposes for which they were built throughout their service life. Baroghel-Bouny et al. (2009) noted that safety, economy and environmental factors are major issues in the long-term durability of structures. Achieving durability in concrete therefore should be a very significant factor in the design and construction of new structures and in the evaluation of the condition of existing structures (Merretz et al. 2009). According to Folić and Zenunović (2010), the mode of interaction of concrete with its environment will influence the likely mechanisms of deterioration. The ability of concrete to resist chemical attack, abrasion, weathering action and other deterioration effects is very important during the service life of the structure. Materials used in construction play a major role in the durability of concrete. However, Gjørv (2011) pointed out that design, materials used and workmanship are very important factors in achieving good quality construction which will enhance durability of concrete. Deterioration mechanisms in concrete structures are influenced by interaction with the environment. The system design of concrete and civil engineering structures that involve materials selection, structural shape, construction work and maintenance should be carried out in a manner that is environmentally friendly because this will contribute to environmental sustainability (Folić 2009). The durability of concrete may be affected by physical, chemical and biological factors. These factors may be due to weathering conditions (temperature, and moisture changes), abrasion, attack by natural or industrial effluents and gases, or biological agents (Nagesh 2012). Increased knowledge of materials properties is vital in durability considerations for concrete structures. According to Chidiac (2009) durability of concrete depends on the qualities of the materials, construction, design and exposure conditions. The importance of materials quality cannot be over-emphasized in concrete durability. Elahi et al. (2010) examined the mechanical and durability properties of high performance concretes containing supplementary cementitious materials and concluded that the combination of different cementitious materials and the precise choice combinations should be on the basis of the physical properties relevant to the durability and performance expected from the concrete, as well as the exposure conditions.
Chemical admixtures are used in the production of concrete in order to achieve various durability properties. Khayat (1998) reviewed the use of viscosity-enhancing admixtures such as water soluble synthetic and natural organic polymers. Polymers used as admixtures are said to enhance the joining of the mixing constituents as a result of intertwining polymer film which, according to Chung (2004), produces concrete of better mechanical and durability characteristics. Chemical admixtures are used as high range water reducer admixtures (HRWRA) and have impacted on the rheological and mechanical behaviour of cement-based systems. This allows for a latent time that permits casting of concrete in excellent condition. These chemical admixtures are oil based, non-renewable products such as polynaphthalene sulphonate (PNS), polycarboxylate (PC) and polyacrylate (PA). They contain formaldehyde which when accidentally or intentionally released into the environment may result in undesirable environmental toxic effects (Crépy et al. 2011; Akindahunsi et al. 2013). Recently, interest has been developing in the use of organic admixtures to modify various properties in concrete because they are available in abundance; their preparation is not so sophisticated. They are renewable materials, therefore contributing to sustainable green construction. The use of organic admixtures including starch and its derivatives to modify different properties of cement and concrete has been reported by various authors such as: Luke and Luke (2000); Peschard et al. (2004); Crépy et al. (2011); Akindahunsi et al. (2011), (2012); Lasheras-Zubiate et al. (2012) among others.
Anzeige
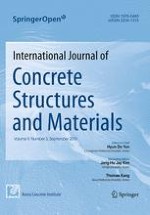
Cassava (CA) and maize (MS) are abundant in sub-Saharan Africa and good sources of starch which is generally known to have a wide variety of industrial applications. Izaguirre et al. (2010) noted that the thickening action of starches and their derivatives can be studied by considering the relationship between amylose and amylopectin molecules, units of starch consisting of the two macromolecule types. The chemical structure of the two macromolecules of starch is shown in Fig. 1. The amylose builds a helix while the amylopectin exhibits a tree structure consisting of numerous connected linear glucose units. Amylose properties are these of thickener, water binder, emulsion stabilizer, and gelling agent while Amylopectin is what makes up a larger percentage of starch and is highly soluble.
Fig. 1
Arrangement of glucose units in Amylose and Amylopectin macromolecules (Source: www.intechopen.com).
×
Starch is used for different purposes such as a thickener/stabilizer and gelling agent. Starch pastes and gels are used to control the consistency of some manufactured products. It is also used as starting material in the production of sweeteners and polygons (BeMiller and Hubber 2011). Starch is equally used in the plastics industry to produce biodegradable plastics which require starches that have small granules (Wang et al. 1998). Furthermore, it is used in the construction industry as concrete block binder, asbestos, clay and limestone binder, fire-resistant wallboard, plywood/chipboard adhesive, gypsum board binder and paint filler (Satin 1998). One of the fears exhibited in the use of organic admixtures is that it is biodegradable and its long term effect on concrete might be negative. This paper therefore examines the use of CA and MS starches as admixtures in concrete and this long term durability characteristics.
2 Materials and Methods
2.1 Materials
Crushed granite used as (coarse and fine) aggregates were obtained from AfriSam aggregates in Johannesburg, South Africa in compliance with South African National standards (SANS 1083:2006). The maximum coarse aggregate size used is 22 mm (compacted bulk density of 1750 kg/m3 and specific gravity of 2.67). Figure 2 gives the particle size distribution. The fine aggregates grading used conforms to the recommended grading of South Africa as contained in Fulton’s concrete technology (2009). CEM1 52.5N cement used in the preparation of different concrete mixes was supplied by Pretoria Portland Cement, Johannesburg, South Africa. CA and MS starches were obtained from Nigeria.
Fig. 2
Aggregates grading curve.
×
2.2 Methods
2.2.1 Determination of Particle Sizes of Cement and Starches Used
The particle size distributions of the cement and the starches (CA and MS) used for this investigation were determined by means of a Malvern (2005) particle size analyzer. It is an automated light scattering instrument, the laser particle size analyser measures the size of particles, powders and suspensions or emulsions using diffraction and diffusion of a laser beam. The sample particles to be measured are passed through concentrated laser beam and the particles scatter light at an angle that is inversely proportional to their size (Malvern 2005). The laser diffraction result generated for the particle size distribution of the CA and MS starches used are volume based. The laser diffraction computed median (D50) is used for the point specification (Malvern 2005). The two most common points used to describe the dispersal of the particles are the finest (D10) and the coarsest (D90) distribution. D50, therefore, is the average particle size. The D10 is the particle size that has ten percent smaller and ninety percent larger. The D90 refers to ninety percent of the particle size distribution having smaller particle size and ten percent having the larger particle size.
2.2.2 Starch Activation
The MS starch powder is factory pre-treated and the starch properties can be activated in water at ambient room temperature and the required dosage (in powder form) added directly to the mix. CA starch however, has to be activated with hot water at a temperature between 70 to 90 °C. Therefore, the required dosage has to be prepared separately and allowed to cool down in order not to contribute to temperature rise in the mix in which it is going to be used. The quantity of water used in the starch activation was deducted from that required in a mix.
2.2.3 Starch Morphology
Field emission Scanning Electron Microscope (JSM-7600F model) was used to examine the morphology of the starch (MS and CA) materials used in this study. The JSM-7600F operates with the use of a T-FE electron gun and sem-in-lens objective lens in its electron optics system and a robust structure is able to operate in a broad range of installation environments. This enables the achievement of high resolution and high quality images. The scanning electron microscope incorporates an energy filter (r-filter) for the secondary and backscattered electrons, and this increases image resolution on nonconductive specimens and semiconductor devices.
2.2.4 Setting Times Tests
Setting times (initial and final) for the different percentages of CA and MS starch additions in cement were determined under controlled humidity and temperature. The percentages of starch added to the cement are 0, 0.5, 1.0, 1.5, 2.0 respectively. The tests complied with the South African standard SANS 50196-3:2006 and EN 196-3:2005. Standard mortar mixer set to EN mixing standard was used to carry out the mixing of the different cement pastes with various concentrations of starches. The setting times were determined using automatic Vicat needle apparatus ToniSet Expert model 7320 manufactured by Toni Tecknik, Germany.
2.2.5 Concrete Mixes
The concrete used for the study was prepared according to ACI (1999). A pan mixer was used for making the concrete mixes. The concrete mixes are as presented in Table 1, showing different concrete mixes containing different percentages of CA and MS starches by weight of cement cast (0, 0.5, 1.0, 1.5 and 2.0 %) using the same mix proportions. The air content used in the mix proportion was 1 %. For each mix listed in Table 1 three samples were cast in 100 mm cube moulds for compressive testing at 3, 7, 14, 21, 28, 56, 90, 180, 270 and 365 days. The cast cubes were covered with plastic sheets in a controlled laboratory environment at a temperature of 23 ± 2 °C. The concrete cubes were demoulded after 24 h and kept in a water curing tank with temperature maintained at 23 ± 2 °C. The cubes for each mix were taken out of the curing tank, weighed and tested for compressive strength at each of the stated curing days.
Table 1
Mix proportions (kg/m3) of the various concrete used.
Content (kg/m3)
Mix no
Cement (CEM1 52.5 N)
Coarse aggregates
Fine aggregates
w/c
Starch %
Slump (mm)
Control
380
1024
738
0.54
0
85
CA 0.5
380
1024
738
0.54
0.5
65
CA 1.0
380
1024
738
0.54
1.0
47
CA 1.5
380
1024
738
0.54
1.5
32
CA 2.0
380
1024
738
0.54
2.0
23
MS 0.5
380
1024
738
0.54
0.5
68
MS 1.0
380
1024
738
0.54
1.0
46
MS 1.5
380
1024
738
0.54
1.5
35
MS 2.0
380
1024
738
0.54
2.0
26
The compressive strengths of the concrete cubes were determined in accordance with South African codes SANS 5860 (2006), 5861-2 (2006) and 5861-3 (2006) which are used as benchmark for concrete quality and as an index of the strength of concrete. The cubes were crushed in saturated moist condition in compliance with the standard as stated in Fulton’s concrete technology (2009). An Amsler compression machine with a capacity of 2000 kN was used to carry out the compression tests.
2.2.6 Oxygen Permeability Test
A set of concrete cubes were cast for durability tests (sorptivity, oxygen permeability) at 7, 28, 90, 180, 270 and 365 days. The permeability coefficient based on the derivation of the D’Arcy coefficient of permeability was obtained by monitoring a falling head pressure carried out on the concrete discs. The cast concrete cubes moist cured at the stated cured age were removed from the curing tank and cored with a coring machine. Oxygen permeability tests were carried out according to the durability index testing procedure manual of the Cement and Concrete Institute (2010) of South Africa. The study carried out by Alexander et al. (2008) showed that this method can be used for the assessment of performance-based design and specifications in concrete structures. The set-up of the permeameters is as shown in Fig. 3. The permeameters have both inlet and outlet valves, the inlet valves connected to an oxygen cylinder allows oxygen gas inflow into the permeameters. Pressure gauges having a range from 0 to 150 kPa with an accuracy of 0.5 kPa are connected to the permeameters. Pressure was allowed to build up to 100 ± 5 kPa inside the permeameter and oxygen permeability test was then commenced and it was for a duration of 2 h. The equation governing the operation of oxygen permeability test is shown in Eq. (1). The test data were captured by a data logger connected to all the permeameters. The slope of the linear regression line forced through the line (0, 0) point is calculated from the equation.
where P0 is the initial pressure at start of test (at time t0) to the nearest 0.5 kPa, Pt is the subsequent readings in pressure to the nearest 0.5 kPa at times t, measured from t0. The D’Arcy coefficient of permeability is given by
$$ k = \frac{wVgdz}{RA\theta } $$
(2)
where k is the coefficient of permeability of test specimen (m/s), w is the molecular mass of oxygen (0.032 kg/mol), V is the volume of oxygen under pressure in permeameter recorded to the nearest 0.01 litre, g is the acceleration due to gravity (9.81 m/s), R is the universal gas constant (8.313 Nm/K mol), d is the average specimen thickness (m), A is the cross sectional area of the specimen (m2), θ is the absolute temperature (K), z is the slope of the line determined in the regression analysis.
Fig. 3
Permeameters used for oxygen permeability tests.
×
The coefficient of permeability was calculated for each of the test specimens, and the oxygen permeability index (OPI) is given as the negative log of the average coefficients of the specimens.
Fluid flow into a porous, unsaturated substance under the action of capillary forces is referred to as absorption. The capillary pressure is dependent on the pore geometry and the saturation level of concrete. The water sorptivity test was carried out according to the durability index testing procedure manual of the Cement and Concrete Institute (2010) of South Africa. This test quantifies the rate of absorption of the concrete material tested. Two concrete cubes per specimen type were cored and two concrete discs of 70 ± 2 mm diameter, 30 ± 2 mm thickness cut from each cube. The circular edges of the core are sealed with tape to ensure unidirectional absorption. Dry masses of the samples were taken and the thickness of each sample measured in four different directions and diameters taken at two distinct points. The sealed circular edges of the concrete disc were placed in the tray with saturated calcium hydroxide. The specimens were weighed at 3, 5, 7, 12, 16, 20 and 25 min after patting them once on a piece of absorbent paper. Thereafter, the specimens were placed standing on their curved edges in a vacuum saturation tank. The tank was evacuated to maintain the specimens between −75 and −80 kPa under vacuum for 3 h. After 3 h, the tank was isolated and water was allowed into the chamber until it was filled to approximately 40 mm above the specimens. Thereafter, vacuum was re-established to between −75 and −80 kPa and maintained for 1 h after which the vacuum was released and air was allowed to enter into the tank and left for 18 h. Thereafter, they were surface dried and the weights were immediately measured. The sorptivity (S) is given by:
where ΔMt is the change of mass with respect to the dry mass (g), Msat is the saturated mass of concrete (g), M0 is the dry mass of concrete (g), d is thesample thickness (mm), t is the period of absorption (hr).
3 Results and Discussion
3.1 Materials Characterization
The chemical composition of the cement used for this investigation is shown in Table 2. Observation from the result shows that C3S has the highest constituent percentage of the cement compounds. This therefore implies that high early strength development should be expected when the cement is used.
Table 2
Chemical composition of cement.
Oxides
Oxides composition
Chemical tests
(%)
SiO2
20.0
Al2O3
4.60
Fe2O3
1.68
Mn2O3
0.90
TiO2
0.27
CaO
59.9
MgO
4.50
P2O5
0.13
SO3
2.61
Cl
0.004
K2O
0.65
Na2O
0.18
LOI
3.89
Total
99.3
Insoluble residue
1.11
Compounds calculated from Bogue’s equation
C3S
53.59
C2S
16.91
C3A
9.35
C4AF
5.11
Anzeige
3.2 Particle Sizes
The average particle size of cement used for the tests as illustrated in Fig. 4 is 18.698 μm. The specific surface area of the cement as determined by the Malvern particle size analyzer is 0.457 m2/g. The average particle sizes of the CA and MS starch powders as presented in Figs. 5 and 6 are 14.294 μm and 25.051 μm respectively. The specific surface areas of the CA and MS starch granules are 0.444 m2/g and 0.266 m2/g respectively. Observations from Figs. 5 and 6 show that CA starch powder is finer than MS starch powder and has larger specific surface area. The obtained particle size distribution of the CA starch granules is consistent with the findings of Swinkels (1985) and Moorthy (2002). However, the average particle size obtained for MS starch granules is higher than that obtained by Swinkels (1985), but consistent with Moorthy (2002).
Fig. 4
Particle size of cement used for this investigation.
Fig. 5
Particle size of the cassava starch powder.
Fig. 6
Particle size of the maize starch powder.
×
×
×
3.3 Setting Times Tests
The results of the setting times of cement paste with starches (CA and MS) is presented in Fig. 7. It can be observed from Fig. 7 that control cement exhibited the least initial and final setting times. The results showed that with increasing concentrations of starches, the setting times, whether initial or final, increases irrespective of the type of starch used. It also showed that control has the least initial and final setting times followed by MS 0.5, MS 1.0, MS 1.5, MS 2.0, CA 0.5, CA 1.0, CA 1.5 and CA 2.0 respectively. Observation from MS pastes showed continuous small increments in both initial and final setting times as the concentrations of MS starch increases. However, CA pastes of similar concentration to MS pastes have longer initial and final setting times.
Fig. 7
Setting time of cement paste with different concentrations of starches.
×
The prolonged setting times of the cement pastes with starch additions may be attributed to retardation of hydration of some cement compounds such as tricalcium silicate (C3S) and tricalcium aluminate (C3A) (Ramachandran 1995). According to Brooks et al. (2000) it may also be due to adsorption of the admixture onto the cement grain surfaces. It should however, be pointed out that though admixtures may delay setting times in concrete, mechanical properties of the concrete is not negatively affected. Bishop and Barron (2006) found that though tartaric acid retarded hydration of cementitious systems yet the strength was enhanced. The small smooth and spherical nature of CA starch (Fig. 8) granules coupled with the larger specific surface area (Figs. 5) in comparison to that of MS starch (Fig. 6) would result in adsorption of more CA starch onto the surfaces of cement grains and covering of the cement grains.
Fig. 8
SEM micrograph of cassava starch.
×
3.4 Morphology of Starches
The micrographs of the starches are presented in Figs. 8 and 9. It can be observed that characteristic features of CA starch granules (Fig. 8) are smooth and spherical in nature while MS starch granules (Fig. 9) are also smooth but polygonal in shape, similar to what Swinkels (1985) reported. The specific surface area of the CA starch (Fig. 5) being larger than that of MS starch granules (Fig. 6) would make CA starch more available for adsorption onto the cement grains surfaces. The gel formed from CA starch will cover the surfaces of cement grains very easily because of the particle size, shape and the specific surface area. However, because of the size and polygonal shape of MS starch granules the gel would not cover as much surface of the cement grains as that of CA starch. One of the effects of starch addition to concrete is that it increases the viscosity of the material and this is seen from the slump measurements of different concrete mixes used in this investigation (see Table 1). Further comparison between CA concretes and MS concretes shows that CA concretes of the same concentrations with MS concretes have lower slump, which is due to adsorption of more CA starch onto the surfaces of the cement grains. This results in higher viscosity and also confirms one of the findings of Swinkels (1985) that CA starch has higher congealing power and thus leads to higher viscosity.
Fig. 9
SEM micrograph of maize starch.
×
Energy dispersive X-ray analysis (EDXA) that gives the chemical composition of the CA and the MS starches were carried out as shown in Figs. 10 and 11 respectively, with the results presented in Tables 3 and 4 respectively. The major elements in those starches are carbon, oxygen and hydrogen, though EDXA cannot give the percentage of hydrogen in any compound. The general structural arrangement of starch shown in Fig. 1 confirms the presence of hydrogen. CA starch has Potassium (K) as a trace element while MS starch has Sodium (Na) and Sulphur (S) as trace elements.
Fig. 10
EDXA of cassava starch.
Fig. 11
EDXA of maize starch.
Table 3
Chemical composition of CA starch.
Element
Weight %
Atomic %
C K
49.99
57.18
O K
49.76
42.73
K K
0.25
0.09
Total
100.00
Table 4
Chemical composition of MS starch.
Element
Weight %
Atomic %
C K
43.47
50.68
O K
56.00
49.02
Na K
0.38
0.23
S K
0.14
0.06
Total
100.00
×
×
3.5 Compressive Strength Tests
The compressive strength results are presented in Figs. 12 and 13. The strength development pattern generally consistent with the recommendations in Table 11 of BS 8110 (1985). Generally observed high early strength development of the concretes can be attributed to high percentages of C3S and C3A in the cement composition as shown in Table 2. These compounds are responsible for the early strength development in cement. Neville and Brooks (1990) reported that that the strength ratio of 365-day to 28-day concrete without admixtures should be about 1.25. The result obtained from this investigation is 1.20, which is reasonably close to the stated ratio.
Fig. 12
Compressive strength of concrete with cassava starch addition.
Fig. 13
Compressive strength of concrete with maize starch addition.
×
×
The compressive strength results of concrete mixes containing different percentages of CA by weight of cement (0, 0.5, 1.0, 1.5 and 2.0) after 28 days of curing are: 58.53, 60.5, 61.43, 57.83 and 58.63 N/mm2 respectively. This represents 3.4, 4.9, 0.5 and 0.2 % increase in compressive strength of CA concretes over the control. For MS starch additions (0.5, 1.0, 1.5 and 2.0) the percentage increase in strength are 59.85, 61.6, 59.77 and 57.1 N/mm2 respectively. This represents 2.3, 5.2, 2.1 and −2.4 % increase over the control. After 1 year of curing, percentage strength increase over the control for CA 0.5 and CA 1.0 are 2.7 and 3.8 % respectively while MS 0.5 and MS 1.0 gave same value of 1.5 %. Drop in strength experienced in CA 1.5, CA 2.0 MS 1.5 and MS 2.0 are 2.7, 0.6, 2.9 and 3.1 % respectively. From Figs. 12 and 13, CA 0.5, CA 1.0 MS 0.5 and MS 1.0 attained strength of more than 70 N/mm2, however, CA 0.5 and CA 1.0 attained it at 90 days while MS 0.5 and MS 1.0 attained at 180 days. The obtained compressive strength of more than 70 MPa is reasonable with the use of high strength cement of 52.5 N at water-cement ratio of 0.54. The long-term strength of the concretes is seen to slow down after 180 days because much of the strength has been gained in the early days (of strength development) as observed from the high percentage of C3S in the constituents of cement used (Table 1). The gain in compressive strength after 100 days as observed from Figs. 12 and 13 is limited by the availability of hydration sites which is reduced as the cement matures.
A comparison of CA concretes (Fig. 12) and MS concretes (Fig. 13) with the control shows that CA concretes attained high strength earlier than MS concretes and the control. This may be because CA starch is known to have higher degree of polymerisation than MS starch (Swinkels 1985), resulting in greater binding force. This explains why CA starch concretes have lower slump when compared to the control concretes or MS starch concretes. Swinkels (1985) showed that the extent of polymerisation of starch molecule is influenced by the source of starch.
3.6 Oxygen Permeability Test Results
The results of oxygen permeability test are presented in Figs. 14 and 15. From the result of coefficients of permeability k (m/s) presented in Fig. 14, there is progressive decrease (based on time) in the coefficients of permeability for all the starch concentrations except for spikes experienced at 6 months for control, CA 1.0 and MS 1.0, at 90 and 270 days for CA 1.5, at 28 days for CA 2.0 and at 270 days for MS 2.0. The illustrated results of the oxygen permeability indices (OPI) in Fig. 15 show that the indices increased over time except for the drops shown at 180 days for control, CA 1.0 and MS 1.0, at 3 and 9 months for CA 1.5, at 28 days for CA 2.0 and at 270 days for MS 2.0. The results show that the permeability characteristics of the concrete specimens improved with time. For concrete specimens with CA and MS starches, their permeability characteristics improved significantly as can be seen in Fig. 14 from 7 to 365 days. The consistent decrease in coefficients of permeability which result increase in OPI of starch modified concretes over time implies improved durability characteristics. This is in agreement with the findings of Akindahunsi et al. (2012) and shows that in general starch improves durability of concretes over the monitored period.
Fig. 14
Coefficient of permeability of different starch concentrations.
Fig. 15
Oxygen Permeability Indices for different starch concentrations.
×
×
The relationship between coefficients of permeability and oxygen permeability indices for concrete samples with various concentrations of starch are presented in Figs. 16 and 17. This indicates positive correlation between the coefficients of permeability and oxygen permeability indices for the various concrete samples. The linear correlations of control, CA 0.5, CA 1.0, CA 1.5, CA 2.0, MS 0.5, MS 1.0, MS 1.5 and MS 2.0 are 0.9947, 0.9922, 0.9901, 0.9994, 0.9902, 0.9971, 0.9771, 0.9953 and 0.97 respectively. The OPI indicates the rate at which oxygen can permeate through the concrete. A low value of coefficient of permeability will imply a high OPI as seen in Figs. 16 and 17, which is an indication of a low permeable concrete material. Beushausen and Alexander (2008) pointed out that oxygen permeability is a dependable method of assessing the durability of concrete characteristics and can be used in ascertaining material properties of concrete.
Fig. 16
Relationship between coefficients of permeability and oxygen permeability indices with different concentrations of cassava starch in concrete.
Fig. 17
Relationship between coefficients of permeability and oxygen permeability indices with different concentrations of maize starch in concrete.
×
×
3.7 Sorptivity
The result of the sorptivity tests is presented in Fig. 18. The illustrated result generally showed a decrease in sorptivity of the concrete samples over time, in agreement with Akindahunsi et al. (2012). Generally, sorptivity at 7 days curing was the highest for all the concretes except for CA 1.0 where 28-day sorptivity was higher than that of 7 days. The sorptivity results of the concrete specimens at one year testing showed that the control has a sorptivity rate of 7.7 mm/hr0.5 while concrete specimens with CA starch shows that CA 1.0 has a sorptivity of 7.1 mm/hr0.5 followed by CA 0.5 (7.5 mm/hr0.5). Concrete with MS starch additions (MS 0.5, MS 1.0, MS 1.5 and 2.0) show lower sorptivity rates (6.96, 6.95, 6.7 and 7.6 mm/hr0.5 respectively) for concrete specimens tested at 365 days. Alexander et al. (2008) explained the importance of the sorptivity test in construction as a property that is sensitive to the cover provided for reinforcement in the concrete. The authors noted that sorptivity can be used on site as a control measure for durability requirements.
Fig. 18
Sorptivity for different starch concentrations.
×
4 Statistical Evaluation of Oxygen Permeability and sorptivity Results
The results of the oxygen permeability and sorptivity tests were subjected to some statistical analyses to determine their normality. That is, statistical tests were conducted to examine if there was any significant difference in the results obtained for the different concentrations of starch additions in concrete at each of the test periods (i.e. 7, 28, 90, 180, 270 and 365 days) and if there was any significant difference between control specimens and CA and MS concretes. STATA® statistical software was used for the analyses. Sktest and swilk tests were used to check the normality of the oxygen permeability and sorptivity data and the results showed skewness. The histogram and the qnorm plots are illustrated in Figs. 19 and 20.
Fig. 19
Skewness of permeability data.
Fig. 20
Skewness of sorptivity data.
×
×
Since the data are skewed, a non-parametric statistic was used to examine if there was any statistically significant difference in oxygen permeability and sorptivity at the different test days for concrete specimens containing different concentrations of starches. Kruskal–Wallis one-way analysis of variance by ranks was used compare the mean permeability of the concretes and rates of sorptivity at different test periods. By combining different concentrations of the same starch material, a test was conducted to check if there were significant differences between control, CA and MS concretes over the monitored test period. The result indicated that there are significant differences over time especially from after 100 to 365 days and they are illustrated in Figs. 21 and 22. This shows that the addition of starch to the concretes improves their durability properties.
Fig. 21
Effect of different materials on oxygen permeability test.
Fig. 22
Effect of different materials on sorptivity test.
×
×
5 Conclusion
The effects of different starch concentrations as an admixture in concrete were examined and the following inferences can be made:
1.
Starches used in this investigation generally delay the setting time of cement which may be an advantage for use where a longer period of time is required for casting the concrete.
2.
The morphology, particle size and specific surface areas of the starches gave an indication of the form of adhesion the starches would have on the cement grains. CA starch with a smaller average particle size thus adheres more strongly onto cement grains. Hence, it will lead to a higher viscosity and less slump in concretes when compared to MS starch.
3.
The compressive strength tests result at 28 days showed that CA 0.5, CA MS 0.5 and MS 0.5 have 1.0 3.4, 4.9, 2.3 and 5.2 % strength gain over the control respectively. After a year the strength increase for CA 0.5 and CA 1.0 are 2.7 and 3.8 % respectively over the control, while MS 0.5 and MS 1.0 gained 1.5 % strength over control.
4.
Incorporation of CA and MS starches into concrete improves the durability properties of the concrete.
5.
The statistical analyses of concrete mixed with different starches when compared with control indicated that generally concrete with starches performed better than control. However, overall the concretes with addition of different concentrations of MS starch performed better than concretes with different concentrations of CA starch.
Further investigations may be required to determine the suitability of the use of starch under different environmental conditions in order to assess the full impact of durability properties of the material in concrete.
Open AccessThis article is distributed under the terms of the Creative Commons Attribution 4.0 International License (http://creativecommons.org/licenses/by/4.0/), which permits unrestricted use, distribution, and reproduction in any medium, provided you give appropriate credit to the original author(s) and the source, provide a link to the Creative Commons license, and indicate if changes were made.