


Abstract
Tillage alters the thermal and wetness conditions in soil, which facilitates soil organic matter oxidation and water transportation, leading to rapid depletion of soil carbon (C). Little is known about tillage intensity change (TIC) and its impacts in the US corn-soybean rotation system over the past two decades. Using time-series tillage maps developed from a private survey and a process-based land ecosystem model, here we examined how tillage intensity has changed across the nation and affected soil organic carbon (SOC) storage from 1998 to 2016. Results derived from the combination of tillage survey data and cropland distribution maps show that total corn-soybean area consistently increased from 62.3 Mha in 1998 to 66.8 Mha in 2008 and to 73.1 Mha in 2016, among which the acreage under no-till system increased from 16.9 Mha in 1998 to 28.9 Mha in 2008, while conservation and conventional tillage decreased by 3.8 and 3.9 Mha, respectively. The extent of no-till practice in corn-soybean lands shrank by 2.6 Mha from 2008 to 2016, while conservation and conventional tillage increased by 2.8 and 6.1 Mha in the same period. Modeling simulations reveal that historical tillage practices led to a soil C loss of 10.3 (spring till only) to 15.2 (tilled in both spring and fall) Tg C yr−1 in the study area from 1998 to 2016. In addition, reduced tillage intensity in corn-soybean cropland contributed to SOC accumulation at 1.0 Tg C yr−1 (1.6 g C m−2 yr−1) from 1998 to 2008, but the SOC gain was offset by SOC reduction at 2.4 Tg C yr−1 (3.4 g C m−2 yr−1) from increased tillage intensity during the period 2008–2016. For both periods, TIC-induced hydrological C loss accounted for 15% of the SOC change, while the rest was attributed to gaseous-C loss.
Export citation and abstract BibTeX RIS

Original content from this work may be used under the terms of the Creative Commons Attribution 3.0 licence. Any further distribution of this work must maintain attribution to the author(s) and the title of the work, journal citation and DOI.
1. Introduction
Soil is an essential reservoir for carbon (C), holding C stock in excess of the sum of atmosphere and vegetation pools (Post et al 1990, Houghton and Skole 1990). The C holding capacity is, however, vulnerable to disturbances, among which agricultural activity plays the leading role in depleting soil C (Sanderman et al 2017, West et al 2010). Since the mid-19th century, rapid cropland expansion in the US has converted more than 100 Mha natural vegetation into intensively managed cropping systems (Yu and Lu 2018). Clearing, tilling and draining these lands for food production directly intensified global climate change through releasing large amount of CO2 into the atmosphere (Lal et al 1999). Large C loss under agricultural activities has been well-documented in both observational evidence from long-term monitoring experiments (Huggins et al 1998, Matson et al 1997) and model simulations (Yu et al 2018, 2019, Spawn et al 2019). In the US cropland, a total of approximate 5.0 Pg C (1 Pg = 1000 Tg = 1015 g) was lost as a result of cultivation (Lal et al 1999, Yu et al 2018), accounting for 12.3% of the C loss from global agricultural land since 1850 (Pugh et al 2015). Among all the factors leading to soil C reduction, tillage practices such as conventional till, not only promote soil organic carbon (SOC) oxidation and decomposition, but also accelerate soil erosion by increasing exposure to wind and rain (Grant 1997). Soil C loss through these two pathways, gaseous loss and hydrological loss (i.e. leaching and water erosion), have distinct implications for climate and environmental quality. The leached and eroded SOC may be deposited and buried in riverine and oceanic systems, while gaseous SOC loss could release greenhouse gases such as CO2 and CH4 to the atmosphere (Lal 2003).
Undoubtedly, SOC loss rate is closely related to the tillage practice farmers adopt. In this study, specifically, we classified tillage practices into three types, namely, no-till, conservation till, and conventional till. Tillage intensity, defined in this study as intensity of disturbance applied to the soil, increases as one moves from no-till to conservation till and then to conventional till. Conventional till intensively disturbs soil, burying most residue belowground and leaves less than 15% of the residue on surface (Conservation Technology Information Center 2018). In comparison, conservation tillage and no-till practices leave more than 30% of residue on soil surface (Conservation Technology Information Center 2018, Paustian et al 2016, Gattinger et al 2012, Six 2013, Angers and Eriksen-Hamel 2008). Benefits from adopting conservation tillage and no-till are evident, including potentials for protecting soil from erosion (Van Oost et al 2007), reducing SOC decomposition in top soils (Lal 2015), and curtailing fossil fuel consumption (Busari et al 2015). Nevertheless, reduced tillage intensity may retard soil warming in spring, increase pest outbreak and disease epidemic risks, and stimulate weed growth, leading to crop yield loss (Drury et al 1999, Brown et al 2001, All et al 1979). Because of spatial heterogeneity in springtime weather, pest prevalence, weed growth potential and other relevant factors, the adoptions of different tillage systems have varied spatially and temporally across the US as growers in various locations weigh advantages and disadvantages differently, given improved crop varieties.
Various models (e.g. EPIC, C-farm, DNDC, HSB-C, PASTIS) have been applied to simulate the impacts of agricultural management practices on soil biogeochemical cycles. Studies based on these models have greatly improved our understanding of the tillage impacts on soil C dynamics at different levels (Fu et al 2000, Izaurralde et al 2001, Kemanian and Stöckle 2010, Li et al 2003, Oorts et al 2007). However, there is a lack of comprehensive, long-term, and spatially-explicit assessments on how tillage practice and tillage intensity has affected C storage in the US croplands. In this study, we aim to (1) assess the magnitude and spatiotemporal patterns of soil C storage change caused by tillage practices in the corn-soybean cropping system of the conterminous US; (2) attribute SOC change to gaseous and hydrological losses; (3) quantify the uncertainties in estimating tillage impacts on C storage; and (4) explore the potential of C stock accumulation from reducing tillage intensity.
2. Materials and methods
We used the Dynamic Land Ecosystem Model (DLEM; Tian et al 2015)—a process-based biogeochemical model—to quantify the impacts of tillage on terrestrial C storage in the US. The model has been rigorously calibrated and validated in the US against observational data from the Long Term Ecological Research (LTER) Network, Long-Term Agroecosystem Research (LTAR) Network, and measurements at flux towers (Liu et al 2013, Lu et al 2012, 2018a, Tian et al 2010, Yu et al 2018). DLEM has been widely used to estimate C storage change following human activities such as land use and cover changes (LUCC) in China (Tian et al 2011), tropical Asia (Tao et al 2013), and the continental US (Lu et al 2018a, Tian et al 2012, Yu et al 2018, 2019). To capture the legacy effect of land use change, we started the model run from 1850 while the analysis in this study focuses on the 1998–2016 period.
2.1. Input driving data
The DLEM model was driven by spatially-explicit datasets, including daily climate conditions (average, minimum and maximum temperature, precipitation, shortwave solar radiation, and relative humidity), annual land use and cover change, monthly concentration of atmospheric CO2, annual nitrogen (N) deposition, and agricultural management practices (such as N fertilizer use, irrigation, manure N application, tillage, and tile drainage).
2.1.1. Climate, CO2 and nitrogen deposition data
The daily climate data we used to force the model were harmonized from Climatic Research Unit (CRU) and North America Regional Reanalysis (NARR) dataset at a resolution of 5 arc-min ×5 arc-min (Mesinger et al 2006, Mitchell and Jones 2005). Atmospheric CO2 was retrieved from IPCC historical CO2 data, Liu et al (2013), and Wei et al (2014), and gridded N deposition maps were derived from the monitoring data of National Atmospheric Deposition Program (http://nadp.slh.wisc.edu/MDN/maps.aspx) and model-based N deposition data (Dentener 2006, Wei et al 2014).
2.1.2. Land use and land cover database developed
The annual LUCC maps, identifying distribution and percentage of vegetated land (e.g. cropland, grassland, forest, shrub, wetland) and non-vegetated land (e.g. lakes, streams, oceans, glaciers, bare land impervious surface) in each 5-arc min pixel, were developed by adopting methodologies from Liu et al (2013), Liu and Tian (2010), and Tian et al (2010). The LUCC dataset we used in this study includes the improved cropland distribution maps based on USDA county-based survey (Yu and Lu 2018, Yu et al 2019), the harmonized forest maps using North American Forest Dynamics (NAFD) and Land Use Harmonization data (Hurtt et al 2011), and the reconstructed wetland maps based on state-level wetland area inventory reports (NWI-national wetland inventory, https://fws.gov/wetlands/; areas between reported years were linearly interpolated). Thus, changes in annual fractions of cropland, forest, and wetland area are characterized by independent vegetation-specific database, while distributions of other natural vegetation types in each grid cell were originally derived from potential vegetation maps (e.g. Wei et al 2014), and then proportionally adjusted according to annual dynamics of cropland, forest and wetland areas. More details can be found in Lu et al (2018a) and Yu et al (2019).
The crop rotation maps (annual crop type maps) were reconstructed using satellite images and the USDA National Agricultural Statistics Service (NASS) survey data. The approach to develop the crop rotation maps was also elaborated in Yu et al (2018).
2.1.3. Tillage and other agricultural management practices
Tabular tillage data was purchased from Kynetec, a global market research company that has conducted scientifically well-grounded market surveys of about 4500 corn farmers and about 4000 soybean farmers annually in the United States for many decades. Our data are obtained from their AgroTrak® product available over the period 1998–2016 and are designed to be reliable at the USDA Crop Reporting District (CRD) level of analysis. Farmers were queried about intensity of cultivation practices, including no-till, conservation tillage (e.g. ridge till, mulch till), and conventional tillage (e.g. moldboard plow, chisel plow, disk harrow) in each CRD. Therefore, the tabular tillage data provides the percentage of the three tillage types adopted in corn/soybean area in each CRD. In this study, we reconstructed annual tillage type maps since 1998 by using the survey data and the cropland density and crop rotation maps developed in our previous studies (Yu and Lu 2018, Yu et al 2018, 2019). Moreover, we spatialized the annual tillage-specific area data by assuming high intensity tillage was adopted at locations with low soil erosion potential. We assume that farmers on vulnerable soils will seek to protect their asset, and that farmers on erosion-prone land may be incentivized to use low-intensity tillage in order to be eligible for government programs. The three tillage intensities were then assigned to grid cells with corn/soybean planted in each CRD according to the soil erosion susceptibility derived from combination of the inherent erodibility of soil type (K-factor from Soil Survey Geographic Database) and slope ranking information (Minnesota Department of Natural Resources 2018). More specifically, we (1) summarized the annual percentages of each tillage practice type in corn and soybean acreages reported in each CRD; (2) sorted the grid cells containing corn or soybean fields in each CRD each year according to their erodibility scores; and (3) assigned conventional tillage first to those grid cells with low erodibility score, and after its total acreage percentage in corn and soybean reach annual survey record, assigned conservative tillage along erodibility ranking until its acreage percentage was met, and then no till. Uncertainties were also quantified by developing additional maps of tillage intensity scenarios, assuming random tillage practices adopted without considering erosion potential. Since the surveyed tillage information was only available for corn and soybean, we assumed no-till practice was implemented in other crop areas to avoid the confounding impacts from other crops. Due to the lack of tillage information before 1998, the tillage maps in 1998 were used for the period from 1850 to 1998.
Crop specific N fertilizer use data were reconstructed by Cao et al (2018) covering the contiguous US from 1850–2015. Besides, we also developed fine-resolution data to characterize spatial and temporal patterns of national N fertilizer application timing and the ratio of  across the US. Crop technology improvement (e.g. plant breeding) was represented and calibrated against national crop yield records for each crop type obtained from USDA NASS (http://usda.mannlib.cornell.edu/) in the DLEM. The irrigation map used was produced by Thenkabail et al (2009). The tile drainage map of the entire US was provided by Sugg (2007). Manure N application data was obtained from Yang et al (2016) at 5 arc min × 5 arc min resolution. More details can be found in Lu et al (2018a), Yu et al (2018), and Yu et al (2019).
2.2. Model representation of tillage impacts
As we outlined in Yu et al (2018), we represented tillage impacts on C, nitrogen and hydrological cycles in DLEM following the mechanisms described in Fox and Bandel (1986), Lemunyon and Gross (2003), Li et al (1994), Linn and Doran (1984), and Gilley (2005). More specifically, the DLEM model assumes that, when compared with no till practice, (1) decomposition rate is increased by 1.5 and 3 times under plowing (conservation tillage) and disking (conventional tillage), respectively; (2) conservation tillage and conventional tillage reduce residue cover from 80% (no-till) to 30% and 15%, respectively; (3) soil moisture is reduced through enhancing evaporation by 1.207 and 1.448 times for conservation and conventional tillage, respectively; (4) denitrification is reduced by 15% and 30% for conservation and conventional tillage; and (5) soil erosion under conservation and conventional tillage is increased according to the residue type left from previous year (table 1). In DLEM, hydrological loss of C is the sum of C leaching in the forms of dissolved inorganic carbon (DIC), dissolved organic carbon (DOC) and particulate organic carbon (POC). Tillage indirectly affects DIC leaching through soil respiration and DOC leaching by altering the soil DOC amount and water flux (see supplementary file is available online at stacks.iop.org/ERL/15/014008/mmedia). Therefore, although DIC and DOC losses are primarily natural fluxes, their changes indirectly caused by tillage practice changes were accounted in this study. POC loss (mainly through soil erosion) is calculated with the Modified universal Soil Loss equation (Chaubey et al 2006, Williams and Berndt 1977). More details can be found in supplementary file and Tian et al (2015). Here we modified the way in which we calculate POC loss by considering the tillage-caused crop residue removal for different crop types as shown in table 1. According to observational studies (Miércio et al 2017, Omonode et al 2007, Ruan and Philip Robertson 2013), we assumed that tillage impacts can only last for a two-month period after implementation and the effects will linearly decrease through time.
Table 1. Tillage impact on soil erosion by crop residue typesa.
| Residue type | |||||
|---|---|---|---|---|---|
| Tillage type | Corn | Soybean | Wheat | Sorghum | Otherb |
| No till | 1.00 | 1.00 | 1.00 | 1.00 | 1.00 |
| Conservation till | 1.03 | 1.33 | 1.61 | 1.11 | 1.27 |
| Conventional till | 1.11 | 2.00 | 2.50 | 1.43 | 1.76 |
aNumbers derived from Gilley (2005), which represent soil loss ratios comparing with no-till practice assuming conservation tillage and conventional tillage reduce residue cover from 80% (no-till) to 30% and 15%. b'Other' is the average values of the four residue types.
2.3. Model calibration, validation and experiment design
As mentioned earlier, the DLEM model has been intensively calibrated at both site- and regional scales (Yu et al 2018). In this study, we revisited the calibration using the sites collected in a previous study (figures 1(a), (b)). Specifically, additional validations were performed using four individual studies to examine model capability in capturing tillage impacts on CO2 emission and soil C loss in the US (figure 1(c)). The validation of model performance in simulating gross primary productivity (GPP) and crop yield can be found in Lu et al (2018a), Yu et al (2018), and Yu et al (2019).
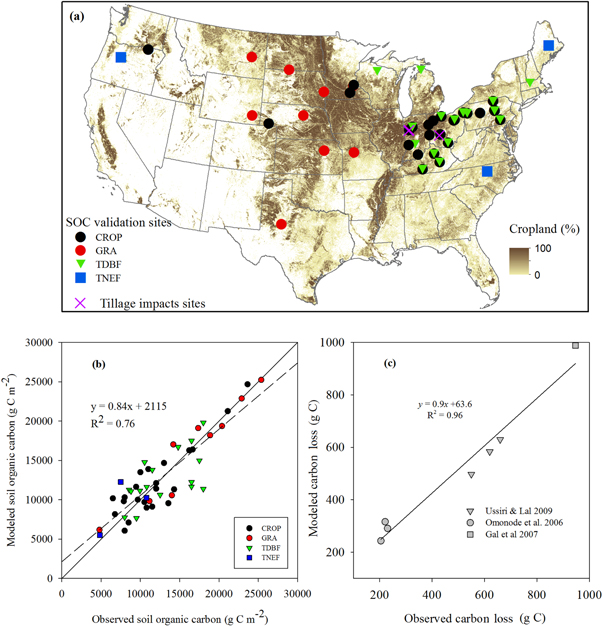
Figure 1. Comparison of model estimates and observations (site locations shown in figure 1(a)) of soil organic carbon content (b) in the US and tillage-induced C loss (c) from three studies. (CROP: crop; GRA: grassland; TDBF: temperate deciduous broadleaf forest; TNEF: temperate needle-leaf forest; dash line is the regression of observed data and modeled results, and solid line is the 1:1 line; the modeled tillage impacts are validated at three sites in figure 1(c), among which Ussiri et al 2009 and Omonode et al 2007 measured CO2 emission from different tillage intensities, and Gal et al 2007 displayed SOC change under conservation and/or conventional tillage comparing with no-till).
Download figure:
Standard image High-resolution imageThe calibrated and validated model was first run to equilibrium state with input drivers being set to the 1850 level or the earliest available year to obtain the initial status of C, N, and water pools for each biome in each grid-cell. The earliest climate data are from 1900, and we use 30 year (1901–1930) average to characterize climate condition before 1900 in the equilibrium run. Equilibrium state is achieved when the variations of net fluxes are less than 1 g C m−2 yr−1 for C, 1 g N m−2 yr−1 for N, and 1 mm m−2 yr−1 for water within a 20 year simulation cycle (Yu et al 2018). Before implementing transient runs using initial state information from the equilibrium run, we applied a 10 year spin-up run using climate data randomly selected between 1900 and 1930 to avoid sudden changes that can result from mode transition.
We then set up simulation experiments (as shown in table 2) to distinguish and quantify the effects of tillage practices and tillage-intensity-change (TIC) on SOC changes. More specifically, the first simulation experiment (S1) was designed to produce our 'best estimate' of C stocks and their changes in the US, which was driven by historically varying tillage intensity and other input drivers (e.g. climate, N deposition, atmospheric CO2, land conversion and crop rotation, crop technology improvement, fertilizer use, manure application, irrigation, and tile drainage). The second simulation experiment (S2) was a 'business as usual (BAU)-1998' reference case designed to keep intensity of conservation and conventional tillage 'fixed' since 1998 (we keep areas under these two tillage types unchanged, assuming that new cropland adopted no-till practice). The impacts of TIC on C storage during the period 1998–2007 are distinguished by comparing S1 with S2 (figure 2). Similarly, the third simulation experiment (S3) was designed to hold the two tillage intensities 'fixed' since 2008, which served as the 'BAU-2008' reference. By comparing S1 and S3, we can identify the impact of TIC on C storage during the 2008–2016 period (figure 2). Based on the above experiments, we estimated how TIC has affected C storage in the US. Moreover, we set up a fourth simulation experiment (S4), which assumed that the no-till practice was adopted in all croplands since 1998, and the fifth simulation experiment (S5) assuming that all conventional tillage land has been shifted to conservation tillage since 1998. Comparison of experiments S1 and S4 provides us with historical tillage impacts on cropland SOC (figure 2), while comparison of S1 and S5 implies potential SOC change of adopting conservation tillage in the US corn-soybean cropping system.
Table 2. Experiments designed in this study.
| Period of drivers used | |||
|---|---|---|---|
| Experimentsa | Abbr | Tillage | Othersb |
| Historical varying tillage | S1 | 1998–2016 | Varying |
| Business as usual (BAU)-1998 | S2 | 1998 | Varying |
| BAU-2008 | S3 | 1998–2008 | Varying |
| No till since 1998 | S4 | NAc | Varying |
| Shift conventional till to conservation till since 1998 | S5 | 1998–2016d | Varying |
aFor uncertainty analysis, more experiments for each of the S1–S3 and S4–S5 case were also performed but are not listed here. bOthers includes climate data (e.g. air temperature, precipitation, and radiation from 1900 to 2016), land use change (1850 to 2016), agricultural N input (i.e. N fertilizer from 1900 to 2016 and manure use from 1982 to 2016), and atmospheric conditions (i.e. CO2 from 1900 to 2016, N deposition from 1860 to 2016). cTillage intensity for 1998 was applied to the period before 1998, while no-till was adopted since 1998. dTillage intensity for 1998 was applied to the period before 1998, while conventional till was converted to conservation till since 1998.
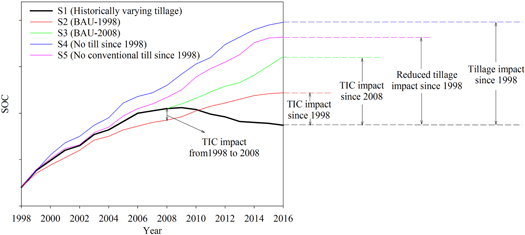
Figure 2. Conceptual diagram to demonstrate how we quantify impacts of tillage and its change on soil carbon storage (TIC: tillage-intensity-change; BAU: business as usual; S4 represents simulation with till been turned off since 1998; S5 represents simulation with reducing tillage intensity by switching conventional tillage to conservation tillage.) in this study.
Download figure:
Standard image High-resolution image2.4. Uncertainty analysis
Additional simulation experiments were designed to account for uncertainties of the TIC-induced C storage change. Three major uncertainty sources were quantified. The first uncertainty source is from the parameters used in LUCC-induced soil C and N loss in continuous cropland expansion area. Following Yu et al (2018, 2019), conversion-specific parameter values were adopted to describe instantaneous C loss during cropland expansion into different ecosystem types. Parameter-induced uncertainty from C storage change was derived from multiple simulation experiments using parameter values for average C/N loss percentage ±1 standard deviation. The second uncertainty comes from the harvest-related residual removal rate used in model simulations. The 'best estimate' simulation we performed adopted a coefficient of 0.5 for residue removal which was obtained from Allmaras et al (2000) and Perlack et al (2011) assuming that 50% of the residue was removed from cropland. The residue removal rate determines how much C is left on ground after crop harvesting, which is directly related to soil C storage change. This roughly estimated coefficient may vary by location and crop type, and may affect soil C accumulation/loss. We then adopted 40% and 60% residue removal coefficients as alternatives to the 50% coefficient when implementing our uncertainty analysis. The third uncertainty is from the timing of tillage implementation. Generally, fall tillage may be adopted before spring tillage in part of the US cropping areas (USDA Natural Resources Conservation Service and University of Wisconsin—Extension 2019). Due to the lack of timing information, we designed two types of experiments to quantify the impacts of with- and without-fall tillage practice. According to published research, fall tillage dates vary but generally occur within a month after harvest and spring tillage generally occurs between March to May around planting (Al-Kaisi and Yin 2010, Reicosky and Lindstrom 1993, Renner et al 1998, Vetsch and Randall 2004). In this study, fall tillage was implemented two weeks after harvest and spring-tillage was implemented at the beginning of planting. We used simulations from spring-tillage as our 'best-estimate', while the experiments with corn-soybean land tilled twice annually (i.e. fall and spring tillage) represent more intensive soil disturbance scenarios.
3. Results
3.1. Historical tillage intensity change in the US
Corn and soybean areas increased by 18.9% and 15.6% in the US from 1998 to 2016, leading to a total area expansion of 10.8 Mha for the two crops during the period (figure 3). Based on the survey data and spatial maps, we found that the area of no-till increased by 71.6% from 1998 (16.9 Mha) to its peak year at 2008 (28.9 Mha), in which corn and soybean contributed 5.2 and 6.8 Mha, respectively. The total area under conservation tillage dropped by 5.6 Mha from 1998 to 2006 with corn and soybean contributing to 56.9% and 43.1% of the decrease, respectively. The lowest area of conventional tillage was recorded in 2008 with the decline mainly from soybean (−2.9 Mha reduction, figure 3(c)), while corn area under conventional tillage did not show a consistent trend during the period before 2008 (figure 3(a)).

Figure 3. Changes in corn (left panel) and soybean (right panel) areas under different tillage intensities derived from survey data and cropland maps from 1998 to 2016. (Figures 3(a) and (c) indicate changes in corn and soybean areas under different tillage types since 1998; figures 3(b) and (d) show annual areas of corn and soybean under different tillage types since 1998.)
Download figure:
Standard image High-resolution imageNo-till land in corn and soybean declined by 2.6 Mha from 2008 to 2016, of which 2.4 Mha was from soybean planting area. In comparison, conservation and conventional tillage showed increasing trends in corn land from 2006 and in soybean land from 2007 (figure 3). More specifically, corn acreage under conservation and conventional tillage increased by 2.7 and 2.5 Mha from 2006 to 2016 (figure 3(a)). Soybean acreage under conservation and conventional tillage increased by 2.8 and 4.7 Mha from 2007 to 2016 (figure 3(c)).
Spatial analysis revealed that cropland under the no-till practice increased from 1998 to 2008 in the US with Eastern Nebraska as a hot spot for no-till increase (figure 4(a)). In contrast, conservation and conventional tillage have decreased in most other cropland areas during this period (figures 4(c) and (e)). Declines in conservation and conventional tillage were mainly found in the region where no-till practice increased, such as the Nebraska, Wisconsin, and South Carolina (figures 3(a), 4(c), and (e)).
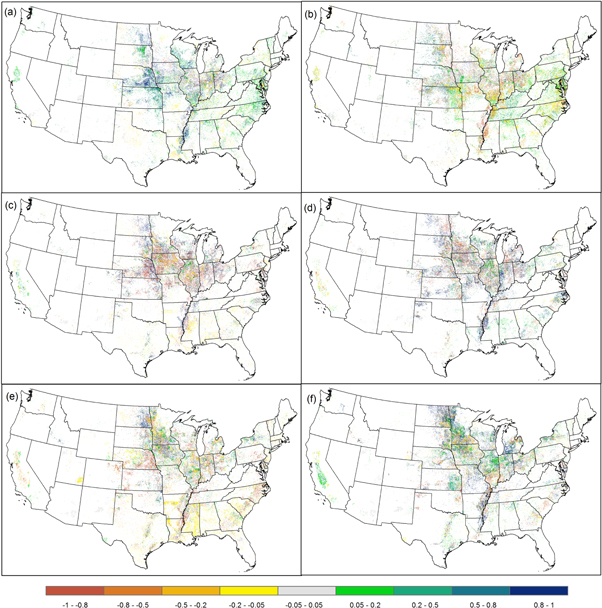
Figure 4. Changes in cropland area under different tillage intensities in US corn-soybean rotation land from (a), (c), (e) 1998 to 2008 and (b), (d), (f) 2008 to 2016. (Upper, central, and lower panels represent cropland area changes in no-till, conservation till, and conventional till, respectively.)
Download figure:
Standard image High-resolution imageFor the 2008–2016 period, however, tillage trends were reversed in most of the regions when compared with the earlier period. For example, the no-till practice declined in the mid- and Lower-Mississippi River Basin, and especially the Mississippi Alluvial Plain, during the period (figure 4(b)). Mixed trends of tillage intensity were found in the US with 12.1% and 9.0% of the cropped area showing increased and decreased conservation tillage (figure 4(d)), respectively. By contrast with 1998–2008 period, conventional tillage was found to have generally increased from 2008 to 2016, and especially so in California, Kansas, Northern North Dakota, Illinois and Minnesota (figure 4(f)).
3.2. Tillage impacts on carbon storage in the US
The best-estimate simulation (S1) showed that tillage-induced soil C loss was 10.3 ± 1.9 Tg C yr−1 (mean ± std, standard deviation derived from multiple uncertainty experiments) in the US during the entire 1998–2016 period (figure 5, table 3). However, interannual variations are evident. The tillage-induced SOC loss decreased from 14.7 Tg C yr−1 in 1998 to 7.1 Tg C yr−1 in 2008 then increased to 10.3 Tg C yr−1 in 2016. Approximate 88% of the tillage-induced SOC reduction was attributed to gaseous loss, while the remaining 12% (1.25 Tg C yr−1, table 3) was due to hydrological processes and was dominated by water erosion (>99%) (figure 5).

Figure 5. Historical tillage impacts on SOC reduction via gaseous and hydrological losses in the US corn and soybean croplands from 1998 to 2016.
Download figure:
Standard image High-resolution imageTable 3. Tillage impacts on soil carbon storage change via gaseous and hydrological loss in the US corn-soybean cropland.
| SOC lossa | Gaseous-C loss | Hydrological-C loss | ||||
|---|---|---|---|---|---|---|
| Period | ΔCtillb (Tg C yr−1) | ΔCtill-changec (Tg C yr−1) | ΔCtill (Tg C yr−1) | ΔCtill-change (Tg C yr−1) | ΔCtill (Tg C yr−1) | ΔCtill-change (Tg C yr−1) |
| 1998–2008 | 10.7 ± 2.1 | −1.0 ± 0.16 | 9.6 ± 2.0 | −0.87 ± 0.17 | 1.1 ± 0.3 | −0.13 ± 0.009 |
| 2008–2016 | 9.9 ± 1.6 | 2.4 ± 0.17 | 8.5 ± 1.9 | 2.1 ± 0.17 | 1.4 ± 0.3 | 0.31 ± 0.016 |
| 1998–2016 | 10.3 ± 1.9 | 0.50 ± 0.16 | 9.1 ± 2.0 | 0.43 ± 0.16 | 1.25 ± 0.3 | 0.076 ± 0.003 |
aPositive value indicates C loss, negative value indicates C accumulation. bΔCtill indicates carbon flux change due to tillage in corresponding period derived from experiments S1 and S4. cΔCtill-change indicates carbon flux change contributed from tillage-intensity-change (derived from experiments S1, S2 and S3), in which positive/negative value indicates C loss/accumulation; std represents standard deviation from multiple uncertainty experiments; The model estimated tillage impacts of 1998–2016 are not equal to the sum of impacts from 1998–2008 and 2008–2016 because these two experiments have different initial condition, as indicated by figure 2.
In comparison to the tillage impacts (difference between experiments S1 and S4), the TIC-induced SOC loss (differences between experiments S1, S2 and S3) was relatively small at 0.50 ± 0.16 Tg C yr−1 during this period (table 3). Indicated by our model estimates, TIC led to a SOC accumulation of 1.0 Tg C yr−1 during the 1998–2008 period, while it caused a SOC loss of 2.4 Tg C yr−1 during the period of 2008 to 2016 (table 3). We partitioned TIC-induced SOC loss into two pathways and found that gaseous- and hydrological-C losses contributed to approximate 85% and 15% of the loss for the study period, respectively (table 3). However, although the TIC-induced hydrological-C loss was relatively small, contrasting impacts of reduced (−0.13 Tg C yr−1) and enhanced (0.31 Tg C yr−1) hydrological loss were also found in the periods of 1998 to 2008 and 2008 to 2016, respectively (table 3).
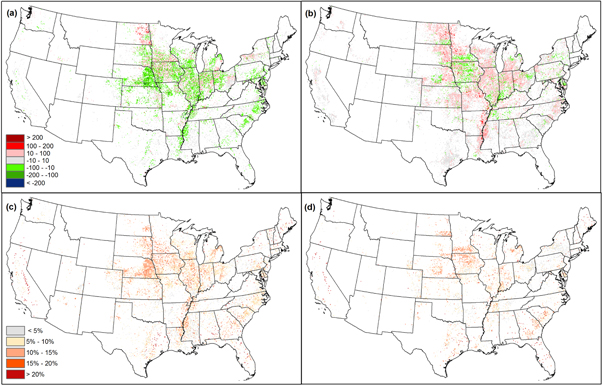
For the period of 1998 to 2008, TIC-induced soil C accumulation were detected in most cropland areas, especially in Nebraska, Illinois and Alabama (figure 6(a)). In contrast, during the period of 2008 to 2016, TIC-induced soil C loss was found in most of the Corn-belt region, except for the central Iowa and the south of Minnesota (figure 6(b)). Total soil C change during the periods 1998–2008 and 2008–2016 were −10.0 Tg (C accumulation) and 19.2 Tg (C loss), respectively. The estimate range of TIC-induced soil C change, represented by standard deviation of all uncertainty-related simulation experiments (described in section 2.4) divided by the multi-simulation average, were about 5%–15% for the study area (figures 6(c) and (d)). Nonetheless, it should be noted that uncertainties may also come from under-represented various soil C responses to tillage along depth, and the lack of tillage information before 1998.
Figure 6. Tillage-intensity-change-induced soil carbon stock changes (g C m−2) in the US corn-soybean cropping system during (a) 1998 to 2008 and (b) 2008 to 2016 estimated by the DLEM. positive value indicates C loss, negative value indicates C gain; figures 6(c) and (d) indicate the estimation uncertainties represented by the ratio of modeled standard deviation to the average for the two periods.
Download figure:
Standard image High-resolution image
4. Discussion
4.1. TIC in the US
People learned from the catastrophe of Dust Bowl that management practices are required to replace excessive tillage (Baumhardt 2003). Reduced tillage intensity practices, such as conversions from conventional tillage to conservation tillage and no-till have been advocated for the purpose of environmental protection (Lal 2015). Boosted by technology development and elevated fuel prices, conservation and no-till farming almost tripled between the 1980s and 1996 (Reagan 2012, Uri 1998). Such reduced tillage intensity in the US has been reported in various studies (Banerjee et al 2010, Fawcett and Towery 2003, Uri 1998). More recently, reduced tillage intensity has been reported to arise primarily from an increase in no-till cropland—from 15.7 Mha in 1994 to 25.3 Mha in 2004 (Conservation Technology Information Center 2018, Banerjee et al 2010), which can be partly attributed to encouragement from government subsidy and other protection programs (Huggins and Reganold 2008). Consistent with the above, we found an increase of no-till land in corn-soybean rotation system by 71.6% from 1998 (16.9 Mha) to its peak year at 2008 (28.9 Mha). Besides, technology improvements, such as no-till machines and herbicide-resistant crops are essential drivers of reduced tillage intensity in the US. For example, USDA survey data revealed that the acreage percent of herbicide-tolerant corn and soybean rose from less than 17% in 1997 to over 90% in 2018 (Perry et al 2016, USDA ERS 2018).
Nevertheless, we found that trend toward lower tillage intensity has reversed in the most recent decade. No-till land in corn and soybean declined by 2.6 Mha from 2008 to 2016, while conservation tillage increased by 5.5 Mha from 2006 to 2016 and conventional tillage increased by 7.2 Mha from 2007 to 2016, respectively. Such a tillage intensity reversal from reducing to increasing coincides with a reversal in Conservation Reserve Program (CRP) land area, from increasing to decreasing. The US CRP land expanded by 2.7 Mha from 1998 to 2007, but dropped by 5.2 Mha from 2007 to 2016 (USDA, Farm Service Agency 2019). Since the corn-soybean cropping system is a primary use of exited CRP land and plowing (conventional tillage) CRP land is an effective approach to kill grasses and weeds which allows crop to be planted in the first year of conversion, we surmise that the rise of intensive tillage area may greatly contributed from CRP land released since 2007. However, it should be noted that the potential linkage between CRP land change and tillage intensity may not be dominant, and needs to be further explored. For example, wheat was also one of the most common first crop to be planted after conversion from CRP land to cropland (Lark et al 2015).
The other possible explanation for rising tillage intensity after 2008 is due to increasing resistance of weeds to herbicides (Cerdeira and Duke 2006, Perry et al 2016). The number of weed species resistant to glyphosate has increased rapidly since 2001 in the US (van Deynze et al 2018, Price et al 2011, Wechsler et al 2018). This increased weed resistance may have compelled farmers return to plowing over the most recent decade. Although more evidence is required to identify the dominant driver, the undisputed rising tillage intensity for the last decade in US corn-soybean cropping system implies an urgent need to assess its environmental impacts, including the changes in biodiversity, water pollution, GHG emission, and soil erosion.
4.2. Tillage and US carbon storage
Previous studies have reported varied magnitudes of SOC change induced by tillage practices in different regions. By simply extrapolating from randomly selected sites to the entire US Corn-belt, Lee et al (1993) projected a soil C loss at 1.0–3.2 Tg C yr−1 under various tillage intensity scenarios for the next century. Similarly, Bernacchi et al (2005) extrapolated from a single site measurement to the entire US corn-soybean agricultural system and estimated that no-till sequestered 2.2 Tg C yr−1 and conventional tillage released 9.4 Tg C yr−1. However, such simplified estimations may be largely biased in upscaling. It should be noted that none of these studies quantified the spatially TIC-induced SOC changes or attributed them to different SOC loss ways as we did in this study. The results reported in this study indicate the SOC difference between the scenarios of historical tillage and fixed-intensity tillage (assuming new cropland adopting no-till practice). We found that, although the increasing adoption of the no-till practice in the 1998–2008 period enhanced soil C storage by 10.0 Tg (1.0 Tg C yr−1), the SOC accumulation was totally offset by the rising tillage intensity during the 2008–2016 period, leading to a net loss of 9.0 Tg (0.50 Tg C yr−1) soil C for the entire 1998–2016 study period.
By comparing with the size of C accumulated in other protection programs, we found that the escalated plowing in the recent decade increased C loss by 2.4 Tg C yr−1, which offset 31% of SOC annually sequestered in CRP land (7.78 Tg C yr−1, calculated from CRP land area in 2009 and the SOC accumulation rate of 57.0 g C m−2 yr−1 reported by Piñeiro et al 2009), or 45% of the C annually sequestered in the US protected lands (5.4 Tg C yr−1 sequestered in public and private lands under some level of conservation, Lu et al 2018b). By considering both spring and fall tillage, the simulated net loss of soil C could be even larger at 11.5 Tg (0.64 Tg C yr−1) during the entire study period.
The C lost from soil is only partially released to the atmosphere as GHG (e.g. CO2, CH4). A fraction of C was transported from a site through hydrological processes (i.e. leaching and water erosion) and deposited at another site, or in streams, rivers, and ocean sediment, where it could remain sequestered indefinitely (Lee et al 1993). The water erosion-associated C loss was 21.7 Tg C yr−1 in the US in 1990, as reported in Van Oost et al (2007), which is slightly higher than 17.3 ± 0.60 Tg C yr−1 during the 1998–2016 period as estimated in this study (standard deviation derived from historical tillage change experiments with different uncertainty sources). This difference is reasonable as the former study covers both the US and Canada croplands. We also found that reduction of hydrological-C loss contributed to 13.0% of the soil C increase for the 1998–2008 period, while the hydrological-C loss was accelerated by increasing tillage intensity and contributed to 12.9% TIC-induced soil C loss for the 2008–2016 period.
Aside from the accelerated C loss from soil, CO2 emission from use of tillage machinery is boosted. Fossil fuel consumption from conventional tillage and conservation tillage increased CO2 emission by 4.9 g C m−2 and 2.2 g C m−2 in corn land and 1.7 g C m−2 and 4.4 g C m−2 in soybean land when comparing with the no-till practice (West and Marland 2002). Simply extrapolated to the entire US, adopting reduced tillage from 1998 to 2008 reduced CO2 emission by 0.24 Tg C from machinery energy use, which is 2.4% of the magnitude of TIC-induced SOC accumulation or 18% of the TIC-induced hydrological-C loss reduction. Nevertheless, increased tillage intensity for the later 2008–2016 period enhanced fossil fuel CO2 emission by 0.36 Tg C, which amounts to 8% of the TIC-induced SOC loss and 12% of the hydrological-C loss.
Limitations in this study should be addressed in future studies. The major limitation was from the data available for analysis. Potential biased in model estimation can be reduced if tillage information before 1998 and tillage data of other crop types were available. In addition, uncertainties may come from under-represented tillage responses of soil C in different depth. Like many other terrestrial ecosystem models, DLEM has multiple C compartments in the soil to represent C substrates with different decomposability and responses to environmental drivers, but these C pools have no depth-related feature in model. Improvements can be achieved by stratifying soil C pools into different layers to better capture tillage impacts on soil profiles according to tillage type used. More discussions regarding uncertainties can be found in the supplementary file.
4.3. Trading benefits between tillage types
Benefits from adoption of no-till practices have been elaborated in many previous studies (Van Oost et al 2007, Six 2013, Ussiri et al 2009). Although unrealistic, we estimated that converting all cropland from conservation and conventional tillage to no-till (difference between experiments S1 and S4 in table 2) could potentially accumulat SOC by 10.3 Tg C yr−1 (if historical till practices were implemented in spring only) to 15.2 Tg C yr−1 (historical till implemented in both spring and fall) during the 1998–2016 period (table 3). There are several reasons preventing the change from conventional tillage to conservation tillage. First, the no-till practice often leads to heavier use of herbicides and pesticides, rendering environmental concerns and negative effects on investments and products (Plumer 2013). Second, reduced tillage increases soil wetness, which retards soil warming up in spring, leading to a potentially shorter growing season and therefore lower crop yield (Soane et al 2012, Turmel et al 2015). Due to higher water retention, farmers using no-till practice have to wait until the field dries naturally before planting can be implemented, while traditional conventional tillage dries out field quickly and therefore enables earlier planting opportunity (Reagan 2012).
Conservation till, by leaving at least 30% residue cover on surface after planting, provides compromised environmental and economic benefits when comparing with no-till and conventional tillage. For example, it reduces soil erosion and compaction, increases soil organic matter, and improve wildlife habitat (e.g. crop residue provides food and shelter) (Afzalinia and Zabihi 2014, Allen and Vandever 2012). We found that, by shifting all the conventional tillage area to conservation tillage, a SOC accumulation potential of between 8.7 and 13.2 Tg C yr−1 can be achieved for the 1998–2016 period (the range indicating an estimated spread between the spring-till only scenario and that in which both spring and fall tillage occur; difference between experiments S1 and S5 in table 2). Besides, conservation till also reduces fuel consumption and maintains or even enhances crop yield (Busari et al 2015, Farooq et al 2011, Mileusnić et al 2009). For environmental benefit, we expect expansion of no-till and conservation tillage will be the dominant trend in US cropland. Nevertheless, the drivers of recent increasing tillage intensity should be explored and identified to project future tillage trends, perform accurate assessments, and promote reduced tillage intensity practices while not harming crop production.
Acknowledgments
This work was supported by the Startup Foundation for Introducing Talent of NUIST, the new faculty start-up fund from Iowa State University, the Michigan State University's Elton R Smith Endowment for the promotion of academic programs in Food and Agricultural Policy, and an NSF project (#1903772).
Data availability
The tillage maps used in this study were developed from a proprietary national survey conducted annually by Kynetec Group. The purchase agreement requires that the data remain confidential. The data that support the findings of this study are available from: https://doi.org/10.25412/iop.9956750.v1