

Abstract
Future changes in climate and socioeconomic systems will drive both the availability and use of water resources, leading to evolutions in scarcity. The contributions of both systems can be quantified individually to understand the impacts around the world, but also combined to explore how the coevolution of energy-water-land systems affects not only the driver behind water scarcity changes, but how human and climate systems interact in tandem to alter water scarcity. Here we investigate the relative contributions of climate and socioeconomic systems on water scarcity under the Shared Socioeconomic Pathways-Representative Concentration Pathways framework. While human systems dominate changes in water scarcity independent of socioeconomic or climate future, the sign of these changes depend particularly on the socioeconomic scenario. Under specific socioeconomic futures, human-driven water scarcity reductions occur in up to 44% of the global land area by the end of the century.
Export citation and abstract BibTeX RIS

Original content from this work may be used under the terms of the Creative Commons Attribution 3.0 licence. Any further distribution of this work must maintain attribution to the author(s) and the title of the work, journal citation and DOI.
1. Introduction
Available water resources are withdrawn around the world to meet societal demands. As socioeconomic and climatic conditions change into the future, both the availability and withdrawal of freshwater are expected to have resultant changes, leading to shifts in current water scarcity levels (Vörösmarty et al 2000). The Food and Agriculture Organization of the United Nations (FAO) notes water scarcity as one of the greatest challenges of our time and combatting future increases through adaptation is one of the keys for sustainable development (FAO 2017). In order to understand and ameliorate future water scarcity, it is important to know how socioeconomic and climate systems act to change water scarcity.
Climate change is expected to cause precipitation shifts across regions and therefore alter regional water availability, while increases in evapotranspiration and reductions in soil moisture will lead to an increased demand for irrigation water, particularly in arid regions (Arnell 1999, Döll 2002, Diaz et al 2007, Fischer et al 2007, Kang et al 2009, Wada et al 2013). Future climate mitigation scenarios decrease the potential magnitude of climate change and its impacts (Hanasaki et al 2013, Wada et al 2013, Arnell and Lloyd-Hughes 2014, Blanc et al 2014), though mitigation pathways using increased demand for bioenergy could increase water demands (Hejazi et al 2015, Yamagata et al 2018).
Socioeconomic systems affect freshwater demands through population and economic growth by (1) increasing the number of people who require water, (2) affecting the affordability of reliable access to water and, (3) the ability to invest in and adopt technological improvements to increase water sector efficiencies. The adoption of higher efficiency technologies has been shown to decrease global water demands (Graham et al 2018).
Although climate and socioeconomic systems affect water resources simultaneously, the individual contributions of these systems, and how they will change into the future is relatively unknown at global scales. Previous studies have generally attributed future changes in water scarcity to population changes, economic growth, and resultant demand increases more so than to climate system impacts (Vörösmarty et al 2000, Arnell 2004, Alcamo et al 2007, Hanasaki et al 2013, Arnell and Lloyd-Hughes 2014, Schewe et al 2014, Schlosser et al 2014, Shen et al 2014, Wada et al 2014, Kiguchi et al 2015). Studies have also quantified the relative impacts of socioeconomic and climate changes and how they contribute to water scarcity at global and regional scales (Wada et al 2011, Haddeland et al 2014, Schewe et al 2014, Veldkamp et al 2015). Recent combinations of changing socioeconomic conditions and climatic change have brought to light the importance of the coevolution of human and climate systems on water scarcity estimates at sub-regional scales (Fant et al 2016, Veldkamp et al 2016). Despite recent advances, water scarcity attribution assessments often lack the representation of alternative sources of freshwater, constraints on water resources, alternative demand scenarios, and feedback linkages between hydrological and socioeconomic systems (Veldkamp et al 2017).
This study aims to address this research gap by using GCAM to attribute the simultaneous relative contributions of both human and climate systems on water scarcity changes (section 2.2, supplementary material). By using GCAM, this analysis can capture feedbacks between energy, land, and the human system that have previously lacked in several water scarcity studies. This analysis enables the use of a wide range of socioeconomic and climate futures that are placed under constraints to sources of freshwater, including nonrenewable groundwater, surface runoff, and desalinated seawater (Kim et al 2016, Graham et al 2018, Turner et al 2019). The use of models that link energy, water, land, and climate in water scarcity assessments allows for the explicit representation of how climate-induced changes in water availability alter energy and land systems. Previous water scarcity attribution studies have been unable to include cross sectoral feedback loops, constrained water resources, and various combined socioeconomic and climatic futures in a single study. Therefore, the results here are a novel analysis of how, with limited availability of water resources, humans and climate may drive future water scarcity. Future spatial and temporal representations of human and climate system contributions to water scarcity changes are provided through 2100 while considering the price response-induced feedbacks between the human, energy, and land systems.
2. Methodology
2.1. Scenario description
This analysis makes deterministic classifications of how, when water resources are limited and constrained, the human and climate systems interact. The relative effects of both systems on water scarcity are quantified at global and basin scales across 15 global futures that include five different socioeconomic conditions (the Shared Socioeconomic Pathways, SSPs) and four different climatic conditions (the Representative Concentration Pathways, RCPs). These 15 scenarios are used to first analyze a 'Human Alone' component by isolating the human impact on future scarcity. This is accomplished by holding all climate variables to their 2005 levels while altering socioeconomic growth and technological change. General circulation model (GCM) derived climate impacts for five models (supplementary material) are applied (section 2.4) to establish 75 'Human and Climate' scenarios which allows for the quantification of climate impacts (figure 1). Climatic impacts to water supply, agricultural productivity and change, hydropower availability, and building energy demands are applied from 5 different bias-corrected GCMs to make a suite of 75 climate runs. By subtracting the human derived impacts from the 'Human Alone' scenarios, from the 'Human and Climate' scenarios the climate impact is isolated (equation (2c)). First, the drivers of future water scarcity are evaluated by isolating the impacts that both humans and climate have while accounting for feedbacks between humans, energy, and land. Secondly, the simultaneous impacts that human and climate systems have on water scarcity are analyzed by determining whether each system is increasing or decreasing scarcity in all global water basins. Below we describe the GCAM model, the scenario components, climate derived impacts, and the calculations of scarcity changes and attribution.
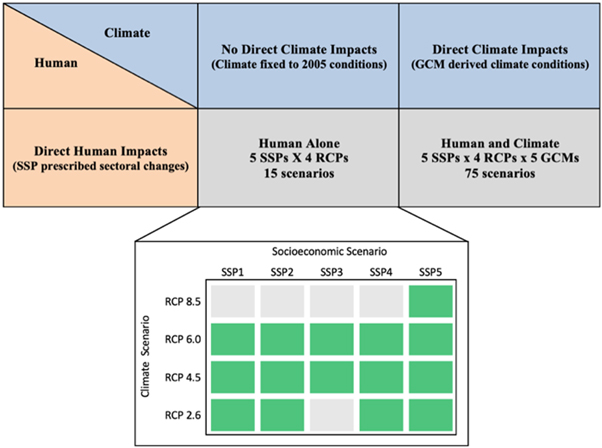
Figure 1. Scenario breakdown of 90 total scenarios. SSP-RCP scenario matrix depicting the set of 15 scenarios (green shading) in which a plausible solution exists in GCAM. In addition, a breakdown of the human and climate impacts for which GCM outputs from a suite of 5 CMIP5 climate datasets are implemented.
Download figure:
Standard image High-resolution image2.2. GCAM
This study uses the global change assessment model (GCAM), with inclusions of water constraints to both renewable and nonrenewable sources of water, to investigate the relative contributions of climate and human systems on water scarcity regionally and globally under a wide range of scenarios. GCAM links socioeconomics, the energy system, land-use change, climate, and the water sector. GCAM is a market-equilibrium model that allows for prices to be adjusted within each time step to ensure that the supply and demand of goods and services remains equilibrated at each time step allowing for simultaneous market clearing across sectors. This study accounts for a limited supply of water by employing cost resource curves across all 235 basins that follow a logit formulation to determine the share of each water source (renewable surface water, nonrenewable groundwater, and desalinated water) needed to meet the water demands within all basins (Kim et al 2016, Turner et al 2019, supplementary material). As depletion of various water sources increases the extraction price increases, which leads to compounding price increases on the goods and services that require higher-priced water sources.
2.3. Socioeconomic and climate futures
This study employs the use of temporally varying socioeconomics and climate systems. These systems are represented by the Shared Socioeconomic Pathways (SSP), for socioeconomic change, in combination with the Representative Concentration Pathways (RCPs), for climatic change. The SSPs are a set of five future scenarios with varying changes to global population, the economy (Riahi et al 2017), and land use (Popp et al 2017), which were designed to explore varying degrees of challenges to climate change adaptation and mitigation (O'Neill et al 2017). These scenarios have been defined, both qualitatively and quantitatively, using a set of global integrated human-Earth systems models, in which individual models have been used to produce a marker scenario (Riahi et al 2017) for singular SSPs (Calvin et al 2017, Fricko et al 2017, Fujimori et al 2017, Kriegler et al 2017, Van Vuuren et al 2017) and provide uncertainty ranges across all other SSPs. These results provide alternative projections of the evolution of the economy, energy systems, land systems, emissions, and climate. Within GCAM, quantitative assumptions of the SSPs have been made for the economy, energy sector, land use, agricultural sector (Calvin et al 2017), and for the water sector (Graham et al 2018). The RCPs are a set of four future greenhouse gas (GHG) emission pathways in which end-of-century radiative forcing approaches four-levels by altering future greenhouse gas emissions and by changing underlying socioeconomic projections (van Vuuren et al 2011).
The SSPs and RCPs are combined to form a set of future global change scenarios which allows comprehensive socioeconomic assumptions to be matched with future radiative forcing pathways to achieve future global warming targets; creating the next set of scenarios that will provide the basis for future Intergovernmental Panel on Climate Change (IPCC) assessments (Eyring et al 2016, O'Neill et al 2016). Each is then matched with their individual Shared Policy Assumptions (SPAs) in order to account for differences in adaptation and mitigation strategies across the SSPs (Kriegler et al 2014, Calvin et al 2017). These combinations create a set of 15 potential global futures which are varied six times, for five GCMs and one set in which climate impacts across all sectors are neglected to produce 90 total scenarios.
2.4. Derived climate impacts
This study accounts for four different climatic impacts: water supply, agricultural productivity, hydropower capacity changes, and building energy demands derived from five general circulation models (GCMs). We calculate the impact on each aspect at four different radiative forcing levels and apply these to the appropriate scenarios within the SSP-RCP scenario matrix. Future water supply is calculated by using bias-corrected precipitation and temperature data derived for four RCPs from five CMIP5 generation GCMs as part of the Inter-Sectoral Impact Model Intercomparison Project [ISI-MIP; Warszawski et al 2014]. These values are entered into the global hydrologic model Xanthos (Li et al 2017, Liu et al 2018, Vernon et al 2019, supplementary material), which calculates accessible water, i.e. available surface runoff and groundwater recharge, at the GCAM 235-basin scale at five-year time steps. Climate derived impacts to crop yield changes (Rosenzweig et al 2014), hydropower capacity changes (Turner et al 2017), and building energy demands (Clarke et al 2018) are calculated from the same set of ISI-MIP models and the climate varying impacts are added to their respective RCP scenarios. By including scenarios that both include and exclude climate impacts we can account for the compounding effects of changing hydrologic conditions, hydropower availability, crop yields, and energy demands on water scarcity, while also separating the impact of human activities from that of the climate system, which include changing water demands for agriculture, power generation, industry, and public supply.
2.5. Water scarcity and relative impact calculations
Water scarcity analyses can contain several different aspects of water use. For the purpose of this study, we will consider the water scarcity index (WSI), noted below as S, by comparing the amount of total water withdrawals, Wd from all sources (renewable surface runoff, nonrenewable groundwater extraction, and desalination) to the total GCM derived accessible surface runoff, Q, shown in equation (1), the scarcity is calculated in time period t, basin b, and SSP-RCP-GCM scenario s

The impacts from human and climate systems must be isolated in order to quantify the relative impact of each system on water scarcity changes. To calculate the impact from the human system, the change in scarcity from the baseline year of 2005 (supplementary figure S1 is available online at stacks.iop.org/ERL/15/014007/mmedia), is calculated for the 'Human Alone' scenario, SH, equation (2a). The impact from the climate system must then be isolated from the 'Human and Climate' scenarios by subtracting the scarcity found in the 'Human Alone' from the scarcity found in the 'Human and Climate' scenarios, equation (2b), in equation (2c). The 'Human and Climate' scenarios likely contain changes to the human system, such as human responses to changing climate, that are not captured by subtracting the 'Human Alone', however these changes are assumed to be a result of the climate impacts and therefore are classified as such in this study


In order to calculate the impact that humans and climate have on water scarcity equations S1 and S2 from Veldkamp et al (2015) are modified and shown as equations (3a) and (3b) below


IH, (human impact) and IC, (climate impact) represent the relative impact on water scarcity due to human or climate influences brought upon by the change in water scarcity from 2005 values (supplementary figures S2–5). In order to find the main driver of water scarcity we compare the two impacts as in equations (4b) and (4c)


The sign of human and climate impacts allows for the classification of increasing or decreasing scarcity.
The water supply and demand calculations, including the implications of climate impacts, are performed for each SSP-RCP scenario to quantify how water scarcity changes. Each of these scenarios will have differences in their human and climate impacts as each SSP-RCP combination will address the climate future differently. In GCAM, the energy, water, and land system for each SSP scenario will evolve differently dependent upon the socioeconomic development and technical change (Calvin et al 2017). Absent any efforts to limit radiative forcing, each SSP will reach a different end of century radiative forcing. Additionally, each SSP-RCP combination will have different means of approaching the same RCP (e.g. a different combination of economic, energy, land, and, water system changes), all of which are included here as human impacts. The introduction of climate impacts (i.e. water supply changes, agricultural productivity changes, hydropower availability, and building energy demands) further alters the evolution of the energy, water, land system for SSP-RCP scenario. Thus, each of the 90 scenarios are inherently different and can respond to climate change differently.
3. Results
Assessing the relative contribution of socioeconomic and climatic systems on the evolution of water scarcity allows for a deterministic classification of the main driver behind changes in scarcity. Water scarcity changes in extremely wet regions and regions with minimal demands are likely to observe minimal changes in WSI. To account for this, the lowest quartile of ΔWSI values are determined to be negligible in each scenario. Basins with negligible scarcity changes are left unclassified and are referred to as 'Negligible' throughout the remainder of this study.
3.1. Main drivers of water scarcity changes
Across all scenarios it is found that a majority of the basins that have negligible changes in water scarcity are located in the Northern Hemisphere high latitudes, Amazonian Rainforest, and parts of Australia, regardless of time period or scenario (figure 2(b), supplementary figures S7–8). In the areas which have a defined change in water scarcity, 80% of the land area experience water scarcity changes dominated by humans by 2100 (red shading and supplementary figure S2). This is true for SSP1, SSP2, and SSP4. Whereas in SSP3, extremely high population growth results in 92% of land area which has water scarcity changes driven by humans, and SSP5, where only 71% is driven by humans due to the contributions from reaching RCP8.5 conditions (supplementary figures S9–10).

Figure 2. Spatial and temporal representation of the main driver of future water scarcity changes. (a) Temporal changes in the percentage of land area in which the main drivers of water scarcity changes are attributed to humans (H) or climate (C) and whether the changes increase (+) or decrease (−) water scarcity. Each scenario is aggregated into individual SSP scenarios and values are calculated from the total nonnegligible ΔWSI land area and total number of scenarios in each aggregation. The 'All' scenario represents the total of all land area in the suite of SSP-RCP-GCM scenarios. (b) Main driver of water scarcity changes due to climate (green) or humans (red) in 2050 (left) and 2100 (right). Robustness of results shown as the degree of shading in which there is greater than (darker) or less than (lighter) 95% agreement across all 75 SSP-RCP GCM scenarios. Basins which observed negligible, 'Negligible', water scarcity changes are shaded as such if at least 95% of the scenarios agree for that particular basin, all basins with less confidence are shaded according to their main driver in the nonnegligible scenarios.
Download figure:
Standard image High-resolution imageThroughout the century, the area experiencing human driven water scarcity changes typically increases up to the year 2100. Human-dominated, water scarcity increases (H+) occur in 60% of the globe while 22% experiences decreasing scarcity due to humans (H−). Significant differences arise across SSPs as socioeconomic differences drive efficiency improvements, demand changes, and altered water dependency (Calvin et al 2017, Graham et al 2018). SSP1 experiences a shift from H+ to H− in a large amount of land throughout the century, leading to just 36% of the globe classified as H+ in 2100, while humans act to decrease water scarcity in 44%. While not as extreme, similar shifts from H+ and H− occur in SSP4 and SSP5, whereas in SSP2 and SSP3 more than 75% of the globe is H+. Although differences exist across each SSP scenario, the three scenarios that shift from H+ to H− experience global or regional GDP growth that allows for the adoption of efficient water use technologies. Additional storyline features such as sustainability focus, fuel preference, and universal adoption rates also influence cross-SSP differences.
Figure 2(b) shows a spatial representation of water scarcity drivers across the average of all future scenarios. Although socioeconomic scenario assumptions diverge in the second half of the century, the main driver remains humans in most basins. The robustness of the results decreases, and uncertainty increases by 2100 (supplementary figure S9), consistent with figure 2(a). Basins in sub-Saharan Africa have significant agreement across scenarios of human driven scarcity changes in both 2050 and 2100 riven by population growth increases throughout the century.
3.2. Co-evolution of human and climate impacts
Although the previous section focused on the dominant driver of water scarcity, the impacts brought upon by the secondary driver must be accounted for. These impacts provide either compounding, where both systems change scarcity by the same sign, or counteracting, where human and climate systems have opposing signs, effects on water scarcity enhancement. To account for this, figure 3 introduces four distinct water scarcity change categories to define how human (H) and climate (C) systems individually, yet simultaneously, increase (+) or decrease (−) water scarcity within a basin.

Figure 3. Spatial and temporal representation of future water scarcity categories. (a) Temporal changes in the percentage of land area in which the simultaneous impact of human and climate systems on water scarcity changes are shown by component and sign of change. Each scenario is aggregated into individual SSP scenarios and values are calculated from the total nonnegligible ΔWSI land area and total number of scenarios in each aggregation. The 'All' scenario represents the total of all land area in the suite of SSP-RCP-GCM scenarios. (b) Water scarcity category in 2050 (left) and 2100 (right). Notation shown as (+) representing either human (H) or climate (C) increasing water scarcity and (−) decreasing water scarcity. (ex. H+ C+ humans and climate both act to increase water scarcity in given basin). Robustness of results shown as the degree of shading in whichthere is greater than (darker) or less than (lighter) 95% agreement across all 75 SSP-RCP-GCM scenarios. Basins which observed negligible water scarcity changes are shaded as such if at least 95% of the scenarios agree for that particular basin, all basins with less confidence are shaded according to their scarcity category in the nonnegligible scenarios.
Download figure:
Standard image High-resolution imageExpanding on the notion of differing signs of change and considering the simultaneous impacts of human and climate systems on future water scarcity figure 3(a) shows the combination across all scenarios. When considering all scenarios (figure 3(a), left), 45% of nonnegligible land shows a compounding effect (green and red) by the end of the century, whereas 55% of the globe has counteracting effects (orange and blue). An increasing dependence on socioeconomic future arises throughout the century as SSP1 produces compounding effects in 52% of the globe. This comes about due to a significant increase in H–C– basins and a shift away from H+ C– conditions in parts of Africa and Eurasia (areas of decreasing robustness in figure 3(b), and supplementary figure S11). SSP2 on the other hand has only 39% of the globe with compounding impacts driven by 59% of global basins falling into the H+C– category (supplementary figure S12).
Figure 3(b) represents how water scarcity changes are dependent upon geographic location, as distinct areas of H− and H+ arise while much of the world experiences climate induced scarcity decreases (C–, green and orange). Areas of the Mediterranean and West Asia are shown to have water scarcity increases due to climate by 2050 (figure 3(b), supplementary figures S2–5), in line with previous studies (Haddeland et al 2014, Schewe et al 2014), however these results diverge by 2100. Meanwhile, much of the midwestern United States is shown to have human driven scarcity decreases in 2050 and 2100, unlike what has been shown in some previous studies (Haddeland et al 2014, Schlosser et al 2014). Prescribed SSP-specific improvements in water use technologies (Graham et al 2018), are likely to cause human-driven water scarcity decreases, particularly in regions where population is not expected to change dramatically in the future (Samir and Lutz 2017) while GDP growth is expected to allow for water use improvements across many SSPs (Calvin et al 2017). Nearly all of Africa experiences counteracting water scarcity effects as population driven increases in demand lead to increases in scarcity, while climate-driven increases in precipitation increase water supply and thus lower scarcity (supplementary figure S11). As in figure 2(b), the robustness of the classification is again shown to decrease by the end of the century (right). This is due to differences in efficiency and the sustainability focus of the socioeconomic scenarios driving the evolution of water scarcity categories, particularly in central Eurasia and Africa where population change projections and GDP vary by SSP (Calvin et al 2017, Graham et al 2018). Areas of negligible changes remain the same as in figure 2(b), by definition.
3.3. Relative impacts across the SSP-RCP suite
Results thus far have focused on differences across SSPs while aggregating all climate futures, but it is important to distinguish between impacts at multiple radiative forcing levels. The end of century distribution of human and climate impacts in a basin by scenario are displayed in figure 4(b) where the size of each point represents the WSI of its basin in 2100. Applying equations (3a) and (3b), the human and climate impacts will fall on the drawn diamond. However, as each SSP-RCP scenario is made up of five different GCM runs, the robustness of the relative contributions towards water scarcity changes of both human and climate for each basin can be captured. As points move towards the center of the diamond, impacts in individual basins become increasingly uncertain across GCMs.

Figure 4. Human and climate impact quantifications across the 15 SSP-RCP scenarios in 2100. (a)–(c) Numerical quantification of the relative human (IH, x-axis) and climate (IC, y-axis) impacts on water scarcity in 2100 across each of GCAM's 235 water basins. SSP-RCP combinations shown with no plots represent scenarios unattainable either through mitigation (i.e. SSP3-RCP2.6) or baseline assumptions fail to reach 2100 forcing levels (i.e. SSP1-4-RCP8.5). (a) Probability distribution function of the human impact across each SSP scenario including the aggregates of all RCP combinations. (b) Numerical representation of the 5 GCM mean human and climate relative impact across each basin (points). The WSI of each basin in 2100 is shown as the size of points. As GCM uncertainty increases, points move inwards from the mathematical limits of equations (3a) and (3b). (c) Probability distribution function of the climate impact across each RCP scenario including the aggregates of all SSP combinations.
Download figure:
Standard image High-resolution image
The distribution of human impacts is shown in figure 4(a) with clear bimodal patterns across all SSPs. The peaks of all distributions fall where (−0.5 > IH > 0.5), where IH is the human impact, justifying the notion that humans are having a larger impact than climate on water scarcity in most basins globally independent of socioeconomic scenario. However, the distribution of these impacts varies greatly by SSP (supplementary figure S10). Specifically, SSP1 is largely negatively favored (decreasing scarcity), whereas SSP2 and SSP3 lean significantly more positive. The spreads for SSP4 and SSP5 are much closer to a uniform bimodal distribution with close to equal numbers of basins with positive and negative human impacts.
The distribution of climate impacts is shown in figure 4(c) across each of the RCP radiative forcing levels. Independent of radiative forcing future, the relative impact of climate is slightly negative, shown as the peak frequency is below the zero line in each distribution. The magnitude of this impact provides additional evidence for the relatively low impact of climate compared to humans across all SSP-RCP scenarios. The spread of climate impacts decreases as the end of century radiative forcing target decreases, leading to the conclusion that at lower radiative forcing futures, climate systems are likely to have smaller impacts on scarcity than humans in an increasing number of basins. The opposite result occurs in the RCP8.5 scenario as the distribution is more uniform across climate impacts, which emphasizes the important notion that at higher radiative forcings, water scarcity will likely be more susceptible to climate impacts. As RCP8.5 is currently only attainable under the SSP5 scenario, additional research is needed to understand how different socioeconomic conditions alter future water scarcity at high radiative forcing levels.
4. Discussion
We have expanded upon previous estimates of water scarcity drivers by quantifying how the coevolution of a dynamic socioeconomic system and changing climate system may alter water scarcity into the future. This has been done by using evolving and differing socioeconomic assumptions that account for changes across all sectors (Calvin et al 2017, Graham et al 2018), in combination with considerations for climate impacts to water availability, hydropower expansion (Turner et al 2017), agricultural productivity changes (Rosenzweig et al 2014), and building energy expenditures (Clarke et al 2018). The use of these socioeconomic and climate assumptions in GCAM allow for feedback linkages between these systems, enabling price adjustments and resultant demand changes across sectors when supplies become increasingly depleted.
While in line with previous estimates of the influence of human systems on water scarcity (Vörösmarty et al 2000, Arnell 2004, Alcamo et al 2007, Hanasaki et al 2013, Arnell and Lloyd-Hughes 2014, Schewe et al 2014, Schlosser et al 2014, Shen et al 2014, Wada et al 2014, Haddeland et al 2014, Kiguchi et al 2015, Veldkamp et al 2015, Veldkamp et al 2016), this study has also quantified the relative impacts across a wide range of potential futures and included combined variations to both the socioeconomic (SSP scenario assumptions) and climate (RCPs and GCM derived impacts) systems which have previously been unexplored. In addition, we have included the ability to not only withdraw, but constrain, local runoff and alternative (groundwater and desalination) water sources (Kim et al 2016, Graham et al 2018, Turner et al 2019).
Our results have shown that human activities drive water scarcity changes through 2100 across 80% of the land that observed nonnegligible changes in water scarcity, and that these impacts may be increasing or decreasing dependent upon socioeconomic scenario and geographic location (figures 2(a) and 4(a) and (b)). For example, throughout the century, SSP1 scenarios cause water scarcity to consistently move from H + to H − (figures 2(b) and 3(b)), showing that increases in efficient water technologies (Graham et al 2018), future GDP increases, and a focus on sustainability may help to alleviate some future water stresses particularly in Eurasia and the eastern United States (supplementary figure S1 and S3). The counteracting impacts of human and climate systems are shown to depend on each socioeconomic scenario, since increases in basin numbers with counteracting impacts occur in SSP2, SSP3, and SSP5, while a shift to H–C– decreases the counteracting impacts in SSP1.
We also find that when population growth continues at or exceeds present day values, GDP growth slows (Calvin et al 2017), and there exists an inability to invest in efficient futures (Graham et al 2018), increases in water demands lead to increases in human driven scarcity. The geographic location of water scarcity is also shown to have consistent locations, as the Amazon River basin and much of the Northern high latitudes experience negligible changes in WSI independent of future, while basins in the southwestern United States and much of Africa experience worsening water scarcity due to human activities, independent of socioeconomic or climate future (figures 2(b) and 3(b)).
The scenario matrix structure of this study has allowed for the investigation of only one set of socioeconomic futures involving an RCP8.5 climate future. The lack of additional futures involving RCP8.5 radiative forcing levels may have limited the amount of climate driven water scarcity changes in this study, however, the use of the SSP-RCP framework has shown that SSP5 is the only scenario in which 8.5 W m−2 conditions are plausible (Calvin et al 2017, Fricko et al 2017, Fujimori et al 2017, Kriegler et al 2017, Van Vuuren et al 2017). Additional plausible socioeconomic scenarios may be needed to fully understand water scarcity drivers in this type of analysis under high end-of-century radiative forcing levels.
5. Conclusions
This study quantified the relative impacts of both evolving human and climate systems on water scarcity. Future classifications of climate or human driven water scarcity changes would benefit from a distinct look into how the human components change between 'Human Alone' and 'Human and Climate' scenarios. Current analysis assumes that the human system in both sets of scenarios are comparable. However, human-driven adaptation measures needed to address climate impacts in the 'Human and Climate' scenarios may result in differing econometric responses and slightly different human systems. We have included climate derived impacts for four distinct areas, but our results do not fully represent the impacts that a changing climate might have on the suite of energy-water-land sectors and thus the impact for the climate system may not be fully complete in select basins or scenarios. In addition, water sector technological advances have been prescribed across each SSP at scenario-dependent rates, regardless of investment cost or cooperation (Graham et al 2018). This may result in overestimations of potential water savings in SSP1 and SSP5 and therefore the results presented in this study should be taken as an initial analysis of potential water scarcity changes.
This study highlights the basins in which water scarcity is projected to change as climate and human systems evolve dynamically to 2100, and in particular identifies basins in which human activities may counteract climate to outweigh potential decreases due in large part to population driven demand increases. Understanding why the human system causes this increase in scarcity may allow for water management applications to be implemented to decrease the impact of the human system to result in potential compounding reductions in water scarcity with the climate system. Specifically, basins which may be H+C− in one socioeconomic future, but H–C– in another provides the ability to understand the socioeconomic drivers in that particular basin which allow for human-induced reductions in water scarcity (ex. the Missouri River Basin in SSP2, compared to any other SSP scenario). While population growth may be a leading cause, economic investment in efficient technologies may also result in human driven reductions. Future studies that account for the direction of water scarcity impacts may provide an opportunity to analyze where and why human intervention may act to reduce future water stress and can in turn work together with the climate system to decrease water stress. This type of analysis can provide subregional to subnational scale analyses on the water scarcity driver synergies and tradeoffs of various SSP-RCP scenarios.
Acknowledgments
This research was supported by the US Department of Energy, Office of Science, as part of research in Multi-Sector Dynamics, Earth and Environmental System Modeling Program. The Pacific Northwest National Laboratory is operated for DOE by Battelle Memorial Institute under contract DE-AC05-76RL01830. This research was also supported by the National Science Foundation Innovations at the Nexus of Food, Energy, and Water Systems under Grant EAR-1639327. Additionally, NOAA Award No. NA14NES4320003 for the 'Cooperative Institute for Climate and Satellites'.
Data availability
The data and analysis code for the results presented in this paper are available upon request.
Funding sources
This research was supported by the US Department of Energy, Office of Science, as part of research in Multi-Sector Dynamics, Earth and Environmental System Modeling Program. The Pacific Northwest National Laboratory is operated for DOE by Battelle Memorial Institute under contract DE-AC05-76RL01830.
This research was also supported by the National Science Foundation Innovations at the Nexus of Food, Energy, and Water Systems under Grant EAR-1639327.
Additionally, NOAA Award No. NA14NES4320003 for the 'Cooperative Institute for Climate and Satellites'