

Abstract
Aiming at the common problems of magnesium ion concentration being higher than manganese ion concentration in the electrolytic manganese industry, the equilibrium distribution of Mg in manganese electrolysis system was studied. It mainly included four main steps: the rhodochrosite was leached under acidic conditions, the Fe2+ was removed by precipitation after MnO2 oxidation, the heavy metals ware removed by SDD. Finally, the manganese metal was produced in the cathode by electrolysis of manganese sulfate solution. The morphology and phase composition of magnesium in the whole system were obtained by SEM and XRD. Under leaching conditions for industrial production, the temperature was 85 °C, liquid-solid ratio was 8:1, the excess coefficient of acid was 1.3, and the reaction time was 3 h, leaching rate of Mg was 38.19%, and the corresponding concentration of Mg2+ was 2.96 g l−1 in the solution. The effect of Mg2+ concentration on manganese leaching rate was done, the result showed that the leaching rate of manganese decreased with the increasing of magnesium ion. When the Mg2+ was increased from 0% to 50%, the leaching rate of manganese decreased from 83.12% to 76.39%. At pH 5.5 and 85 °C, Fe2+ could be completely removed by using MnO2 as oxidant and 22.44% magnesium would be taken away with iron slag. The removing of heavy metals could be achieved under the condition of 60 ± 5 °C, SDD dosage 3‰ (according solution quantity) and 1 h, 0.4% magnesium would be taken away with heavy metal slag. The electrolysis experiments were carried out under the conditions, (NH4)2SO4 content was 100 g l−1, pH was 7.2, reaction temperature was 45 °C and current density was 350 A m−2. The results showed that 88.18% of magnesium was distributed in the anode solution and 11.4% in the cathode solution, and there was 0.08% and 0.34% of magnesium in the cathode manganese sheet and the anode slag, respectively.
Export citation and abstract BibTeX RIS
1. Introduction
In the smelting industry, manganese played an important role as an important raw material and additive [1, 2]. Rhodochrosite was widely used as raw material for producing manganese metal in China [3], the main advantage was that it could be directly acid leached and electrolyzed [4]. The process was mainly divided into: leaching of manganese ore, removing of iron from leaching solution, removing of heavy metals, and electrolyzation of manganese. In order to improve the current efficiency of electrolytic manganese, researchers had conducted extensive research on the above four processes in the past decade. The leaching conditions of manganese ore were obtained by leaching manganese ore under sulfuric acid system [5], Using MnO2 as oxidant to remove iron from the leaching solution, the reaction pH was about 5 [6], Heavy metals were removed by vulcanizing agent and the reaction pH was about 5.5 [7]. In this experiment, SDD was also one kind of vulcanizing agent, it was used to remove heavy metals, SDD was used as a high-molecular flocculant to neutralize surface charge and avoid dendritic crystals of electrolytic manganese products [8]. The pH of electrolytic manganese was about 7.2 [9].
During the leaching of manganese ore, the Mg-containing compound also reacted with sulfuric acid to form MgSO4, which was introduced into the leaching solution. In the process of metal manganese electrolysis, Mg2+ was not participated in the cathodic reaction, and it would continued to circulate along with the electrolytic anolyte and return leaching process [10, 11], the concentration of Mg2+ in the electrolyte solution reached about 20 g · l−1, the highest even reached to 38 g · l−1 [12, 13]. It would do a lot of harm. ①During the entire leaching transport, calcium-magnesium crystals may be precipitated in the leaching solution [14–16] and which would cause pipeline blockage. ②It would increase the viscosity of leaching solution, hinder the mass transfer rate of H+ through liquid phase to the surface of ore samples, make the ore sample could not be fully leached, and reduce the leaching rate of manganese. ③The mass transfer rate of ions in the electrolyte was reduced, which affected the current efficiency of manganese. ④In the process of electrolysis, a small amount of Mg2+ crystals would be attached to the metal manganese sheet, and would affect the quality of the product. ⑤In recent years, the biggest problem in production was that ammonium sulfate and magnesium sulfate form magnesium ammonium sulfate crystals in solution system. As far as Ningxia TianYuan manganese industry was concerned, every ton of metal manganese produced would produce half a ton of ammonium magnesium sulfate compound salt crystallization, its annual output was about 300 000 tons. The accumulated thickness in the high-level liquid tank was up to 1.5 m. Excavators were used to clean up the high-level liquid tank every day, as shown in figure 1. On one hand, manganese was precipitated by crystallization entrainment, caused the loss of manganese. On the other hand, the amount of crystallization was large and the comprehensive utilization was difficult. At present, the storage treatment was adopted, which seriously polluted the environment.
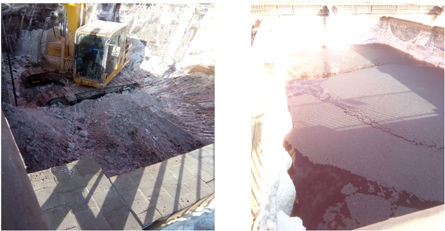
Figure 1. The scene picture of ammonium magnesium sulfate crystallization in high-level liquid tank.
Download figure:
Standard image High-resolution imageIn view of the hazards of Mg in manganese electrolysis system, researchers had done a lot of research, using different methods to remove magnesium [17–19]. However, the harm degree of magnesium in electrolytic manganese system was seldom studied systematically. In adition, in the process of manganese leaching and electrolysis, magnesium ions enter the system from ores continuously, but the concentration of magnesium ions were not increased indefinitely, the dynamic equilibrium was maintained when the concentration reached about 25∼30 g l−1 after examining many electrolytic manganese plants in China. This was consistent with the statement in the literature [20, 21] that when magnesium ions were enriched to a certain extent, the content of magnesium ions in the solution would no longer increased and reach equilibrium. Magnesium was not enriched in solution. Where did it go? It was worth studying.
So the harmfulness of magnesium and its equilibrium distribution in electrolytic manganese system deserved much attention. In this work, the equilibrium distribution of Mg in manganese electrolysis system was studied, the harmfulness of magnesium would be studied in next step. In this experiment, the leaching, purification and electrolysis conditions of the current electrolytic manganese process were adopted, then the slag and solution obtained in each step were analyzed, the existence form and the equilibrium distribution of Mg in the manganese electrolysis system were obtained. Among them, Mg was analyzed by EDTA titration method [22]. These experimental studies and explorations would have very important theoretical guidance for promoting the sustainable development of electrolytic manganese industry, and solving environmental pollution problems of (NH4)2SO4-MgSO4 crystallization in manganese industry commonality.
2. Experiment
2.1. Raw meterials
The rhodochrosite used in this study was from a local electrolytic manganese plant in Guizhou Province of China. The components were analyzed by inductive coupled plasma emission spectrometer (Thermo Scientific iCAP 6300, English,). The rhodochrosite contained more mineral elements, manganese content was about 16.98%, magnesium content was about 5.27%, It also contained a lot of impurities and heavy metals, the iron content was about 7.38%, potassium content was about 0.82%, sodium content was about 0.103%, calcium content was about 7.84% (table 1).
Table 1. Major chemical compositions of Rhombohedral (ω/10−4).
| Element | Percentage (ω/10−4) | Element | Percentage (ω/10−4) | Element | Percentage (ω/10−4) |
|---|---|---|---|---|---|
| Mn | 169 800 | In | 0.325 | Se | 0.0618 |
| Mg | 52 700 | K | 8163 | Sn | 0.003 |
| Ba | 125.5 | La | 18.32 | Si | 99 100 |
| Be | 0.123 | Li | 40.10 | Ta | 1.5248 |
| Ca | 78 420 | Ag | 5.99 | Te | 0.6388 |
| Cd | 4.463 | Al | 41 740 | Th | 0.603 |
| Ce | 1.193 | Mo | 14.842 | Ti | 3672 |
| Co | 91.00 | Na | 1030 | Tl | 0.0521 |
| Cr | 166.8 | Nb | 5.783 | V | 387.2 |
| Cu | 57.3 | Ni | 153.9 | W | 6.695 |
| Fe | 73 810 | P | 482.3 | Y | 13.25 |
| Ga | 4.25 | Pb | 36.17 | Yb | 6.832 |
| Ge | 0.6592 | Rb | 4.876 | Zn | 121.5 |
| Hf | 0.1453 | Sc | 5.483 | Zr | 69.41 |
The rhodochrosite was analyzed by x-ray diffractometer (XRD, D8 ADVANCE Germany). The rhodochrosite used in the experiment was manganese carbonate ore (MnCO3) (figure 2). In addition, the composition of the ore sample was more complex and contained other impurities, mainly including pyrite (FeS2), quartz (SiO2), in where the impurity magnesium content was relatively small, and its diffraction peak was relatively low, mainly in the form of magnesium carbonate (MgCO3).
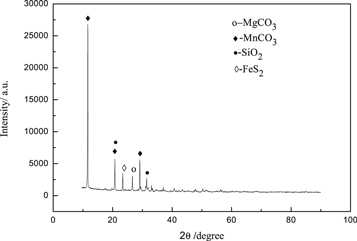
Figure 2. XRD patterns of rhodochrosite.
Download figure:
Standard image High-resolution imageThe microscopic morphology characteristics and energy spectrum of rhodochrosite were observed by scanning electron microscopy(SEM and EDS, SU8020 Japan). The SEM analysis result(figure 3) and the energy spectrum analysis result (figure 4 and table 2) were presented. It could be seen from figure 3(a) that when the magnification were 5000 times, the rhodochrosite had a slight agglomeration and the sample particle size was not very uniform. Continuing to be enlarged, as could be seen from (b), (c), (d), the surface of the rhodochrosite particles was relatively smooth, showing a lamellar layer, without the adhesion of fine particles. When it was leached under acidic solution, it facilitated the reaction. In addition, the peak value of Mg was relatively low in energy spectrum, because of Mg content was low in rhodochrosite, and the other impurities were Fe and Ca, the mass percent of Mg and Mn was 5.24% and 16.15% respectively, which was similar to the results of plasma emission spectrometry (table 1).
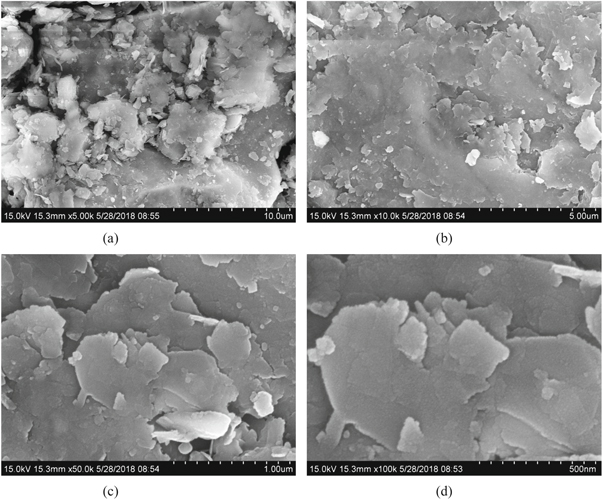
Figure 3. SEM of the rhodochrosite (a)10.0 μm scanning electron microscopy ; (b) 5.0 μm scanning electron microscopy; (c) 1.0 μm scanning electron microscopy ; (d) 500 nm scanning electron microscopy.
Download figure:
Standard image High-resolution image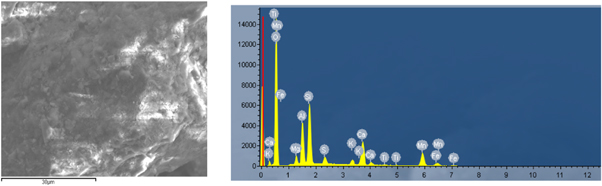
Figure 4. EDS analysis of rhodochrosite.
Download figure:
Standard image High-resolution imageTable 2. EDS analysis table of rhodochrosite.
| Element | Mg | O | Si | Mn | Ca | Fe | C | S |
|---|---|---|---|---|---|---|---|---|
| Wt% | 5.24 | 45.93 | 9.96 | 16.15 | 7.69 | 7.28 | 2.00 | 1.45 |
| At% | 5.56 | 48.92 | 7.34 | 17.29 | 3.69 | 6.52 | 3.45 | 0.93 |
2.2. Experimental process
2.2.1. Effect of Mg2+ on leaching rate of manganese
In the industrial production of electrolytic manganese, the optimum leaching conditions of rhodochrosite were as follows: the reaction temperature was 80∼85 °C, the reaction time was 3 h, the acid excess coefficient(Aec) was 1.3, and the liquid-solid ratio was 8:1 [23]. Under this leaching conditions, the rhodochrosite was leached by adding MgSO4 of different quality (the concentration of Mg2+ was 10 g l−1, 20 g l−1, 30 g l−1, 40 g l−1, 50 g l−1). The leaching rate of manganese was determined by analyzing manganese content of the slag, and the effect of magnesium ion concentration on the leaching rate of manganese was obtained.
2.2.2. Equilibrium distribution of Mg in leaching and electrolysis system.
The experimental flow chart was shown in figure 5 according to the experimental process.
- (1)Under the current industrial leaching conditions of rhodochrosite, 750 g rhodochrosite (in which the magnesium content was 39.525 g) was weighed for leaching in sulfuric acid solution, and the leaching solution (a) and the leaching slag (a) were obtained.
- (2)750 g rhodochrosite was weighed again and put into the mixture containing sulphuric acid and the leaching solution (a), and the leaching solution (b) and the leaching slag (b) were obtained by secondary leaching under the industrial leaching conditions of manganese.
- (3)The leaching solution (b) was heated to 90 °C, a certain amount of MnO2 was added to it and oxidated Fe2+, and the pH value was adjusted to about 5.0 with lime water, the aim was to remove the Fe, and the primary iron removal solution(c) and primary iron removal slag (c) were obtained.
- (4)The heavy metals were removed by adding SDD (mass fraction of 3‰) into the solution (c) at 60 °C, and stirring mechanically for 1 h. The solution (d) and heavy metal slag (d) were obtained by filtering after 24 h.
- (5)MgSO4, (NH4)2SO4, SeO2 were added into the primary purification solution (d) to prepare manganese sulfate electrolyte (Mg2+ concentration was 25 g l−1, (NH4)2SO4 concentration was 100 g l−1), the anodic solution (e), anodic slag (e), cathodic solution (e) and metal manganese were obtained by electrolysis for12 h.
- (6)750 g rhodochrosite was leached cyclically in the mixture of anodic solution (e) and sulfuric acid for cyclic leaching, and the leaching solution (f) and the leaching slag (f) were obtained.
- (7)In order to remove the Fe again, leaching solution (f) was heated to 90 °C, a certain amount of MnO2 was added to it and oxidated Fe2+, and the Ph value was adjusted to about 5.0 with lime water, secondary iron removal solution (g) and secondary iron removal slag (g) were obtain.
- (8)The secondary iron removal solution (g) was purified by SDD to obtain the secondary purification solution (h) and slag(h) for secondary removal of heavy metals.
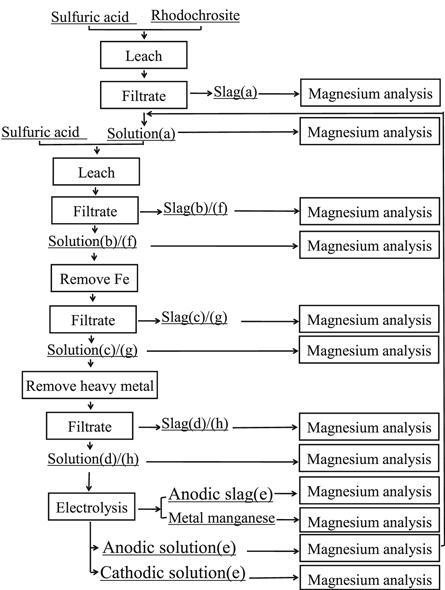
Figure 5. Flow chart of equilibrium distribution of Mg in manganese leaching-electrolysis system.
Download figure:
Standard image High-resolution image3. Results and discussion
3.1. Effect of Mg2+ concentration on leaching rate of manganese
The Mg2+ concentration had a great effect on the leaching rate of manganese(figure 6). When the Mg2+ concentration was 0 g l−1, the leaching rate of manganese was about 83.12%. With the increasing of Mg2+ concentration, the leaching rate of manganese in sulfuric acid system decreased gradually. When the concentration of Mg2+ was 50 g l−1, the leaching rate of manganese was 76.39%. This was because, with the increasing of Mg2+ concentration, the solution became viscous and the kinematic viscosity increased, which hindered the full contact between the ore sample and H+ and made the reaction unable to proceed fully. It was indicated that in the electrolytic manganese industry, due to the cyclic enrichment of Mg2+ in the solution, the leaching rate of manganese would be affected to some extent, as a result, the leaching rate of manganese decreased.
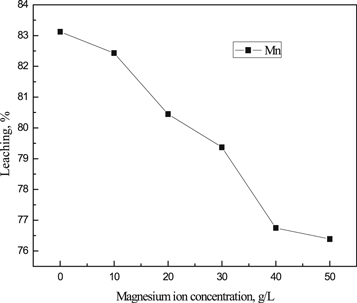
Figure 6. Effect of Magnesium ion concentration on leaching rate of Mn (85 °C, 3 h, L/S:8:1, Aec: 1.3).
Download figure:
Standard image High-resolution image3.2. Equilibrium distribution of Mg in manganese leaching and electrolysis process.
3.2.1. Primary leaching
750 g rhodochrosite (containing magnesium of 39.525 g) was leached under the current industrial leaching conditions to obtain the leaching solution (a) and the leaching slag (a). the distribution of magnesium was shown in table 3. The results showed that, the concentration of Mg2+ in manganese sulfate solution was about 2.96 g l−1, it was basically consistent with industrial production data (2∼3 g l−1), the leaching rate of Mg2+ was 38.19%.
Table 3. Equilibrium distribution of Mg in Primary leaching process.
| Leaching solution (a) 5.1 l | Leaching slag (a) | Leaching rate (%) | |
|---|---|---|---|
| Concentration(g l−1) | Quality (g) | Quality (g) | 38.19 |
| 2.96 | 15.096 | 24.426 | |
The obtained primary leaching slag(a) was analyzed by scanning electron microscopy and XRD analysis, the results were presented in figures 7 and 8. When the magnification was 10 000 times, it could be seen from the diagram (a1) that the micro-morphology of the leaching slag was irregular and there were obvious edges and corners. When the magnification was 50 000 times, it could be seen from figure (a2) that the surface of ore particles contacts with H+ sufficiently during the chemical reaction, which made the surface of leaching slag (a) smoother. It also could be seen from EDS energy spectrum that some Mg still existed in leaching slag (a) during sulfuric acid leaching of rhodochrosite. Figure 8 showed that Mg was existed in the form of Mg8(OH)4Si12O30 (H2O)12 in the leach slag (a) during leaching. At the same time, unreacted pyrite (FeS2) and quartz (SiO2) could be seen.

Figure 7. SEM and EDS spectra of primary leaching slag (a).
Download figure:
Standard image High-resolution image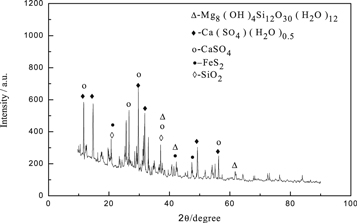
Figure 8. XRD pattern of primary leaching slag (a).
Download figure:
Standard image High-resolution image3.2.2. Secondary leaching
750 g rhodochrosite was weighed and added into the mixture containing sulphuric acid and the leaching solution (a), after reaction being over, the leaching solution (b) and leaching slag (b) were obtained. The distribution of magnesium was shown in table 4. As could be seen from table 4, the results showed that in the secondary circular leaching of rhodochrosite, 14.886 g of Mg was enriched in the manganese sulfate solution, and the Mg2+ concentration in the manganese sulfate solution was increased from 2.96 g l−1 to 5.379 g l−1, and the Mg in the leaching slag(b) was about 24.639 g, and the leaching rate of Mg was about 37.66% in the process.
Table 4. Equilibrium distribution of Mg in the Secondary cycle leaching process.
| Leaching solution(b)5.58 l | Leaching slag(b) | Leaching rate(%) | ||
|---|---|---|---|---|
| Concentration(g l−1) | Quality(g) | Accumulation(g) | Quality(g) | |
| 5.379 | 29.982 | 14.886 | 24.639 | 37.66 |
The obtained secondary leaching slag(b) was analyzed by scanning electron microscopy and XRD analysis, the results were presented in figure 9 and 10. During the secondary leaching process, the edges and corners on the surface of leaching slag(b) particles were slightly smooth and there was a slight agglomeration phenomenon. This was because leaching solution contains a small amount of Mn2+, Mg2+ and impurity ions, which hinders the contact between rhodochrosite and H+ during the leaching process, so that the samples could not be fully reacted. The existence of Mg could be clearly traced in EDS diagram of leaching slag (b). Because of the low content of Mg, the peak value of Mg in energy spectrum was lower. And it could be seen from figure 10 that Mg was existed as Si7.8Al1.72Fe0.2Mg0.28O20 in the leach slag (b).
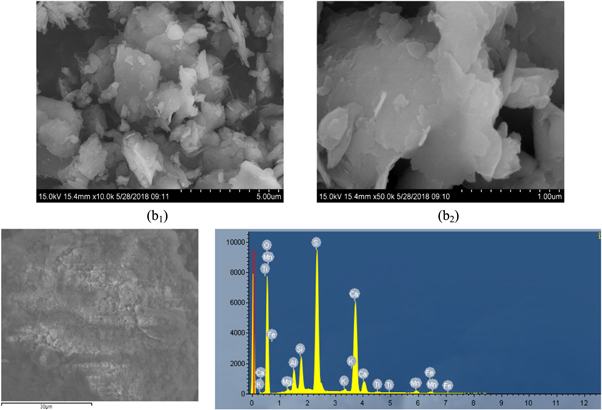
Figure 9. SEM and EDS spectra of secondary leach slag (b)
Download figure:
Standard image High-resolution image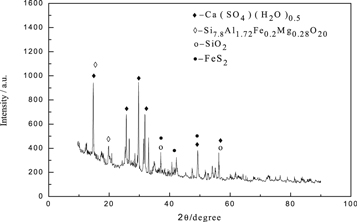
Figure 10. XRD pattern of secondary leach slag (b).
Download figure:
Standard image High-resolution image3.2.3. Removing iron for the first time
In order to remove iron, the leaching solution (b) was heated to 90 °C, a certain amount of MnO2 was added to it and oxidated Fe2+, and the pH value was adjusted to about 5.0 with lime water. The solution (c) after removing Fe and the iron bearing slag (c) were obtained by filtration. The distribution of magnesium was shown in table 5. The results showed that when using lime water to adjust the pH for removing iron, Mg in the solution was reduced from 29.982 g to 23.227 g, and the iron bearing slag contained Mg of about 22.45%. This was because Fe(OH)3 was an adsorbent colloid and it could adsorb a small amount of Mg, and the Mg would enter the iron bearing slag.
Table 5. Equilibrium distribution of Mg in the removing iron process.
| Solution(c) after removing iron 5.2 l | Iron bearing slag(c) | Magnesium removed from iron slag(%) | |
|---|---|---|---|
| Concentration(g l−1) | Quality(g) | Quality(g) | |
| 4.47 | 23.227 | 6.731 | 22.45 |
The obtained iron slag (c) was analyzed by scanning electron microscopy and XRD analysis, and the results were presented in figures 11 and 12. The results showed that, in the process of removing iron from the leaching slag (b), the microscopic morphology of the iron bearing slag(c) was columnar and hierarchical. This was because the colloid of Fe(OH)3 had a good adsorption effect and was capable of adsorbing impurity ions in the solution (b) [24]. From the EDS diagram of the iron bearing slag(c), it was known that a small amount of Mg was present in the iron bearing slag (c), indicating that a small amount of Mg could be carried off during the process of removing iron. It could be seen from figure 12 that Mg was existed as Fe87.9Mg0.08Mn0.04Al7.92S16O64 in the iron bearing slag (c).
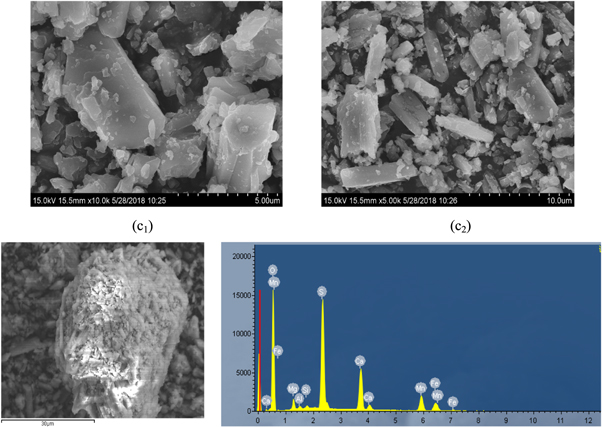
Figure 11. SEM and EDS spectra of iron removal slag (c).
Download figure:
Standard image High-resolution image
Figure 12. The XRD pattern of iron removal slag (c).
Download figure:
Standard image High-resolution image3.2.4. The process of using SDD to remove the heavy metal for the first time
SDD was added (add 3 kg of SDD per ton of manganese sulfide slurry) to the iron removal liquid (c) to remove the heavy metal, the temperature was at about 60 °C, and reaction time was 1 h. After standing for 24 h, filtration was done to obtain clean liquid (d) and heavy metal bearing slag (d), the distribution of magnesium was shown in table 6. The results showed that when the heavy metal was removed by SDD, the Mg in the iron removal liquid (c) was 23.227 g and that in liquid (d) was 23.1311 g, and the heavy metal residue (d) contains Mg which was about 0.009 24 g. In the process, The removal rate of Mg was approximately 0.4%. This was because in the process of removing heavy metals, a small amount of Mg forms a sulfide precipitate into the heavy metal residue (d).
Table 6. Equilibrium distribution of Mg in SDD for heavy metal removal.
| Primary purification solution(d) 5.2 l | Heavy metal removal slag | Magnesium removed from heavy metal slag(%) | |
|---|---|---|---|
| Concentration(g l−1) | Quality(g) | Quality(g) | |
| 4.45 | 23.134 | 0.0924 | 0.4 |
The obtained heavy metal slag (d) was subjected to scanning electron microscopy and XRD analysis, and the results were presented in figures 13 and 14. The results showed that in the process of removing heavy metals from the iron removal liquid (c) by using SDD, the obtained heavy metal slag was flocculated small particles and there was a slight agglomeration phenomenon, because SDD was an organic sodium salt, which formed a kind of corresponding polymer during the reaction, adhered to the heavy metal slag (d) [25]. It could be seen from the EDS diagram that although the peak energy spectrum of Mg was low, it could be said that a small amount of Mg was presented in the heavy metal slag (d), It could be seen from figure 14 that Mg was existed as Mg2Al5Si4O18 in the heavy metal slag (d).

Figure 13. SEM and EDS spectra of remove heavy metal slag (d).
Download figure:
Standard image High-resolution image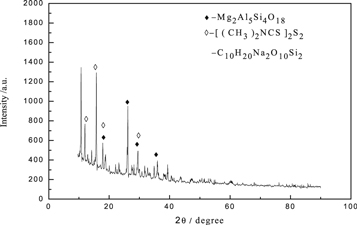
Figure 14. XRD pattern of remove heavy metal slag (d).
Download figure:
Standard image High-resolution image3.2.5. Electrolysis process
MgSO4, (NH4)2SO4 and SeO2 were added to the primary purification solution (d) in turn to prepare manganese sulfate electrolyte, the concentration of Mg2+ was 24.61 g l−1, the current density was 350 A m−2 and the concentration of (NH4)2SO4 was 100 g l−1. The anodic solution (e), anode slag (e), cathodic solution (e) and metal manganese were obtained by electrolysis under above conditions. The distribution of Mg was shown in table 7. The results showed that the concentration of Mg2+ in anode and cathode solution was closed to that of Mg2+ in electrolyte during the electrolysis process, and only a small amount of Mg enters into anode slag and metal manganese. The distribution of Mg in the metal manganese and anode slag was 0.08% and 0.34% respectively.
Table 7. Equilibrium distribution of Mg in electrolysis process.
| Anode solution (e) 4.015 l | Cathode solution(0.52 l) | Manganese | Anode slag(e) | ||
|---|---|---|---|---|---|
| Concentration(g l−1) | Quality(g) | Concentration(g l−1) | Quality(g) | Quality(g) | Quality(g) |
| 24.58 | 98.689 | 24.54 | 12.761 | 0.09 | 0.38 |
The obtained anode slag (e) was subjected to scanning electron microscopy and XRD analysis, and the results were presented in figures 15 and 16. The results showed that, the surface of the anode slag was smooth, with distinct layers and no extra impurities on the surface during electrolysis process. It could be seen from the EDS diagram that the main elements in the anode slag were manganese and oxygen. Since the magnesium content in the anode slag was about 0.08%, which was lower than the detection limit of the EDS instrument by 0.1 to 0.5%, the magnesium in the anode slag could not be detected. As could be seen from figure 16, the main phase in the anode slag was MnO2, and the main impurity phase was (NH4)Mn8O16, which was due to the presence of more (NH4)2SO4 in the electrolytic cell. A small amount of  enters the anode slag.
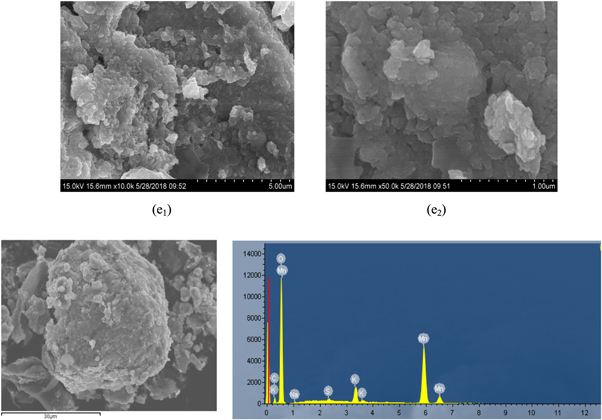
Figure 15. The SEM and EDS spectra of anode slag(e).
Download figure:
Standard image High-resolution image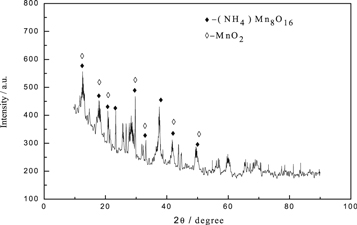
Figure 16. The XRD pattern of anode slag (e).
Download figure:
Standard image High-resolution image3.2.6. Anodic solution return to the cycle leaching process.
750 g of rhodochrosite and a certain amount of sulphuric acid were added to the anodic solution (e) for cyclic leaching, and the leaching solution (f) and the leaching slag (f) were obtained. The distribution of magnesium in the ore was shown in table 8. Under the optimum leaching conditions, the total amount of Mg2+ in the solution was 138.467 g. According to table 8, when rh odochrosite was leached in solution, the accumulation of Mg2+ was 14.886 g, the leaching rate was about 30.67%, which was lower than the original leaching rate.
Table 8. Equilibrium distribution of Mg in circulation leaching of anodic solution.
| Leaching solution(b)5.58 l | Leaching slag(b) | Leaching rate(%) | ||
|---|---|---|---|---|
| Concentration(g l−1) | Quality(g) | Accumulation(g) | Quality(g) | |
| 22.162 | 110.811 | 12.122 | 28.164 | 30.67 |
The obtained leaching residue (f) was subjected to scanning electron microscopy and XRD analysis, and the results were presented in figures 17 and 18. It could be seen that the surface of the leaching slag (f) was relatively smooth, the particles were large and the agglomeration phenomenon was more obvious. This was because the impurity ions in the leaching solution became large, so that the rhodochrosite could not be sufficiently reacted during the leaching process, and the leaching rate of manganese was lowered. It could be seen from the EDS spectrum , a small amount of magnesium entered the leaching slag (f). Figure 18 showed that Mg existed in the leaching residue (f) in the form of K3.52Na0.44Al11.36Fe0.24Mg0.08Si12.32O48.
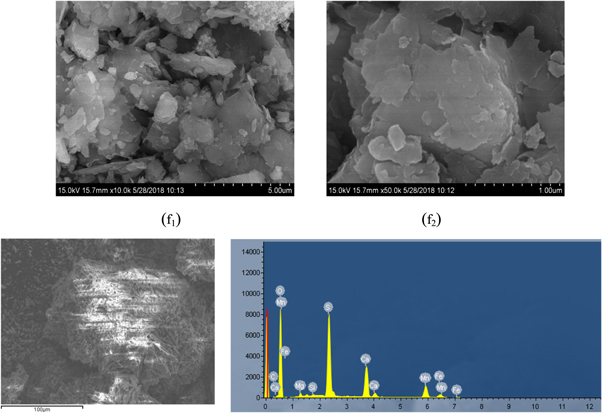
Figure 17. SEM and EDS spectra of leaching slag (f).
Download figure:
Standard image High-resolution image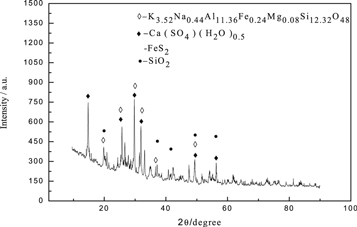
Figure 18. XRD pattern of leaching slag (f).
Download figure:
Standard image High-resolution image3.2.7. The process of removing iron for the second time
MnO2 was added to the leaching solution (f) for the secondary iron removing to obtain the solution (g) and the secondary iron removing slag (g), and the distribution of magnesium was shown in table 9. The results showed that the content of Mg in slag(g) was 23.65 g, and the removing rate of magnesium was about 21.49%. In the process of circulating leaching, the removing of iron would take away certain amount of magnesium, and the removal rate of Mg was about 21.97%.
Table 9. Equilibrium distribution of Mg in Secondary iron removal by MnO2.
| Secondary iron removal solution (g) 4.06 l | Secondary iron removal slag(g) | Magnesium removed from iron slag (%) | |
|---|---|---|---|
| Concentration(g l−1) | Quality(g) | Quality(g) | |
| 21.28 | 86.4 | 23.65 | 21.49 |
The obtained leaching slag (f) was subjected to scanning electron microscopy and XRD analysis, and the results were presented in figures 19 and 20. The results showed that in the process of secondary iron removing, the obtained iron slag (g) had a rod-like structure compared with the first iron removing, but the surface was rough, which was due to that, the impurity ions in the leaching tank were large, and it was adsorbed on the Fe(OH)3 colloid. At the same time, due to the increasing of  and Mg2+, more crystals were formed to adhere to the iron slag. It could be seen from the EDS diagram that although the peak of magnesium was low, the magnesium was also detected in the secondary iron removing slag (g). Figure 20 showed that Mg was existed as Mg3.72Mn0.28Al8S16O64Fe88 in the secondary iron removing slag (g).
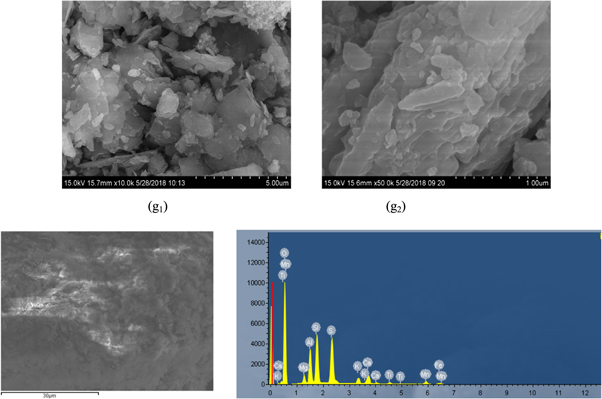
Figure 19. SEM and EDS secondary iron removal slag (g).
Download figure:
Standard image High-resolution image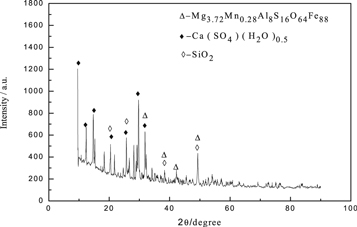
Figure 20. XRD pattern of secondary iron removal slag (g).
Download figure:
Standard image High-resolution image3.2.8. The process of using SDD to remove the heavy metal for the second time
The secondary iron removing solution(g) was purified by adding SDD to obtain the secondary purification solution (h) and the secondary heavy metal removing slag (h). The distribution of magnesium was shown in table 10. The results showed that in the process of secondary purification of heavy metals by adding SDD, the content of Mg in the heavy metal slag was 0.423 g, and the magnesium removing rate was about 0.5%. Compared with the primary process of removing heavy metals, the magnesium removing rate was not much different. Therefore, in the cyclic leaching and electrolysis process of manganese, the removing of heavy metals by adding SDD would take away a certain amount of magnesium, and the removing rate of Mg was about 0.45%.
Table 10. Equilibrium distribution of Mg in the second heavy metal removal of SDD.
| Secondary purification slution(h)4 l | secondary heavy metal removal slag(h) | Magnesium removed from heavy metal slag (%) | |
|---|---|---|---|
| Concentration(g l−1) | Quality(g) | Quality(g) | |
| 21.45 | 85.792 | 0.423 | 0.5 |
The obtained heavy metal slag (h) was subjected to scanning electron microscopy and XRD analysis, and the results were presented in figures 21 and 22. The results showed that in the process of secondary removing of heavy metals by adding SDD, the obtained heavy metal slag (h) was more agglomerated than that of the first heavy metal removing, and the flocculent particles were also significantly increased. With the continuous circulation leaching of the manganese sulfate solution, the impurity ions would be continuously enriched. Allowing to stand for a while after the reaction, the heavy metal sulfides in the filtrate would be further flocculated and settled, and some gelatinous substances would also be emerged. Supersaturated MgSO4, CaSO4 crystals were be taken away by absorption. It could be seen from the EDS diagram of the heavy metal slag (h) that, after the removing of iron, there was no energy spectrum peak of iron was detected, indicating that the removal effect of iron was better, but the energy peak of magnesium could be seen, indicating that a small amount of magnesium could be removed to enter the heavy metal slag (h) during the secondary removing of heavy metals, . It could be seen from figure 22 that Mg was existed as Mg2Al5Si4O18 in the heavy metal slag (h).
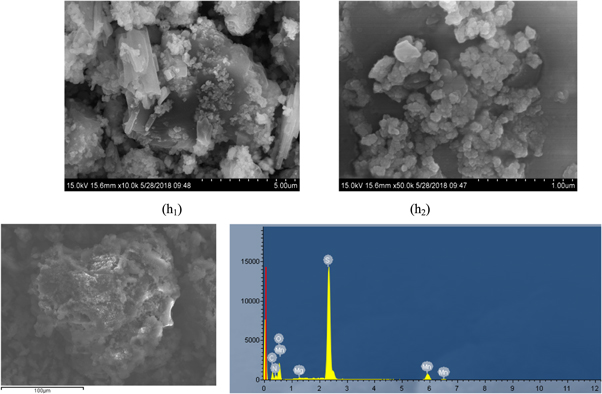
Figure 21. SEM and EDS secondary remove heavy metal slag (h).
Download figure:
Standard image High-resolution image
Figure 22. XRD pattern of secondary remove heavy metal slag (h).
Download figure:
Standard image High-resolution image3.2.9. The quilibrium distribution of Mg
Assuming that there was 100 g Mg in rhodochrosite, the equilibrium distribution of Mg in each process part during leaching and electrolysis cycle was shown in figure 23. In the process of cyclic iron removal and heavy metal removal, the average removal rates of magnesium were 22.4% and 0.4%.
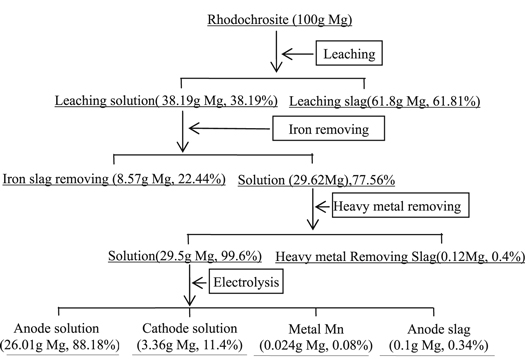
Figure 23. Quality distribution of Mg in manganese leaching-electrolysis system.
Download figure:
Standard image High-resolution image4. Theoretical analysis
4.1. Analysis of leaching kinetics of Mg
The whole leaching mainly went through the following processes: The external diffusion, the acidic leaching liquid diffused to the ore particles through the diffusion layer. The internal diffusion, the acidic leaching liquid further diffused to reach the solid film. The reaction, the acidic leaching liquid chemically reacted with the ore particles. The internal diffusion, the resulting product diffused through the solid membrane. It was out-diffused and the resulting product reaches the solution by diffusion [26, 27].
The reaction of mineral particles with sulfuric acid could be divided into the following two steps: (1) H2SO4 migrated to the reaction zone:
According to Fick's law, the acidic leaching solution diffused from the solution body to the surface of ore particles.


Where VD was the diffusion speed, D was the diffusion coefficient, CL was the concentration of central sulfuric acid in solution, Ci was concentration of sulfuric acid on the mineral surface, kD was the diffusion velocity constant, δ was the thickness of diffusion layer , R was the gas constant, T was the absolute temperature, μ was the viscosity of solution , d was the diameter of diffusion particle, N was the Avogadro constant, k was the kinetic reaction rate constant, V was the speed of agitation , n was the index(generally was 0.6) and Ek was the activation energy of reaction [28].
(2) The acid leaching solution reacted with the ore particles in the reaction zone:

Where VR was the chemical reaction rate, kR was the rate constant, Ci was the concentration of sulfuric acid on the mineral surface, and n was the reaction series [29].
According to the speed equations of the above two processes, the macroscopic speed of the leaching process under steady state could be obtained:


When kD ≪ kR, kD + kR ≈ kR, equation (8) could be simplified to:V = kD · CL. At this time, the leaching process was mainly controlled by chemical reaction.
When kR ≪ kD, kD + kR ≈ kD, equation (8) could be simplified to:V = kR · CL. At this time, the leaching process was mainly controlled by diffusion.
According to the above kinetic theory, the leaching rate of magnesium in ores was related to the sulfuric acid concentration, reaction temperature, solid-liquid ratio and reaction time.
4.2. Removing of iron
Hydrolysis of metal ions proceeded according to the following formula:

The OH− was derived from the dissociation of water:

When (11) subtracts (10), It was got:

The standard free enthalpy change of reaction (12) was:


At 25 °C,
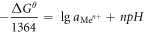


It could be seen from the formula (14) that when the pH of the aqueous medium was greater than pHθ,  was lesser than 1, and the metal ions were hydrolyzed and precipitated. Conversely, when the pH of the aqueous medium was less than pHθ,
  was greater than 1, and Me(OH)n was dissolved by acid [30]. In order to decide the hydrolyzed pH, the pHθ of the Me(OH)n generated at a temperature of 25 °Cand 90 °C was calculated in table 11 [31].
Table 11. Table 2.5 The pHθ of the Me(OH)n was generated at a temperature of 25 °Cand 90 °C.
| Me(OH)n + nH+ = Men+ + nH2O | Δ /J /J |
Δ /(J · mol−1/k−1) /(J · mol−1/k−1) |

|

|
|---|---|---|---|---|
| Fe(OH)3 + 3H+ = Fe3+ + 3H2O | −27 616 | −179.77 | 1.617 | 0.990 |
| Ga(OH)3 + 3H+ = Ga3+ + 3H2O | −32 029 | −222.46 | 1.870 | 1.120 |
| Al(OH)3 + 3H+ = Al3+ + 3H2O | −55 623 | 174.74 | 3.22 | 2.40 |
| Sn(OH)2 + 2H+ = Sn2+ + 2H2O | −63 912 | 18.54 | 0.75 | 0.717 |
| Mg(OH)2 + 2H+ = Mg2+ + 2H2O | −8563 | 144.81 | 13.9 | 12.95 |
| Cu(OH)2 + 2H+ = Cu2+ + 2H2O | −786 535 | −38.38 | 4.604 | 3.87 |
| Ni(OH)2 + 2H+ = Zn2+ + 2H2O | −69 536 | −99.07 | 6.09 | 4.96 |
| Pb(OH)2 + 2H+ = Fe2+ + 2H2O | −77 871 | −73.37 | 6.82 | 6.18 |
| Fe(OH)2 + 2H+ = Fe2+ + 2H2O | −75 799 | −53.03 | 6.65 | 5.6 |
| Cd(OH)2 + 2H+ = Cd2+ + 2H2O | −78 842 | −16.62 | 7.20 | 6.2 |
| Mn(OH)2 + 2H+ = Mn2+ + 2H2O | −87 405 | −32.10 | 7.655 | 6.55 |
From table 11, when the temperature was at 90 °C, the pHθ of Fe3+ was 0.99, that of Fe3+ was 5.6, that of Mn2+ was 6.55. When temperature was 90 °C, the pH value was 5.0, the precipitation of Fe2+ was incomplete, it must be oxidized to Fe3+, then be precipitated in the form of Fe(OH)3, and the Mn2+ would not be precipitated, so the Fe2+ and Fe3+ were removed from the solution, and the loss of Mn2+ was minimized. Meanwhile, a small amount of impurities such as Ga, Al, Sn, Cu and Ni could be removed in this process, due to the very low content of these elements in the ore, their phase had not been detected in the iron removal slag. The pHθ of Mg2+ was as high as 12.95, in theory, Mg(OH)2 would not be generated in this process, but Fe87.9Mg0.08Mn0.04Al7.92S16O64 and Fe88Mg3.72Mn0.28Al8S16O64 phases were detected in primary and secondary iron removal products, respectively. Maybe because of the high content of Mg(5.27%), Al(4.17%) and Fe(7.38%) in the ore, the precipitated Fe(OH)3 and Al(OH)3 had larger surface area and adsorbability, they could react with MgSO4 and MnSO4 in adsorptive chemistry. In addition, the atomic number of Mg and Al, Fe and Mn was close to each other, atomic exchange may occur between them, which led to the removal of 22.44% Mg in the iron removal process. This was a new discovery and needs to be redesigned for further study, which would bring new ideas for the new method of magnesium removal.
4.3. Removing of heavy metals
The vulcanization precipitation method was used to precipitate and separate heavy metals usually. It was done by adding a type of vulcanizing agent, sodium dimethyl dithiocarbamate (SDD), polysulfide, H2S, Na2S, etc, was based on the different solubility product of various sulfide products.
Ionization dissolution of sulfide in aqueous solution was carried out as follows:

Solubility product was:

The [S2−] in the solution was calculated by the following two stages (25 °C):

When  = 10.1 × 10⁴ Pa, (17) would be changed to:

Could be derived from equations (16) and (18):
For the monovalent metal sulfide Me2S, the equilibrium pH value is:

For the sulfide of bivalent metal MeS, the equilibrium pH value was:

For sulfide of trivalent metal Me2S3, the equilibrium pH value was:

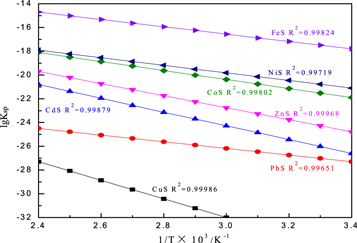
It could be seen that the pH of sulfide formation was not only related to the solubility product, but also to the concentration and valence of metal ions. The solubility product of some metal sulfides varied with temperature as shown in figure 24 [31].
Figure 24. Relation between solubility product of metal sulfides and temperature.
Download figure:
Standard image High-resolution image
From the figure 24, the fitting degree of lgKsp of metal sulfides ith temperature was better. With the increase of temperature, the solubility product of metal sulfides increased gradually, the lower the temperature was, the better the removal of heavy metals would be. But there was no heating and cooling equipment in production. the solution temperature after iron removal was maintained at 60 °C(333 K). Under these conditions, the solubility product of most metal sulfides was relatively small, and the good effect of removing heavy metals could be achieved. It could also be seen that this process could not theoretically remove Mg. The ICP analysis results of solutions before and after heavy metal removal were shown in table 12.
Table 12. Elemental analysis of solution before and after heavy metal removal.
| Element | Before purification (mg l−1) | After purification (mg l−1) | Removal rate (%) |
|---|---|---|---|
| Fe | 1.63 | 0.38 | 76.69 |
| Co | 11.81 | 0.8 | 93.23 |
| Ni | 32.35 | 5.44 | 83.18 |
| Mg | 4481.0 | 4459.9 | 0.47 |
| Cd | 552.4 | 411.4 | 25.52 |
| Cu | 3.36 | 1.12 | 66.67 |
| Zn | 0.48 | 0.15 | 68.75 |
| Pb | 0.29 | 0.14 | 51.72 |
As could be seen from table 12, heavy metals could be removed in the process of removing heavy metals by SDD. For example, the removal rates of Co, Ni, Cu, Zn and Pb were very high, but the removal of Mg could be neglected. This was due to the double hydrolysis of MgS in weak acid environment [32]. The results showed that Mg mainly entered the heavy metal removal slag in the form of aluminium magnesium silicate. Therefore, the removal of Mg from heavy metal slag was of little significance.
5. Conclusions
Through the study of the equilibrium distribution of Mg in the manganese electrolysis system, the following conclusions were drawn:
When rhodochrosite was leached acidically under the optimum leaching conditions of current industrial production, the concentration of Mg2+ would affect the leaching rate of manganese, when the Mg2+ was increased from 0% to 50%, the leaching rate of manganese decreased from 83.12% to 76.39%, which was significantly lower than the leaching rate of manganese in industrial. Meanwhile, the concentration of Mg2+ in the solution was 2.96 g l−1, that was to say, the Mg2+ would be enriched about 2∼3 g l−1 in every leaching process.
During the experiment, the distribution of magnesium in the whole system could be clearly seen by EDS energy spectrum of slag in each link. Fe2+ could be oxidized to Fe3+completely by using MnO2 and iron was removed by neutralization precipitation, the salg of removing iron could take away Mg to a great extent was 22.45%. In the process of heavy metal removed by using SDD, the removal rate of Mg was 0.4%.
In the electrolysis process, the distribution of Mg in the entire electrolysis system was obtained, where in the anode solution was 88.18%, in the cathode solution was 11.4%, in the electrolytic manganese sheet was 0.08%, and in the anode slag was 0.34%, respectively.
Generally speaking, assuming that there was 100 g Mg in rhodochrosite, 38.19 g Mg would get into the leaching solution, 61.81 g Mg would get into the slag. Among the 38.19 g Mg of leaching solution, the 8.57 g Mg would get into the slag of removing iron, 0.12 g Mg would get into the slag of removing heavy metal. 26.01 g Mg would get into anode solution, 3.36 g Mg would get into cathode solution, 0.024 g Mg would be taken away by the metal Mn, and the final 0.1 g Mg got into the anode slag.
Acknowledgments
The fund supports were from the National Natural Science Foundation of China (51764006, 51864012 and 51664010). Science and Technology Project of Guizhou Province([2017]5788, [2018]5071, [2019]1411).