

Abstract
Cyclic hot corrosion behavior of the super austenitic stainless steel 904L was investigated in the temperature range 500 °C–650 °C, in synthetic biomass ash environment of alkali salts of NaCl, KCl, Na2SO4 and K2SO4, up to 100 h. Sample surface was mechanically polished and spray coated with alkali chlorides and sulfates with two different ratios of chlorine and sulfur, Cl:S = 40:60 with salt mixture SM1 and Cl:S = 60:40 with SM2, to 3–4 mg cm−2. The hot corrosion kinetics was studied by weight change of the salt coated samples and the corroded samples were characterized by SEM/EDS, XRD and EPMA. The hot corrosion rate of the samples coated with SM1 and SM2 at 500 °C was comparable and lowest. However, at higher temperatures from 550 °C–650 °C the rate of corrosion from SM2 was significantly higher than that from the SM1. The higher content of sulfur in SM1 reduced the severity of corrosion resulting from chlorine. There was significant difference in surface morphology of the samples corroded with SM1 and SM2 salt mixtures. The higher rate of hot corrosion from SM2, with higher ratio of Cl:S (60:40) was found to be associated with porosity developed in the protective oxide layer by volatile chlorides and consequent active oxidation of the material.
Export citation and abstract BibTeX RIS
1. Introduction
Biomass fired plants are more environment friendly than fossil fuels fired ones and cause almost zero CO2 emission. Biomass and waste are renewable fuels and good substitutes of fossil fuels for power generation, for a sustainable society [1]. However, burning of biomass fuel results in deposition of ash which contains inorganic alkali chlorides and sulfates and reduce thermal efficiency of the heat exchangers and also cause severe corrosion at working temperature. The usage of waste products in energy production is known as WTE (Waste to Energy). Daniel et al [2] established phase diagrams using thermodynamic data for the NaCl + Na2SO4 + Na2CO3 + KCl + K2SO4 + K2CO3 system and predicted the liquidus temperatures of the above multi-component system. The eutectic temperatures were determined for the binary systems such as NaCl + Na2SO4 (625.95 °C), NaCl + Na2CO3 (631.55 °C), KCl + K2SO4 (690.45 °C), KCl + K2CO3 (630.65 °C). Several studies have been carried out on hot corrosion of a wide range of materials such as AISI 310 steel [3], Low alloy steel [4], Cast Fe–Ni–Cr alloy [5], Fe–Ni–Cr alloys, 304 L, Sanicro-28 [6], Low alloy Ferritic and Austenitic stainless steels [7, 8], 10CrMo(9–10), AISI 347 [9], with different mixtures of synthetic salts, close to compositions of biomass ash.
Studies have been carried out also on corrosion behavior of highly alloyed stainless steels from the individual salt of NaCl and KCl [9–12]. KCl in the deposit is derived from burning of biomass [13] whereas NaCl is derived from burning of municipal solid waste. Sonja Enestam et al [9] reported that corrosivity of KCl and NaCl was similar whereas Makippa et al [14] and Lehmusto et al [12] reported that KCl was more corrosive than NaCl. The presence of both alkali chlorides and sulfates results in lowering of melting temperature of the deposits and accelerates the rate of corrosion. The main problematic element in biomass ash environment is potassium which combines with passivation layer of Cr2O3 and forms K2CrO4 rather than sodium, at lower temperatures up to 400 °C [15]. Although, protective oxides are stable in air, they become less stable in contact of KCl at high temperature.
Considerable amount of work has been carried out on hot corrosion behavior of several super austenitic grade alloys, namely Sanicro-25& 28, SMO-254 & 654 except the 904 L. It was found by Norell et al [16] that formation of Cr–Fe spinel resisted the oxidation of the 904 L up to 168 h at 550 °C. However, no work has been reported on high temperature corrosion behavior of the 904 L steel in such a complex salt environment. The present work was undertaken to study hot corrosion behavior of the 904 L steel in synthetic biomass ash environment using two different mixtures of NaCl + KCl+Na2SO4 + K2SO4 salts, SM1 and SM2, up to 100 h, with Cl:S ratio of 40:60 and 60:40 respectively at 500 °C–650 °C.
2. Experimental procedures
2.1. Materials preparation
The super austenitic stainless steel 904 L was procured from M/s Bharat Aerospace metals, Mumbai, in the form of hot rolled rods of 16 mm diameter. It was solutionized at 1100 °C for 1 h and quenched in water. The chemical composition of the 904 L steel is presented in table 1. The 16 mm diameter rod was machined to 14.5 mm diameter and disc shaped samples of 14.5 mm diameter and 4 mm thickness were prepared for corrosion study. The samples were mechanically polished with emery paper up to #600 grit size and subsequently cleaned with acetone.
Table 1. Chemical composition of the 904 L super austenitic stainless steel (wt%).
| C | Mn | Si | P | S | Ni | Cr | Cu | Mo | N | Fe |
|---|---|---|---|---|---|---|---|---|---|---|
| 0.014 | 1.45 | 0.38 | 0.0024 | 0.020 | 24.10 | 19.95 | 1.59 | 4.02 | 0.0620 | Bal. |
2.1.1. Salt spray coating
Two different mixtures of the salts NaCl, KCl, Na2SO4 and K2SO4, SM1 and SM2, were prepared for Cl:S ratios of 40:60 and 60:40 respectively, as per the compositions given in the table 2 and their solutions were prepared in fresh double distilled water. One side of the polished samples was spray coated 3 to 4 mg cm−2 salt mixture of NaCl, KCl, Na2SO4 and K2SO4 and the temperature of the specimens was maintained at 120 °C during the process of spray coating to evaporate water from the salt solution. The salt coated samples were weighed and kept in an oven at 110 °C to avoid absorption of moisture.
Table 2. Details of the salt mixtures SM1 and SM2.
| Designation | Composition of the salt mixtures (wt%) | Cl:S ratio |
|---|---|---|
| SM1: | 20 NaCl + 30 Na2SO4 + 20 KCl + 30 K2SO4 | 40:60 |
| SM2: | 30 NaCl + 20 Na2SO4 + 30 KCl + 20 K2SO4 | 60:40 |
2.1.2. Hot corrosion test
Each salt coated sample was kept in a silica crucible and weighed. Cyclic hot corrosion tests were performed in air atmosphere at 500, 550, 600 and 650 °C up to 100 h in 15 cycles in a muffle furnace. The temperature of the furnace was controlled within ±2 °C. The initial 5-cycles consisting of 1 h soaking in each cycle at the test temperature were followed by 4-cycles of 5 h soaking, 3-cycles of 10 h soaking, the rest 3-cycles of 15 h soaking and finally cooling to room temperature. On completion of each cycle the weight gain was measured using Axis Electronic Balance of 0.1 mg accuracy and this procedure was repeated for each cycle till 100 h of exposure.
2.2. Sample characterization
Before characterization, the samples were cleaned with hot distilled water to remove any unreacted salts and dried in air, subsequently the samples were cleaned ultrasonically in acetone for 10 min to remove any non-adherent layer. The surface morphology and compositional analysis of the corroded samples was carried out by scanning electron microscope (SEM-Carl Zeiss–Sigma) and EDS (Oxford instruments-INCAx). The phases of the corrosion products were analyzed by XRD (Rigaku MiniFlex-600) with Cu-Kα (λ = 0.15406 nm) scanning at the rate of 10°/min. The cross sections of the corroded samples were analyzed by Electron Probe Micro-Analyzer (EPMA) (CAMECA SXFive) to evaluate the distribution of elements from surface to interior of the samples.
3. Results
3.1. Visual observation
Figure 1 shows photographs of the samples hot corroded by the SM1 and SM2 salt mixtures. The spallation of the corroded/oxidized layer can be seen clearly at the higher temperatures. The corroded layer of the sample by SM1 was found intact following exposure at 500, 550 and 600 °C whereas there was spallation from the exposure at 650 °C. On the other-hand, spallation of the corroded surface of the sample by SM2 was found to start at 550 °C and progressively increase up to 650 °C. It was observed that there was only partial melting of SM1 from the exposure of 100 h at 500 °C whereas there was uniform melting of the SM2. Tiny spots of creamy color may be observed all over the surface of the samples exposed at 550 °C–600 °C for 100 h. On the other hand, there are pale yellow spots on the surface of the SM2 coated sample and spallation of the scale from the flat surface as well as exfoliation along the periphery. However, there was no spallation due to SM1; a few spots of salt remnants were observed after 100 h of exposure. The yellow spots may be due to salt reactions with surface oxides and formation of potassium/sodium chromates.
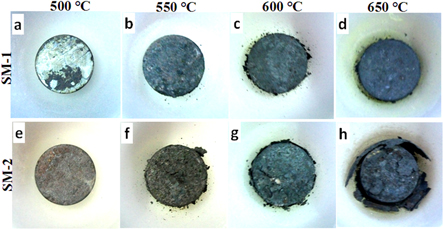
Figure 1. Photographs of the samples corroded at 500 °C–650 °C for 100 h by: (a)–(d) SM1 and (e)–(h) SM2.
Download figure:
Standard image High-resolution image3.2. Weight gain analysis
Figures 2(a) and (b) show plots of weight gain per unit area (mg cm−2) versus time interval of 15 cycles for the samples, coated with SM1 and SM2 respectively, exposed in air atmosphere at 500, 550, 600 and 650 °C for 100 h. It is evident that there is much higher weight gain in the samples coated with SM2 than in those coated with SM1. Thus, it is obvious that there was more rapid formation of oxides and other corrosion products from SM2. The inserts in the plots show that weight gain during the initial period of 5 h was much less than that beyond 5 h of exposure, in the samples coated with of both SM1 as well as SM2. However, the weight gain even during the initial stage of 5 h is relatively higher from SM2 than from SM1. Figures 3(a)–(b) show the variation of square of weight gain per unit area with duration of exposure up to 100 h. There is rapid increase in (ΔW)2 during the exposure of 5–25 h at 600 °C and significantly more at 650 °C in the sample coated with SM2, thereafter the increase is much slower during 25–100 h of exposure, and a dual slope behavior is exhibited (figure 3(b)).
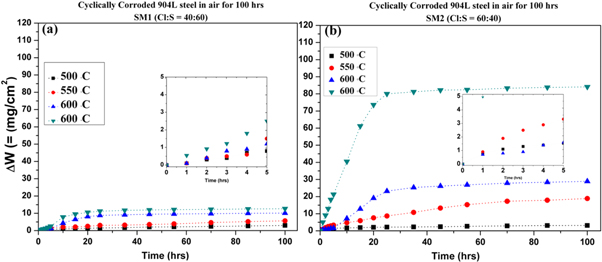
Figure 2. Weight gain (ΔW) versus time plots of the samples exposed at 500–650 °C up to 100 h and corroded from: (a) SM1 and (b) SM2.
Download figure:
Standard image High-resolution image
Figure 3. Square of weight gain (ΔW)2 versus time plots of the samples exposed at 500–650 °C up to 100 h and corroded from: (a) SM1 and (b) SM2.
Download figure:
Standard image High-resolution imageOn the other hand there is relatively much less increase in (ΔW)2 from the exposure at 500 and 550 °C and the increase is linear with a single slope during the exposure from 5–100 h. The variation of (ΔW)2 with the duration of exposure in the sample coated with SM1 (figure 3(a)) is similar to that coated with SM2 (figure 3(b)), however, the increase from SM1 is much less than that from SM2, as the scale of (ΔW)2 in figure 3(b) is much higher than that in figure 3(a). The corrosion kinetics may be seen to follow parabolic rate law ΔW2 = kpt + c, where ΔW is weight gain per unit area, t is the exposure time, kp is rate constant and c is a constant. The calculated values of kp are presented in table 3 which are much higher for the samples coated with SM2 than those coated with SM1, above 500 °C. It is also evident that kp values at 600 and 650 °C are much higher corresponding to 5–25 h of exposure than those for 25–100 h of exposure.
Table 3. Parabolic rate constants for the samples hot corroded by SM1 and SM2 salt mixtures from 500 °C–650 °C, up to 100 h.
| SM1 (Cl:S = 40:60) | SM2 (Cl:S = 60:40) | |||||||
|---|---|---|---|---|---|---|---|---|
| Temperature. (°C) | ΔW (mg) | Time (hrs) | kp | R2 | ΔW (mg) | Time (hrs) | kp | R2 |
| 500 | 2.9 | 0–100 | 0.09 | 0.99 | 3.1 | 0–100 | 0.09 | 0.94 |
| 550 | 5.7 | 0–100 | 0.31 | 0.99 | 18.9 | 0–100 | 3.92 | 0.98 |
| 600 | 8.8 | 0–25 | 3.4 | 0.96 | 23.2 | 0–25 | 20.79 | 0.90 |
| 10.1 | 25–100 | 0.32 | 0.94 | 28.9 | 25–100 | 3.68 | 0.91 | |
| 650 | 11.2 | 0–25 | 5.81 | 0.96 | 80 | 0–25 | 278.4 | 0.98 |
| 12.66 | 25–100 | 0.42 | 0.92 | 84.1 | 25–100 | 8.51 | 0.91 | |
Note: unit for kp is (mg · cm−2 · h−1/2).
3.3. XRD analysis
XRD patterns of the samples with SM1 and SM2 coatings exposed in air from 500 °C–650 °C are shown in figures 4(a) and (b) respectively. Details of the analyzed peaks are presented in table 4.

Figure 4. Phase analysis of the corrosion products by XRD, resulting from exposure at 500–650 °C up to 100 h and corroded by: (a) SM1 and (b) SM2.
Download figure:
Standard image High-resolution imageTable 4. Various phases and compounds formed from hot corrosion of 904 L steel by SM1 and SM2 salt mixtures, exposed from 500 to 650 °C, up to 100 h.
| SM1 (Cl:S = 40:60) | SM2 (Cl:S = 60:40) | |||
|---|---|---|---|---|
| Temperature | Oxides products | Corrosive products | Oxides products | Corrosive products |
| 500 °C | CrO, Cr2O3, Fe2O3, Fe3O4, NiO, Cr2NiO4, FeNi2O4, Cr2FeO4, CuMn2O4, CrFeNiO4, CrCuMnO4, Fe2MnO4, Fe2SiO4, (Fe, Cr)2O3 | FeS, FeCl3, CrS, | CrO, Cr2O3, Fe2O3, Fe3O4, NiO, Cr2NiO4, FeNi2O4, Cr2FeO4, CuMn2O4, CrFeNiO4, CrCuMnO4, Fe2MnO4, Fe2SiO4, (Fe, Cr)2O3 | FeS, FeCl3, CrS, K2Cr2O7, K2FeO4, |
| 550 °C | CrO, Cr2O3, Fe2O3, Fe3O4, NiO, Cr2NiO4, FeNi2O4, Cr2FeO4, CuMn2O4, CrFeNiO4, CrCuMnO4, Fe2MnO4, Fe2SiO4, (Fe, Cr)2O3 | FeS, FeCl3, CrS, NiCl2, K2FeO4, KCrO2, NaCrO2, | CrO, Cr2O3, Fe2O3, Fe3O4, NiO, Cr2NiO4, FeNi2O4, Cr2FeO4, CuMn2O4, CrFeNiO4, CrCuMnO4, Fe2MnO4, Fe2SiO4, (Fe, Cr)2O3 | FeS, FeCl3, CrS, K2Cr2O7, NiCl2, K2FeO4, KCrO2, NaCrO2, Na2Cr2O7, NaFeO2 |
| 600 °C | CrO, Cr2O3, Fe2O3, Fe3O4, NiO, Cr2NiO4, FeNi2O4, Cr2FeO4, CuMn2O4, Cr2MnO4, CrFeNiO4, CrCuMnO4, Fe2MnO4, Fe2SiO4, (Fe, Cr)2O3 | FeS, FeCl3, CrS, NiCl2, K2Cr2O7, K2FeO4, KCrO2, NaCrO2, Na2Cr2O7, NaFeO2 | CrO, Cr2O3, Fe2O3, Fe3O4, NiO, Cr2NiO4, FeNi2O4, Cr2FeO4, CuMn2O4, Cr2MnO4, CrFeNiO4, CrCuMnO4, Fe2MnO4, Fe2SiO4, (Fe, Cr)2O3 | FeS, FeCl3, CrS, K2Cr2O7, NiCl2, K2FeO4, KCrO2, NaCrO2, Na2Cr2O7, NaFeO2 |
| 650 °C | CrO, Cr2O3, Fe2O3, Fe3O4, NiO, Cr2NiO4, FeNi2O4, Cr2FeO4, CuMn2O4, Cr2MnO4, CrFeNiO4, CrCuMnO4, Fe2MnO4, Fe2SiO4, (Fe, Cr)2O3 | FeS, FeCl3, CrS, NiCl2, K2Cr2O7, K2FeO4, KCrO2, NaCrO2, Na2Cr2O7, NaFeO2, | CrO, Cr2O3, Fe2O3, Fe3O4, NiO, Cr2NiO4, FeNi2O4, Cr2FeO4, CuMn2O4, Cr2MnO4, CrFeNiO4, CrCuMnO4, Fe2MnO4, Fe2SiO4, (Fe, Cr)2O3 | FeS, FeCl3, CrS, K2CrO4, NiCl2, K2FeO4, KCrO2, NaCrO2, Na2CrO4 |
Spinels of Cr–Ni–Fe and Cr–Mn–Cu oxides are observed along with the corrosives FeS, FeCl3 and CrS in the samples coated with SM1 and K2Cr2O7 and K2FeO4 in those coated with SM2. At 550 °C similar features are observed with formation of spinels of transition elements oxides. Corrosion products namely KCrO2 and NaCrO2 are evolved with SM1 salt mixture whereas NaFeO2 and Na2Cr2O7 are formed with SM2. At 600 °C corrosion from the salt mixture resulted in formation of a new phase Cr2MnO4 in both the samples coated with SM1 as well as SM2. Also, there is extensive formation of Na–K–Fe–Cr–O based corrosion products along with Fe–Cr–S–Cl system. At 650 °C, there was formation of K2CrO4 and Na2CrO4, new phases of corrosion products. Table 5 shows the various corrosion and oxidation reactions at different temperatures of exposure.
Table 5. Possible oxidation/corrosion reactions and their products formed from hot corrosion of 904 L steel by SM1 and SM2 from 500 °C to 650 °C.
| No. | Reactant | = | Product |
|---|---|---|---|
| 1 | Cr(s) + 0.5O2(g) | = | CrO(s) |
| 2 | 2CrO(s) + 0.5O2(g) | = | Cr2O3(s) |
| 3 | Cr(s) + Cl2(g) | = | CrCl2(s) |
| 4 | CrCl2(s) + 0.5Cl2(g) | = | CrCl3(s) |
| 5 | Cr(s) + 1.5Cl2(g) | = | CrCl3(s) |
| 6 | Cr(s) + SO4(−2)(g) | = | CrS(s) + 2O2(−2)(g) |
| 7 | 2KCl(s) + Cr2O3(s) + O2(g) | = | K2CrO4(s) + CrO(s) + Cl2(g) |
| 8 | 2KCl(s) + 2CrO(s) + O2(g) | = | K2CrO4(s) + Cl2(g) |
| 9 | 2KCl(s) + Cr2O3(s) + 2O2(g) | = | K2Cr2O7(s) + Cl2(g) |
| 10 | 2KCl(s) + Fe3O4 + 1.5O2(g) | = | K2FeO4(s) + Fe2O3(s) + Cl2(g) |
| 11 | 2KCl(s) + Fe2O3 + 0.5O2(g) | = | K2FeO4 + FeCl2 |
| 12 | 2CrCl2(s) + 1.5O2(g) | = | Cr2O3(s) + 2Cl2(g) |
| 13 | 2CrCl3(s) + 1.5O2(g) | = | Cr2O3(s) + 3Cl2(g) |
| 14 | FeCl2(g) +2O2(g) | = | Fe3O4(s) + 3Cl2 |
| 15 | FeCl2(g) +1.5O2(g) | = | Fe2O3(s) +2Cl2(g) |
| 16 | NiCl2(g) + 0.5O2(g) | = | NiO(s) + Cl2(g) |
| 17 | NiO(s) + Cr2O3(s) | = | NiCr2O4(s) |
| 18 | NiO(s) + Fe2O3(s) | = | NiFe2O4(s) |
| 19 | NiO(s) + 0.5Fe2O3(s) +1.5O2(g) | = | Ni2FeO4(s) |
| 20 | 2FeO(s) + 2Cr2O3(s) + 1.5O2(g) | = | 2FeCr2O4(s) |
| 21 | Na2O + Cr2O3(s) + 1.5O2(g) | = | Na2Cr2O7(s) |
| 22 | MnO(s) + Fe2O3(s) | = | MnFe2O4(s) |
| 23 | MnO(s) + Cr2O3(s) | = | MnCr2O4(s) |
| 24 | 2NaCl(s) +Fe2O3(s) + 0.5O2(g) | = | Na2Fe2O4(s) + Cl2(g) |
| 25 | 4NaCl(s) +Cr2O3(s) + 2.5O2(g) | = | 2Na2CrO4(s) + 2Cl2(g) |
| 26 | FeCl2(s) | = | FeCl2(g) |
| 27 | Fe2O3(s) + 2(Na, K)Cl + 0.5O2(g) | = | (Na, K)2Fe2O4(s) + Cl2(g) |
| 28 | Cr2O3(s) + 2(Na, K)Cl(s) + 2O2(g) | = | (Na, K)2Cr2O7(s) + Cl2(g) |
| 29 | 2(Na, K)Cl(s) + Cr2O3(s) + 0.5O2(g) | = | 2(Na, K)CrO2(s) + Cl2(g) |
| 30 | K2O(s) + FeO(s) + O2(g) | = | K2FeO4(s) |
| 31 | 2NaCl(s) + Fe2O3(s) + 0.5O2(g) | = | 2NaFeO2(s) + Cl2(g) |
3.4. Surface morphology
The relative inhomogenieties of the surface morphology and development of scales on the samples in respect of the Cl:S ratio in the two salt mixtures were analyzed by SEM-EDS.
Table 6. Melting temperatures of different salts and eutectic temperatures of different salt mixtures.
| Melting temperature | °C | Metal salt eutectic | °C |
|---|---|---|---|
| CrCl3 | 1150 | NaCl–CrCl3 | 544–593 |
| NiCl2 | 1030 | NaCl–CrCl2 | 437 |
| CrCl2 | 820 | NaCl–FeCl2 | 370–374 |
| FeCl3 | 303 | NaCl–FeCl3 | 151 |
| FeCl2 | 676 | NaCl–Na2CrO4 | 557 |
| Fe2O3 | 1594 | KCl–K2CrO4 | 500–700 |
| NaCl | 801 | FeCl2 + FeCl3 | 606 |
| Na2SO4 | 884 | FeCl2 + NaCl | 372 |
| KCl | 771 | FeCl2 + NiCl2 | 665 |
| K2SO4 | 1069 | FeCl3 + NiCl2 | 456 |
| K2CrO4 | 980 | KCl + K2SO4 | 713 |
| NaCl + Na2SO4 | 617 | ||
| KCl + NiCl2 | 508 | ||
| KCl–FeCl2 | 345 | ||
| KCl–NaCl | 652 |
The micrographs in figures 5(a), 6(a), 7(a) and (8)(a)–(b) show top surfaces of the samples corroded by SM1 and those in figures 5(b), 6(b), 7(b) and 9(a)–(b) show surface morphology of the samples corroded by SM2, from 100 h of exposures at 500–650 °C. At all the temperatures of the exposure, coating of the both SM1 and SM2 resulted in characteristic morphology of metals oxides and corrosion products over the surface.
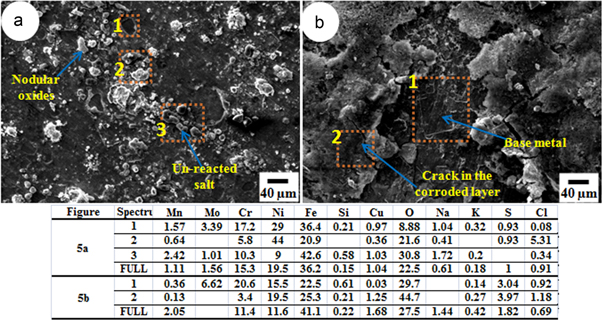
Figure 5. Surface morphology of the samples exposed up to 100 h at 500 °C and corroded by: (a) SM1 and (b) SM2.
Download figure:
Standard image High-resolution image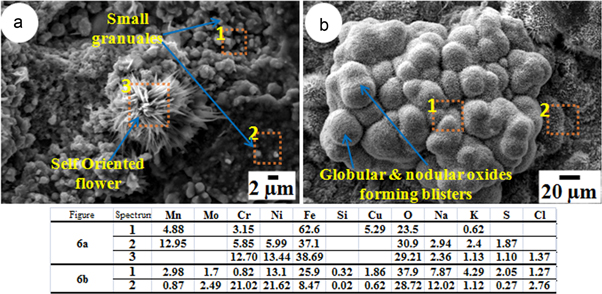
Figure 6. Surface morphology of the samples exposed up to 100 h at 550 °C and corroded by: (a) SM1 and (b) SM2.
Download figure:
Standard image High-resolution image
Figure 7. Surface morphology of the samples exposed up to 100 h at 600 °C, corroded by (a) SM1 and (b) SM2.
Download figure:
Standard image High-resolution image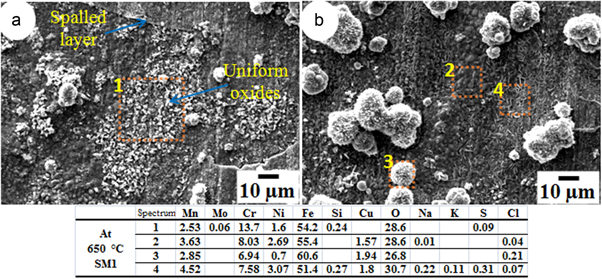
Figure 8. Surface morphology of the samples coated with SM1 and exposed at 650 °C up to 100 h showing: (a) spallation and (b) no spallation.
Download figure:
Standard image High-resolution image
Figure 9. Surface morphology of the sample coated with SM2 and exposed at 650 °C, up to 100 h showing: (a) no spallation and (b) region below the spalled scale.
Download figure:
Standard image High-resolution imageFigures 5(a) and (b) show the samples corroded with SM1 and SM2 respectively, from the exposure at 500 °C for 100 h, exhibiting less oxidation/corrosion. The scale formed from SM1 was intact and there was no spallation (figure 5(a)) whereas the coating of SM2 had cracked at some places and also spalled (figure 5(b)).
In figure 6(a), the surface of the sample corroded by SM1 at 550 °C shows small granules of oxide particles, uniformly grown all over the surface. The morphology of the product formed with SM1 at 550 °C shows self-oriented flowers and features like cactus needle, grown in between the oxide granules whereas the sample corroded by SM2 shows oxide morphology of globular/nodular shape (figure 6(b)). This morphology is like a cauliflower and there are globular domes. This type of morphology can be understood from localized blistering of the scale by volatile products and pushing of scale outward [17].
The morphology of the surface resulting from corrosion at 600 °C due to SM1 and SM2 salt mixtures may be seen in figures 7(a) and (b) respectively. It is clear that from SM1 there was formation of globular nodules and also spallation of the scale. The magnified image shows that lamellar structure, with higher content of Fe–Ni–Cr spinel, as revealed by EDS analysis. As shown in figure 7(b), there was spallation of the sample coated with SM2 and exposed at 600 °C. In this condition, from 550 to 600 °C, oxides are almost similar but differ in morphology. Oxide nodules may be seen to be irregular in shape (figure 7(b)).
Figure 8(a) shows the morphology of the layer lying beneath the spalled layer of the sample coated with SM1 and exposed at 650 °C. Oxides granules are uniformly distributed all over the surface beneath the spalled layer. Figure 8(b) shows morphology of the scale which did not spall. The unspalled layer shows nodular/irregular shape of oxide nodules of Cr–Ni spinels.
Figure 9(a) shows formation of dense filament like features of Ni–Cr–Fe spinel in the region without spallation. Further, at 650 °C there is formation of two types of regions: one with filament like features and the other without such features. Figure 9(b) shows the region where spalled layer is not present and the region beneath the spalled layer, with cuboidal shaped Fe-Ni spinels.
3.5. Cross sectional analysis
Cross sections of the corroded samples were analyzed by SEM-EDS and EPMA.
Figures 10(a) and (b) show SEM-micrographs of cross sections of the samples corroded by SM1 exposed at 500 and 550 °C whereas figures 10(c) and (d) show the features corroded by SM1 at 600 and 650 °C respectively. The intact layer of the oxide in figure 10(a) reveals negligible corrosion and absence of internal corrosion. From the EDS analysis it was found that there was no depletion of elements with increment in temperature from 550 to 600 °C, however, there was internal attack as well as depletion and cracking along and also beneath the scale. This internal corrosion appears to be higher at 600 °C than that at 550 °C where the scale interface is intact to the base material. From the EDS analysis over the cross section in figures 10(c) and (d), it was observed that there was higher depletion of Fe–Cr.
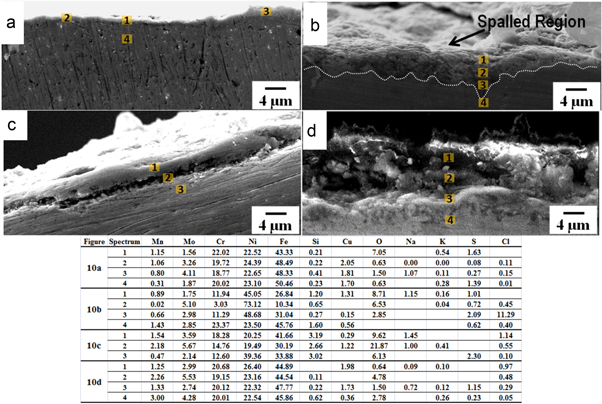
Figure 10. SEM micrographs showing cross sectional features of the samples hot corroded by SM1 up to 100 h at: (a) 500, (b) 550, (c) 600 and (d) 650 °C; up to 100 h respectively.
Download figure:
Standard image High-resolution imageFigures 11(a) and (b) show SEM-micrographs of cross sections of the samples corroded at 500 and 550 °C by SM2. It may be seen that there was greater attack from the SM2 as compared with that from SM1. SEM micrographs of the samples corroded at 600 and 650 °C are shown in figures 11(c) and (d) respectively, where it may be observed that severe corrosion had occurred due to SM2 and there was porous region beneath the scale interface. The corrodants locally attacked the base metal through the porous scale. This region may be presented as a layer of porous γ-Fe2O3/Fe3O4, and the internal part of the depleted zone is in the form of chromium oxide with the other constituents and showed high amount of chromium by EDS analysis. The depth of the corroded layer was ≈16–18 μm in the sample coated with SM1 and ≈31–33 μm with SM2 (table 7).
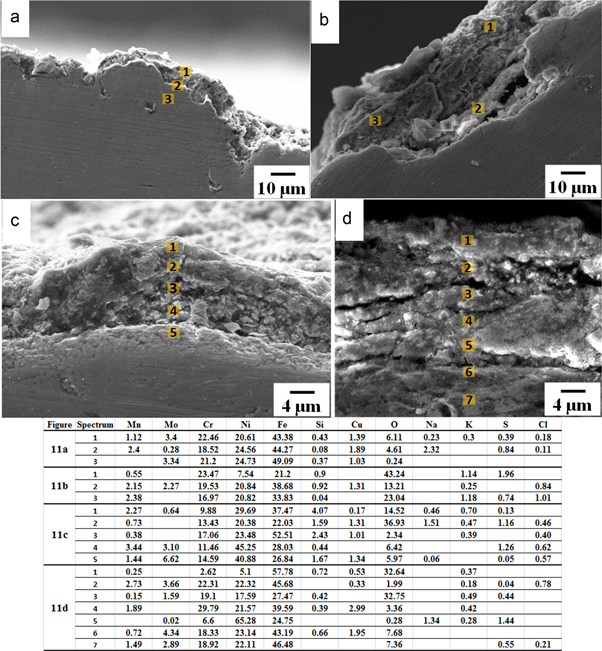
Figure 11. SEM micrographs showing cross section of the samples hot corroded by SM2 up to 100 h at: (a) 500, (b) 550, (c) 600 and (d) 650 °C.
Download figure:
Standard image High-resolution imageTable 7. Depth of attack on the samples coated with salt mixtures SM1 and SM2 exposed at 650 °C, up to 100 h.
| Scale (μm) | Depletion zone (μm) | Total thickness (μm) | |
|---|---|---|---|
| SM1 | 4–5 | 11–13 | 16–18 |
| SM2 | 10–12 | 18–20 | 31–33 |
3.6. EPMA anaylsis
Figures 12(a)–(b) and 13(a)–(b) show EPMA analysis of cross sections of the samples corroded with SM1 and SM2 at 650 °C for 100 h. The severity of corrosion from SM2 with 60:40 (Cl:S) ratio is quite evident and there is also internal attack. A three layer scale, with a thick depleted region can be seen between the internal scale at the substrate and the outer scale on the surface of the sample with SM2 coat as compared with the much thinner scale resulting from SM1. Moreover, after 100 h of exposure, it can be seen from figure 12(a) that the layer formed from SM1 constituted of dual phase layer. Figure 12(b) shows distribution maps of different elements (Cr, Ni, Fe, Mn, Mo and O). In case of the sample with SM2, multiphase layer can be seen in figure 13(a)–(b). From the color contrast in the EPMA maps in figure 13(b), the distribution of respective elements in the scale and the substrate may clearly be seen. The relative width of the scale and the depletion zone in the samples with SM1 and SM2 can be seen in the figures 14(a) and (b) respectively along with concentration of the elements in these zones. According to line scan analysis, in figure 14(a) the scale consists of iron and oxygen and the depletion zone constitutes of Cr–Fe–O as well as some amount of Ni close to the base metal. On the other hand figure 14(b) shows that the scale resulting from SM2 is much wider and consists of Fe, Cr and O and the large depletion zone shows presence of Cr, Ni, Fe and O.

Figure 12. EPMA mapping of cross section of the sample hot corroded by SM1 at 650 °C, up to 100 h.
Download figure:
Standard image High-resolution image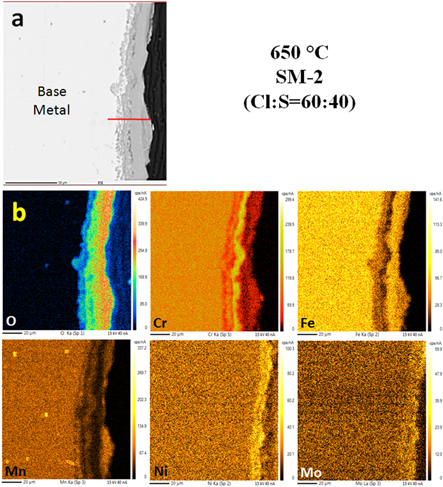
Figure 13. EPMA mapping of cross section of sample hot corroded by SM2 salt mixture and exposed at 650 °C up to 100 h.
Download figure:
Standard image High-resolution image
Figure 14. EPMA line scans of cross sections of the samples showing variation in concentration of the elements Fe, Ni, Mn, Mo, Cu and O, exposed at 650 °C for 100 h in air, coated with (a) SM1 and (b) SM2.
Download figure:
Standard image High-resolution image
4. Discussion
The two salt mixtures SM1 and SM2 were selected in such a way that the content of alkali metals (K, Na) remain in equal quantity whereas Cl and S are in the ratios of 40:60 and 60:40 to simulate the biomass ash deposition in waste to energy boilers. The NaCl, KCl, K2SO4 and Na2SO4 salts form varying eutectic melts which can affect the corrosion resistance of the material (table 3). The effects of the two salt mixtures (SM1 and SM2) are analyzed in detail to bring out the influence of alkali high sulfur in presence of chloride salts (Cl:S = 40:60) and that of alkali high chlorine in the presence of sulfate salts (Cl:S = 60:40). Passivation of a highly corrosion resistant material demands dense microstructure, high adhesion of the protective oxides to substrate and absence of inter-connected pores which otherwise serve as preferred diffusion path for the corrosive agents [17].
4.1. Effect of alkali salts with high sulfur in presence of chlorine salts (SM1)
It may be seen from the figure 2 that there was little weight gain from the exposure at 500 °C due to non fusion of the coated salt mixtures, in agreement with the earlier observation made by Daniel et al [2]. At 550 °C also there is weight change, more or less of similar trend of linear increase, however, it was relatively more in the sample coated with SM2 (figure 2(b). At 600 and 650 °C there was rapid increase in the weight gain from 5–25 h, beyond which the gained weight increased very slowly whereas it increased progressively at 500 and 550 °C. Since there was no melting of the salt mixtures at 500 °C, the XRD phase analysis showed formation of in situ oxides and in parallel the ex situ diffusion [18] of salt showed less severe corrosive nature of oxides. The much lower value of kp corresponding to exposure of the samples coated with SM1 and SM2, from 25–100 h may be attributed to decrease in the amount of corrodants due to their high reactivity/instability (table 8) and formation of protective layer over the spalled surface region. On the otherhand at lower temperature of 500 °C–550 °C the reactivity of corrodants is much less and their stability is higher, hence a single slope behavior is exhibited (figure 3). The much higher level of the (ΔW)2 versus time plot in figure 3(b) at 650 °C as compared to that at 600 °C may be understood from the difference in the hot corrosion rate which nearly 15 times higher at 650 °C than that at 600 °C during 5–25 h of exposure (table 3).
Table 8. Calculated values of Gibbs free energy ( kJ/mole) for the different phases resulting from corrosion by SM1 and SM2 from 100 h of exposure at 500–650 °C.
| ΔG (in kJ/mole) | Fe2O3 | Fe3O4 | Cr2O3 | FeCr2O4 | NiO | FeCl2 (α) | FeCl3 | CrCl2 |
|---|---|---|---|---|---|---|---|---|
| ΔG500 | −140.7 | −215.5 | −919.4 | −472.3 | −168.5 | −247.1 | −16.8 | −296.3 |
| ΔG550 | −133.7 | −209.3 | −906.4 | −467.3 | −164.2 | −241.3 | −24.9 | −290.8 |
| ΔG600 | −126.6 | −203.0 | −893.4 | −462.2 | −159.9 | −235.6 | −33.0 | −285.4 |
| ΔG650 | −119.6 | −196.7 | −880.4 | −457.2 | −155.7 | −229.9 | −41.1 | −280.1 |
| ΔG (in kJ/mole) | CrCl3 | FeS (γ) | MnS(α) | MnO | MnCl2 (α) | K2O | KCl(s) | NaCl(s) |
| ΔG500 | −246.1 | −219.4 | −218.2 | −77.4 | −383.7 | −261.1 | −361.3 | −337.9 |
| ΔG550 | −239.1 | −214.1 | −215.0 | −73.8 | −377.8 | −254.9 | −356.3 | −333.0 |
| ΔG600 | −232.1 | −208.8 | −211.8 | −70.1 | −372.0 | −248.8 | −351.2 | −328.0 |
| ΔG650 | −225.1 | −203.4 | −208.6 | −66.5 | −366.2 | −242.8 | −346.2 | −323.1 |
The reactions occurring under this condition are shown in table 4. During the initial 5 h of exposure there is much less increase in the weight as seen from the inserts, beyond 5 h only there is rapid increase in the weight gain up to 25 h of exposure, and parabolic behavior is exhibited (figures 3(a)–(b)).
It is well known that alkali chlorides accelerate the process of corrosion [19], while the alkali sulfates lower the effects of alkali chlorides in biomass combustion [20]. The cross section of the sample coated with SM1 and exposed at 500 °C did not show any porous layer because of insufficient melting of the salts.
The scale formed was intact and there was no spallation. On exposure at 550 °C the non-protective feature of the oxide scale may be observed from its porous nature [8]. The difference in surface of the samples corroded with salt mixtures at 550 °C from that at 500 °C is due to more penetration of salt mixture in to base material at 550 °C. From the weight change at 600 °C it is seen that weight gain was due to formation of chromia layer as per the reactions between (Cr, Fe)2O3 matrix and the molten salts (table 5). A new specie formed at 600 °C with SM1 was Cr2MnO4, in agreement with the minimum amount of Mn depleting with chromia layer [21].
In particular at 600 and 650 °C (figures 2 and 3), this behavior reflects rapid growth of oxides induced by chlorination and subsequent rapid oxidation by the process of the so called active oxidation. Presence of FeCr2O4, Cr2O3 on the exposed surface indicates rapid formation of oxides which is in line with the previous observation made on Sanicro-28 [22]. The cross section of the sample following 100 h of exposure at 600 °C shows that the formed scale tended to separate out from the base metal. This kind of the scale layer was also observed at 650 °C. The cause of separation of the scale from the base material is the mechanical stresses induced during cyclic corrosion. At 650 °C there was faster rate of corrosion with higher weight gain resulting from the formation of porous and non-protective layer. From phase analysis it is confirmed that this nature is due to the corrosives such as K2Cr2O7 and Na2Cr2O7. The above two eutectic mixtures enhanced the rate of corrosion very rapidly.
4.2. Effect of alkali high chlorine in presence of sulfur salts (SM2)
SEM-EDS analysis of cross section of the sample (figure 11) shows that at 650 °C a significant amount of oxides and corrosion products got embedded beneath the scale. These oxides were loosely bonded and spalled. The growth of the other oxides can be seen clearly from the surface morphology (figures 8 and 9).
The surface morphology of the samples corroded with salt SM2 in the temperature range 500 °C–650 °C, clearly reveals variation in the size of oxides. There is far less spallation from exposure at 500 °C–550 °C whereas it is much higher at 600 °C and highest at 650 °C in agreement with the observation of Grabke [23] where high alloy steel was found spalled as well as there was porous scale of Fe2O3 at the oxide interface due to high chloride content and escape of high volatile chlorides. Due to high chlorine content in the salt mixture and penetration of Cl- in to the scale resulted in formation of NiCl2, FeCl2, FeCl3 and CrCl3. The inward diffusion of Cl- ions and outward diffusion of alloying elements resulted in formation of a thick depleted zone at the interface between the substrate and the scale. These phases in this zone were characterized by the XRD and SEM-EDS analysis and found to be due to chlorides. These chlorides continuously evaporated and iron chloride got oxidized to Fe3O4 in air on the top at outer surface of the scale. Thus, it can be called active oxidation of Fe2O3 in the presence of chlorine which acts as catalyst and accelerates the process of corrosion at 600 °C–650 °C forming cracks/splat boundaries, grain boundary grooving or fissuring. The outward diffusion of FeCl2(g) through Fe2O3(s) gave rise to an inverse proportion to thickness of the oxide. Effect of SO2 in the atmosphere on the active oxidation beneath the deposits was in the form of CrS. A modest increase of oxidation rate was observed with high Cl-content rather than S-content. From the literature also, it is clear that sulfur minimizes the effect of chlorine attack from 500 °C–650 °C up to 100 h in air atmosphere [24, 25].
The results obtained by XRD/SEM-EDS and EPMA, clearly indicate that at 500 and 550 °C oxide scale remained almost similar in the two regions and spinel formed. There was formation of spinel which comprises mainly of the M2O3 and M3O4 oxides. Where, M is the transition element such as Fe, Cr, Ni, Mn, Mo and Cu. From figures 5 and 6(a)–(b) the amount of corrosives evaluated from EDS analysis confirmed the presence of the phases such as FeCl3, FeS and CrS. Moreover, the potassium salts oxides are K2Cr2O7, K2FeO4 and KCrO2 and the sodium based oxides NaCrO2, Na2Cr2O7 and NaFeO2 were found from the EDS analysis. With increase in temperature of the sample coated with SM1 to 600 °C and 650 °C, there was no change in potassium products while in the sample with SM2 coating K2Cr2O7 got converted to K2CrO4 and Na2Cr2O7 to Na2CrO4 respectively [26–28].
EPMA analysis of the cross section and the line scans of the samples exposed at 650 °C show that there was a significant outward diffusion of Fe and Ni from the base metal to the scale. A thick crust of oxides rich in Fe and Ni can be seen in figure 13. It is also important to note that at lower temperature of 500 °C–550 °C the alloy surface showed pits and uneven interface, whereas at the higher temperature of 600 °C–650 °C the alloy surface of the sample was uniformly eaten away by the corrodants and a layered structure formed comprising of several laminar cracks.
4.3. Corrosion mechanism
4.3.1. Significance of alkali metal, chlorides and sulphates
Presence of the both, alkali chlorides as well as sulphates was detected near/over the external oxide-internal oxide interface in both the samples coated with SM1 as well as SM2, exposed at 550, 600 and 650 °C. The interfaces of these formed oxides were selectively attacked by the salt mixtures while they were absent near the matrix. Again, it should be noted that due to volatile nature of the salts of Na, K, Cl, S and established by the EDS analysis, their concentration at the scale surface was found to be in lower proportion and was negligible near to the internal oxides at the substrate. This site is called corrosion front [29]. Thus, it also means that depleted layer below the corrosion front consisted of Cl, S rather than Na and K. This reaction proceeded in such a way that oxides were first dissociated/broken by chlorine and then chlorine proceeded towards attacking the internal oxides. Potassium and sodium were not found to proceed/propagate below the corrosion front. This phenomena or process of attack by chlorine rather Na, S, K was reported by Yohaness et al [3], Li et al [30] and Peterson et al [6]. The chromium and iron were depleted from the surface and consumed by K and Na whereas, chlorine and sulphur associated with Ni and Fe formed NiCl2, FeCl2, FeS, NiS and made the reaction to proceed towards the depleted zone.
4.3.2. Correlation of EPMA analysis with free energy data
It is clear from the EPMA analysis that chromium and iron played major role in prevention of the protective layer. The colour contrast for each individual element shows that the scale formed from the exposure at 650 °C with SM1 and SM2 clearly reveals that iron oxides converted in the form of FeCl2, FeS and chromium oxides in the form of CrCl2/CrCl3, CrS, have been all over the surface region. In the case of corrosive oxides at the surface scale, it is also revealed that, iron and chromium oxide ((Cr, Fe)2O3) have reacted with K and Na and formed low melting eutectics with (Na, K)–Fe–O and (Na, K)–Cr–O over the scale.
As shown in the table 8 ΔG values were calculated by standard free energy equation for the phases formed during the process of corrosion. Among all the ΔG values presented for the different oxides, it is evident that Cr2O3 is the most stable and formed rapidly in the process of corrosion at any temperature. In case of the chlorides, CrCl2/CrCl3, KCl and NaCl, were found to be more stable from 500–650 °C and the most unstable phase was MnCl2. In the case of sulphur compounds, FeS(α) has the highest tendency of formation among the sulphides and has higher melting point. It is important to understand that the volatilization of chlorides and sulphates played important role in the process of corrosion. Also, from the table 8 it can be observed that Fe–Cl system has low stability than that of FeS system and it is highly volatile and due to high vapour pressure its inward and outward movement has been highly effective in the generation of porous layer. Focusing on the values of ΔG for KCl and NaCl, it should be noted that the values at 500–650 °C are almost comparable [31]. Another important observation in the present investigation is that the ratio of Na:K is same and there is difference only in the ratio of Cl:S. From the tables 4 , 6 and 8 and EPMA analysis it can be summarized that in the formation of scale at the chromium, iron and oxygen play the important role. Below the corrosion front it can be seen that the content of iron, chromium, nickel oxides as well as their chlorides/sulphates are highly stable at 500 °C, while they are unstable at 650 °C. The observed results are in line with the reactions of corrosion with high content of chlorine than sulphur.
5. Conclusion
Hot corrosion behavior of the 904 L steel was studied in synthetic biomass environment of the salts NaCl, Na2SO4, KCl and K2SO4, in salt mixtures SM1 and SM2 with ratios of Cl:S 40:60 and 60:40 respectively, from 500 to 650 °C under cyclic hot corrosion up to 100 h and following conclusions are drawn from this investigation:
- 1.The weight gain from hot corrosion with both the salt mixtures SM1 and SM2 was very less in the initial five hours of exposure at 500 °C–650 °C. At 600 °C–650 °C there was rapid gain in weight during the exposure from 5–25 h, however, the weight gain was drastically reduced during 25–100 h and dual slope behavior was exhibited. In general, near parabolic rate law was followed.
- 2.The damage from hot corrosion resulting from the salt mixture SM2 was much higher than that from SM1. Cross section analysis of the samples corroded at 650 °C showed that the depth of attack with the salt mixture SM2 was ≈31–33 μm whereas it was ≈16–17 μm with the SM1.
- 3.Surface morphology of the hot corroded samples was found to be strongly dependent on the test temperature and Cl:S ratios. The sample coated with the salt mixture SM1 showed needle like morphology of the corrosion products, whereas those coated with the SM2 revealed globular morphology.
- 4.XRD and SEM-EDS analysis of the hot corroded surfaces showed formation of alkali chromates: Na2CrO4, K2CrO4; chlorides FeCl3, NiCl2 and sulphides FeS, CrS; which played detrimental role in the process of corrosion.
Acknowledgments
The authors are thankful to Prof. N V C Rao and Dr Dinesh Pandit, Department of Geology, Institute of Science, B.H.U., Varanasi for providing EPMA facility.