
Abstract
As an essential task in data mining, outlier detection identifies abnormal patterns in numerous applications, among which clustering-based outlier detection is one of the most popular methods for its effectiveness in detecting cluster-related outliers, especially in medical applications. This article presents an advanced method to extract cluster-based outliers by employing a scaled minimum spanning tree (MST) data structure and a new medoid selection method: 1. we compute a scaled MST and iteratively cut the current longest edge to obtain clusters; 2. we apply a new medoid selection method, considering the noise effect to improve the quality of cluster-based outlier identification. The experimental results on real-world data, including extensive medical corpora and other semantically meaningful datasets, demonstrate the wide applicability and outperforming metrics of the proposed method.
Export citation and abstract BibTeX RIS

Original content from this work may be used under the terms of the Creative Commons Attribution 4.0 license. Any further distribution of this work must maintain attribution to the author(s) and the title of the work, journal citation and DOI.
1. Introduction
Outlier detection benefits numerous applications since outliers often contain potentially valuable information. According to Hawkins, outliers are unusual patterns in the dataset that deviate greatly from others and are generated by abnormal behaviors [1]. What should not be overlooked is that outliers may embody more valuable information than general patterns, as they could imply abnormal behaviors or potential new patterns, which is consistent with real-life situations [2, 3]. In recent decades, outlier detection has become increasingly popular for its practical and meaningful use, such as fraud detection [4, 5], medical diagnosis system [6], network intrusion detection, and commercial fraud detection. Take medical diagnosis systems as an example. Outliers could be patient data, while healthy people's data are typically represented as normal samples.
In many previous works, researchers mixed the term outlier or anomaly [7, 8], sometimes even surprise [9, 10], discord [11, 12], unusual [13], and novelty [14]. In [15], the authors provided a criterion to distinguish outliers and anomalies for time series: Outlier is mostly used when detecting unwanted data, whereas anomaly has been used when detecting events of interest. This article is for discrete rather than time-series datasets. The datasets used are named after outlier detection, and the various state-of-the-art workpieces that performed experiments on these datasets are also generally titled outlier detection. Therefore, we follow the peer work to use outliers in this article, instead of anomalies, to refer to samples that deviate from most points. Occasionally, inlier, the antonym of outlier, is also used.
Outliers/anomalies/novelties contained in time series, such as biosignals, can be detected by pattern analysis based on training or pure statistical models, for which state-of-the-art techniques include the search for novelty [14] and subsequence [16] for biomedical corpora. Outliers in datasets composed of discrete points, which is the research object of this article, can be studied using graph theory algorithms or model training. Distance-based [17, 18], density-based [19, 20], and clustering-based [21] technologies are the three dominant methods of outlier detection. Distance-based methods are effective in identifying global outliers, but they are intensely weak when local outliers exist in the dataset consisting of different densities. In addition, they are not feasible for large-scale high-dimensional datasets due to the high computation cost of pairwise distance. Density-based techniques are good at finding local outliers in the dataset composed of various densities but are unfavorable for global outliers.
For decades, many efforts have been put into the use of clustering methods for outlier detection, such as OPTICS [22], DBSCAN, BIRCH, STING, and ROCK. He et al put forward a cluster-based local outlier concept and detection method, FindCBLOF, in 2003 [23], where the 'cluster-based local outlier factor' was employed to identify the outlierness of each data point. Only categorical attribute data can be processed by this method. It is worth mentioning that there are differences between clustering and outlier detection. The chief goal of clustering is to separate clusters, viewing the outliers as noise, while outlier detection aims at identifying outliers. Lately, deep learning-based outlier detection methods have attracted interest, for which it is necessary to divide a dataset into a set for neural network-based training and a set for validation. Then, a neural network is trained on the training dataset and evaluated on the test set. The prerequisite is a large amount of clean data.
Returning to traditional graph theory, whose validity has been repeatedly proven, the minimum spanning tree (MST) is a widely accepted data structure often considered pivotal in clustering [24]. MST-based clustering is competent for datasets containing multiple shapes but not for datasets containing multiple densities [25]. On the latter, the primary disadvantage of traditional MST-based clustering is that cutting inconsistent edges may result in normal points in small clusters being deemed as outliers in a dataset with various densities.
In most cases, several clusters can be obtained by repeatedly cutting the longest edges. Subsequently, the clustering-based outlier detection method computes the outlierness degree of the points according to a given outlier factor computation method. For instance, k-means uses the mean value of the pairwise distances of all points in a cluster as centroids, and the outlier indicator is the distance to the centroids, which is sensitive to noise.
This article introduces an advanced outlier detection method to overcome the above-mentioned problems using a scaled MST and a novel medoid selection strategy. Our previous work proposed a scaled MST-based algorithm to improve traditional MST [26], whose clustering results validated its effectiveness in various datasets containing multiple densities. Based on this result, we extended the framework to outlier detection. In analogy to traditional MST-based clustering methods, we build an MST and iteratively cut the longest edge to obtain several clusters. A novel medoid selection method, which computes the sum distance to other points in the cluster [27], is further employed to find the reasonable cluster centers. The degree of outlierness is obtained by computing the distance between the point and the medoid, and a top-n strategy outputs outliers.
It is worth mentioning that ensemble machine learning (ML) has also entered the field of vision of researchers [28–32]. It integrates a series of classical, mature, and validated outlier detection methods to optimize global performance for individual tasks. Since the ensemble ML-based outlier detection work does not propose any new methods itself but adopts various existing methods, the judgment of the ensemble OD results depends on the comparison with other ensemble learning models. This article proposes a novel OD method and validates its feasibility through sufficient experiments; therefore, ensemble ML is not included in this work. The proposed method can be added to various types of ensemble ML research in the future to work together with other peer algorithms.
The remainder of this article is organized as follows. Section 2 introduces the problems of existing methods related to the traditional MST algorithm and centroid selection for outlier detection. Section 3 presents our novel clustering-based outlier detection method using a scaled MST and a new medoid selection strategy. Section 4 elucidates a set of experiments on synthetic and real-world medical datasets, as well as some semantically meaningful datasets, and comparisons with state-of-the-art technologies. Section 5 concludes our work.
2. Existing methods and their limitations
2.1. MST
Given N samples in a d-dimensional Euclidean space, an MST is a tree connecting all vertices whose weight is the smallest in all spanning trees. Classical MST construction methods include Prim, Kruskal, and Boruvka. Prim initializes the tree with a random point and iteratively adds the nearest point until all points are included. Kruskal computes all data points' pairwise distances as the edge weights, generally denoted by the Euclidean distance, and sorts the weights in non-decreasing order. Subsequently, the current smallest edge is added stepwise until a circle is formed in the tree.
Traditional MST-based clustering can identify clusters with different shapes and view outliers as noise; meanwhile, it performs weakly on different-density datasets. Figure 1 illustrates a classic problematic case of traditional MST-based outlier detection.

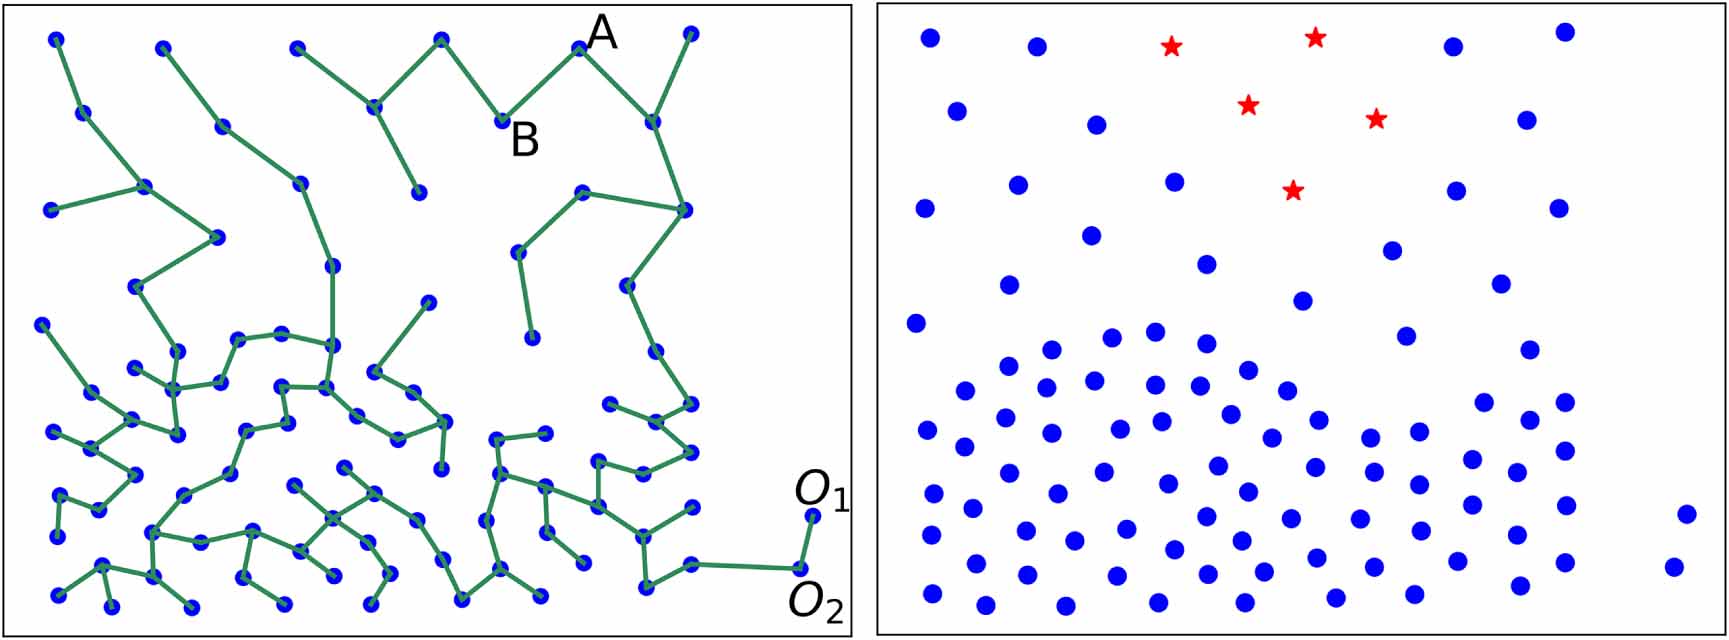
Figure 1. A problematic Prim-based outlier detection on data with different densities. Left: Prim MST; right: outlier outputs after cutting the longest edge AB; O1, O2: true outliers.
Download figure:
Standard image High-resolution imageAmong the data points in figure 1, there are two clusters with different densities and two outliers close to the dense cluster. The edge weight between the outlier and the dense cluster is higher than the sparse cluster's density. Here 'density' means the average distance between all data points. Figure 1(left) illustrates the Prim MST, where the longest edge AB should be cut to obtain clusters or outliers. In the case of outlier existence, if the cut results in a tiny proportion of the dataset, the results can be deemed outliers, as demonstrated in figure 1(right). Evidently, Prim outputs five outliers in the sparse cluster, but misses two truths, mainly because the longest edge lies in the sparse cluster rather than connecting the clusters and outliers.
2.2. Centroid selection
The outlier factor in clustering-based outlier detection can be calculated as the distance to the centroid (the point with the mean value of all pairwise distances in the cluster) of the cluster. When the cluster shape approximates a circle, the outlier factor represents the deviation degree of a point to the center. Inappropriate selection of cluster center is a common problem that interferes with outlier detection results, as figure 2 instances. The points O1, O2, O3, and O4 among the source points in figure 2(left) are supposed to be outliers, and the other points form a cluster. Based on the distances between each point and the calculated center C in figure 2(right), the first four outlier hypotheses are ordered as R1, R2, R3, and R4, beyond which two true outliers, O1 and O2, cannot be detected.

Figure 2. A problematic centroid-based outlier detection, Left: ground truth: right; hypotheses; O1, O2, O3, O4: true outliers; C: calculated cluster centroid; R1, R2, R3, R4: outlier outputs from the centroid-based method.
Download figure:
Standard image High-resolution image3. Proposed method
3.1. Ideas for methodological improvements
Inspired by the problems mentioned in section 2, this work proposes constructing an advanced MST with the longest edge connecting clusters and outliers. Observation on representative datasets yields the hypotheses that edges within the same cluster tend to have approximate Euclidean distances, which is not the case for edges connecting two clusters. Therefore, a scaled distance was designed to distinguish edges between clusters and outliers, such as PO2 in figure 3:
- The pairwise distance is computed using the Euclidean measure.
- The edge weight is calculated as the distance scaled by the weight of the edge last added to the tree [26].

Figure 3. A simple schematic of the proposed outlier detection method. Left: scaled Prim MST; right: outlier outputs after cutting the longest edge PO2; O1, O2: true outliers.
Download figure:
Standard image High-resolution imageGiven that the MST construction starts from a point in the shortest edge-containing cluster, the edge weights in the same cluster with uniform density approximate 1, while the weights of the edges connecting two clusters are less than their Euclidean distances. A scaled MST is obtained using the scaled distances as edge weights, as drawn in figure 3(left). The longest edge of this scaled MST, PO2, perfectly connects the clusters and outliers. Outliers are separated by cutting the longest edge, as delineated in figure 3(right), which exemplifies a solution for outlier detection in different density clusters.
3.2. Medoid selection and outlierness degree
The significant impact of noise on the center position is a major problem with existing center-based outlier detection. A medoid-based outlierness degree calculated method is employed to eliminate the influence of noise:
- For each point in a cluster, the distances between it and each of the rest of the points in the cluster are accumulated to its distance sum.
- The point with the smallest distance sum is chosen as the cluster medoid.
- The outlierness degree of a point is determined by its distance from the cluster medoid.
Figure 4 demonstrates an intuitive example: the point M is selected as the medoid derived from the dataset and the four farthest points of M are detected as outliers, corresponding to the ground truth.

Figure 4. Medoid selection and outlierness degree computation. Left: ground truth; right: hypotheses; O1, O2, O3, O4: true outliers; M: selected medoid; R1, R2, R3, R4: outlier outputs from the medoid-based method.
Download figure:
Standard image High-resolution image3.3. Outlier detection using MST and medoid selection (MS2OD)
In analogy to traditional MST-based clustering, scaled MST-based clustering iteratively cuts the longest edge to obtain a new cluster. The difference is that a scaled MST is constructed from the point in the shortest edge-containing cluster, and the edge with the smallest scaled distance instead of the Euclidean distance is iteratively added to the tree.
A scaled MST is computed using the scaled distance replacement of the Euclidean distance. Three arrays are employed to describe such an MST:
- parent array, whose elements correspond to the start points of the edges;
- (scaled) distance array, whose elements are the edge weights;
- edge array, whose elements are the edges denoted by a start point, an end point, and a weight.
Subsequently, the scaled MST is sorted in nondecreasing order to expediently find the longest edge of this tree, which is cut iteratively to obtain several clusters. The cluster to be generated is considered an outlier cluster whose points are all outliers if it contains fewer points than the predefined minimum number of points in a normal cluster  :
:

where N denotes the size of the dataset.
The degree of outlierness of each point is represented as its distance from the medoids, as detailed in algorithm 1. ScaledMST computes the new scaled MST using the scaled distance. Sort sorts the array according to the weight of the edge. CutTree iteratively cuts the longest edge to obtain several clusters using the depth-first search to find the parent of the points in the same cluster. If cutting the longest edge results in a large cluster whose number of points exceeds a predefined value, the cutting of the longest edge continues iteratively. such a value is proposed as
| Algorithm 1. The proposed MS2OD. |
|---|
Require:
![$[data]_N$](https://content.cld.iop.org/journals/2632-2153/5/1/015025/revision2/mlstad2492ieqn2.gif)
|
| Ensure: array of each point's outlierness degree |
1: ![$min_{\texttt{normal}} \leftarrow ROUND\left(\sqrt{\frac{N}{DIMENSION([data])}}\right)$](https://content.cld.iop.org/journals/2632-2153/5/1/015025/revision2/mlstad2492ieqn3.gif)
|
2: ![$[outlierness\_degree]_N \leftarrow [0, 0, \cdots]_N$](https://content.cld.iop.org/journals/2632-2153/5/1/015025/revision2/mlstad2492ieqn4.gif)
|
3: ![$[parent\_array]_N, [distance\_array]_N, [edge\_array]_N \leftarrow$](https://content.cld.iop.org/journals/2632-2153/5/1/015025/revision2/mlstad2492ieqn5.gif) ScaledMST ScaledMST![$([data])$](https://content.cld.iop.org/journals/2632-2153/5/1/015025/revision2/mlstad2492ieqn6.gif)
|
4: ![$[adjecent\_array]_N \leftarrow$](https://content.cld.iop.org/journals/2632-2153/5/1/015025/revision2/mlstad2492ieqn7.gif) the parent of each point in the parent of each point in ![$[data]$](https://content.cld.iop.org/journals/2632-2153/5/1/015025/revision2/mlstad2492ieqn8.gif)
|
5: ![$[clusters] \leftarrow$](https://content.cld.iop.org/journals/2632-2153/5/1/015025/revision2/mlstad2492ieqn9.gif) CutTree CutTree![$([adjecent\_array],$](https://content.cld.iop.org/journals/2632-2153/5/1/015025/revision2/mlstad2492ieqn10.gif) Sort Sort![$([edge\_array]))$](https://content.cld.iop.org/journals/2632-2153/5/1/015025/revision2/mlstad2492ieqn11.gif)
|
6: for
![$[cluster]$](https://content.cld.iop.org/journals/2632-2153/5/1/015025/revision2/mlstad2492ieqn12.gif) in in ![$[clusters]$](https://content.cld.iop.org/journals/2632-2153/5/1/015025/revision2/mlstad2492ieqn13.gif) do
do
|
7: if
![$LENGTH([cluster]) \lt min_{\texttt{normal}}$](https://content.cld.iop.org/journals/2632-2153/5/1/015025/revision2/mlstad2492ieqn14.gif) then
then
|
8: for
point in ![$[cluster]$](https://content.cld.iop.org/journals/2632-2153/5/1/015025/revision2/mlstad2492ieqn15.gif) do
do
|
9: 
|
| 10: end for |
11:  GetMedoid GetMedoid![$([cluster])$](https://content.cld.iop.org/journals/2632-2153/5/1/015025/revision2/mlstad2492ieqn18.gif)
|
| 12: end if |
13: for
point in ![$[cluster]$](https://content.cld.iop.org/journals/2632-2153/5/1/015025/revision2/mlstad2492ieqn19.gif) do
do
|
14:  Distance(point, medoid) Distance(point, medoid) |
| 15: end for |
| 16: end for |
17: Return ![$[outlierness\_degree]_N$](https://content.cld.iop.org/journals/2632-2153/5/1/015025/revision2/mlstad2492ieqn21.gif)
|

GetMedoid selects the medoid of a cluster, as clarified above. Each point's outlierness degree is measured as its distance from the selected medoid.
4. Experimental setup and results
4.1. Peer methods for comparison and experimental configurations
The usability of the proposed MS2OD algorithm is visualized using a typical synthetic dataset introduced in section 2.1, where the application of the traditional MST-based outlier detection algorithm would encounter difficulties, followed by a series of experimental analyses on real-world data.
The peer methods involved in comparisons with MS2OD include angle-based outlier detection (ABOD) [33], k-nearest neighbors (k-NN) [34], local outlier factor (LOF) [35], and one-class support vector machine (OCSVM) [36]. Traditionally, k-NN is a distance-based method that is effective in detecting global outliers. LOF proposed by Markus et al is widely used to evaluate the outlierness degree of points citebreunig2000lof, performing well in the dataset with different density distributions. LOF measures the difference between the samples' local density and their k nearest neighbors as the outlier factor, capturing exactly the relative degree of isolation. The choice of k can significantly influence performance.
All experiments were carried out on a computer with Intel® Core™ 3.2 GHz i5-3470 CPU and 4 GB RAM. The programming environment is Python 3.6.5. CFAR has been realized according to the original paper, while other peer methods are from the widely recognized Python outlier detection package [37], experimented with their default settings.
4.2. Illustrative comparison on a typical synthetic dataset
As figure 5 illustrates, the two-dimensional synthetic dataset of 98 samples contains two clusters of different densities, colored blue and green, respectively, while there are two outliers colored red. The two outliers are closer to the denser cluster. The distance between the outliers and the denser cluster is greater than that between the two clusters. MS2OD worked perfectly: cutting the longest edge results in correct outliers. ABOD, k-NN, and LOF managed to detect the true outliers, accompanied by more false positives at the boundary of the sparser cluster. OCSVM failed to find the true outliers and gave numerous wrong hypotheses within the sparser cluster.

Figure 5. Outlier detection results of MS2OD and four state-of-the-art methods on a two-dimensional dataset consisting of two clusters with different densities.
Download figure:
Standard image High-resolution image4.3. Real-world datasets
The proposed MS2OD and the four peer algorithms were tested on 12 real-world datasets, of which Cardio, Pendigits, Pima, and Shuttle are from Outlier Detection DataSets 7 (ODDS) [38], and the other eight are from the 'DAMI results' repository 8 , categorized in 'datasets used in the literatureture' and 'semantically meaningful datasets.' Most of the datasets experimented with are in the medical domain, including cardiotocographs, diabetes, breast cancers, heart diseases, hepatitis, and Parkinson. In addition, some representative datasets in other fields are involved. Table 1 lists the statistics of all datasets applied.
Table 1. Statistics of the applied real-world datasets. #: Number of; ODDS: Outlier Detection DataSets; DAMI-L: the 'datasets used in the literatureture' category of the 'DAMI results' repository; DAMI-S: the 'semantically meaningful datasets' category of the 'DAMI results' repositoy.
| Repository | Dataset | #samples | #outliers | #attributes |
|---|---|---|---|---|
| OODS | Cardio | 1831 | 176 | 21 |
| OODS | Pendigits | 6870 | 156 | 16 |
| OODS | Pima | 768 | 268 | 8 |
| OODS | Shuttle | 49 097 | 3511 | 9 |
| DAMI-L | KDDCup99 | 48 113 | 200 | 40 |
| DAMI-L | Stamps | 315 | 6 | 9 |
| DAMI-L | WBC | 223 | 10 | 9 |
| DAMI-L | WDBC | 367 | 10 | 30 |
| DAMI-S | HeartDisease | 153 | 3 | 13 |
| DAMI-S | Hepatitis | 74 | 7 | 19 |
| DAMI-S | PageBlocks | 5013 | 100 | 10 |
| DAMI-S | Parkinson | 50 | 2 | 22 |
4.4. Metrics
Outlier detection is a binary classification task, and thresholds are often set empirically or need to be tuned. Therefore, the receiver operating characteristic (ROC) curves [39] were applied in our work to evaluate the performance of the models. The ROC curve defines false positive rates (FPR) at different thresholds as the X-axis and the corresponding true positive rates (TPR) as the Y-axis, for which

and

respectively. Since the choice of threshold often has a significant impact on the detection results, the ROC curve could comprehensively reflect the global performance of different models. In our work, the outlierness degree judges whether a point is an outlier.
As a more direct numerical basis, the area under the curve (AUC) of ROC, denoted AUC-ROC, was used to objectively and uniformly judge the performance of each model on each dataset.
4.5. Results
The AUC-ROC values of MS2OD and four other peer methods on 12 real-world datasets are summarized in figure 6 and table 2, while the corresponding ROC curves are demonstrated in figures 7–9.

Figure 6. AUC-ROC values of the five models on 12 real-world datasets.
Download figure:
Standard image High-resolution image
Figure 7. ROC curves of the five models on four real-world datasets from Outlier Detection DataSets (ODDS). FPR: false positive rate; TPR: true positive rate.
Download figure:
Standard image High-resolution image
Figure 8. ROC curves of the five models on four real-world datasets from the 'datasets used in the literatureture' category of the 'DAMI results' repository. FPR: false positive rate; TPR: true positive rate.
Download figure:
Standard image High-resolution image
Figure 9. ROC curves of the five models on four real-world datasets from the 'semantically meaningful datasets' category of the 'DAMI results' repository. FPR: false positive rate; TPR: true positive rate.
Download figure:
Standard image High-resolution image
Table 2. AUC-ROC values of the five models on 12 real-world datasets.  M,O
M,O : AUC-ROC(MS2OD) - AUC-ROC(OCSVM); bold: first place; underlined: second place.
| Dataset | ABOD | k-NN | LOF | OCSVM | MS2OD |
 M, O M, O
|
|---|---|---|---|---|---|---|
| Cardio | 0.5446 | 0.6861 | 0.5458 | 0.9352 | 0.9271 | −0.0081 |
| Pendigits | 0.6407 | 0.7087 | 0.4794 | 0.9354 | 0.8636 | −0.0718 |
| Pima | 0.5987 | 0.6076 | 0.5384 | 0.5393 | 0.6894 | +0.1501 |
| Shuttle | 0.5761 | 0.7039 | 0.5552 | 0.7249 | 0.9924 | +0.2675 |
| KDDCup99 | 0.7686 | 0.8614 | 0.5844 | 0.9877 | 0.9861 | −0.0016 |
| Stamps | 0.9169 | 0.9218 | 0.9024 | 0.9029 | 0.9415 | +0.0386 |
| WBC | 0.8991 | 0.9920 | 0.8714 | 0.9944 | 0.9939 | −0.0005 |
| WDBC | 0.9922 | 0.9964 | 0.9952 | 0.6647 | 0.9964 | +0.3317 |
| HeartDisease | 0.8400 | 0.8978 | 0.8733 | 0.2689 | 0.9222 | +0.6533 |
| Hepatitis | 0.5672 | 0.6119 | 0.6418 | 0.4243 | 0.8607 | +0.4364 |
| PageBlocks | 0.8601 | 0.8522 | 0.8096 | 0.9475 | 0.9357 | −0.0118 |
| Parkinson | 0.7604 | 0.8646 | 0.2656 | 0.2188 | 1.0000 | +0.7812 |
5. Evaluation and discussion
5.1. Outlier detection datasets (ODDS)
Cardio is a classification dataset that measures fetal heart rate and uterine contraction features using cardiotocographs, categorized into normal, suspect, and pathological classes [40, 41]. By downsampling, 176 pathologic patterns are marked as outliers, while the normal class includes 1655 patterns. MS2OD and OCSVM performed much better than the other three models on Cardio, with ABOD and LOF performing close to a random binary classifier. OCSVM converges to a perfect classifier slightly earlier than MS2OD on the ROC curve, resulting in a slight AUC-ROC advantage of 0.0081.
Pendigits (Pen-Based Recognition of Handwritten Digits) is a multiclass dataset with 16 features [42]. Among the total of 6870 data points, 176 are outliers. Similarly to the results on Cardio, MS2OD and OCSVM vastly outperformed the other three models on Pendigits, with ABOD being even worse than the random classifier. The ROC curve for MS2OD starts to climb later than for OCSVM, but has a large slope, allowing it to approach the perfect classifier earlier.
Pima Indians Diabetes Database is a two-class dataset with eight attributes, including 500 healthy individuals and 268 patients [43]. MS2OD's ROC curve shows its ability to perform better than the other four, whose curves wander around random classification, indicating that the corresponding models have little predictive value, including OCSVM, the close winner in the above two sets. The AUC-ROC values evidence that the second place is k-NN.
Shuttle, containing the most data points among all the datasets applied in this work, is used to validate the models on massive data volume situations. It involves six classes, where the 45 586 patterns in class #1 are normal points, and the rest are assigned outliers. MS2OD was ahead of the pack with a near-perfect ROC curve. k-NN and OCSVM could basically work, with significant decreases in AUC-ROC (0.2675 and 0.2885) compared to MS2OD, while ABOD and LOF were almost uninformative classifiers.
In general, although OCSVM performed well on two of the four ODDS datasets, it was almost no different from the random classification on Pima, a critical medical dataset. ABOD and LOF clearly struggled with the scoring line of random classifiers. k-NN can be described as 'always managing to work, but not excellently.' MS2OD, on the one hand, performed well, and well enough to be stable, for it did not have any upsets, such as OCSVM on Shuffle. On the other hand, even though it has not obtained the top AUC-ROC values on Cardio and Pendigits, its results were within a small breadth of the top spot, where its performance can also be validated in the graceful ROC curves.
5.2. DAMI's 'datasets used in the literatureture' category
KDDCup99 collects various types of network attacks or intrusions, from which the representative KDDCup99_withoutdupl_norm_idf with 48 113 patterns, including 200 outliers, was experimented. Its data preprocessing is described in [44, 45]. It is worth mentioning that, regarding the number of data points and the number of features jointly, this dataset is the largest in terms of data size used in this work. Like Shuttle, it provides a referential indication of the model performance on massive data. MS2OD and OCSVM were almost tied with an AUC-ROC difference of 0.0016, performing almost ideally. ABOD, k-NN, and LOF could also play a role, with the ROC of LOF barely reaching the desired state.
Stamps consists of forged and genuine stamps, characterized by 9 features of color and printing property [46], from which Stamps_withoutdupl_norm_02_v09 of 309 genuine and 6 forged stamps were applied. All the models performed well, with MS2OD being the best of the bunch. OCSVM's ROC curve looks lagging overall, also reflected in its AUC-ROC penultimate ranking.
WBC consists of two types of cancer, benign and malignant (outliers) [47], from which WBC_withoutdupl_norm_v04 (10 outliers and 213 inliers by downsampling) was used in the experiment. All models were workable, where MS2OD and OCSVM were in the top class with a very insignificant margin (an AUC-ROC difference of 0.005), followed by k-NN.
WDBC is a medical dataset related to the nuclear characteristics of breast cancer, where benign is viewed as inliers and malignant as outliers. WDBC_withoutdupl_v08, as a representative for the experiment, contains 10 outliers and 357 inliers according to the preprocessing introduced in [48]. ABOD and LOF, which had been underperforming, and k-NN, which had been mediocre, made a clean sweep on WDBC, with a performance close to that of MS2OD in the first place. Of concern is the poor performance of OCSVM with an AUC-ROC value of 0.6647.
Taken together, OCSVM, the strongest competitor of MS2OD in this work, suffered another failure on the important cancer dataset, WDBC, and did not shine on Stamps. On the contrary, the performance of MS2OD has always been stable and there was no staggering performance on any dataset. An additional observation is that agile methods, such as ABOD and k-NN, were generally competent on small-scale datasets, although suboptimally.
5.3. DAMI's 'semantically meaningful datasets' category
HeartDisease is a medical dataset on heart problems, from which HeartDisease_withoutdupl_02_v02, composed of 3 outliers of patient patterns and 150 healthy patterns, took part in the experiment. MS2OD is evidently superior from the illustration and the only AUC-ROC value over 0.9. OCSVM flopped once again and arguably even came close to being antipredictive. Not to mention that ABOD, k-NN, and LOF worked much better than OCSVM.
Hepatitis is a prediction dataset with respect to whether patients suffering from hepatitis die (outliers) or survive, from which Hepatitis_withoutdupl_norm_10_v03 of 7 outliers and 67 inliers participated in the model validation. In a result where all the methods were less than ideal, MS2OD came out on top, pulling its binary prediction away from the random classification baseline. MS2OD achieved an AUC-ROC value of 0.8607, way above other models whose AUC-ROC values did not exceed 0.65. The diametric opposite remains the inferior performance of OCSVM over random classifiers. LOF grabbed second place for the first time,
PageBlocks, as another extension of the scope of applied datasets, collects information about various types of blocks on document pages, where textual and graphical content documents are viewed as normal patterns and outliers, respectively. PageBlocks_norm_02_v04, containing 100 outliers among 4913 textual documents, entered an experimental session. All models achieved usable results on such a moderately sized dataset. OCSVM returned to first place, where MS2OD was closely behind, with an AUC-ROC difference of 0.0117. It is worth noting that LOF, which has been out of the competition in many significantly distinguishable results, converges to perfect values at the end of the ROC curve earlier than ABOD and k-NN.
Parkinson, the last dataset used in this work, is another medical one aiming to identify healthy individuals from those suffering from Parkinson's disease, taking advantage of 22 features. Parkinson_withoutdupl_05_v04, consisting of 48 inliers and 2 outliers, was engaged in the model evaluation. MS2OD achieved perfection, the only full score across all models and datasets in this article. k-NN reached a favorable score that left the remaining algorithms behind; meanwhile, OCSVM exposed its dramatic uninformativity to be in the same poor stage as LOF.
Overall, OCSVM rolled over on all three small-scale datasets of DAMI-S without exception, worse than it did on DAMI-L. It worked even more weakly on such types of datasets than ABOD, k-NN, and LOF. Although OCSVM performed satisfactorily on the remaining medium-sized dataset PageBlocks, it did not demonstrate a distinguishable advantage over its most potent rival, MS2OD, which is as stable as ever in the first place or occasionally in second place with a slight gap.
5.4. Comprehensive analysis
First, let us put aside the widely adopted lightweight algorithms ABOD, k-NN, and LOF, whose performance in this work was consistently in the middle of the pack and sometimes poorly. The only noteworthy is that in cases where MS2OD came out on top, the second place was frequently k-NN (five times) and once LOF. On the corresponding six datasets, they performed far better than OCSVM.
Regarding the effect of data volume, for medium- to massive-scale datasets, OCSVM's performance is generally good, but there are cases where it is unsatisfactory. For instance, on Cardio, Pendigits, KDDCup99, and PageBlocks, OCSVM is decent. Notably, MS2OD is no slouch on these four datasets, as evidenced by the two models' very close ROC curves and AUC-ROC differences (−0.0081, −0.0718, −0.0016 and −0.0118, respectively). However, for the other two medium- to large-scale datasets, Pima and Shuffle, the first-place MS2OD embodies a sizable gap to OCSVM, where the AUC-ROC differences amounted to 0.1501 and 0.2675. Once the data size is small, OCSVM has a great possibility of being overwhelmed, reflected primarily by its dramatically poor results on the four medical datasets WDBC, HeartDisease, Hepatitis, and Parkinson, where MS2OD is proud to be good enough. The AUC-ROC differences between them are astonishing 0.3317, 0.6533, 0.4364 and 0.7812.
From the perspective of model robustness, MS2OD, which was in the first position in the vast majority of cases, performed quasi-optimally if it was occasionally slightly exceeded by OCSVM, reflected by the five subtle AUC-ROC differences −0.0081, −0.0718, −0.0016, −0.005, and −0.0118. For comparison, in cases where OCSVM was surpassed by MS2OD, OCSVM often went close to or far inferior to random binary classifiers.
In terms of application domains, OCSVM functioned well on nonmedical datasets like Pendigits, KDDCup99, and PageBlocks, but performed alarmingly on the five medical datasets, Pima, WDBC, HeartDisease, Hepatitis, and Parkinson. Only its results on Cardio and WBC were reassuring. The consistently smooth performance of MS2OD ensures a confident claim of its broad applicability for outlier detection on medical data.
5.5. Comparative analysis with dataset-targeting and ensemble learning methods
In the early stage of the outlier detection research, some datasets were released and applied in order to highlight the good performance of some proposed outlier detection methods, and later certain new outlier detection approaches were initially introduced for specific kinds of datasets, many of which ushered in a wider range of usages afterward. Some literature on the above-mentioned cases has been further investigated for additional comparable references:
- The performance on Cardio was one of the highlights at the time the LODES was proposed [41], with an AUC-ROC value of 0.7208 (MS2OD: 0.9271).
- The highest AUC-ROC obtained via OneClassSVM in [49] is 0.99, similar to MS2OD (0.9924). This paper was devoted to various unsupervised ML models only on Shuttle.
- Using the data decomposition method, the recent work [50] obtained the best AUC-ROC of 0.9199 in PageBlocks (MS2OD:) ß.9357.
- The state-of-the-art mean-shift outlier detection (MOD+) [9], which has recently gained a lot of attention, was applied to six real-world datasets, five of which overlap with our work. Their best AUC-ROC results are as follows: Parkinson: 0.70 (MS2OD: 1.0000), KDDCup99: 0.93 (MS2OD: 0.9861), Pima: 0.70 (MS2OD: 0.6894), PageBlocks: 0.88 (MS2OD: 0.9357), and Stamps: 0.90 (MS2OD: 0.9415).
As introduced in section 1, ensemble ML is being increasingly applied to study outlier detection. Since this article aims to propose and validate a new algorithm, it is not possible to conduct large-scale ensemble ML experiments, which will be one of the goals of future research. Still, for some individual datasets applied in this work, some results in other literature on ensemble ML can be found.
- The classical feature bagging work [51] obtained a best global AUC-ROC of 0.839 on Shuttle using the cumulative sum approach (MS2OD: 0.962). Furthermore, the ROC curves on KDDCup99 using the three approaches of [51] are inferior to the ROC curve of MS2OD in figure 8.
- The optimal AUC-ROC on Shuttle achieved by the mixed ensemble approach introduced in [45] is 0.871 ± 0.016 (MS2OD: 0.962).
- The feature bagged subspaces for outlier detection algorithm [52] on KDDCup99 achieves the AUC-ROC of 0.7207 (MS2OD: 0.9861).
- Using the support vector data description (SVDD) as a base detector, the lately proposed selective feature bagging algorithm [53] reaches an AUC-ROC value of 0.9605 on WDBC (MS2OD: 0.9964).
6. Conclusion
Clustering-based outlier detection is a critical technique in data mining fields, where MST is a functional data structure in many real-world applications. This article proposed an advanced MST and medoid selection-based outlier detection method, MS2OD. A scaled distance was applied to distinguish inconsistent edges between clusters and outliers to accommodate datasets that combine clusters of different densities. A novel medoid selection strategy was introduced to address the effect of noise on the selection of cluster centroids. The result visualization on a typical synthetic dataset intuitively exhibited the methods' usability. Moreover, experiments on real-world medical and other domain datasets verified the proposed method's effectiveness and broad applicability. The performance of MS2OD on medical datasets deserves to be taken with encouragement. Incorporating MS2OD into existing or innovative ensemble ML frameworks to make it more useful along with peer algorithms is also a promising research direction.
Acknowledgment
We extend our sincere gratitude to Xiaochun Wang for her help in conceptualization and methodology. This work was started with the support of the Fund for which she was responsible.
Data availability statement
No new data were created or analyzed in this study.
Funding
The APC was funded by the Open Access Initiative of the University of Bremen and the DFG via SuUB Bremen.