Abstract
This paper presents analytic expressions for calculating bounding conditions for pitting under atmospheric conditions. These expressions allow the prediction of the maximum pit size that can develop under known atmospheric conditions by considering the factors that can control the inherent galvanic coupling between a circular pit under a thin electrolyte layer surrounded by a concentric cathodic area. Expressions are developed for the maximum cathodic current and the minimum anodic current required for pit stability. An analytic expression for the maximum cathodic current that the surrounding area can supply to the pit is developed and validated by comparison to calculations using the finite element method. The effects of the controlling environmental parameters (deposition density and relative humidity) on the cathode bounding parameters are explored, as is the effect of the size of the pit. The analytical expression for the maximum cathodic current is then coupled to the Galvele pit stability product to estimate the maximum pit size that could develop for a given set of environmental conditions. Those results are then compared to data available in the literature from outdoor exposures of stainless steels for up to 26 years.
Export citation and abstract BibTeX RIS
Corrosion resistant alloys such as stainless steels rely on their passive films for the maintenance of their characteristically low dissolution rates. Under most conditions, this film provides outstanding protection against uniform corrosion. Corrosion resistant alloys do suffer from localized corrosion when discrete locations lose this protection. It is generally accepted that such local loss of protection occurs spontaneously in the presence of aggressive ions, although in most cases, the alloy surface is able to repassivate the failed oxide film, thereby limiting the damage. These metastable events have been the subject of many investigations1–4 to understand the underlying processes that lead to the more damaging, stable pits. Models have been constructed that relate the frequency of metastable pitting to the likelihood of stable pitting.1–3, 5 Such models are of use for predicting the likelihood of corrosion damage occurring in service if the material and exposure conditions are known, although they generally do not predict the extent of damage, although there are exceptions.5 In many applications of corrosion resistant alloys, only stable pitting creates sufficient damage to be of concern. Others have fit exposure data to develop empirical power laws for pit propagation6

where  is the maximum pit depth measured,
  is the exposure time, and
  and
and  are constants that depend on the material and environment. While useful for the environments and materials used in the exposure testing, such approaches are difficult to extend to other material/environment systems as the underlying factors controlling pit size are usually not clearly delineated.
In applications where the intended service life is very long, it may be considered unwise to extrapolate empirical power laws to times orders of magnitude beyond the test period used. Under these circumstances, it would be preferable to be able to calculate the largest pit size possible for the given material/environment system. The existence of limiting pit sizes has often been ignored in laboratory studies of pitting in which power laws are fitted to current decays to determine the power law exponent, which, if near 0.5, is often considered to implicate diffusion as the process controlling the growth of the pit. Data from exposures to natural environments exist for a range of materials in which exposure times of 10 years or more clearly show a plateau in the size of the largest pits.7, 8
The origins of such pit size limits can be analyzed in terms of the galvanic couple that constitutes a localized corrosion site such as a pit. Under freely corroding conditions, a pit (the anode in the galvanic couple) can grow only as long as its anodic current is matched by cathodic current from the surrounding material.For corrosion to occur, four requirements must be met: (i) the existence of an anode, (ii) the existence of a cathode, (iii) an ionic path between the anode and the cathode, and (iv) an electrical path between the anode and the cathode. Limitations on pit size can thus occur due to limitations in the amount of anode current that can be generated in a pit environment, limitations in the amount of cathode current that can be generated, or ohmic drop between the anode and the cathode. As the anode and cathode are on the same piece of metallic alloy, the electrical path is never limiting. This paper presents an approach to quantitatively consider these possible limiters to pit size in the context of pitting under atmospheric exposure conditions. As described elsewhere,10–12 atmospheric exposure leads to the formation of a thin electrolyte layer on surfaces which can lead to significant ohmic drops over short distances when considering the high current densities expected in active pits. Such ohmic drops are of less importance under full immersion conditions, although the considerations described are qualitatively applicable.
Anode Limitations
As the damage associated with pitting occurs due to the anodic dissolution of metal, it is not surprising that the anode factors controlling pit propagation have received the lion's share of study.13–16 It has long been recognized that the chemistry within localized corrosion sites is substantially different from the bulk,17–19 with the pH being lower and the concentration of anions from the bulk electrolyte being higher than in the bulk. Such an altered electrolyte is required for stable pit propagation to prevent the formation of a passive oxide as exists on the remainder of the material surface. A substantial body of work is devoted to characterizing the critical occluded chemistry for different alloys20–23 using a range of methods. One quantitative framework for understanding the need for a critical solution chemistry was provided by Galvele.24–27
Galvele considered a one-dimensional pit with an active base and passive walls. He based his criterion for pit stability on the idea that for a pit to remain active, the solution chemistry at the corroding pit surface must be sufficiently aggressive as to prevent its repassivation by oxide formation. The aggressive solution is created by the hydrolysis of the metal cations produced by dissolution. Diffusion out of the pit acts to dilute this solution chemistry, but the geometry of the pit serves as a diffusion barrier. Thus, the dissolution rate (and subsequent hydrolysis which was assumed to be very rapid) must exceed the rate at which mass transport could sufficiently dilute the solution to allow repassivation. Galvele showed that for a one-dimensional pit of depth  , the product
  could be used to determine stability, where
  is the dissolution current density at the base of the pit. This parameter has become known as the pit stability product. The deeper a pit, the lower is the current density required at the base of the pit to maintain the acidic electrolyte needed to prevent repassivation. Galvele directly calculated the critical
  needed to maintain the lowered pH for many pure elements.
The Galvele approach has been extended to hemispherical pits, which more closely matches the topography seen in actual materials, as well as to corrosion resistant alloys. Hakkarainen13 and Gaudet et al.14 showed that for stable pits in stainless steels to propagate under potentiostatic control, the chemistry within the pit must be a large fraction of the saturation concentration (60–80%) of the metal chlorides associated with the alloy composition. Using a hemispherical diffusion analysis, it can be shown that a hemispherical pit geometry can remain stable as long as  exceeds a critical value.4, 28 Thus, the dissolution current from a pit must increase linearly with an increase in radius to maintain stability. The value for
  is simply 6.5 times the one-dimensional
  value due to geometry. Numeric values for the critical value of
  have been established for a range of metals and alloys,4, 29–31 and the concept has been validated in its ability to predict the transition of pits from metastable to stable.3, 4 The pit stability criterion can be understood as representing a threshold current required to be generated by a pit of a given radius to produce sufficient metallic cations for hydrolysis to maintain a sufficiently low pH against the action of diffusional dilution.
Cathode Limitations
Whereas the Galvele pit stability criterion represents a closed form solution for anodic requirements for pitting, no such criterion exists for the cathode. To the extent that most laboratory studies of pitting have involved polarization via a potentiostat, the role of the cathode in limiting pit development has been largely ignored. Nonetheless, such limitations can exist for two principal reasons: limiting cathode kinetics and ohmic drop. The primary cathodic reaction of interest in aqueous solutions, oxygen reduction, exhibits notoriously sluggish kinetics. Thus, to provide the increasing cathodic current needed by a growing pit, the cathode surface must be increasingly polarized. In the absence of any other limitations, at some point, a pit grows to a size that requires a cathode current that cannot be obtained by the surrounding material at potentials above the reversible potential for metal dissolution in the pit environment. Actual cathode limitations occur under less extreme conditions because of the need for some level of overpotential for the high current densities (typically on the order of  ) needed for stable pitting. This required anodic overpotential manifests itself in the observation of repassivation potentials for localized corrosion. The overpotential may include both activation and concentration overpotentials, the latter of which may be associated with a salt film on the metal surface. Independent of the origin of the repassivation potential, if the external surface of the material is polarized below the repassivation potential, the experimental observation is that stable pits repassivate. At the repassivation potential, a cathode surface can only provide a finite current based on the kinetics of the reduction reactions occurring on the surface and its area.
Ohmic Limitations
Current passing through an electrolyte leads to ohmic drop. For atmospheric corrosion exposures, that electrolyte has limited dimensions, and thus even small currents can lead to substantial ohmic losses between the anode (pit) and the cathode surface. For this scenario, the ohmic drop is distributed, with the most active potentials (and thus highest cathodic current densities) being close to the pit mouth. With increasing distance from the pit, the interfacial potential rises due to the ohmic drop until the point is reached at which the interfacial potential is that of the open circuit potential of the cathode. At this point and all points further from the pit, no net cathodic current can be generated that can be used to support pit growth as all of the local cathode current is being used to balance the local passive (anodic) current density. Less conductive electrolytes lead to higher ohmic losses which limit the amount of cathode area that can interact with the pit, thus limiting the amount of cathode current available, and hence the pit current that can be supported.
Concept of Equivalent Cathode
Given these considerations, it would be of use to be able to directly calculate the maximum cathode current available, akin to the pit stability criterion that calculates the minimum anode current needed. The distribution of current density across a thin electrolyte cathode with nonlinear boundary conditions (e.g., Tafel behavior) would appear to make the development of a closed form solution difficult. Generally, one would use a numerical method such as finite element method (FEM) to calculate the current distribution along the cathode, given the boundary conditions, then integrate that current distribution over the cathode surface to determine the total cathode current. However, to understand pit stability, detailed information concerning the spatial distributions of the potential and current is not required. For the analysis of interest, only the total current delivered from the thin electrolyte cathode is needed.
Under these conditions, a cathode covered with a thin electrolyte of constant conductivity can be considered in terms of an equivalent electrode, as shown by Cui et al.10, 11 An electrode equivalent to a thin film cathode is one that would supply the same current if it were at the mouth of the pit in place of the actual cathode, with all other conditions (thickness of the electrolyte, composition of the electrolyte, and potential at the mouth of the pit) equal. If the equivalent cathode current can be easily calculated, its maximum value can be compared to the anode current needed for pit stability to determine if continued pit growth is possible.
Approach to Calculating Bounding Conditions
Calculation of the maximum cathodic current available can be achieved by consideration of the geometry shown in Fig. 1. The illustration shows a schematic of a circular cathode around a pit with both assumed to be covered by a thin electrolyte film. The radius of the pit is  and the radius of the circular cathode is
  with
with  much larger than
  , thus
  . The electrolyte layer thickness is WL. The conductivity of the electrolyte on the circular cathodic area is κ.

Figure 1. Schematic showing the circular cathode around a pit and the radial current flowing direction and current distribution.
For this geometry, the total cathodic current  is equal to the mean cathodic current density multiplied by the area of the circular cathode

where  is the total net cathodic current,
  is the equivalent cathode area,
  is the radius of the equivalent cathode, and
  is the equivalent current density. The equivalent current density is equal to the average current density determined by integration of the current density over the potential range from that at the cathode edge,
  , to the potential of the cathode area closest to the pit,
  . The repassivation potential is chosen as the potential at the mouth of the pit as it is the lowest potential at which pits can propagate; this approach would lead to the largest polarization of the cathode and thus the highest cathode current as required for a bounding calculation. The equivalent current density can thus be defined as

where  is the cathodic current density and
  is the passive current density of the cathode. The value of
  is the mean current density in the potential range between
  and
and  . Thus, given the current-potential behavior of a cathode surface
  ,
,  can be calculated according to Eq. 3. The radial current path leads to a potential drop
  across the differential annular element (Fig. 1) according to

The total potential drop  from the edge of the cathodic area
  to the edge of the anodic area
  can be obtained by integrating Eq. 4

By solving Eq. 2 for  and substituting the result into Eq. 5, one obtains

where  is Euler's number.
For a bounding calculation, the maximum cathode current  is found when the cathode is sufficiently large that the potential of
  reaches
  . From Eq. 6, we can derive the maximum cathode current calculation equation by integrating
  from
from  to
to 

where  and represents the maximum voltage difference possible between the mouth of the pit and any point on the surrounding cathode. In practice, an
  value is found as the intersection of two curves

and

According to Eq. 7,  increases with increasing
  and/or
  . Thus,
  increases with the increase in κ, WL, and
  , as expected intuitively and as found in the one-dimensional case previously presented.10, 11
Derivation of 

Approaching the derivation of the equation with a different goal in mind allows one to calculate the equivalent size of the cathode needed to reach  , which will be referred to herein as
  . Solving Eq. 2 for
  and
and  and substituting the results into Eq. 5, one obtains

As above, one obtains the  value by the intersection of the two sides of Eq. 10.
As κ, WL,  , and
, and  increase,
  also increases. If
  decreases,
  should increase, too. Of course

This cathode radius represents a minimum size of cathode needed because the equivalent cathode is more spatially efficient than actual cathodes.
These expressions (Eq. 6, 7, 10) are bounding because as the cathodic reactions proceed, the production of  from either water reduction or oxygen reduction increases the pH in the thin electrolyte, which for passive corrosion resistant alloys leads to a slowing of the electrochemical kinetics. Thus the total current from a cathode would tend to decrease with time in the absence of a substantial change in one of the other parameters. Although the hydroxyl acts to increase the conductivity, we are considering rather concentrated solutions already for atmospheric exposures, and precipitation of any dissolved metal ions tends to counteract the increase in conductivity by decreasing the cross-sectional area for conduction.32, 33
Although the analytical expression of Eq. 7 is an improvement over the need for full numeric simulations, it has limitations with regard to its application to actual atmospheric corrosion scenarios. Measurements and/or control of all of the parameters in Eq. 7 is very difficult, especially WL and κ. In addition, it implicitly assumes that WL, κ, and  solubility (needed for calculations of limit current density) are independent, but in reality, two other physiochemical parameters control these. As discussed in a previous work,10 the relative humidity (RH) and the amount of salt(s) present on the surface determine the electrolyte thickness and conductivity. The RH determines the equilibrium concentration of salt in solution through the deliquescent behavior of the salt(s) of interest.34, 35 The amount of salt [referred to herein as the deposition density (DD) in units of mass per unit area] can be used to determine the electrolyte layer thickness when combined with the equilibrium concentration. Correction must also be made for the effect of the concentration on the density of the solution, as it affects the electrolyte layer thickness. Thus, Eq. 7, 10 become


where DD is the salt DD  ,
,  is the concentration of the salt in solution
  , ρ is the density of the salt solution
  , and
, and  is the molecular weight of the salt (kg/mol).
Data for cases considered
To implement the approach for calculating  and
and  , data are needed for the cathodic polarization curve and the repassivation potential. For the present work, room-temperature cathodic polarization data of type 316 from Sridhar et al.36 were used for both types 304 and 316. A repassivation potential of
  was used for type 304 36 and a repassivation potential of −0.25 V saturated calomel electrode (SCE) was used for type 316 at room temperature.37 The passive current density in the cathode is assumed to be
  for both materials. Data for the deliquescence behavior of NaCl were taken from Frazier et al.34 as described in more detail elsewhere.10
To couple the cathode calculations to anode calculations, data for  are required. For a baseline, a value of 1 A/m was used for both stainless steels.
Results
In this section, the analytical expressions for  and
and  are first validated for a circular geometry by comparison to calculations using a numerical method, and the higher spatial efficiency of an equivalent cathode is demonstrated via
  . The effects of the environmental parameters of interest (DD and RH) on the cathode bounding parameters (
 and
and  ) are then explored, as is the effect of the size of the pit. One use of the calculations is then presented in which the Galvele pit stability product is coupled to the cathode bounding conditions to estimate the maximum pit size one could expect on an alloy for a given set of environmental conditions. Those results are then compared to data available in the literature from outdoor exposures of stainless steels for up to 26 years.
Comparison of FEM and analytic expressions for and


Figure 2 shows the results of calculations of total net cathode current from the geometry of Fig. 1 from two methods: an implementation of the FEM38 and Eq. 12. The comparisons are for cases spanning more than 2 orders of magnitude in cathode current. The agreement is excellent.
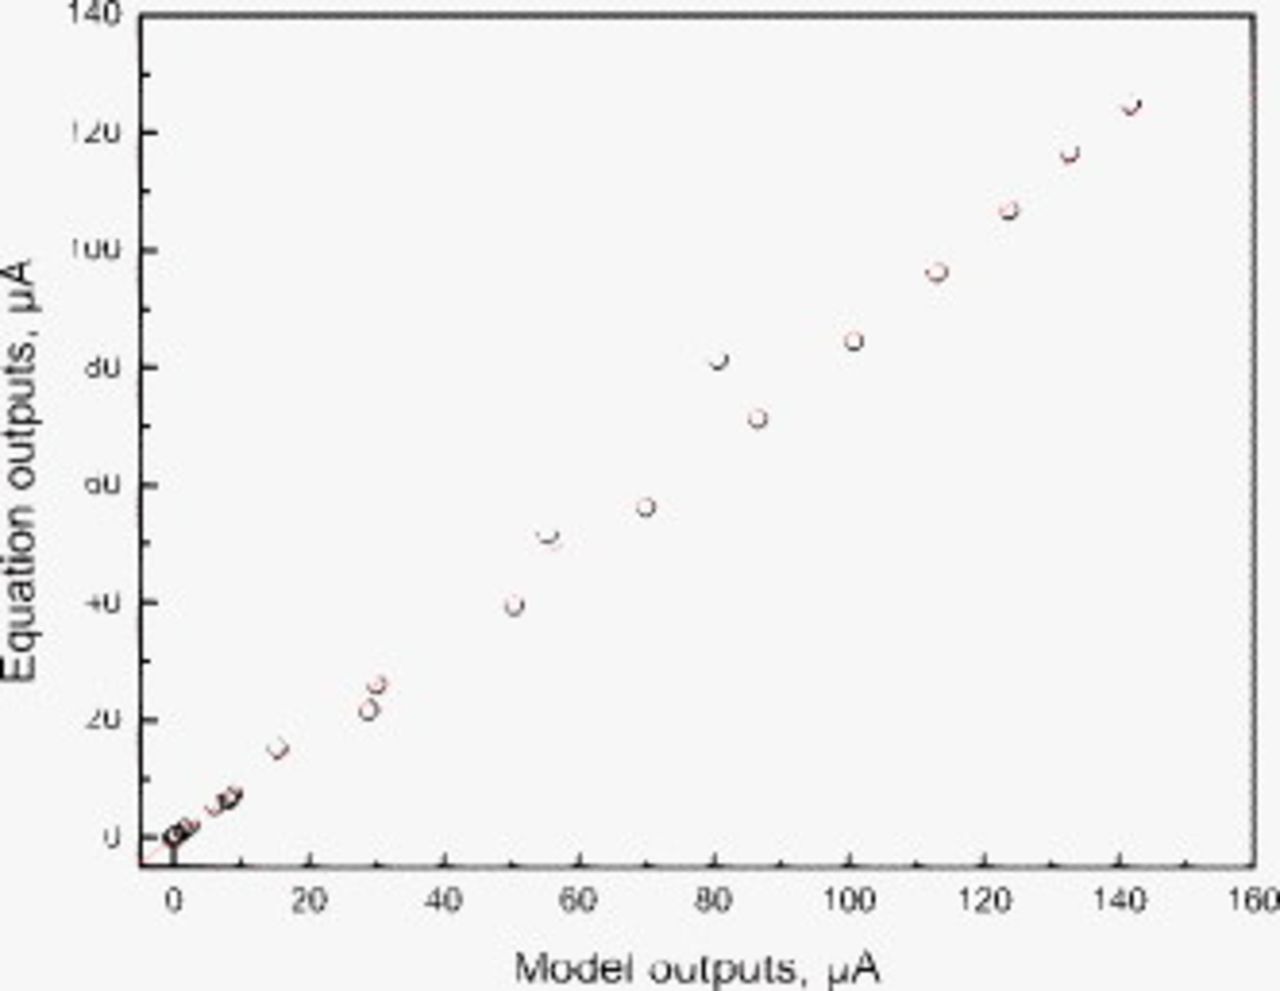
Figure 2. Comparison of the net cathodic current results obtained from finite element model calculations and from Eq. 12.
Effects of DD, RH, and pit size on cathode bounding condi- tions
Figure 3 shows the effects of RH and the amount of deposited NaCl (DD) on  for the case of an SS 304L surface containing a
  pit. As expected, the
  increases with both RH and DD, with the effect of RH being larger at larger DD. At small DD
  , RH over the range of interest has little effect on the
  .
.
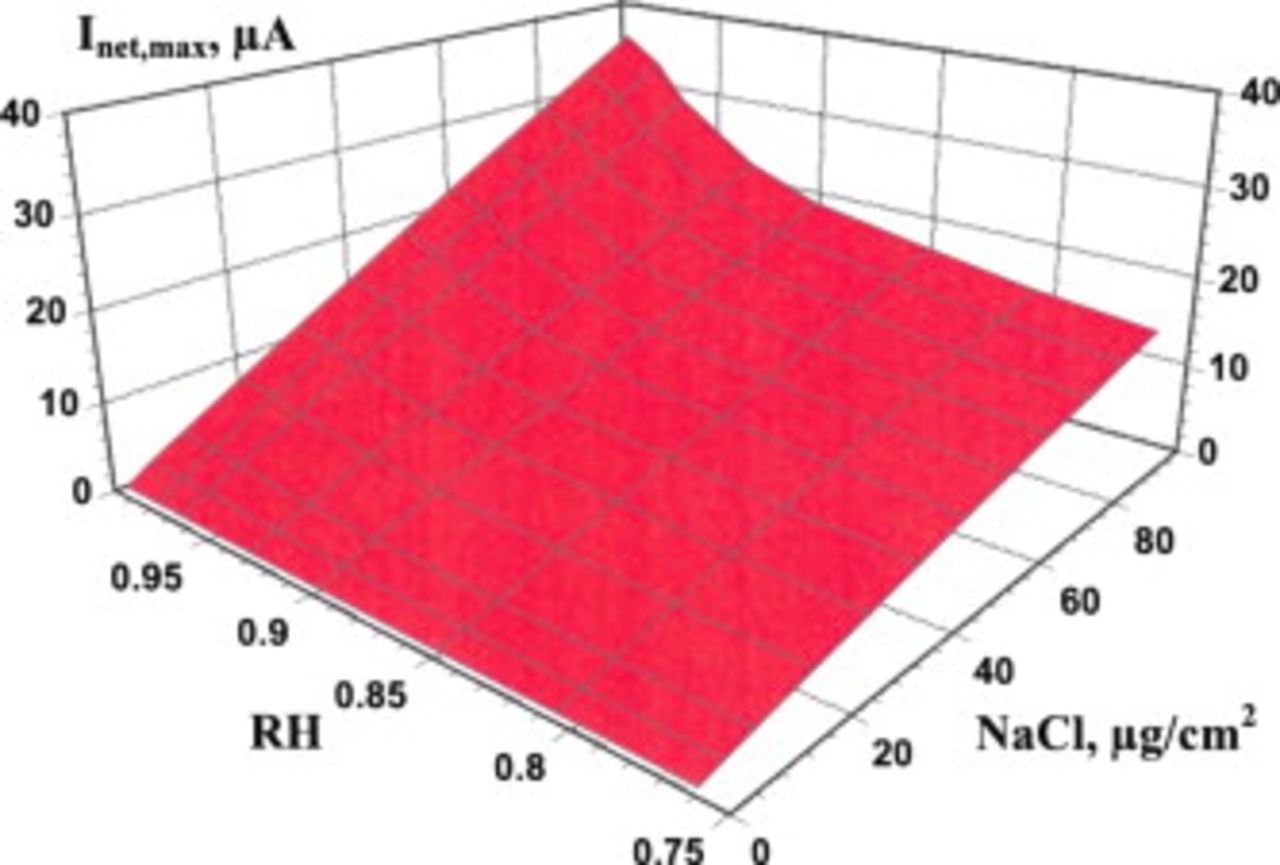
Figure 3. The effect of RH and amount of deposited NaCl particles on the cathode capacity of SS 304L under atmospheric exposure. The cathode is circular around a pit with a radius of  . The temperature is
  .
.
The effects of DD on the two cathode bounds individually are shown in Fig. 4. There is a linear relationship between  and DD under these conditions, but the rate of increase in the value of
  decreases with increasing DD. Closer inspection reveals that the relationship between
  and DD is not perfectly linear due to the logarithmic function in Eq. 12. In addition,
  increases very close to
  . Figure 5 shows the effects of RH on the cathode bounds. For a given DD, the effects of RH are modest until 90% RH is exceeded. Even under these conditions, the effects of RH are more limited than the effects of DD shown in Fig. 4.
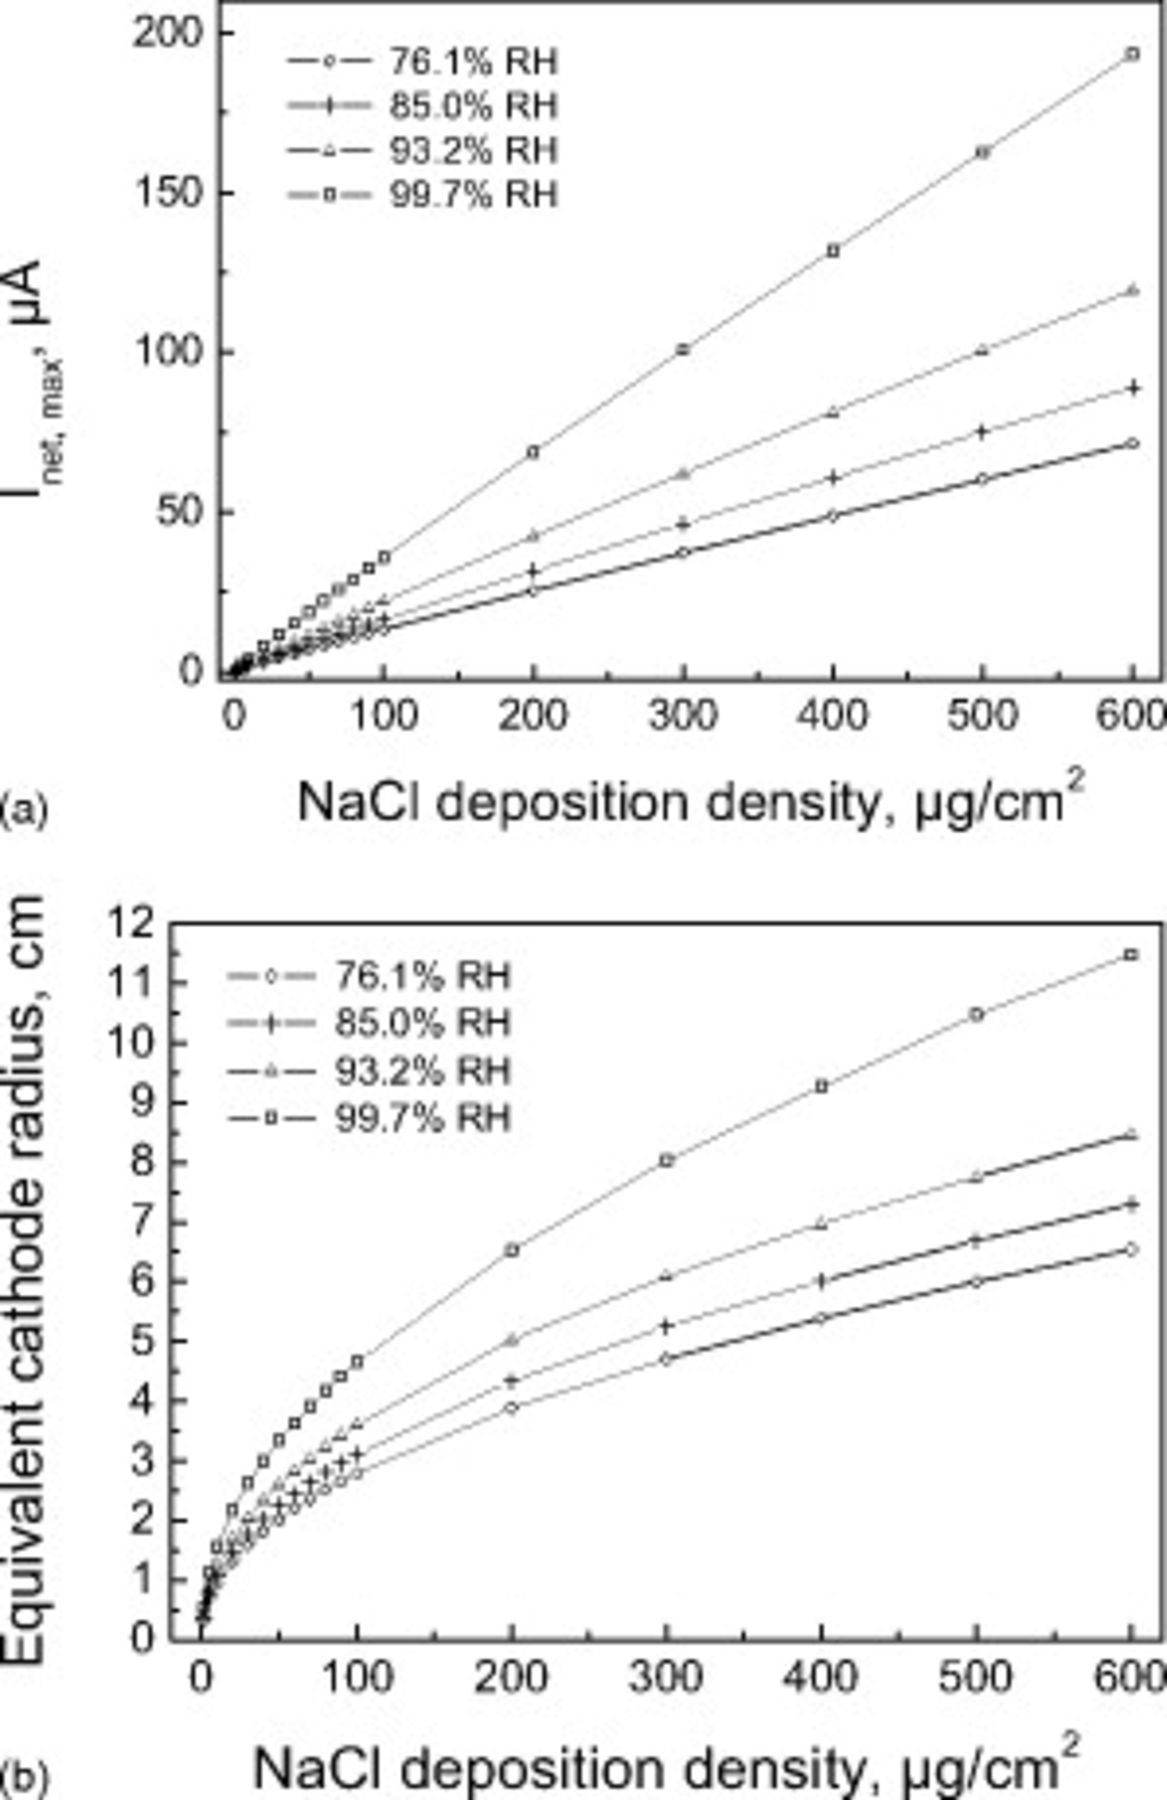
Figure 4. (a) Calculated cathode capacity and (b) equivalent cathode radius of the SS 304L surface covered with thin electrolyte layer increases with the amount of deposited NaCl particles at different relative RHs. The pit radius is  in all cases.
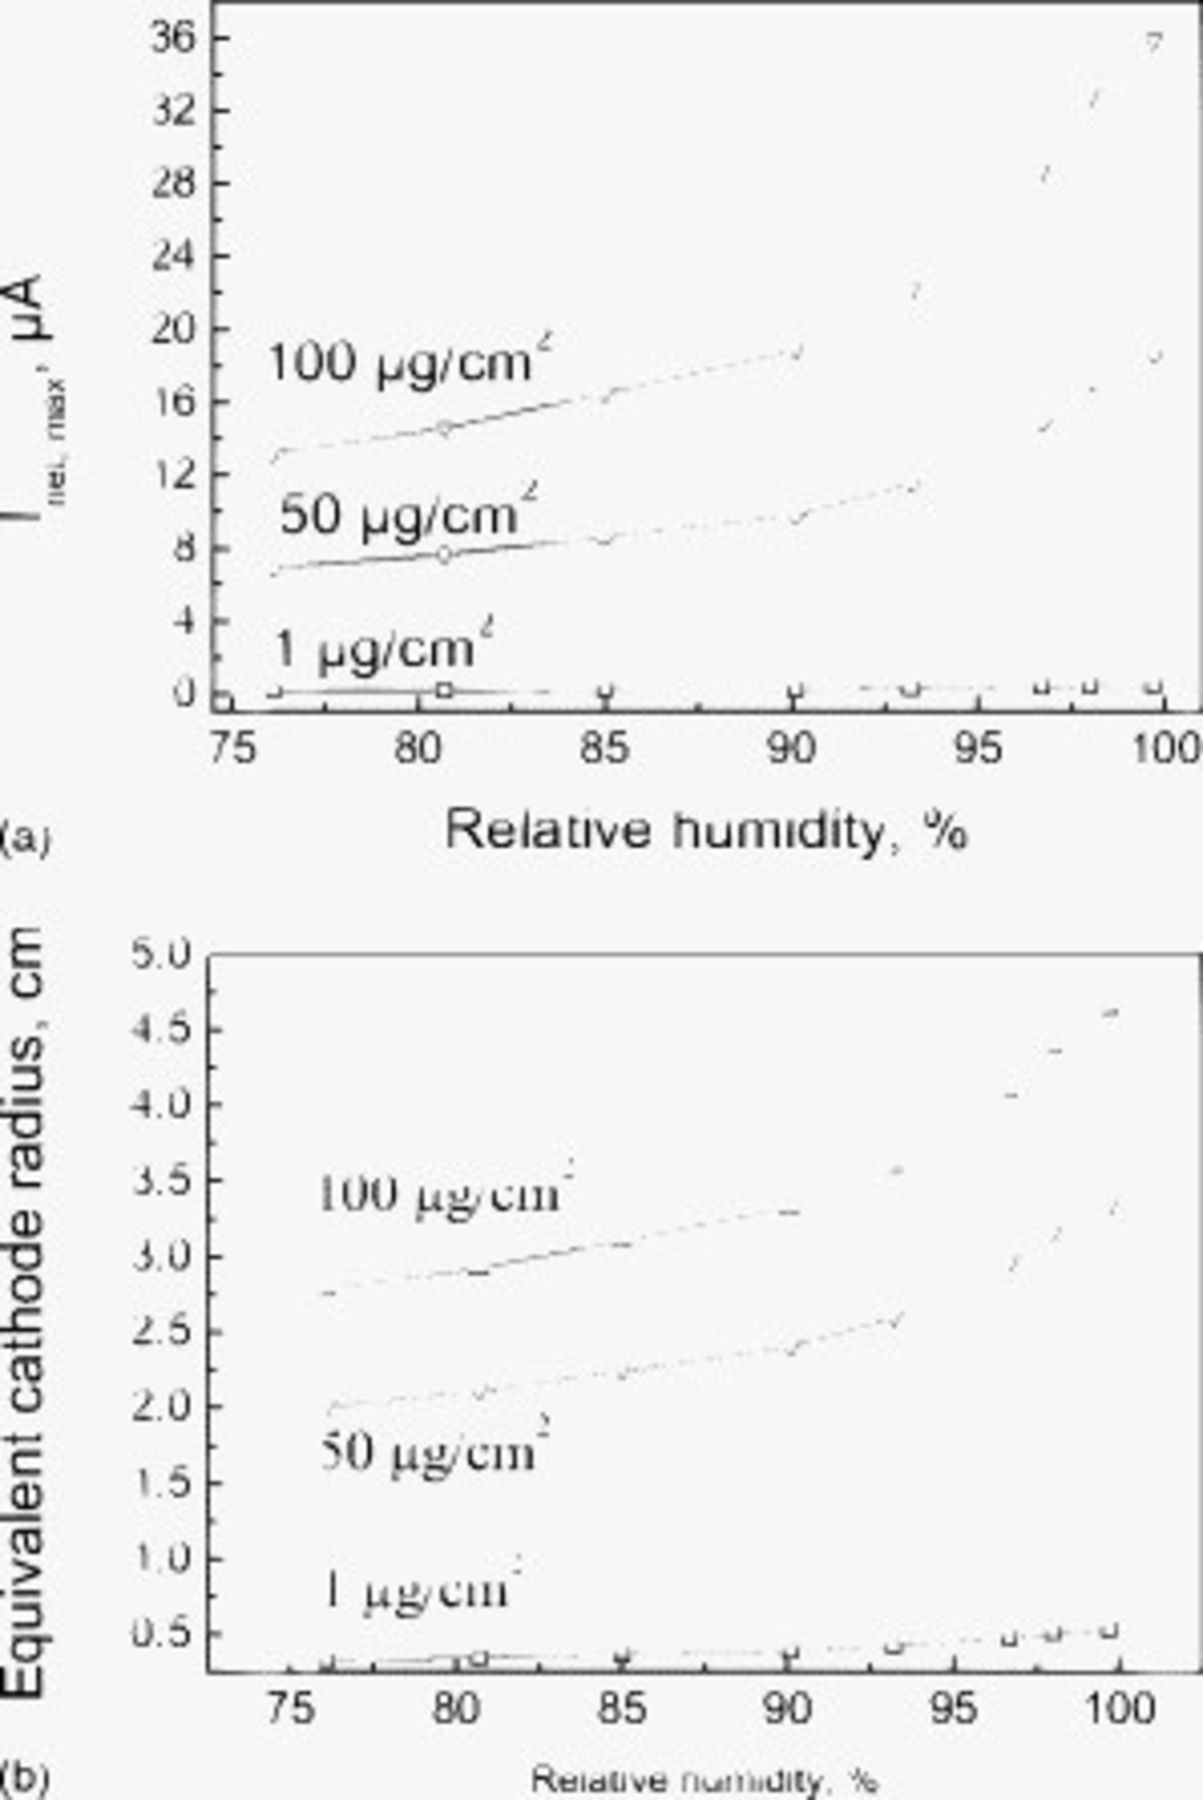
Figure 5. (a) Calculated cathode capacity and (b) equivalent cathode radius of the SS 304L surface covered with thin electrolyte layer increases with the RH at different amounts of deposited NaCl particles. The pit radius is  in all cases.
Figure 6 shows the interesting effect of pit size on the cathode bounding parameters. Increasing the pit size significantly increases  , with an increase in pit radius from 10 to
  very nearly doubling the
  . The effect on
  is substantially smaller, with an increase in pit radius from 10 to
  increasing the
  by only 20%.
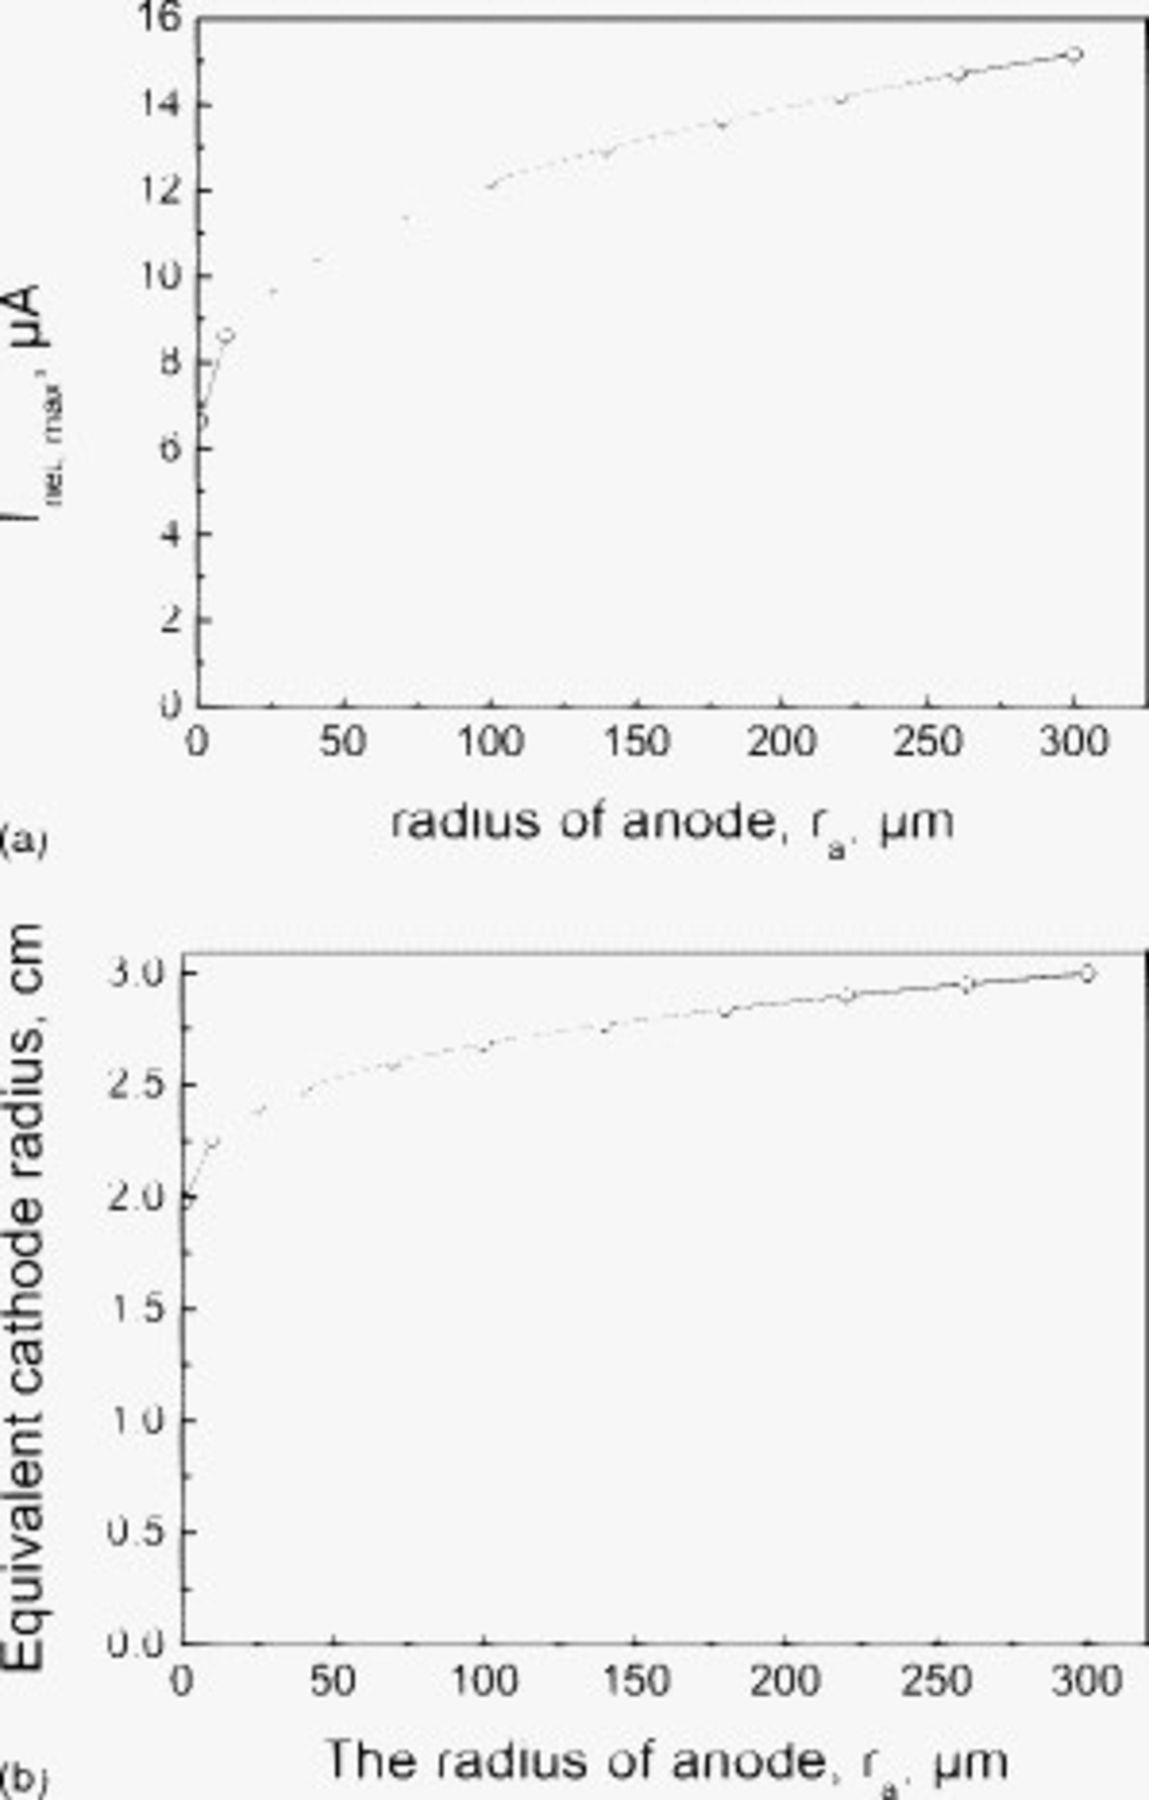
Figure 6. (a) Calculated cathode capacity and (b) equivalent cathode radius of the SS 304L surface covered with thin electrolyte layer increases with radius of the anode at  deposited NaCl particles and 85% RH.
Coupling of pit and cathode bounding conditions
Given a set of environmental parameters (RH, DD, and  ) and material characteristics (cathodic kinetics,
  ,
,  , and pit stability product), one can couple the cathode and pit bounding conditions as a function of pit size, as shown in Fig. 7, 8, 9 and 10. Application of Eq. 12 provides a line describing the maximum cathode current available under the given conditions as a function of pit radius. The equation
  provides a line describing the minimum anodic current required to keep a pit in an active state based on maintenance of a sufficiently aggressive anolyte as a function of pit radius, i.e., the pit stability product. The pit size at which the two lines intersect
  represents a dividing line for pit size. For pits less than
  , the maximum current that the cathode can provide is greater than the current demanded by the pit to remain stable. For pits larger than
  , the maximum current that the cathode can provide is less than the current demanded by the pit to remain stable as a hemisphere. Thus, hemispherical pits can grow with the given cathode only to a size of
  .
.
Figure 7 illustrates the situation for SS 304L exposed to 98% RH and with  of NaCl deposited on its surface at
  . Under these conditions, the calculations indicate a value for
  of
of  . At this pit radius, the maximum cathodic current equals the minimum anode current required. These results would suggest that pits could not grow as hemispheres with a radius larger than
  as they would be cathode limited. For pit sizes less than
  , the equivalent cathode could provide sufficient current for growth, although a given actual cathode may not. For this condition,
  would be 4.81 cm. Figure 8 illustrates the effects of both RH and DD on
  . Decreasing the RH from 98 to 85% decreases
  from 39 to
  because of the decrease in
  by about a factor of 2.
  decreases from 4.81 to 4.55 cm. The
  line is unaffected by the changes in the condition on the cathode. If the RH were maintained at 98%, but DD were to decrease to
  , the
, the  decreases dramatically, to less than
  , and
, and  decreases from 4.81 to 4.11 cm.
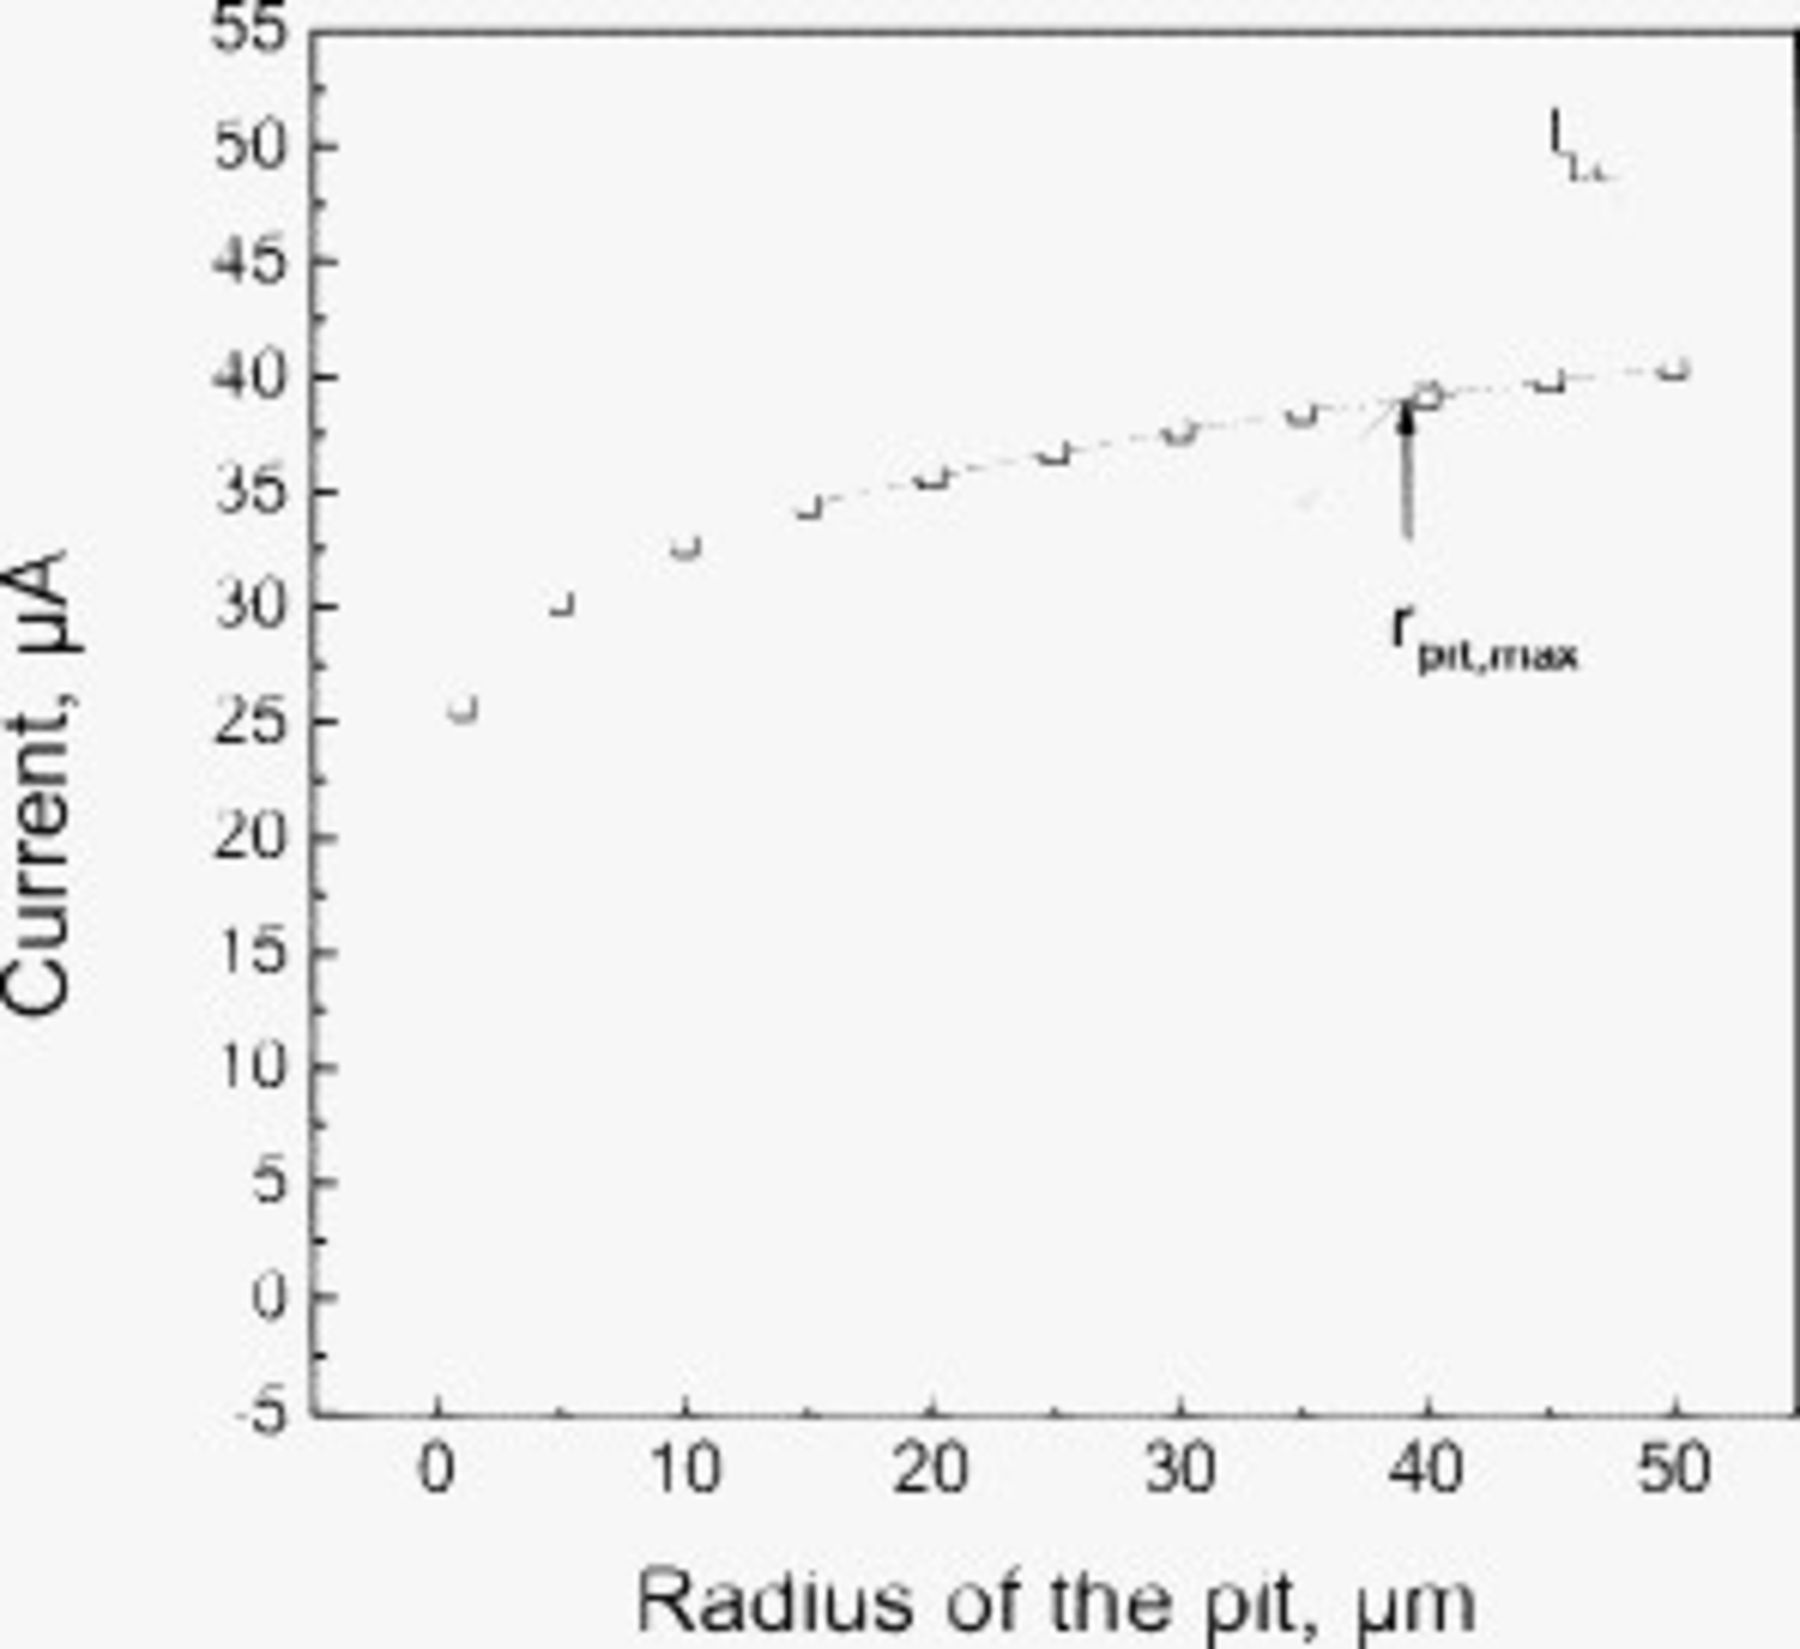
Figure 7. The effect of the radius of the pit on the circular cathode capacity,  , and anodic current demand,
  . The RH is 98% and the deposited NaCl particles are
  .
.

Figure 8. The effect of the radius of the pit on the circular cathode capacity,  , and anodic current demand,
  , at different RHs and deposited NaCl particles.
Figure 9 demonstrates the important effect of the value of the repassivation potential on  . For this illustration, the RH is 98%, and the DD is
  . Raising the
  from −0.4 to −0.25 V(SCE) decreases
  by almost a factor of 3 for the conditions used. The effect of such a change on
  is also shown in Fig. 9. Raising the
  by 150 mV decreases the
  from 275 to
  .
.  increases from 12.95 to 29.67 cm.

Figure 9. The effect of the radius of the pit on the circular cathode capacity,  , and anodic current demand,
  . The RH is 98% and the deposited NaCl particles are
  . Pit stability product assumed to be
  . The repassivation potential has been set at −0.4 and −0.25 V(SCE).
To create Fig. 7, 8 and 9, a value of the Galvele pit stability product  is needed. For stainless steels, it has been measured to be between 1 and 3 A/m,4, 30 with values at the upper end being measured using artificial pit approaches at high applied potentials. The value of
  used has a dramatic effect on the value of
  calculated, as shown in Fig. 10. Increasing
  from 1 to 1.6 A/m (equivalent to an
  value of 0.3 A/m) decreases the
  from 39 to less than
  under the conditions used.
  decreases from 4.81 to 4.57 cm.

Figure 10. The effect of the radius of the pit on the circular cathode capacity,  , and anodic current demand,
  . The RH is 98% and the deposited NaCl particles are
  . The anodic criteria,
  , are set at 1 and 1.6 A/m.
Comparison of maximum pit size to available field data
One means of evaluating the reasonableness of the bounding pit size calculations is to compare calculated  to data on pit depths from long-term atmospheric exposures of stainless steels. Such data are scarce. In addition to the challenges of performing long-term natural exposures, the tedious work of evaluating large surface areas for pit depth has proved daunting. Nonetheless, some data do exist and are shown in Fig. 11 for type 304 and type 316 stainless steels. For type 304SS, six independent sources of data for natural, atmospheric exposures6, 39–44 were found, with exposure times ranging from 0.4 to 13 years. These samples were exposed at a range of coastal locations in Japan, the United States, and the United Kingdom, in some cases as close as 50 m to the sea. As shown in Fig. 11a, the maximum pit depths measured range from 31 to
  . Assuming a hemispherical pit, these depths should be equivalent to the maximum pit radius. For type 316SS, five independent sources of data were found,6, 39–44 with exposure times ranging from 1 to 26 years. Again, the exposures were all close to the sea. As shown in Fig. 11b, the range of maximum pit sizes observed is from 16 to
  . The dotted horizontal lines in Fig. 11 represent the
  calculated for the two alloys assuming an RH of 98%, a DD of
  , an
, an  , and an
  of −0.4 V(SCE) for type 304SS and −0.25 V(SCE) for type 316SS. None of the experimentally observed maximum pit sizes exceeds the ones calculated, although Nakata's data for type 316 come very close.
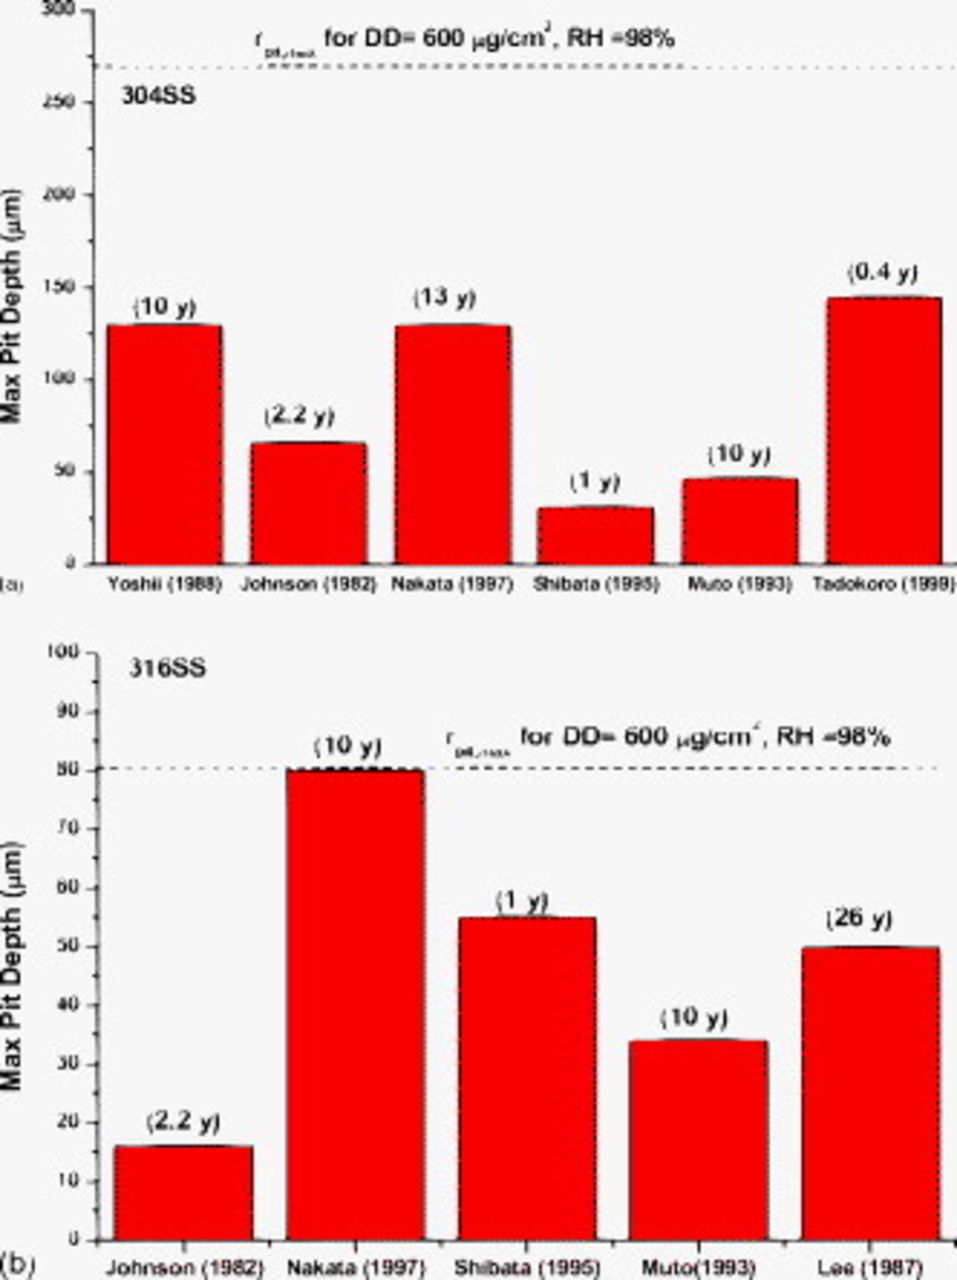
Figure 11. Comparisons between calculated  and data from long-term field exposures of type 304 and type 316 stainless steels in coastal environments. Experimental data represent reported maximum pit depth. Data are from Yoshii and Nishikawa,39 Johnson,40 Nakata et al. ,41 Shibata et al. ,42 Tadokoro and Takahashi,43 and Baker and Lee.44
Discussion
Based on the results presented above, this section first addresses the reasonableness of the approach used in calculations of the maximum current available from a cathode under thin film conditions. The effects of relevant material and environmental variables on the bounding parameters of the cathode are then put into context. A discussion of the coupling of these cathode calculations to the pit stability product criterion to estimate an expected maximum pit size for atmospheric conditions is followed by a comparison of these calculations to literature describing exposure test results for stainless steels for up to 26 years.
Reasonableness of equivalent and bounding cathode calcula- tions
The utility of the results reported here for the analysis of atmospheric pitting relies on the reasonableness of the equivalent cathode concept and the approach used for bounding cathode capacity. The equivalent cathode concept relies on a geometrical averaging, whereas the bounding calculations rely on mixed potential theory and the definition of the repassivation potential.
The equivalent cathode represents a type of ideal cathode in that although the ohmic potential drop increases with distance from the pit, the current density on the surface remains constant. In actual cathodes, the current density is very high near the pit mouth, but decreases dramatically with distance due to the exponential nature of Tafel behavior. The equivalent cathode is thus far more spatially efficient than any actual cathode. Its equivalence to any real cathode lies in the fact that given the potential bounds at the pit mouth and at the end of the cathode, both the equivalent and actual cathodes produce the same net cathodic current to support pit growth. This equivalence is assured by the integration performed in Eq. 3. The equivalent cathode is able to produce that current from a smaller area, but from the pit's perspective, neither the amount of area producing the supporting current nor the distribution of the current over that area is in any way relevant. All that matters is the magnitude of the current and its relation to the anodic current the pit needs to produce to remain active.
The approach used for bounding of the total cathode current relies on simple mixed potential theory considerations in addition to the concept of the equivalent cathode. The potential at the pit mouth cannot be more negative than the appropriately measured repassivation potential or else the pit would, by definition, repassivate. The potential at the farthest point on the cathode that can contribute net current to the propagation of the pit cannot be more positive than the free corrosion potential of the cathode as any surface at that potential is using all of its cathodic current locally to balance the passive current density. Thus the potential bounds are appropriate. Using the kinetics derived from polarization curves in bulk solution can be justified in that any chemical changes in the thin electrolyte (including precipitation of corrosion products in a solution of high pH) that result from the cathodic current act to decrease the ability of that surface to provide current, as pointed out before.10 Thus, the kinetics are bounding after the increase in the diffusion limited current density for very thin electrolyte layers is taken into account. The coupling of the DD and RH to the conductivity, solution density, and electrolyte layer thickness provides a thermodynamic foundation for the calculation of both  and
and  .
.
Dependence of on specifics of the atmospheric exposure scenario

As observed for the case of atmospheric crevice corrosion modeling,10 higher RH and/or DD lead to increases in  and the size of the cathode that can participate
  . This result is due to the lower ohmic losses for increasing either RH or DD. For a given RH, the concentration of salt in solution is set by thermodynamics, so increasing DD leads to a thicker electrolyte layer to maintain the same salt concentration (i.e., more water is needed to dissolve the larger mass of salt). For a given DD, increasing RH has little effect on
  at
at  . Increasing RH actually leads to lower electrolyte conductivity due to the lower equilibrium concentration of salt in solution, especially above 90% RH. However, at a constant DD, the electrolyte layer thickness increases with RH for the same reason. These effects nominally cancel one another until an RH of approximately 90%. Above this value, the water layer thickness increases faster than the conductivity falls, leading to a higher
  . A more quantitative assessment of the effects of the atmospheric parameters shows that the relationship between
  and DD is not perfectly linear due to the logarithmic function in Eq. 12. In addition, analysis of Fig. 4 shows that
  increases very close to
  , which is expected based on Eq. 13.
The increase in the  with increasing pit size (Fig. 6) is significant, particularly at pit sizes less than
  . This demonstrates that the loss of cathode area is more than compensated for by the decrease in the approach resistance for smaller pits.
Analysis of pit stability
As shown in Fig. 10, the value of the pit stability product chosen has a substantial effect on the  calculated. The concept behind the pit stability product is that for a pit to remain active, it must maintain a sufficiently aggressive chemistry at the growing pit surface to prevent reformation of a passive oxide. It is well established that aggressive chemical conditions are a requirement for pit growth. Development and maintenance of these aggressive chemical conditions have three requirements: the rapid hydrolysis of dissolved metal cations, chloride to be the dominant anion in the bulk, and the location of the majority of the cathodic reaction to be outside the pit. The hydrolysis of metal cations leads to the low pH needed to maintain the stainless steel surface in an active state. The dominance of chloride ion in the bulk ensures that it will be at a high concentration within the pit as electroneutrality demands migration of anions into the pit to balance the cations (metal cations as well as hydronium). Together, the low pH and high chloride concentration breach the passive film and prevent its reformation. Although this occluded chemistry development is often termed "autocatalytic," the extent of its development is limited, i.e., the pit pH does not continuously drop ad infinitum but instead reaches some steady state value. Diffusion of the altered electrolyte from a pit is important due to the large concentration gradients present for hydronium, chloride, and the metal cations. If diffusion of the occluded solution is sufficiently rapid, then the pit repassivates. Continued pit growth can occur only as long as the ability of the pit to create new aggressive solution in an ever-expanding volume is greater than the ability of diffusion to dilute it. The mathematical form of the pit stability product demonstrates this constraint. To maintain
  above a critical value,
  must increase as
  increases. If the majority of the cathodic reaction is not located outside the pit, then the pH inside the pit must rise relative to the pH of a metal chloride solution due to the generation of hydroxyl by the cathodic reaction. Although in aluminum, as much as 15% of the cathodic reaction may be local, thermodynamic calculations show that for stainless steels to maintain a
  , no more than 0.1% of the cathodic reaction can occur within the occluded site.45
The mathematical derivation of values for the pit stability product relies on the idea that assuming diffusion is the rate-controlling process, then for a pit to remain stable, the concentration of the occluded solution must not decrease with time, as that would lead to repassivation. By implementing the conservation of charge with the flux equation (usually ignoring any migration, and thus reducing it to Fick's first law), an expression can be derived relating the  to the concentration that must be maintained within the pit of the form

where  is the critical concentration difference of the species of interest (usually metal cations) between the pit surface and its mouth, and
  is its effective diffusion coefficient. There is a range of pit stability constants in the literature for stainless steels ranging (for
  ) from 1 to 3 A/m.4, 30 Most were determined using the artificial pit method, although some used the analysis of pitting transients during potentiostatic holds. These latter measurements tend to populate the lower end of the distribution, and thus may better represent a bounding condition in that lower pit stability products allow larger pits to form, all else begin equal.
Implications regarding maximum pit size obtainable under natural exposure
Determination of  by coupling the calculations of
  and
and  provides a bounding value for the maximum hemispherical pit depth given the material (which determines the pit stability product and the electrode kinetics of the passive surface) and the environmental exposure parameters (which determine the electrolyte layer conditions and influence the electrode kinetics of the passive surface). For any growing pit, the conservation of charge requires that
  . In this work, bounding solutions are sought; thus a parameter space, as shown in Fig. 12, should be considered in which the space is described by the anode current demand and the cathode current capacity. The anode demand,
  , is determined by the pit stability product and the size of the pit. It represents the minimum current the pit must produce to remain stable. The cathode current capacity,
  , is determined by the characteristics of the cathode (kinetics) and the atmospheric exposure (RH, DD, and
  ).
).
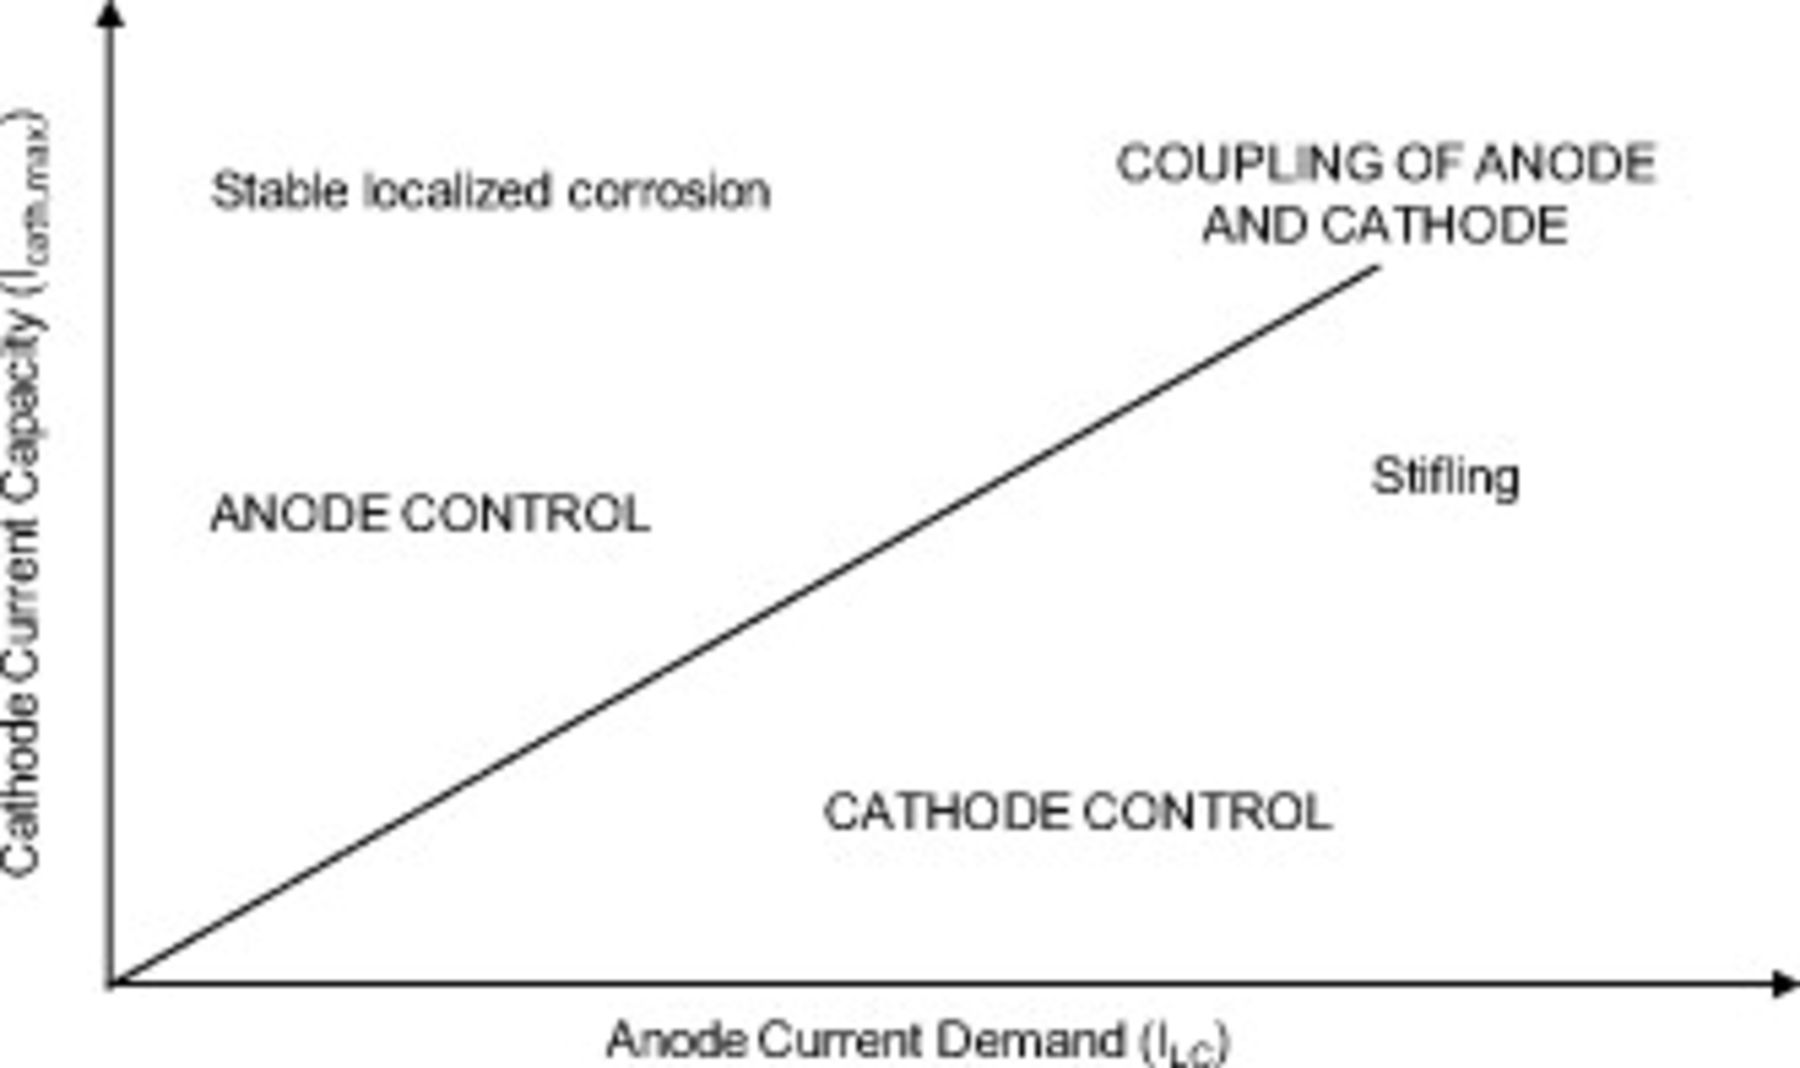
Figure 12. Schematic showing the stability of localized corrosion at different cathodic and anodic conditions.
Stability requires that the cathode be able to provide at least the current that the anode demands to maintain the critical crevice solution in the pit. Figure 12 compares the current capacity of the cathode  to the current demand of the anode (as determined by the pit stability product and pit size). Any given scenario describing a pit exposed to atmospheric conditions (i.e.,
  , RH, particulate, and geometry) would determine the
  coordinate in Fig. 12. The location of that coordinate would determine whether the pit is stable or stifles. Along the line with a slope of 1, the ideal cathode can just keep pace with the demands of the anode, so stable growth can just be maintained. In the region to the left above that line, the cathode is capable of giving more current than is needed by the anode, so the anode controls the rate of propagation. In the region to the right and lower than the line, the cathode cannot meet the demands of the anode, and the crevice must stifle. Stifling in this context can mean either complete repassivation or that only a portion of the localized corrosion site remains active.
The results (Fig. 9) clearly show that although RH and DD are important in establishing the maximum pit size obtainable,  has the strongest effect considering a reasonable range for these variables. The importance of
  is due to the large effect changes in it have on both terms in Eq. 12, 13. Not only does a more positive
  lower
lower  but it also substantially lowers the integral of the net current density over the potential range for a given set of cathode kinetics. In the atmospheric exposure cases studied here, the repassivation potential is always in the activation controlled region of the cathodic kinetics rather than in the diffusion limited region. Thus, the changing of the limits on the integral changes the maximum cathodic current density by an order of magnitude per Tafel slope. Under full immersion conditions, in which the diffusion limited current density for oxygen reduction would likely be relevant, a qualitatively similar behavior would be expected. Independent of the exposure type, increases in
  have tremendous impact on the
  .
.
Comparing calculated  to exposure data allows a different perspective on the validity of the approach. As mentioned above, such data are fairly limited. Nonetheless, the comparisons shown in Fig. 11 demonstrate that for a reasonable set of parameters given the range of environments, the approach does provide a bounding value for
  for both stainless steels considered. Further refinement would require more knowledge of the DD and the deliquescent behavior of the deposited material (here it is assumed to be NaCl). Values of DD well over
  have been documented in seacoast environments.46
An alternative approach to assess the calculations is to use the power law fitting done by several researchers and estimate the time to reach the calculated  . Muto et al.6 fitted pitting data collected over 10 years to a power law and found an exponent as large as 0.6 for measurements of maximum pit depth for atmospheric exposures of stainless steel near the coast of Japan. Using their relations and data for types 304 and 316, one would predict that it would take 54 years for type 304 to reach the
  calculated above of
  . For type 316, it would take 96 years to reach the calculated
  of
of  . Thus, although the approaches in predicting the maximum pit depth are very different, the results are consistent with one another.
Further inspection of Fig. 11 indicates no obvious relation between exposure time and maximum pit depth, albeit the data are for somewhat different environments. That said, Nakata et al.41 demonstrated that the maximum pit depth measured reached a plateau after approximately 4–6 years (out to 9–13 years) for many stainless steels at many sites in Japan, indicating a power law exponent near zero. While, as discussed above, Muto et al.6 found that in severe marine atmosphere environments, a power law with a time dependence of  fits the data for type 304 exposed for up to 10 years, in less severe environments, the time dependency disappeared, with the exponent between −0.05 (hot springs) and 0.17 (industrial). For the hot springs exposure, the maximum pit depth at 1 and 10 years was the same
  . For the industrial exposure, the maximum pit depths increased from
  after 1 year to
  after 10 years. To obtain a pit of
  would take over 6 million years, assuming that the kinetics obey the proposed power law.
Limitations
The implicit and explicit assumptions involved in using the methods described should be appreciated. The basic differential equation of the model (Eq. 4) is based on Ohm's law. Any effect of mass transfer in the radial direction in the catholyte film is ignored. The concentration of deposited salt is assumed to be uniformly distributed along with the uniform thickness of the film. In stainless steels and other materials for which pit initiation is controlled by dissolution of second phase particles, the inclusion size represents a lower bound on  as these second phase particles tend to dissolve completely when initiated. For very thin electrolytes
  , it has been shown that the rate of oxygen reduction is not controlled by diffusion through the thin film, but instead by the rate of uptake across the air/water interface.47 For many if not most atmospheric exposures of passive materials,
  is not in the diffusion limited regime because of the high diffusion limited current densities associated with diffusion across a thin film, so this limitation may be of limited importance. As discussed previously,10 the approach assumes that there is perfect wetting of the cathode surface, and that all other boundary conditions are constant (κ, electrode kinetics, DD, RH, and
  ). It does not consider the time evolution of the
  , including any transient currents from discharge of the capacitance associated with the cathode surrounding the pit.48 Cathode kinetics typically slow with time due to increases in pH at the surface. As with other factors ignored (e.g., precipitation at the anode/cathode boundary, inert particles on the surface, and localized corrosion elsewhere on the cathode surface), slowing cathode kinetics act as a limiter of the effective cathode capacity and thus do not adversely affect the calculations described herein which seek to provide an upper bound to
  . Application of the proposed method for calculating
  to other passive alloy systems and atmospheric environments is straightforward as the data needed are either available or directly measurable.
Conclusions
This work presents a framework for the analytical calculation of the bounds for localized corrosion obtainable under thin electrolyte films. It represents an extension of the concept of an equivalent cathode to the case of a hemispherical pit surrounded by a concentric cathode of much larger size. The cathode is assumed to be uniformly covered with a known areal density (DD) of a known salt and is exposed to a fixed atmosphere with known RH. An analytical expression is presented that calculates the maximum current such a cathode could possibly produce  that could be used to support the growth of a pit. The results of the analytical expression have been validated with FEM calculations. Although increases in both DD and RH increase
  , it is shown that the DD has a greater effect on
  than does the RH over the relevant ranges of those parameters. The radius of the pit also influences
  with increasing pit sizes, leading to increased cathode currents due to the decrease in approach resistance.
The linking of the cathode capacity to the pit stability criterion allowed the prediction of the maximum size of a hemispherical pit in type 304 and type 316 stainless steels after exposure to atmospheric conditions. The results from the calculations agreed well with several sets of exposure data for near-seacoast exposures on three continents for exposure times out to 26 years. The framework is sufficiently general that it can be easily extended to other alloy systems as well as other forms of localized corrosion that can occur under thin electrolyte films.
Acknowledgments
Support by the Science and Technology Program of the Office of the Chief Scientist (OCS), U.S. Department of Energy (DOE), is gratefully acknowledged. The work was performed under the Corrosion and Materials Performance Cooperative, DOE Cooperative agreement no. DE-FC28-04RW12252 . We thank Nick Smart of SERCO Assurance (U.K.) for information on pit depth literature, Fushuang Cui (DuPont) for assistance with the numerical analyses, and Roger Newman (University of Toronto) for helpful discussions.
University of Virginia assisted in meeting the publication costs of this article.
List of Symbols

| concentration, 
|

| diffusion coefficient, 
|
| DD | salt deposition density, 
|

| Euler's number |

| potential, V |

| current density, 
|

| current, A |

| concentration of the salt in solution, 
|

| molecular weight of the salt, kg/mol |

| radius, m |
| RH | relative humidity, % |

| area, 
|

| temperature, K |

| potential V |
Greek
| ρ | density of the salt solution, 
|
Subscripts
| a | anode |
| c | cathode |
| ceq | equivalent cathode |
| corr | corrosion |
| eq | equivalent |
| L | cathode length |
| max | maximum |
| min | minimum |
| P | passive |
| rp | repassivation |
Footnotes
- a
Note that it has been shown that a small percentage
of the cathodic current can be generated within the localized corrosion site itself.9
