

Abstract
The sealing of an anodic coating on AA2024-T3 with a trivalent chromium process coating (TCP-HF) was investigated. Specimens were anodized in 9.8 wt% H2SO4 at 15 V DC (23 min) producing an oxide coating weight of ca. 1200 mg ft−2 and a thickness of ca. 5 μm. Elemental analysis revealed the sealant forms across the outer oxide layer and within the pores up to a depth at least approaching 1 μm. Anodic and cathodic currents in potentiodynamic polarization curves were suppressed by 5–10× and low frequency impedance (Z0.01 Hz) values were 5× higher for anodized specimens sealed with TCP (∼5 × 10⁶ ohm-cm2), as compared to the unsealed anodized controls. During continuous exposure to 3.5 wt% NaCl, Z0.01 Hz values remained unchanged and greater than 106 ohm-cm2 after 5 days for the TCP-sealed specimen and decreased by 10× for the unsealed anodized control after just three days. A 14-day (336 h) neutral salt-spray exposure produced no significant pitting, discoloration or major coating detachment on anodized specimens sealed with TCP. Overall, the results indicate that the TCP sealant increases the barrier properties of the anodic coating and functions to provide anodic and cathodic corrosion protection.
Export citation and abstract BibTeX RIS
Aluminum alloys (e.g., 2XXX and 7XXX series) are widely used as structural components in aircraft due to their lightweight and mechanical strength.1 The alloys are comprised of complex metallographic microstructures with microscopic and nanoscopic second phase particles dispersed throughout that contribute to the material's mechanical properties. The exposed particles also can render the alloy susceptible to localized pitting corrosion through the formation of galvanic couples with the surrounding aluminum.2–5
Anodizing is an often used electrochemical coating method that improves corrosion and wear resistance of aluminum alloys.6,7 The thicker anodic coating provides more protection against corrosion than does a typical chemical conversion coating due to its superior barrier properties.6–10 Anodic coatings formed on aluminum and aluminum alloys are classified as Type I and IB—electrolytic anodization in chromic acid; Type IC—electrolytic anodization in a non-chromic mineral acid; Type II—electrolytic anodization in a sulfuric acid bath and Type IIB—thin sulfuric acid anodization for use as a non-chromate alternative for Types I and IB; and Type III—electrolytic anodization to produce a hard and dense oxide coating such as in sulfuric/boric acids.7 Key properties of anodic coatings are the thickness (0.1–2 mils or 2.5–25 microns), coating weight (200–2000 mg ft−2), and hardness/abrasion resistance.6–8,11–13
Anodic coatings generally are a multiple micrometers thick, porous and have a thin barrier layer at the base of the pores.6–10 Although the anodic coating increases the corrosion resistance, water, electrolyte ions and dissolved oxygen can diffuse through the pores to the barrier layer and the underlying metal, resulting in corrosion. Defects can also form in the oxide coating around second phase particles. These also provide pathways for electrolyte solution penetration. Such defects reduce the overall corrosion resistance imparted by the anodic coating.14
Anodic coatings are typically sealed by a process that either reduces the diameter of the outer pores to form a less permeable film or causes blockage of the pores by precipitation or inclusion of salt deposits. There are several sealing processes used, including chromate,15,16 hot water17 and nickel acetate treatments.18 Chromate sealers are considered the best when maximum corrosion resistance is desired.15 Hot water sealing requires no toxic solution, but the process produces less of an improvement in the corrosion resistance as compared to chromate sealing. Both hot water and chromate sealing require elevated processing temperatures of 190 to 200 °F and immersion times of up to 25 min to achieve proper sealing and maximum corrosion resistance.15 The immersion in hot ultrapure water causes closure of the outer pores by a chemical process that involves the formation of boehmite by hydration of the alumina, according to reaction 1.8,19

Several other sealants using nickel salts18,20 rare-earth salts21,22 and organic compounds23 have been used to fill the outer pores of the oxide coating with precipitates.
The chromate-based treatments are toxic and carcinogenic to humans.15,19,24 The recent reduction of the Occupational Safety and Health Administration's permissible worker exposure limit to hexavalent chromium and world-wide pressure to eliminate the use of this polluting chemical species have necessitated the implementation of alternative sealing treatments that are as effective as chromate sealers, but do not present the environmental, safety, and health risks.15 Processes utilizing less hazardous chemicals, lower operating temperatures, and shorter processing times are alternatives being sought.
We report herein on a study of a commercial TCP conversion coating (TCP-HF) used as a sealant for sulfuric acid (SA) anodic coatings on AA2024-T3. TCP is a Type II (composition containing no hexavalent chromium) and Class 3 (corrosion protection with low electrical resistance) coating. The electrochemical behavior of this particular TCP conversion coating on AA2024-T3 has recently been evaluated.25 The key research questions addressed in the present work were (i) how does TCP seal the anodic coating and does the sealant penetrate the pores of the oxide, (ii) to what degree does the TCP sealant increase the corrosion resistance of the oxide coating, and (iii) how does any corrosion resistance enhancement predicted by electrochemical measurements compare with what is observed during accelerated degradation testing? There is published literature on the formation, structure and corrosion resistance of TCP conversion coatings applied to aluminum alloys, as exemplified in these selected citations.25–30 Other than a Department of Defense report, we are unaware of any published literature on TCP sealing of anodized aluminum.15 There has been one recent publication describing the sealing of anodic coatings on aluminum alloys 2618 and 7175 with a solution containing trivalent chromium Cr(III) and fluorozirconate Zr(IV) salts.31
Electrochemical tests including open circuit potential measurements (OCP), electrochemical impedance spectroscopy (EIS) at the OCP, and potentiodynamic polarization curves were performed to assess the corrosion resistance of the TCP-sealed and unsealed anodized alloys. Scanning electron microscopy (SEM) with energy dispersive X-ray spectroscopy (EDS) was used to determine the oxide and sealed oxide film morphology as well as the distribution of the TCP coating elements (Zr and Cr) across and within the oxide coating. SEM with focused ion beam (FIB) milling and EDS were used to examine the oxide morphology and thickness, the TCP coating thickness and the distribution of TCP coating elements within the oxide. Glow discharge optical emission spectroscopy (GD-OES) was also used to probe for the coating elements with depth into the oxide. Sealed and unsealed anodized specimens were exposed to a 5-day solution exposure in 3.5 wt% NaCl at room temperature and to a 14-day neutral salt-spray (ASTM B117) to assess the corrosion resistance of the TCP-sealed specimens.
Experimental
Reagents
All chemicals were analytical grade quality, or better, and were used without additional purification. Sodium sulfate (Na2SO4), sulfuric acid (H2SO4), and sodium chloride (NaCl) were purchased from Sigma-Aldrich (St. Louis, MO). Nitric acid (HNO3) was purchased from Fisher Scientific (Hampton, NH) and 99.9% isopropyl alcohol was purchased from VWR chemicals (Ontario, Canada). The degreaser, Cleaner 1000, and TCP-HF (hereafter referred to as TCP) solutions were provided by CHEMEON Surface Technology. The chemical composition of the TCP bath has been discussed elsewhere.27 The degreaser was prepared to a concentration of 45 g l−1 and the deoxidizer, HNO3, was used at 35 wt% when applying TCP. The pH of the TCP bath was adjusted to 3.85 using 0.25 M NaOH or 0.5 M H2SO4, as required. Nickel acetate salt was obtained from Sigma Aldrich. All solutions were prepared using ultrapure water (Barnstead water purification system) with a resistivity >17 MΩ-cm. No filtration step was employed to remove any suspended particulates from the TCP coating solution prior to sealing the anodized specimens.
Specimen preparation
Aluminum alloy 2024-T3 was procured as a 2 mm-thick sheet (www.metalsonline.com) and cut into 1in2 squares for the experiments. The specimens were prepared for use by first abrading with 1500 grit wet aluminum oxide paper for 2 min This was followed by hand polishing with 0.3 μm diameter alumina grit (Buehler), slurried in ultrapure water, on a felt pad. A final hand polish was performed using 0.05 μm diameter alumina powder slurried in ultrapure water on a separate felt pad. A 20-min ultrasonic cleaning in ultrapure water followed by a 20-min ultrasonic cleaning in purified isopropyl alcohol was applied after each polishing step to remove debris and clean the surface. The polished specimens were then degreased in Cleaner 1000 at 55 °C for 10 min followed by a 2-min ultrapure water rinse. The degreased specimens were then deoxidized in 35 wt% HNO3 for 2 min at room temperature followed by a 2-min ultrapure water rinse. The degreased and deoxidized specimens were dried with N2 before being electrochemically anodized.
Electrochemical anodization
The degreased and deoxidized specimens were electrochemically anodized under controlled potential for a total of 23 min in 9.8 wt% H2SO4 under ambient conditions. The AA2024-T3 panels were the anode and a stainless-steel plate of the same dimension served as the cathode. The two electrodes were mounted vertically and parallel to one another using plastic alligator clips at a distance of 5 cm. The electrolysis was performed in a glass beaker. The aluminum alloy was connected to the positive terminal and the stainless-steel plate was connected to the negative terminal of a DC power supply (Tenma, 30 V and 5 A (150 W max.)). The electrodes were lowered into the acid to immerse three-quarters of their surface for anodization. Anodization was performed by applying a 1 V per 12 s ramp to 15 V DC for 3 min. This voltage was then maintained for 20 min resulting in a total anodization time of 23 min. The measured current density ranged from 25–35 mA cm−2 during the electrolysis with a trend toward increasing values during the anodization period. The electrolyte was unstirred during the anodization. The anodized specimens were removed and first rinsed with ultrapure water for 2 min. This was followed by immersion in room temperature ultrapure water for 20 min to dissolve aluminum hydroxysulfate salts (anodization smut) from the surface. The cleaned specimens were dried with N2 and stored overnight in a desiccator before further testing. The stainless-steel cathode was abraded with 1500 grit wet aluminum oxide paper to refresh the surface prior to each anodization run. Although the anodization was performed under ambient conditions, resistive heating caused the solution to warm during the process. The temperature rise was qualitatively observed and not quantitatively measured.
Sealing
The anodized specimens were sealed by immersion with TCP. A sealing time of 10 min was used at room temperature. This sealing time was determined to be optimum based on electrochemical measurements of specimens sealed for different times in naturally aerated 0.5 M Na2SO4 + 0.01 M NaCl. Specimens were sealed using times from 1–20 min with 10 min providing the maximum corrosion resistance. Comparison studies were performed with anodized specimens sealed by immersion in hot water and with nickel acetate. Hot water sealing was performed using a 30-min immersion in ultrapure water at 90 °C. Nickel acetate sealing was performed by a 15-min immersion in a bath solution of 5 g l nickel acetate, 1 g l−1 cobalt acetate, and 8 g l−1 boric acid at 85 °C. The nickel acetate-sealed specimens received a final rinse with ultrapure water before further use.
Oxide coating weight determination
The oxide coating weight was determined using the chromic acid stripping method described in ASTM B137. The anodized specimens were air dried for 24 h before chemically dissolving the oxide. The specimens were weighed dry before being placed in the stripping solution that consisted of 20 g CrO3 and 35 ml of concentrated (85 wt%) phosphoric acid, both diluted with ultrapure water to 1 l. The specimens were immersed for 5-min periods at room temperature to dissolve the oxide. They were then rinsed with ultrapure water and dried with N2 gas before remeasuring the weight. Typically, a total of 15 min was required to dissolve the oxide and to achieve an unchanging weight. The nominal oxide weight was found to be 1192 ± 43 mg ft−2 (n = 3 anodized specimens). According to document MIL-A-8625F, the minimum oxide coating weight required for a Type II sulfuric acid anodization is 1000 mg ft−2.7
Neutral salt-spray test
Anodized AA2024-T3 specimens, TCP-sealed and unsealed, were exposed to a continuous 14-day (336 h) neutral salt-spray (NSS), according to ASTM B117 (5 wt% NaCl and 35 ± 1 °C), in a commercial 4 ft3 salt-spray chamber (MX 9204, Associated Environmental Systems). The salt solution in the chamber was replenished daily. The specimens were 1 in2 in area and were mounted at a 20-degree angle relative to the vertical axis. The backside and edges of the specimens were masked off with corrosion protection tape (3 M Scotchrap™) to limit salt mist contact to just one surface with the anodic coating.
5-day continuous solution exposure test
Anodized AA2024-T3 specimen surfaces, TCP sealed and unsealed, were continuously contacted with 3.5 wt% NaCl at room temperature for 5 days. Open circuit potential (OCP) and electrochemical impedance spectroscopy (EIS) measurements at the OCP were performed daily. The purpose for this test was to investigate the time dependence of any solution penetration through the sealed oxide to the underlying metal.
Characterization
All electrochemical measurements were performed in a 1 cm2 flat cell (Bio-Logic Science Instruments, France) using a computer-controlled electrochemical workstation (Gamry Instruments, Inc., Reference 600, Warminster, PA). An aluminum alloy specimen was mounted against a Viton® O-ring that defined the exposed geometric area, 1 cm2. All currents reported herein are normalized to this geometric area. The counter electrode was a Pt flag and the reference was a home-made Ag/AgCl electrode (4 M KCl, E0 = +0.197 V vs NHE) that was housed in a Luggin capillary with a cracked glass tip. All measurements were made in naturally aerated 0.5 M Na2SO4 + 0.01 M NaCl at room temperature (23 ± 2 oC). The following electrochemical measurements were made on all specimens in this order: (i) a 30-min OCP vs time curves, (ii) EIS at the OCP using a 10 mV rms sine wave at frequencies from 106 to 10−2 Hz, and (iii) potentiodynamic polarization curves from the OCP (vs Ag/AgCl) to 0.5 V (anodic) and −1.2 V (cathodic) at a scan rate of 1 mV s−1. Separate specimens were used for the individual anodic and cathodic potentiodynamic polarization curves, but all were first used in OCP and EIS measurements at the OCP. The polarization curve scans were initiated +20 mV vs OCP for the cathodic scans and −20 mV vs OCP for the anodic scans.
Scanning electron microscopy (SEM) was performed using a JEOL 7500 microscope (JEOL Ltd., Tokyo, Japan). Energy dispersive X-ray spectroscopy (EDS) was performed with an AZtec system detector (Oxford Instruments, UK) attached to the electron microscope. Spectral data were analyzed using the system software (version 3.1). Micrographs and spectra were recorded using a 15 keV accelerating voltage. The SEM with focused ion beam (FIB) milling was performed using an Auriga® dual column microscope (Composite Material and Structural Characterization Facility, MSU). A Ga ion beam was used to mill through the sample to obtain the cross sections for analysis. Sectioning was performed using 30 kV accelerating voltage at 4 nA. The ion beam current was applied at a 45o angle relative to the normal axis. A 0.60 nA current was used for fine sectioning.
A digital optical microscope (Keyence VHX 600) was used to construct 3-dimensional surface topographical profiles of the specimens before and after the accelerated degradation testing. The depth resolution was ca. 0.2 μm. Areas 1000 × 1000 μm2 were analyzed to determine the surface texture.
Glow discharge optical emission spectroscopy was performed to depth profile the chemical composition through the TCP-sealed oxide coating. The instrument used was a LECO Model GDS-850A. The spectral range probed was 120–800 nm. A sputter time of 2 min was used in the measurement with an apparent sputter rate of 0.5 μm min−1.
Corrosion damage assessment
The U.S. ARMY Corrosion Control and Prevention Group has established a scale for the assessment of corrosion damage and material degradation during accelerated degradation testing.32 This scale was used herein and is as follows: Stage 0 shows no visible corrosion; Stage 1 shows sample discoloration and staining; Stage 2 reveals loose isolated rust or corrosion product and early stage pitting of the surface along with minor etching; Stage 3 shows more extensive rust or corrosion product, minor etching, pitting and more extensive surface damage; and Stage 4 exhibits extensive rust or corrosion product formation, extensive etching, blistering, de-adhesion and pitting that has progressed to the point where the life of the specimen has been affected.
Results
Characterization of oxide and tcp-sealed oxide coatings
Figure 1 presents representative plan-view SEM micrographs of AA2024-T3 specimens (A) unanodized (degreased and deoxidized only), (B) anodized and unsealed, and (E) anodized and sealed with TCP. Micrographs of anodized specimen cross sections revealing the oxide layer thickness are presented in Figs. 1C and 1D. The primary features on the unanodized alloy are the rolling grooves that lay from the upper left to the lower right and etch pits decorating the surface (Fig. 1A). Many of these pits are formed during the deoxidation step. The micrograph for the anodized and unsealed specimen reveals a porous oxide coating (Fig. 1B). Electrochemical anodization of aluminum alloys produces a nanoporous oxide coating with pore diameters in the range of 10–50 nm, depending on the acid type and the process parameters.33–38 The oxide coating thickness for these specimens is ca. 5 μm, as determined from SEM-FIB micrographs of cross sections like those presented in Figs. 1C and 1D. Specimens were milled at a 45o angle relative to the vertical axis. SEM micrographs of the cross section were recorded at the same angle. The 5 μm oxide thickness was reproducibly achieved with the sulfuric acid anodization conditions employed and is in reasonable agreement with the estimated thickness of ca. 3 μm that calculated from the nominal coating weight and the density of aluminum oxide (3.95 g cm−3). Cross sectional analysis of the oxide coating (Fig. 1D) reveals a defect caused by a dislodged and entrapped second phase particle. Such micron-sized defects and heterogeneities have been previously observed in anodic coatings formed on 2xxx series aluminum alloys.31,33,39,40 These defects have been attributed to the dissolution of copper-rich and Al9FeNi intermetallic phases at the high potentials used for anodization in sulfuric acid and entrapment of particles within the oxide coating.39 The SEM micrographs reveal that the TCP sealant forms across the surface of the oxide coating (Fig. 1E). There is evidence of cracking due to sealant dehydration in the vacuum environment of the SEM, so-called mud cracking. There is also evidence of coating bath precipitates on the surface of the sealant layer. These are the particulates seen on the surface of the TCP sealant layer and are demarked in the micrograph (Fig. 1E). These particulates have been confirmed by EDS analysis to be mixed deposits of ZrO2 and Cr(OH)3. The sealant cracking and coating precipitate particles are characteristic of other commercial TCP sealants as well (Fig. 1F).

Figure 1. SEM micrographs of AA2024-T3 specimens (A) unanodized (degreased and deoxidized), (B) anodized in 9.8 wt% H2SO4, (C and D) FIB-milled cross sections of the anodic coating revealing the oxide film thickness and a defect caused by the entrapment of an intermetallic particle, and (E) anodized and sealed by a 10-min immersion with TCP. The micrograph in (F) shows another anodized and TCP-sealed specimen. This specimen was sealed with a different commercial TCP (TCP-NP, 5-min sealing). The micrographs of both TCP-sealed specimens reveal cracks in the sealant layer caused by dehydration in the vacuum and coating participates decorating the sealant surface.
Download figure:
Standard image High-resolution imageThe SEM micrograph in Fig. 1B reveals the porosity of the anodic coating (ca. 20 nm pores), which is partially covered by aluminum hydroxysulfate deposits. These deposits form during the anodization and are incompletely removed by the initial 2-min immersion rinse in ultrapure water. EDS analysis revealed the deposits consist of Al, S and O. It was found that the deposits can be completely removed by a longer 20-min full immersion in room temperature ultrapure water with no agitation. Evidence for this removal is provided in the SEM micrographs presented in Fig. 2. For example, micrographs of an anodized specimen (A) after the 2-min initial rinse and (B) after the longer 20-min immersion soak reveal removal of the smut. Clearly, a 20-min ultrapure water soak removes the slow dissolving deposits and exposes the underlying porous oxide. Figure 2C presents a higher magnification micrograph of the deposit-free oxide coating in Fig. 2B that reveals the 10–20 nm diameter pore size.
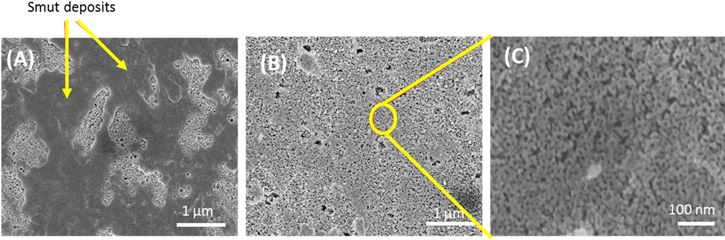
Figure 2. SEM micrographs of an anodized (9.8 wt% H2SO4) AA2024-T3 specimen (A) before soaking in ultrapure water showing aluminum hydroxysulfate deposits across the oxide surface, (B) after soaking for 20 min in ultrapure water at room temperature to remove the smut and expose the underlying porous oxide, and (C) a higher magnification micrograph of the clean oxide coating in Fig. 2B revealing the nanoporous oxide coating morphology. Pore sizes in the outer oxide are in the 10–20 nm range.
Download figure:
Standard image High-resolution imageIf not removed, the smut could cause weak adhesion with topcoats and incomplete sealing with TCP, or other sealants.
Figure 3 shows digital optical micrographs of an AA2024-T3 specimen anodized and sealed with TCP (A) after 16 h of laboratory atmosphere exposure and (B) after an additional 30-min vacuum exposure. The micrograph in Fig. 3 A reveals a crack-free sealant layer before the vacuum exposure. Figure 3B shows mud cracking of the sealant layer caused by dehydration in the vacuum. Figure 3 C presents an SEM-FIB micrograph in the cross section that reveals an interesting observation made on multiple specimens and that is a crack through the sealant layer, estimated to be in the 100–150 nm range, and into the outer oxide coating.

Figure 3. (A) A digital optical micrograph of an anodized (9.8 wt% H2SO4) AA2024-T3 specimen sealed with TCP after 16 h of laboratory atmosphere exposure and (B) a digital optical micrograph of the same specimen after an additional 30-min exposure to the high vacuum of the SEM. (C) An SEM-FIB micrograph in the cross section showing the depth of a developed crack through the TCP sealant layer, estimated to be in the 100–150 nm range (white markers), and into the oxide coating. Arrows in micrographs B and C identify mud cracks in the sealant layer and a crack in the oxide layer, respectively.
Download figure:
Standard image High-resolution imageThe depth of the crack in the oxide coating is ∼1 μm. The cracking was observed only on the TCP-sealed specimens examined, not on unsealed anodic coatings. The cause for the oxide cracking is unclear but may be due to chemical degradation during the sealing process.
The micrographs in Figs. 1 and 3 reveal the sealant forms across the outer oxide surface. How deeply the sealant penetrates the oxide was assessed qualitatively from EDS elemental profiles of FIB-milled specimens in the cross section. The specimens were milled at a 45o angle relative to the vertical axis to create the cross sections for analysis. Figure 4 shows elemental maps for an anodized AA2024-T3 specimen sealed with TCP. Presented are maps for Zr, Cr, F, Al with depth into the oxide (top to bottom in all panels). The elemental maps suggest that the sealant elements are located at the surface and within the oxide coating. Zr is detectable up to some 400 nm into the oxide. F and Cr are detected at a greater depth of some 800 nm. In addition to the conversion coating sealant (ZrO2·nH2O and Cr(OH)3), it is reasonable to expect that hexafluoroaluminate and oxyfluoride chemical species, such as AlF63−, AlFO and AlF2O, form due to reactions of fluoride with the oxide coating.
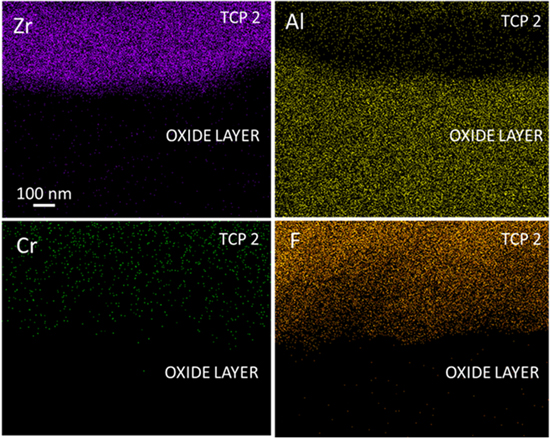
Figure 4. EDS elemental maps for Al, Zr, F and Cr recorded through a FIB-milled cross section of an anodized (9.8 wt% H2SO4) AA2024-T3 specimen sealed with TCP.
Download figure:
Standard image High-resolution imageFigure 5 presents preliminary GD-OES elemental profiles for Zr and Cr with depth into an anodized specimen sealed with TCP. The sputter depth is apparent and was not quantified directly by microscopy or profilometry. The profiles show that both sealant elements, Zr and Cr, extend from the surface into the oxide coating. The measurement was stopped at approximately 800 nm so these elements appear to extend deeper into the oxide. Future analysis will look this more completely. The Cr content is larger at the surface than in the oxide. The elemental ratio of Zr/Cr is ca. 2.0–2.5 with depth into the oxide. These results are consistent with the EDS data presented in the previous figure indicating that the sealant forms a layer on the outer surface of the oxide and penetrates the oxide pores up to depths at least approaching 1 μm.

Figure 5. GD-OES elemental profiles for Zr and Cr recorded through an anodized (9.8 wt% H2SO4) AA2024-T3 specimen sealed with TCP.
Download figure:
Standard image High-resolution imageElectrochemical characterization
Figure 6A shows  plots for anodized AA2024-T3 specimens, unsealed and sealed with TCP, in naturally aerated 0.5 M Na2SO4 + 0.01 M NaCl. The measurements were made at the OCP. The low frequency impedance at Z0.01 Hz is dominated by the charge transfer (Rct) resistance; a direct measure of the corrosion resistance. The curves reveal a Z0.01 Hz value (∼3 × 10⁶ ohm-cm2) for the anodized specimen sealed with TCP that is 5× greater than the value for the unsealed specimen (∼5 × 10⁵ ohm-cm2). Importantly, both are over 1000× higher than the value for a unanodized (degreased and deoxidized only) alloy.25–30,41–44 The remainder of the curves in the mid (capacitive) and high frequency (solution and electrode ohmic resistance) regions are overlapping with no distinct differences.
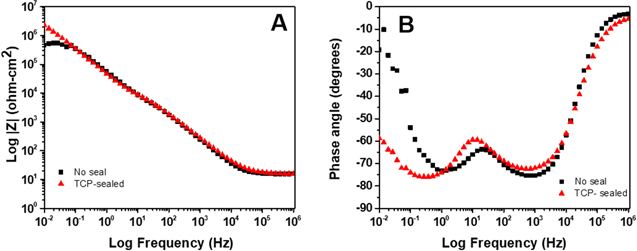
Figure 6. Electrochemical impedance spectroscopy data (Bode plots) recorded in naturally aerated 0.5 M Na2SO4 + 0.01 M NaCl for anodized (9.8 wt% H2SO4) AA2024-T3 specimens unsealed and sealed with TCP. The EIS data were recorded at the OCP using a 10 mV AC sine wave.
Download figure:
Standard image High-resolution imageFigure 6B shows phase angle  curves for the same specimens. The data indicate two time-dependent processes over the frequency range: one at ca. 1 kHz and a second at a lower frequency of ca. 1 Hz. The most distinct differences between the sealed and unsealed specimens are seen in the low frequency region. The phase angle for the TCP-sealed specimen at 0.01 Hz is ≥ −60° while the phase angle is considerably lower for the unsealed specimen with a value of −10°. The more negative phase angle for the TCP-sealed specimen is suggestive of greater capacitive behavior. The data suggest the lower frequency process is associated with the TCP sealant layer on the oxide surface and within the pores.
Figure 7 presents anodic and cathodic potentiodynamic polarization curves for anodized AA2024-T3 specimens, unsealed and sealed with TCP, in naturally aerated 0.5 M Na2SO4 + 0.01 M NaCl. The anodic curves shown in Fig. 7A reveal reduced current for the TCP-sealed specimen. The OCP values were ca. −0.28 V for the TCP- sealed and unsealed alloy specimens. The anodic current magnitude, for example at 0.1 V, is 10× lower for the TCP-sealed specimen, as compared to the unsealed anodized specimen. There is no clear onset potential for stable pit formation and growth in the curves for either specimen, at least to potentials as positive as 0.5 V. It should be noted that while the OCP values were similar for the separate specimens used for the anodic and cathodic polarization curves presented here, sometimes shifts were observed from the initial value when specimens were first used in the EIS measurements, usually in the negative direction.
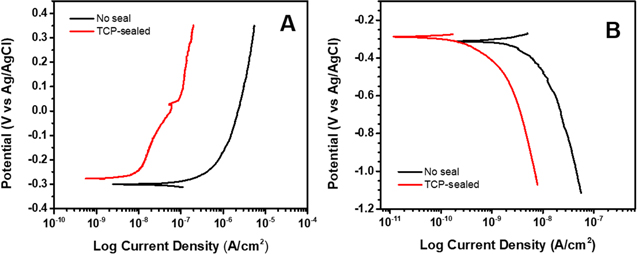
Figure 7. Potentiodynamic (A) anodic and (B) cathodic polarization curves for anodized (9.8 wt% H2SO4) AA2024-T3 specimens unsealed and sealed with TCP. The measurements were made in naturally aerated 0.5 M Na2SO4 + 0.01 M NaCl. Scan rate = 1 mV s−1. Separate specimens were used for the anodic and cathodic curves.
Download figure:
Standard image High-resolution imageThe cathodic curves in Fig. 7B reveal a decreased current for dissolved oxygen reduction at the TCP-sealed specimen, as compared to the unsealed anodized specimen. In fact, the current suppression across the entire potential range for oxygen reduction (−0.4 to −0.9 V) is 5× lower than the current for the unsealed anodized specimen.
Figure 8 presents a summary of the electrochemical parameters measured for anodized AA2024-T3 specimens, unsealed and TCP-sealed, measured in naturally aerated 0.5 M Na2SO4 + 0.01 M NaCl. Figure 8A shows that sealing the oxide layer with TCP coating shifts the nominal OCP towards more noble potentials by some 40 mV. There is, however, no statistically significant difference in the mean OCP values for the two specimen types given the magnitude of the variation in the data for both. The nominal anodic current density (J) at +0.1 V and the cathodic current density at −0.7 V, measured from the potentiodynamic polarization curves, are both suppressed by the TCP sealant. The similarity in the OCP values and the suppressed currents indicate the sealant provides both anodic and cathodic corrosion protection. Figure 8B reveals a 10× suppression of the anodic current density for the TCP-sealed specimens, as compared to the unsealed anodized controls. Figure 8C reveals a 5× suppression of the cathodic current density for the TCP-sealed specimens, as compared to the unsealed anodized controls. Notably, the variability in the measured values is less for TCP-sealed specimens. Finally, Fig. 8D reveals a nominal Z0.01Hz increase by a factor of 5× after sealing the oxide with TCP.

Figure 8. Comparison of electrochemical parameters measured for anodized (9.8 wt% H2SO4) AA2024-T3 specimens, unsealed and sealed with TCP, in naturally aerated 0.5 M Na2SO4 + 0.01 M NaCl. The following data are presented: (A) open circuit potential (OCP), (B) anodic current density at +0.1 V, (C) cathodic current density at −0.7 V, and (D) low frequency impedance modulus, Z0.01 Hz, at the OCP. Data are reported as mean ± standard error of the mean (n ≥ 3 measurements).
Download figure:
Standard image High-resolution imageThe electrochemical behavior of anodized (9.8 wt% H2SO4) specimens, unsealed and sealed with TCP, was compared with anodized specimens sealed in hot water and with nickel acetate. Table I presents a summary of the numerical data.
Table I. Summary of electrochemical data for anodized AA2024-T3 specimens (9.8 wt% H2SO4) sealed with hot water, nickel acetate, and TCP.
| Hot Water | Nickel Acetate | TCP | |
|---|---|---|---|
| OCP (mV vs Ag/AgCl) | −277 ± 142 | −219 ± 146 | −225 ± 78 |
| Ja @ 0.2 V (μA cm−2) | 0.188 ± 0.161 | 0.017 ± 0.014 | 0.048 ± 0.015a) |
| Jc @ −0.7 V (μA cm−2) | 0.370 ± 0.311 | 0.087 ± 0.013 | 0.030 ± 0.027 |
| Z0.01Hz (Mohm-cm2) | 3.68 ± 2.96 | 5.51 ± 1.72 | 5.51 ± 0.72 |
a)Anodic current density (Ja) measured at 0.1 V vs Ag/AgCl. Values are presented as mean ± std. dev. for n = 3 samples of each type.
These preliminary data reveal the electrochemical behavior of the TCP-sealed specimens is similar to that of the nickel acetate-sealed ones. This is based on the similar magnitudes of the anodic and cathodic current densities, and the Z0.01 Hz values. The current densities for the TCP-sealed specimens are nominally lower and the Z0.01 Hz value is nominally higher than the values for the hot water-sealed specimens. This is suggestive of better corrosion resistance after TCP than after hot water sealing.
Continuous solution exposure testing
The electrochemical data presented above indicate the TCP sealant increases the corrosion resistance of the anodized specimens by a factor on the order of 10×. Accelerated degradation tests were conducted to assess the corrosion resistance of anodized AA2024-T3 specimens, unsealed and sealed with TCP, and to compare the results with the predictions from the electrochemical data. Figure 9 shows comparison of EIS data recorded for anodized AA2024-T3 specimens, unsealed and sealed with TCP, before and after 5-days of continuous contact with 3.5 wt% NaCl at room temperature. The test was performed in an electrochemical flat cell so that only the anodized surface was exposed to the solution. This test was performed to probe for solution penetration through the TCP sealant layer. Plots of  reveal that Z0.01 Hz decreases by 10× for the unsealed specimen, actually, after just 3 days of exposure (∼105 ohm-cm2) (Fig. 9A, top and left). The low frequency impedance for this specimen did not decrease any further through Day 5. The reduced low frequency impedance is likely due to Cl− penetration through the oxide and attack of the barrier layer at the base of the pores as well as the underlying alloy. In contrast, Z0.01 Hz is unchanged (∼106 ohm-cm2) for the TCP-sealed specimen (Fig. 9B, top and right) during the 5-day period.
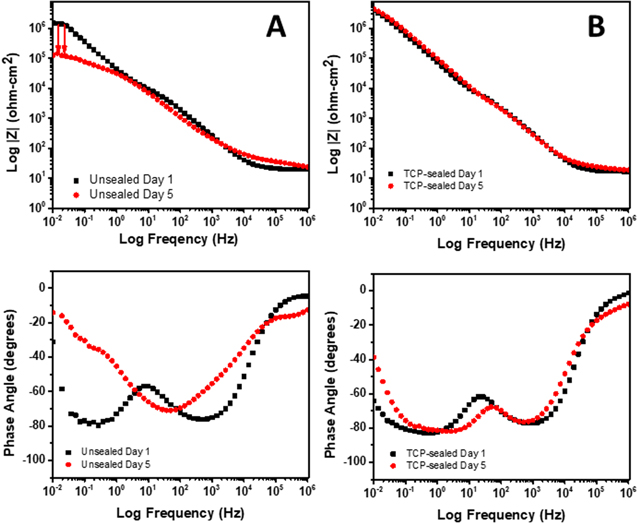
Figure 9. Electrochemical impedance spectroscopy data (Bode plots) recorded in naturally aerated 3.5 wt% NaCl for anodized (9.8 wt% H2SO4) AA2024-T3 specimens (A) unsealed and (B) sealed with TCP. The EIS data were recorded at the OCP using a 10 mV AC sine wave on Day 1 and 5 of a continuous solution exposure test.
Download figure:
Standard image High-resolution imageSubtle differences in the phase shift  plots are seen for the sealed and unsealed specimens (Figs. 9A and 9B, bottom graphs). The unsealed specimen exhibited a decreased low frequency phase angle from −80 to −20◦ after just 3 days of solution contact. There is also apparent loss of the two time-dependent processes resulting in one process at ca. 50 Hz. In contrast, the low frequency phase angle data for the TCP-sealed specimen remain largely unchanged. The two time-dependent processes are also unaffected by the solution exposure. The results indicate the TCP sealant provides a stable barrier layer that inhibits electrolyte solution penetration through the oxide to the base metal.
NSS degradation testing
A 14-day NSS test was conducted, according to ASTM B117, to further assess the corrosion resistance provided by the TCP sealant on anodized AA2024-T3 specimens. Camera photographs of unsealed and TCP-sealed specimens, before and after 14 days, are presented in Fig. 10. The top photographs reveal significant corrosion damage on the unsealed specimen after 14 days. The arrows indicate regions with visible pitting and corrosion damage (Stage 2). In contrast, the TCP-sealed specimen shows no discoloration, pitting or corrosion damage (Stage 0). The unanodized region at the top of each specimen was covered with corrosion protection tape during the NSS test, so no corrosion is visible.
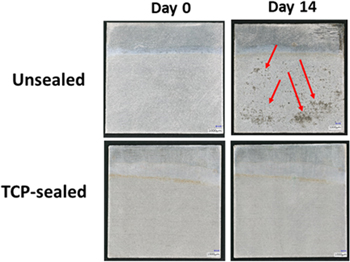
Figure 10. Camera photographs of 1 in2 anodized (9.8 wt% H2SO4) AA2024-T3 specimens, (top) unsealed (no seal) and (bottom) TCP-sealed on Day 0 (left) and 14 (right) of an NSS test according to ASTM B117. The arrows indicate areas of corrosion damage on the unsealed specimen. The bottom three-quarters of each specimen was immersed in the sulfuric acid for the anodization. Blue scale bar in each panel = 1000 μm.
Download figure:
Standard image High-resolution imageFigure 11 presents (A) and (B) 3-dimensional and (C and D) 2-dimensional topographic maps of an unsealed (Figs. 11A and 11C) and TCP-sealed (Figs 11 and 11D) specimen after the 14-day salt-spray exposure. The profiles were generated from image analysis of digital optical micrographs obtained at different focal depths. Deeper regions (e.g., pits), relative to the surface, appear blue in color in the 2-dimensional representations. Second phase particles extending above the surface appear red in color. The unsealed specimen (Figs. 11A and 11C) has localized pitting and corrosion damage that developed in the area probed. This is evidenced by the presence of the 20–40 μm deep pits. The surface roughness (Sq, root mean square of height) over the 1000 × 1000 μm2 image area increased ∼3× from 0.46 ± 0.04 to 1.18 ± 0.11 μm after the 14 days. In contrast, the 3- and 2-dimensional maps for the TCP-sealed specimen (Figs. 11B and 11D) show no indication of pitting or surface damage, and no increase in surface roughness. In fact, the surface roughness decreased ∼2× from 0.65 ± 0.08 to 0.37 ± 0.03 μm after the 14 days. This is partly because of the dissolution of the TCP coating precipitates that form on the sealant surface (white aggregates in Figs. 1E and 1F) and because of detachment of some of the sealant on the oxide surface during the test and the follow up cleaning.

Figure 11. (A) and (B) 3-dimensional and (C) and (D) 2-dimensional topographic maps of anodized (9.8 wt% H2SO4) AA2024-T3 specimens unsealed (left) and TCP-sealed (right) after the 14-day salt-spray exposure. Note the different z-axis scales for each map.
Download figure:
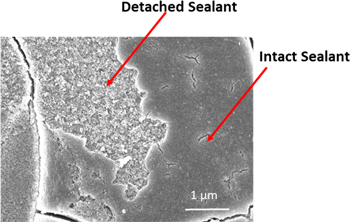
Standard image High-resolution imageEvidence for the detachment of small areas of the sealant layer is presented in Fig. 12. An SEM micrograph of an anodized AA2024-T3 specimen, sealed with TCP, after the 14-day NSS test is presented. The micrograph reveals loss of the TCP sealant from the oxide surface during the test. Arrows mark where the sealant detached and where it remained intact. The damaged areas were small in dimension, generally on the order of a few μm2. It is important to note that the specimen was subjected to post-processing cleaning treatments prior to performing the SEM analysis. The cleaning treatments included soaking the salt-spray exposed specimen in ultrapure water for 30 min to dissolve excess NaCl and then ultrasonic cleaning for 20 min in ultrapure water to remove any corrosion product. Control experiments were performed to determine if the sealant degradation was caused by the salt-spray exposure or by these post-processing steps. For example, SEM micrographs of an anodized specimen (data not shown) before and after the ultrapure water soak and ultrasonic cleaning revealed no damage to the sealant layer. Therefore, the loss appears to be due to degradation processes in the salt-spray environment. This needs to be investigated further. Even with this minor sealant degradation, there was no visible corrosion damage to the TCP-sealed specimens (see Fig. 10). This suggests that the sealant inside the oxide pores remains intact.
Figure 12. An SEM micrograph of an anodized (9.8 wt% H2SO4) AA2024-T3 specimen sealed with TCP after a 14-day NSS test and after post-processing cleaning by a 30-min ultrapure water soak and a 20-min ultrasonic cleaning to remove corrosion product.
Download figure:
Standard image High-resolution image
Discussion
Anodization of AA2024-T3 in sulfuric acid under the controlled potential conditions employed produces an oxide coating that is ca. 5 μm thick with a nominal coating weight of ca. 1200 mg ft−2. The porous anodic coating significantly increases the corrosion resistance of the aluminum alloy, as compared to the alloy after just degreasing and deoxidation. TCP conversion coatings offer a more environmentally friendly alternative to traditional chromate sealers to further improve the barrier properties of the anodic coating.
The experimental data provide evidence for how the TCP coating seals the anodic coating and how deep the sealant penetrates. The TCP forms in a continuous manner across the oxide surface with little evidence of inhomogeneities and defects. The thickness of this outer layer is in the 100–300 nm range. Mud cracking of the sealant layer was observed after vacuum exposure due to dehydration, but not before. The TCP coating elements, Zr, Cr and F, penetrate the oxide by at least a depth approaching 1 μm. Therefore, the sealant functions by forming a barrier layer across the oxide surface and within the outer pores.
Based on past studies of TCP conversion coating formation on aluminum alloys, it is presumed the sealant layer consists of relatively insoluble ZrO2 and Cr(OH)3.25–30,41,43,44 These chemical species are formed by hydrolysis of the coating bath precursors, H2ZrF6 and Cr2(SO4)3, under alkaline conditions according to the following two chemical reactions:


Alkaline conditions must be created in the interfacial region to drive these reactions to the right under open circuit conditions. Recall the pH of the coating bath is 3.85. The coating bath also contains F−, by our measurement at a concentration of 16.0 ± 0.1 ppm.27 One mechanism by which the interfacial pH increases is through the reduction of dissolved oxygen at activated metal sites at the pore base. This is shown in the following redox reaction:

By this mechanism, an alkaline solution depletion layer develops during the sealing process that extends from the base metal, through the pores, to the solution at the boundary of the outer oxide coating. Of course, coating bath species can penetrate the oxide such that reactions 2 and 3 occur within the pores as well. Evidence for the oxygen reduction redox reaction is the fact that the OCP of the anodized specimen shifts from the initial value of ca. −0.2 V vs Ag/AgCl to −0.75 V and stabilizes there after about 300 s into the 600 s (i.e., 10 min) sealing period. The polarization curves reveal that diffusion-limited oxygen reduction occurs at this potential. Under open circuit conditions, there must be an equivalent rate of base metal oxidation. In the presence of F−, this is likely occurring, at least in part, by the following redox reaction to produce hexafluoroaluminate species within the pores:

There is a second mechanism by which alkaline conditions develop within the pores and at the oxide-solution phase boundary, and that is by dissolution of the porous oxide layer according to the following chemical reaction. This reaction is driven by the relative high concentration of F− in the coating bath.

This chemical reaction degrades the oxide coating, and this may be a reason for the cracks observed after TCP sealing (see Fig. 3C).
The experimental electrochemical data indicate that the TCP sealant increases the corrosion resistance of the anodized alloy by 5–10× through the formation of a barrier layer across the oxide surface and within the outer pores. The sealant provides both anodic and cathodic protection to the anodized alloy. Nominal anodic currents were reduced by 10×, nominal cathodic currents were reduced by 5×, and nominal Z0.01Hz values were increased by a factor of 5× after sealing with TCP. Preliminary data revealed the electrochemical behavior of the TCP-sealed specimens is similar to the behavior of nickel acetate-sealed specimens. The nominal anodic and cathodic current densities were suppressed by equivalent levels, and the Z0.01 Hz values were increased by a similar amount. The current densities for the TCP-sealed specimens were nominally lower and the Z0.01 Hz value was nominally higher than the values for the hot water-sealed specimens, suggesting that TCP sealing improves the corrosion resistance more so than hot water sealing.
The 5-day continuous soak test in 3.5 wt% NaCl (room temperature) revealed stable barrier layer properties of the sealant. The electrochemical impedance data, specifically Z0.01 Hz (∼106 ohm-cm2) and the phase angle data, were unchanged from day 1 to 5 for the TCP-sealed specimen. A reduction in Z0.01 Hz (∼105 ohm-cm2) and significant changes in the phase angle data were observed for the unsealed specimen after just three days.
The anodized specimens sealed with TCP performed well during a 14-day NSS test with all specimens exhibiting no visible discoloration, pitting or major corrosion damage (Stage 0). In contrast, extensive corrosion damage was observed on the unsealed anodized specimens (Stage 2) midway through the test period. While the TCP sealant provides corrosion resistance improvement to the anodic coating, there was some localized degradation of the sealant layer observed on specimens after the 14-day NSS. Small regions of the sealant layer on the surface of the oxide were detached. The loss was confirmed to result from degradation in the salt spray environment and not from the post-processing cleaning steps. Even with this loss, the corrosion resistance was maintained meaning that the sealant in the oxide pores remains intact and serves as an effective barrier layer to solution penetration.
Finally, multiple experiments were performed with commercially anodized AA2024-T3 and TCP-sealed specimens to validate the quality of the anodization and sealing procedures in our laboratory (data not presented). In all cases, the electrochemical data and the results from a 14-day NSS test matched the results obtained for our prepared specimens.
Conclusions
The sealing of an anodic coating on AA2024-T3 with a trivalent chromium process coating was studied. Specimens were anodized (Type II anodic coating) under controlled potential in 9.8 wt% H2SO4. The following the key findings from the research:
- 1.The oxide coating formed on AA2024-T3 is nanoporous and approximately 5 μm thick with a nominal coating weight of 1200 mg ft−2 with the anodization conditions employed.
- 2.SEM and EDS analysis revealed the sealant forms a layer across the oxide surface that is 100–300 nm thick. EDS analysis of cross-sectioned specimens and GD-OES depth profiling revealed the sealant (Zr, Cr, F) penetrates the oxide pores to a depth at least approaching 1 μm.
- 3.Sealing the oxide coating with either TCP provides improved corrosion resistance to the anodized aluminum alloy as evidenced by suppressed nominal anodic currents (10×), suppressed nominal cathodic currents (5×), and increased nominal Z0.01 Hz values (5×). The sealant forms a barrier layer that provides anodic and cathodic corrosion protection to the anodized alloy.
- 4.The electrochemical data for the TCP-sealed specimens were similar to preliminary data for nickel acetate-sealed specimens, suggestive of comparable corrosion protection. Furthermore, the electrochemical data for the TCP-sealed specimens indicated better corrosion protection than is provided to the anodized specimens by hot water sealing.
- 5.The TCP barrier layer was stable during a 5-day continuous solution soak in 3.5 wt% NaCl at room temperature.
- 6.There was no discoloration, visible pitting or major corrosion damage seen on the TCP-sealed specimens (Stage 0) after a 14-day NSS test. In contrast, significant pitting and corrosion damage was observed on the unsealed anodized specimens after 7 days of exposure (Stage 2).
Acknowledgments
The authors acknowledge funding by CHEMEON Surface Technology for this research. We thank Al Bahadilla for his assistance with making the GD-OES measurement.