
Abstract
This paper presents the "dual electrochemical cell" (DEC) method, a new technique that allows monitoring of corrosion current ( ) in real time with a corrosion potential
  that may change with time. In this method, the
  of a metal corroding in a solution containing the oxidant of interest is measured in the 1st cell. This potential is then continuously applied in real time to a second cell using the same metal electrode in the same solution but free of the oxidant, and the current of the 2nd cell, which represents the
  of the 1st cell, is monitored. This setup allows direct measurement of
  without having to polarize the corroding electrode away from
  The advantages of DEC over conventional methods are that it does not require the corroding system to be at steady state, and avoids any ambiguities associated with the extrapolation of the measured current-potential relationship to extract
  The
The  values obtained using the DEC method were compared with those obtained using conventional polarization techniques, using dissolved metal concentrations and surface analysis observations, and the results showed that the DEC method provides the most accurate measurement of
Export citation and abstract BibTeX RIS

This is an open access article distributed under the terms of the Creative Commons Attribution Non-Commercial No Derivatives 4.0 License (CC BY-NC-ND, http://creativecommons.org/licenses/by-nc-nd/4.0/), which permits non-commercial reuse, distribution, and reproduction in any medium, provided the original work is not changed in any way and is properly cited. For permission for commercial reuse, please email: permissions@ioppublishing.org.
Quantitative analysis of an aqueous corrosion rate using electrochemical methods1 typically involves polarization tests in an electrochemical cell, consisting of an electrode made of the metal of interest in a solution containing the oxidant(s) of interest. Due to mass and charge conservation laws during an (electro-)chemical process, the current ( ) measured during polarization is the sum of the net reduction current (
 ) arising from the electrochemical redox half-reaction(s) of the oxidant and the net oxidation current (
 ) arising from the electrochemical redox half-reaction(s) of the metal:
  1,2 The
  during natural corrosion is referred to as the corrosion potential (
 ). Mass and charge conservation during natural corrosion dictates that
  and
and  when
when  =
=  Hence, in order to extract the
  at
at  which is the corrosion current (
 ), the observed
  vs
vs  relationship must be deconvoluted to separate the dependence of
  on
on  from that of
 which is then extrapolated to determine
  or
or  at
at 
While they differ in the mode and range of the external voltage applied, most conventional electrochemical techniques employed for corrosion rate analysis involve polarizing  away from
  For example, a Tafel analysis employs potentiodynamic polarization over a range of potentials away from
  (at least ±30 mV for a 2-e transfer half-reaction), often referred to as the Tafel region, with the assumption that the electrochemical redox half-reactions occurring in the interfacial region are at (pseudo-) steady state.3,4 It is also assumed that because
  is far enough away from the equilibrium potentials of the redox half-reactions (
 and
and  ), the Butler-Volmer relation for the
  as a function of
  for each half-reaction can be approximated using the Tafel relation3:


where  and
and  are the anodic and cathodic Tafel slopes, respectively.
A simple Tafel analysis further assumes that the  in the anodic Tafel region is predominantly due to
  and the
  in the cathodic Tafel region is predominantly due to


The observed  vs
vs  relationship in the anodic or cathodic Tafel region is then extrapolated to
  to obtain the corrosion current,
When the  range used in the polarization test is in a region where more than one half-reaction contributes significantly to
  the Wagner–Traud equation is used instead of the simple Tafel equation.5 The Wagner–Traud equation is the combination of the Tafel equations for
  and
and 
It is important to note that even for a system where segments of the  vs
vs  plot appear linear, the error in calculating a Tafel slope may not be insignificant. This is the case if
  is close to the
  or
or  (i.e., small overpotential), or if the applied potential
  is not far enough from
  In the former case, the
  near
near  or
or  near
near  cannot be approximated by using a simple Tafel equation but follows the Butler-Volmer equation. In the latter case, both
  and
and  contribute significantly to
  and hence, the
  near
near  cannot be approximated using a simple Tafel equation but follows the Wagner-Traud equation. A simple calculation shows that for a 2-e transfer oxidation or reduction half-reaction, which has a Tafel slope of 60 mV/dec,
  when
when  That is, the contribution of
  to
to  will be 10% and the
  will be 90% of
  Likewise, the
  at
at  will be 90% of
  Obtaining a more accurate Tafel slope for
  or
or  would therefore require polarization further away than
  A lesser-known equation describing electrode reaction kinetics is the Allen–Hickling relationship, which decreases the error of approximating a linear relationship at small overpotentials by applying the full Butler–Volmer equations for individual half-reactions.6 However, this approach requires prior knowledge of the electrochemical half-reactions involved in corrosion and the rate-determining steps (RDS) of individual half-reactions, so it is not widely used.
The overall process of an electrochemical redox half-reaction consists of multiple elementary steps that can contribute to the determination of the overall rate. These include electron transfer (via a conducting electrode, between the redox pair) and transport of the redox pair to and from the interfacial region and the bulk solution.1–3 The redox pair may also undergo chemical reactions in the interfacial region.2 Hence, the measured Tafel slopes may contain contributions from chemical processes other than the interfacial electron transfer. To further separate the contribution of mass transport to  or
or  polarization tests are performed under different mass transport conditions. For example, polarization tests can be performed using a rotating disc electrode; the
  vs
vs  relationship is then obtained as a function of electrode rotation rate (ω), and analyzed using the Koutecky–Levich equation.2,7 The Koutecky–Levich equation assumes that the kinetics of the oxidant reduction half-reaction in the surface region follow the Tafel relation, and that the transport rate of the oxidant in relation to ω follows the Levich equation. As discussed in more detail later in this paper, the relative contribution of mass transport to overall rate varies with overpotential, and the range of
  in which the RDS changes from interfacial electron transfer to mass transport is different for metal oxidation and oxidant reduction. Thus, the contribution of mass transport to the
  at a specific
  may be very different from that to the
  at the
  This makes the deconvolution of the observed
  vs
vs  relationship to extract the dependence of
  on
on  or
or  on
on  more problematic. A simple overall rate equation formulated from the rate equations of individual steps based on a linear dynamics approach, such as the Koutecky–Levich equation, may lead to an incorrect value of
Other polarization tests, such as linear polarization resistance (LPR) measurements and electrochemical impedance spectroscopy (EIS), involve small potential perturbations near  Over a narrow potential range (typically within
  ±10 mV), the Tafel relation (Eq. 1) can be further approximated to a linear dependence of
  or
or  on
on  The observed
  vs
vs  relationship over the narrow range is then analyzed by applying Ohm's law or the Stern–Geary equation8,9 to determine the resistance (
 ) that is assumed to represent the inverse of the corrosion rate. The EIS technique is used when the metal oxidation half-reaction consists of more than one elementary step, and electrical equivalent circuit analysis is used to separate the resistances of the individual steps.1
These conventional polarization methods for determining the corrosion rate all assume that under given solution transport conditions, the dependence of  or
or  on
on  does not change within the
  range tested and/or extrapolated. That is, the dependence of
  on
on  is assumed to follow a linear dependence of
  on
on  with the same cathodic Tafel slope
  over the potential range spanning from the cathodic Tafel region to
  Likewise, the dependence of
  on
on  is assumed to follow a linear dependence of
  on
on  with the same anodic Tafel slope(
 over the potential range spanning from the anodic Tafel region to
A constant Tafel slope for each redox half-reaction over an  range implies that (1) the
  and the
  in the scan range are far enough away from the
  and
and  values that the Butler-Volmer equations for
  and
and  can be approximated using the respective Tafel equations; and that (2) the chemical nature, such as the concentrations of metal cation(s) and oxidant(s) and their chemical phases, in the metal-solution interfacial region does not change with
  and hence the redox half-reactions involved, their equilibrium potentials and the RDS do not change over the polarization range.
When these conditions are met, the potential-dependence of metal oxidation kinetics can be described very well using approximated Butler–Volmer equations such as the Tafel equation or the Stern–Geary equation for the kinetics of the redox half-reactions in the interfacial region (and, if needed, incorporating the mass transport contribution based on linear dynamics). However, the required assumptions described above may not always be valid, particularly when polarization away from  induces additional redox half-reaction(s) and/or changes the RDS of the overall redox process.
To avoid these issues arising from polarization away from  we have developed a new method that directly measures
  without polarizing the potential away from that of a metal or an alloy corroding in a solution containing an oxidant stronger than water (e.g., O2, H2O2). This new method employs a dual-electrochemical-cell (DEC), in which the
  of a working electrode made of an alloy in a solution of interest is monitored in cell♯1. This
  then controls the electrode potential of cell♯2 that consists of another working electrode made of the same alloy in the same electrolyte solution, but free of the oxidant. The current in cell♯2 is measured as a function of time. With this set-up, the contribution of the oxidant reduction current to
  is eliminated and the overall metal oxidation current (i.e.,
  ) becomes the predominant component of the polarization current.
This paper describes the DEC set-up and the principles underlying it, and compares the corrosion current as a function of time with that obtained using two conventional potentiodynamic polarization methods: potentiodynamic scans after corrosion for different durations, and periodic measurements of linear polarization resistance during  measurements. The corrosion rates obtained from the different electrochemical methods are then analyzed in relation to dissolved metal concentrations and surface analyses. Some case studies are presented in which the corrosion current can be measured by the DEC method, even where conventional methods fail.
The Dual-Electrochemical-Cell Method
As the name suggests, the DEC method uses two connected electrochemical cells, as illustrated in Fig. 1a. Cell♯1 is a standard three-electrode electrochemical cell, of the type commonly used in corrosion studies. The three electrodes are a working electrode (WE), a reference electrode (RE) and a counter electrode (CE). The working electrode in cell♯1 (WE♯1) is made of an alloy of interest. The electrolyte of cell♯1 (solution ♯1) is the solution of interest, containing an oxidant (e.g. dissolved O2) stronger than protons. The three electrodes are connected to channel ♯1 of a multichannel potentiostat, and the potential of the WE♯1 in solution ♯1 ( ) is measured. This electrode potential represents the corrosion potential of the metal in aerated solution:

Figure 1. Schematic of the dual-electrochemical cell (DEC) set-up for (a) simultaneous measurements of  and
and  and (b)
  measurement using a pre-obtained
  time profile.
Download figure:
Standard image High-resolution imageThe electrolyte solution in cell♯2 (solution ♯2) is the same as solution ♯1, except for the fact that it is free of the oxidant of interest. Cell♯2 uses the same three electrodes as those in cell♯1. However, cell♯2 is electrically configured differently from cell♯1. The reference electrode of cell♯2 (RE♯2) is connected to the RE♯1, while the RE lead of channel ♯2 of the potentiostat is connected to WE♯1 in cell♯1, and the potential of WE♯2 in cell♯2  ) is maintained at 0 V with respect to the potential of WE♯1. With this configuration
  follows exactly
  The current of cell♯2 (
 ) is then monitored in real time as
  changes. The electrical connections use a floating ground to avoid ground loops.
With this set-up WE♯2 corrodes at the same potential as WE♯1 which is the  of the metal corroding in the solution of interest, at all times. In cell♯1,
  and
and  In cell♯2,
  but
but  The metal oxidation currents in both cells should be the same,
  because the electrodes in both cells are corroding at the same
  at all times and the mass transport conditions are the same. As discussed in the section describing the electrochemical reaction dynamics underlying the DEC method, these assumptions underlying the DEC method may not be valid if the chemical reactions of the oxidant (not its reduction half-reaction coupled with metal oxidation) induce a significant change in the electrochemical potential of the redox system in the interfacial region. However, chemisorption and/or solution reactions in the diffusion layer of an oxidant dissolved at a concentration below its saturation limit are typically much slower than electrochemical reduction of the oxidant. Thus, changes in the chemical nature of the interfacial region as a result of corrosion in a solution containing the oxidant can be simulated by maintaining
  at
at  throughout the corrosion duration (see further discussion later).
When  at
at 
 In cell♯1, the reduction current arises primarily from the reduction of the oxidant of interest (O2 in this study). This oxidant is absent in cell#2, and only the H+ reduction contributes to
  and hence,
  at
at  The current measured in cell#2 can then be approximated as the
  at
at  or
or 

Please note that, in equating  to
to  the net proton reduction current (
 ) should be negligible compared to
  at
at 
The DEC set-up shown in Fig. 1a allows simultaneous measurements of  and
and  If the
  time profile of the corrosion system had already been obtained,
  could be measured by applying the existing
  time profile directly to cell#2 (Fig. 1b). A similar set-up has been previously used to study the electrochemical kinetics of intermetallic compounds in Al alloys.10 This configuration would be also useful if it were necessary to use only one electrochemical cell with a single channel potentiostat.
Comparison of the DEC Results with Conventional Polarization Analysis Results
Experiments
In order to compare the  obtained using the DEC method to that obtained using other polarization methods, experiments using carbon steel (CS) in aerated solutions at pH 6.0 were performed. This pH was chosen for the comparison study because it is close to the pH of unbuffered water in the presence of normal air, and hence a common pH to which CS is exposed. In addition, at this pH the solubility of Fe2+ is still high but has a finite value. As shown later, at this pH the overall amount of dissolved metal cation increases linearly with time for a certain period of time, but starts deviating from linear time-dependence within the test duration of 40 to 72 h. This allows a comparison of the
  obtained by different methods to be made not only over the linear-kinetic period (during which there is no ambiguity in the nature of metal redox half-reaction involved in corrosion) but also the
  at longer times when the overall metal oxidation rate no longer follows linear kinetics (see further discussion in the section describing electrode reaction dynamics underlying the DEC method). Note that linear-kinetics or linear dynamics refer to the dynamics of a chemical process, when the rate of the overall process, consisting of a series of rate-determining steps (RDS), can be expressed using the 1st-order rate equations of the individual RDS with the assumption that the kinetics of individual RDS do not influence each other.11,12 The concept of linear dynamics, applied to an electrochemical reaction, is that Butler-Volmer kinetics, i.e., the exponential dependence of current on overpotential, is not affected by the rate of mass transport flux, or vice versa. This is the basic concept underlying the Koutecky-Levich equation.7 It is also the basic concept underlying electric equivalent circuit analysis, which expresses the inverse of the 1st-order rate coefficient as a resistance. In electric equivalent circuit analysis, the values of resistances (more precisely RC components) of individual RDS are constant, independent of the current flowing through them or the overall electric power voltage applied to the circuit.13
The potentiodynamic (PD) scan and linear polarization (LPR) experiments were conducted using conventional three-electrode electrochemical cell set-up as in cell#1 of the DEC method. In all experiments, the working electrode (WE) was SA36 (0.15 wt% C) carbon steel with a surface area of 0.46 cm.2 The reference electrode was a saturated calomel electrode (SCE) and the counter electrode was made of Pt mesh (Alfa Aesar, 99.9% purity). The electrolyte (with volume of 0.5 l) was prepared from 0.01 M Na2B4O7 (analytical grade, EMD Inc.), and the pH was adjusted to 6.0 by adding H3BO3 (analytical grade, Caledon Laboratories Ltd). During the experiments, the electrolytes in cell#1 and cell#2 were continuously purged with compressed air and Ar, respectively. The dissolved O2 content in the aerated solution is expected to be in equilibrium with the O2 in the purging air (0.21 atm partial pressure).
The electrochemical tests were conducted using a BioLogic VMP-300 multichannel potentiostat (controlled by EC-Lab software, version 10.44). For the PD scan analyses, each test was conducted using a separate CS electrode. Prior to the  measurements, each electrode was subjected to 5-min cathodic cleaning at −1.1 VSCE. After monitoring
  for a specified duration, the potential scan was performed over the range (
 − 0.3) VSCE to −0.3 VSCE at a scan rate of 1 mV s−1. For the LPR analysis,
  was monitored following 5-min cathodic cleaning at −1.1 VSCE. The
  measurement was interrupted every 2 h to perform an LPR measurement. The
  scan range in each measurement was from
  to
to  to
to  and then back to
  at a scan rate of 0.167 mV s−1. Each LPR measurement took ∼ 4 min.
After the CS electrodes had corroded for different durations, they were dried with Ar. The morphologies of the surfaces and cross-sections were then examined by optical microscope (Leica DVM6) and scanning electron microscopy (LEO (Zeiss) 1540XB SEM).
The dissolved iron concentration in the solution after each test was analyzed using a Perkin Elmer Avio 200 inductively coupled plasma optical emission spectrometer (ICP-OES). Prior to the solution analysis the samples were digested using nitric acid (Trace analytical grade, Fisher Scientific) to dissolve any colloidal particles present. Therefore, the measured dissolved iron concentration may include any colloid particles if present in the solution. The measured concentration was multiplied by the solution volume in the cell (0.5 l) and then normalized to the electrode surface area.
Comparison of  determined by different methods

The  and
and  monitored in real time using the DEC method are presented in Fig. 2. The results from four separate tests over different durations are presented together to illustrate their reproducibility. The data are plotted on two different time scales. The variation in the time-dependent behaviour of
  and
and  between tests conducted using the DEC method was small. In all tests,
  approached a near steady-state value very quickly and remained close to this value over the test duration (0.5 h to 72 h). The main variation was in the steady-state
  value, which was either −0.630 ± 0.005 VSCE or −0.615 ± 0.005 VSCE. The
  value is a function of the
  values of the oxidant reduction and metal oxidation half-reactions. For CS corrosion at pH 6.0 in aerated solutions, there is more than one metal oxidation path available. The difference between the two
  values observed is 15 mV, which is half the difference between the
  values of Fe0 + 2 H2O ⇄ Fe(OH)2 + 2 H+ + 2 e−; and 3 Fe(OH)2 ⇄ Fe3O4 + 2 H2O + 2 H+ + 2 e−. The two different values obtained are thus not due to variations in surface preparation or instrumental uncertainties.
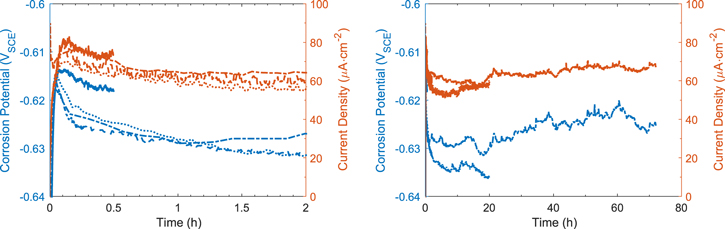
Figure 2.
 and
and  monitored in real time by the DEC method for carbon steel corrosion in aerated borate solution at pH 6.0 for four different durations, 0.5 h, 2 h, 20 h and 72 h. The data are plotted in two different time scales.
Download figure:
Standard image High-resolution imageThe  measured by the DEC method initially increased to a maximum value of ∼80 μA cm−2 within 10 min. This was followed by a slow decrease for about 20 h to a minimum value of 50–60 μA cm−2 and a slow increase for another 20 h before approaching a steady-state value of about 70 μA cm−2.
The results from the PD scan and LPR methods are presented in Fig. 3. As described above, each PD scan was conducted on a different CS electrode that had been corroded for a different duration. The  values recorded over time, prior to the PD scans after 20-h and 72-h corrosion are shown. Those from the 0.5-h and 2-h tests were the same as those obtained for the longer duration. The variation in
  between tests was similar to that observed in the DEC analysis with the main variation being the steady-state
  value, which was either −0.630 ± 0.005 VSCE or −0.615 ± 0.005 VSCE.
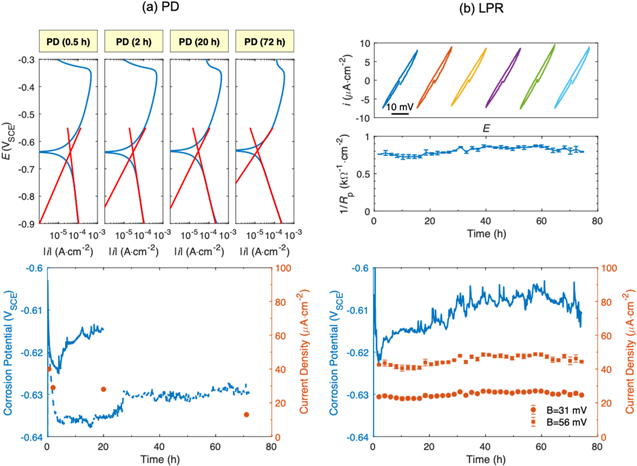
Figure 3.
 and
and  values obtained from (a) PD scan analysis and (b) LPR analysis for carbon steel in aerated borate solutions at pH 6.0. Also shown are the polarization curves from the PD scans, and the
  results and some of the polarization curves from the LPR data.
Download figure:
Standard image High-resolution imageThe PD scans obtained after different corrosion times all show a wide cathodic potential range exhibiting a linear dependence of  on
on  Interestingly, the cathodic Tafel region starts about 100 mV below
  for the 0.5-h corroded CS. However, this starting potential value gradually increases with corrosion time, and after 72-h corrosion it starts at about 30 mV below the
  value. The Tafel slope also changes with corrosion time, decreasing from −620 mV/dec at 0.5 h to −216 mV/dec at 72 h. The PD scans show no clear anodic potential range with a linear dependence of
  on
on  Hence, the
  value was obtained via extrapolation from the cathodic Tafel region. The anodic Tafel slope value was then determined by least square fitting: the
  value that gave the best fitting result for the polarization curve in the potential region from
  to
to  was chosen. The anodic and cathodic Tafel lines are indicated with red lines in Fig. 3a. Also shown in the figure is the fitted polarization curve using the two Tafel slopes (green lines). The
  value thus obtained fluctuated from 107 to 165 mV/dec with no clear time dependence. Because only the cathodic branches of the PD scans exhibited a clear Tafel relationship, the
  values were obtained by extrapolating the cathodic Tafel slopes to
  and these values are presented along with the
  data in Fig. 3a.
The LPR measurements were conducted every 2 h. Only a few examples of the linear polarization curves are shown in Fig. 3b. Presented below the polarization curves are the inverse of  values determined from the polarization curves conducted every 2 h. The polarization curves over the small potential range (
 ±10 mV) show a small degree of hysteresis. Because the polarization curves obtained from the PD scan tests were also asymmetric (Fig. 3a), we applied the Stern-Geary equation to convert the LPR resistances (
 ) to the
  values:
The  and
and  values were determined from the PD scans presented in Fig. 3a. As discussed above, the
  and
and  values ranged from 107 to 165 mV/dec and from −620 to −216 mV/dec, respectively. Because of the wide ranges and uncertainties in the Tafel slopes, the proportionality constant, B, in the Stern–Geary equation that is required to convert
  to
to  ranged from 31 to 56 mV. The
  values converted from the
  using the minimum and maximum constants are presented along with the
  data in Fig. 3b.
The  and
and  values obtained from the different polarization methods are compared with those from the DEC method in Fig. 4. In this figure, only one set of data from each method is shown. The variations in the time-dependent behaviours of
  and
and  between tests conducted with each method can be seen in Fig. 2 and Fig. 3. As observed in individual analyses, the variation in
  between tests conducted using different methods was small. In all tests,
  approached a near steady-state value very quickly and remained near this value over the test duration (72 h). At the studied pH 6.0, the
  values determined by different methods are also all within a factor of 2 of each other, with the
  monitored by the DEC method being the highest.
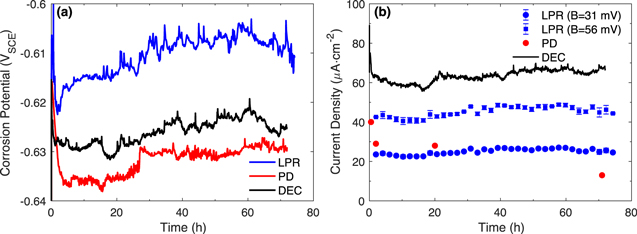
Figure 4. Comparison of (a) the  and (b) the
  values obtained using different methods.
Download figure:
Standard image High-resolution imageComparison of the electrochemical analyses with dissolved metal analysis
In order to assess the accuracy of the different electrochemical methods in determining the metal oxidation (or corrosion) rate in the studied system (CS corrosion in aerated solution at pH 6.0), the results were analyzed in relation to the post-test solution and surface analyses. The amounts of dissolved metal in solution (detected by ICP-OES) are presented in Fig. 5. Also presented in Fig. 5 are the amounts of oxidized metal calculated from the  obtained using different methods. For the amount of oxidized metal, the total accumulated charge (
 ) was obtained from
  and then converted to the oxidized mass using Faraday's law, assuming all metal oxidation resulted in Fe2+. With the DEC method,
  was monitored continuously so the
  value could be readily obtained. With the LPR and PD techniques, the
  values were determined periodically and hence interpolation (piecewise cubic) of the
  values was first performed to obtain continuous time functions of
  which were then used to obtain the
  values.The surface morphologies of the CS surfaces observed by SEM and optical microscopy are presented in Fig. 6.
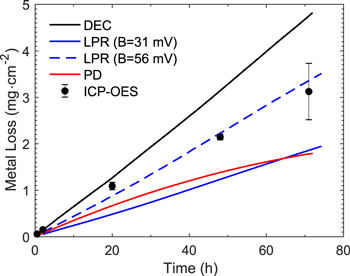
Figure 5. Comparison of the dissolved metal amount detected by ICP-OES (symbols) and the amounts of oxidized metal calculated from the  obtained by the different electrochemical methods (solid lines).
Download figure:
Standard image High-resolution image
Figure 6. SEM and optical micrographs of CS surfaces corroded in aerated solutions at pH 6.0 for different durations.
Download figure:
Standard image High-resolution imageThe amounts of oxidized metal calculated from the  values obtained by different electrochemical methods are all within a factor of 2 of the measured amounts dissolved in solution. The DEC method gave an oxidized amount close to the dissolved amount at corrosion times less than 20 h, but higher than the dissolved amount at longer times. All the other methods gave oxidized amounts equal to or less than the dissolved amounts, for all time points.
The metal oxidation products include metal hydroxide/oxide precipitates as well as metal cations and their hydrolysis products that are dissolved or dispersed in solution. Hence, the oxidized amount should be always greater than or equal to the amount detected in solution. The oxidized amount obtained from the DEC method is greater than or equal to the dissolved/ dispersed amount at all measured times, but those determined using the other electrochemical methods are lower. The DEC method also shows an increase over time in the difference between the oxidized and the dissolved/dispersed amounts, suggesting that the fraction of oxidized metal resulting in oxide formation increases with time. The SEM and optical images shown in Fig. 6 support this hypothesis.
Because metal dissolution occurs from the surface of α-Fe, over the short duration (≤ 2 h) in which dissolution is the main corrosion reaction, the lamellar structure of the pearlite phase consisting of alternating layers of cementite (Fe3C) and α-Fe becomes more clearly defined in the SEM image with time. The bluish and black areas in the optical images correspond to the surfaces of the pure α-Fe phase and the pearlite phase, respectively. After 20 h corrosion, the amount of oxidized metal determined using the DEC method starts deviating from the amount of dissolved metal detected by ICP-OES. At this time, the SEM image clearly shows the cementite layers in the pearlite phase (due to dissolution of the intervening α-Fe layer), indicating more extensive Fe dissolution over longer periods of corrosion. The optical image shows that the surface of the α-Fe phase is covered by a thin uniform layer of brownish-yellow hydroxide, with the SEM image indicating that no significant quantities of granular oxide are present. At 20 h the gaps between the cementite layers are partially filled with granular oxides. After 72 h corrosion, the gaps between the cementite layers are filled with granular oxides and the α-Fe phase is covered by a yellow/orange oxide layer. Raman, SEM and XPS analyses were performed to determine the type and morphology of iron hydroxides and oxides that grow on corroding CS (results not shown). A discussion of these results is beyond the scope of this paper and will be reported elsewhere.
The DEC method yields corrosion currents that are more consistent with the sum of metal dissolved in solution and precipitated as metal hydroxides/oxides. Thus, it can be concluded that the  measured by the DEC method is a more accurate representation of the actual corrosion rate. The
  values determined by the conventional polarization methods have larger uncertainties, and in general, underestimate the corrosion rate.
Discussion
Electrode reaction dynamics underlying the DEC method
The electrochemical reaction dynamics underlying the DEC method are essentially the same as those underlying other electrochemical methods used for corrosion rate analysis. All electrochemical methods measure the current—potential relationship arising from electrochemical redox half-reactions that occur on the surface of a corroding electrode. In corrosion, these reactions are reduction half-reaction(s) involving dissolved oxidant and oxidation half-reaction(s) involving metal:


The overall process of each half-reaction occurs through multiple elementary steps that can contribute to the overall reaction rate. The number of RDS to consider varies with reaction conditions and duration as well as the accuracy of the overall rate required for a given application. The RDS for each half-reaction that are typically considered in corrosion rate analysis include (1) the net electron transfer between the redox pair (O and R, or M0 and Mn+) in the interfacial region; and (2) the overall transport of the redox pair to and from the interfacial region and the bulk solution. For each half-reaction, the overall rate is then obtained by coupling the kinetics of elementary steps, and it is related to the current arising from the half-reaction by Faraday's law.
The electron transfer step of each half-reaction is a reversible process. Typically, the Butler–Volmer equation (or the approximate equations described in the introduction section) is applied to the net electron transfer step. For the mass transport step, the Nernst–Planck or other simplified mass flux equation is used.2 Other chemical processes such as chemisorption and homogeneous solution reactions in the diffusion layer, and metal oxide deposition and growth do not generate current directly. However, these chemical processes can influence the kinetics of the net electron transfer and the overall mass transport steps. The effects of these chemical processes are typically incorporated into the pseudo-1st order rate coefficients describing the kinetics of the two steps. The more sophisticated analyses include the chemical processes as additional elementary steps. In coupling the kinetics of the two steps to obtain the overall kinetics it is also assumed that the kinetics of each step do not influence the other. That is, the dependence of the net electron transfer rate on  does not change when the mass transport conditions change, or vice versa. This allows the use of a Koutecky-Levich-type equation to separate the dependence of the overall rate of the half-reaction on
  from the mass transport parameters.
The approach described above to obtain the overall kinetics of an electrochemical redox half-reaction works very well for redox reactions between two soluble species, such as an oxidant reduction half-reaction (5a).14–16 However, the above approach may not work very well for metal oxidation half-reactions (5b).17–21 As discussed in more detail below, for metal oxidation during corrosion, the net electron transfer step may not follow Butler–Volmer kinetics, and the kinetics of the electron transfer and the transport steps may not be independent of each other. As a result, the net metal oxidation current  may not depend exponentially on
  and it may not be negligible even at
  An inaccurate understanding of the dependence of
  on
on  in the cathodic Tafel region can lead to an incorrect determination of the dependence of
  on
on 
The electron transfer step is reversible; the forward rate ( ) and the reverse rate (
 ) are much faster than the net rate (
 ). The rate of each direction is proportional to the chemical activity (≈ concentration) of the reactant in the interfacial region (
![${\left[{\rm{O}}\right]}_{{\rm{int}}}$](https://content.cld.iop.org/journals/1945-7111/167/11/111505/revision2/jesaba6c8ieqn271.gif) or
or ![${\left[{\rm{R}}\right]}_{{\rm{int}}}$](https://content.cld.iop.org/journals/1945-7111/167/11/111505/revision2/jesaba6c8ieqn272.gif) )2:
)2:

where 
 and
and  are the rates per electrode surface area,
  and
and  are the electron transfer rate coefficients from O to R, and from R to O, via the electrode. The rate coefficients depend on the electrochemical potential for the reaction of O to R in the interfacial region, which is related to the electrode potential by
  2 Tafel was the first one to recognize that the rates (currents) of most of electrochemical reactions increase exponentially with increasing or decreasing
  and formulated this empirical observation into what is now referred to as the Tafel equation.22 Later, Marcus provided theoretical support for this exponential dependence of electrochemical reaction rate on
  23,24 The Tafel equation and Marcus theory are to electrochemical reaction kinetics what the Arrhenius equation and Eyring's transition state theory are to homogeneous chemical reaction kinetics.
where  and
and  represent the rate coefficients (in units of cm·s−1) when
  and
and  is the symmetry coefficient for electron transfer from the transition state to O vs R, and is typically 0.5.
Equations 6 to 8 show that the net half-reaction does not follow 1st-order kinetics on ![${\left[{\rm{O}}\right]}_{{\rm{int}}},$](https://content.cld.iop.org/journals/1945-7111/167/11/111505/revision2/jesaba6c8ieqn285.gif) but that it also depends on
but that it also depends on ![${\left[{\rm{R}}\right]}_{{\rm{int}}}.$](https://content.cld.iop.org/journals/1945-7111/167/11/111505/revision2/jesaba6c8ieqn286.gif) However, the net rate equation can be modified to the Butler–Volmer equation using the rate parameters at equilibrium; at
However, the net rate equation can be modified to the Butler–Volmer equation using the rate parameters at equilibrium; at 

![${\left[{\rm{O}}\right]}_{{\rm{int}}}={\left[{\rm{O}}\right]}_{{\rm{eq}}}$](https://content.cld.iop.org/journals/1945-7111/167/11/111505/revision2/jesaba6c8ieqn289.gif) and
and ![${\left[{\rm{R}}\right]}_{{\rm{int}}}={\left[{\rm{R}}\right]}_{{\rm{eq}}}:$](https://content.cld.iop.org/journals/1945-7111/167/11/111505/revision2/jesaba6c8ieqn290.gif)


where  is the exchange current density and
The Butler-Volmer equation does not explicitly use ![${\left[{\rm{O}}\right]}_{{\rm{int}}},$](https://content.cld.iop.org/journals/1945-7111/167/11/111505/revision2/jesaba6c8ieqn293.gif)
![${\left[{\rm{R}}\right]}_{{\rm{int}}},$](https://content.cld.iop.org/journals/1945-7111/167/11/111505/revision2/jesaba6c8ieqn294.gif)
 and
and  Instead, these parameters are incorporated into
  and
and  However, the implicit assumption underlying the use of overpotential in the equation is that O and R in the interfacial region are in (quasi-) chemical equilibrium throughout the redox half-reaction. The individual concentrations,
 ![${\left[{\rm{O}}\right]}_{{\rm{int}}}$](https://content.cld.iop.org/journals/1945-7111/167/11/111505/revision2/jesaba6c8ieqn299.gif) and
and ![${\left[{\rm{R}}\right]}_{{\rm{int}}},$](https://content.cld.iop.org/journals/1945-7111/167/11/111505/revision2/jesaba6c8ieqn300.gif) may change with time and reaction conditions, and the net rate of the electron transfer deviates from Butler-Volmer kinetics.
may change with time and reaction conditions, and the net rate of the electron transfer deviates from Butler-Volmer kinetics.
For a transition metal, the most important parameter that affects the net electron transfer rate from M0 to Mn+ is the solubility of Mn+ in the interfacial region. One monolayer of metal dissolution into the volume of water within 10 nm of the surface would produce an average Mn+ concentration in that water volume higher than 1 M. That is to say, the concentration of Mn+ in the interfacial region quickly reaches its saturation limit, and the saturated volume quickly expands beyond the interfacial region. The net electron transfer from M0 to Mn+ in the interfacial region can occur only at the rate of expansion of the Mn+ saturation front. That is, at  above a specific potential of
  the net electron transfer rate for metal oxidation becomes independent of
  which is said to be in the "complete concentration polarization" potential range (or above the "mass transfer overpotential").2 At these potentials the overall metal oxidation rate is determined by the displacement of the Mn+ saturation front,

The movement of the Mn+ saturation front is not a step-function of distance away from the metal surface, because of the convective and diffusional components in the overall transport flux equation.
The solubility of transition metals strongly depends on pH. Hence, during corrosion of a transition metal at a pH higher than mildly acidic or neutral, the complete concentration polarization potential typically lies below  Complete concentration polarization potential, or mass transfer overpotential, refers to the overpotential beyond which net interfacial electron transfer rate no longer increases with increasing overpotential.2 This happens because the chemical activities of the redox pair (M0 and Mn+) in the interfacial region can no longer change. This situation is commonly encountered in electrochemical deposition of metals25 because the chemical activity of a pure solid metal is 1.0 and the metal cation bulk concentration is kept constant. In corrosion, complete concentration polarization for a metal oxidation half-reaction occurs when the redox pair are a metal (with chemical activity of 1.0) and a metal cation with chemical activity at its saturation level. As discussed earlier, a single monolayer dissolution of metal can quickly saturate the solution in the interfacial region (where electron exchanges between the redox pair and the electrode can occur) except for at very low pHs and/or for highly soluble metal cations. That is, the
  does not decrease exponentially with
  in the
  range below
  and its contribution to
  may not be negligible even at
  <
<  which is normally considered to be the cathodic Tafel region.
Thus, even when no chemisorption of metal cation nor deposition of metal hydroxide/oxide on the surface occurs, and oxidant reduction and metal oxidation both involve only one electron transfer step, it is difficult to determine the potential range where the observed dependence of  on
on  can be primarily attributed to that of
  or
or  i.e., the anodic or cathodic Tafel region. Deconvoluting the dependence of
  on
on  from that of
  becomes even more complicated when the overall oxidant reduction or the overall metal oxidation occurs in multiple electron-transfer steps. For example, the reduction of O2 to OH− is known to occur in two 2-e transfer steps: O2 + 2 e− + 2 H+ ⇄ H2O2 followed by H2O2 + 2 e− ⇄ 2 OH−.26 Depending on
  the
the  follows the Tafel relationship of the 1st electron transfer step, O2 transport limit, or the Tafel relationship of the 2nd electron transfer step.26 Multiple electron transfer steps are more common for metal redox half-reactions because transition metal cations have more than one stable oxidation state in solution.27–33 Thus, depending on
  and mass transport conditions, polarizing
  away from
  can change the rate determining step, resulting in a current-potential relationship very different from that at
The perturbation of  away from
  and the uncertainties in the analysis of the observed dependence of
  on
on  can result in incorrect determination of
  at
at  (i.e.,
  ), consequently leading to the development of an inaccurate corrosion model. The DEC method recognizes that
  and
and  depend on
  However, unlike conventional polarization methods, the DEC method does not rely on establishing the exact dependences of
  and
and  on
on  Instead,
  is maintained at
  throughout the corrosion duration. Relying on the simple charge conservation law, i.e.,
  under given transport conditions, the DEC method just eliminates the contribution of oxidant reduction current to the measured current at

As described earlier, other chemical processes such as chemisorption, homogeneous solution reactions in the diffusion layer, and metal oxide deposition and growth can influence the overall rate of each half-reaction by influencing the kinetics of the electron transfer and mass transport steps.2 Hence, the next key question is whether the effects of these processes on  and
and  can be simulated and/or accounted for in the analysis of the DEC and other electrochemical techniques.
Chemical reactions of the redox pair (O and R, or M0 and Mn+) during an electrochemical redox half-reaction do not generate current directly, but they can affect the overall rate of the half-reaction. If the redox-active species are chemisorbed on the electrode surface, the chemisorbed layer can become a potential barrier for electron transfer between the redox pairs, which occurs via the electrode. As a result, the effective overpotential (η) for a metal oxidation half reaction changes18,32,34:

where  represents the potential drop due to the chemisorbed layer. Thus, a chemisorbed layer will influence the overall rate of a half-reaction by affecting the effective overpotential. (This is equivalent to moving the Tafel slope in the Evans diagram up (for the cathodic slope) or down (for the anodic slope) on the potential scale without affecting the slope). The chemisorbed layer will not affect the overall mass transport step to and from the surface and the bulk solution.
On the other hand, chemical reactions of redox-active species in the mass transport (diffusion) layer can affect the overall transport step. Depending on the contribution of the overall mass transport step to determination of the overall half-reaction rate,  and
and  at any given time can be affected by the kinetics of the chemical reactions occurring. If the chemical reactions induce precipitation of solid particles and/or gelatinous layers, they can act as a transport barrier for the solution and/or redox-active species from the surface to the bulk solution and vice versa. The effect of chemical reactions in the mass transport layer will thus affect the currents,
  and
and 
Chemisorption and chemical reactions of dissolved oxidants and their reduction products are typically negligible. Their concentrations in the bulk solution are already below their saturation limits and hence their concentrations in the interfacial region and diffusion layer are also always below their saturation limits. Hence, chemisorption or the homogeneous solution reactions of dissolved oxidants are typically negligible compared to electrochemical reduction of the oxidant. Their reduction products are less likely to be chemisorbed on the metal surface during natural corrosion. That is, chemisorption or chemical reactions in the diffusion layer of dissolved oxidants and their reduction products will not be significant during natural electrochemical corrosion.
During corrosion, the chemical reactions of concern are mostly those of the metal oxidation product, the metal cation. Chemisorption of M0 and Mn+ on the metal surface is somewhat of a moot point, because metal oxidation occurs at the surface. However, as described earlier, the interfacial region may be quickly saturated by the metal cation, and the metal oxidation half-reaction reaches steady state when the saturated volume stops expanding. At steady state, the net electron transfer rate becomes the same as the M2+ flux rate from the interfacial region to the saturated volume and is also the same as the M2+ removal rate from the saturated volume by mass transport and chemical reactions.
Chemical reactions of the metal cation in the saturated volume will affect the overall flux of M2+ from the interfacial region to the bulk solution, by competing with the transport process for M2+. More importantly, in a saturated volume the hydrolysis of Mn+ to produce metal hydroxide can occur at an appreciable rate, producing metal hydroxide that aggregates as a hydrogel network, which can hinder solution diffusion between the surface and the bulk solution. Because of the strong interdependence between the kinetics of electron transfer and mass transport steps in metal oxidation as discussed above, this can change  the net rate of production of Mn+, which is the precursor for hydroxide formation. When such systemic feedback occurs, a small change in the kinetics of individual steps can induce a significant change in the overall metal oxidation rate
  If systemic feedback between the different RDS steps of the metal oxidation half-reaction develops, a small shift of
  away from
  can accelerate or decelerate the overall metal oxidation. This makes it very difficult to extrapolate the observed
  vs
vs  relationship to obtain the
  at
at 
Polyoxygenated anions such as nitrate/nitrite can act as oxidants,35,36 but also complex with metal cations to form a metal-hydroxide-anion salt(s). Although these anions may possess a large driving force for metal oxidation, the rearrangement of multiple N—O bonds involves a high activation energy.37,38 The electrochemical reduction (i.e., electron transfer) rate of such an oxidant is thus slower than that of O2. Their reactions and complexation with metal cations are slow processes and become important only when the solution becomes saturated with metal cations. That is, the kinetics of metal-OH-anion salt formation depend on overall metal oxidation by O2 and on the pH.
The salting out process and Ostwald ripening of the salt crystals39,40 should not have a significant effect on the overall metal oxidation, but could change the surface morphology considerably. The effect of nitrate/nitrite on corrosion of metal in aerated solutions can be accounted for effectively using the DEC method with the same nitrate/nitrite solution but free of O2. The electrochemical half-reaction involving the nitrate/nitrite pair has also its own potential dependence.41 This is all the more reason why conventional polarization techniques do not accurately estimate the corrosion rate.
Other anions such as chloride and sulphide are not oxidants, but they are considered to be very corrosive ions. (They do still need an oxidant but it may not require a strong oxidant.) For chloride, complexation with metal cations and OH− to form a metal-hydroxide-chloride salt can have a considerable effect on overall corrosion because this stabilizes the metal hydroxide complex, which in turn affects the mass transport of metal cations to the bulk solution. Again in this case, the effect of chloride on the corrosion of metal in aerated solutions can be accounted for effectively using the DEC method with the same chloride solution but free of O2. Of course, some anions such as sulphide are chemically very reactive towards certain metals.42 For the study of corrosion by chemical oxidation, there is no electrochemical technique that is suitable for determining the electrochemical corrosion rate.
With the DEC method, the electrode potential is not polarized away from  but the oxidant reduction current is eliminated. As described above, the chemical reactions of the dissolved oxidant and its reduction product would be negligible. But the chemical reactions of the metal oxidation product, Mn+, can induce significant changes in the overall kinetics of metal oxidation and oxidant reduction half-reactions. With the DEC method the chemical reactions of Mn+ and their product formation over corrosion duration are effectively simulated by applying
  in real time, as the
  (or
(or  ) measures the metal oxidation current in the same chemical reaction and transport environment the corroding metal is exposed to.
In all electrochemical methods, the experimentally determined  at
at  (or
(or  ) may not represent the total metal loss rate when the overall metal oxidation occurs via more than one electron transfer step and produces solid species. This is not due to an incorrect determination of
  but rather an improper derivation of the corrosion rate from
Advantages of the DEC vs conventional polarization techniques
Conventional polarization methods indirectly determine  by monitoring
  while polarizing
  away from
  and then extrapolating the observed
  vs
vs  relationship to determine
  at
at  If time-dependent information on corrosion behaviour is required, these polarization tests must be performed periodically, and there is a possibility that these periodic perturbations will affect the corrosion behaviour. In addition, the observed
  vs
vs  relationship is analyzed by applying various combinations of approximated forms of the Butler-Volmer equations for individual redox half-reactions. However, the assumptions used in deriving the approximated equations are not always valid. Furthermore, metal oxidation kinetics may not always follow Butler-Volmer kinetics, which can result in an incorrect identification of the cathodic Tafel region and the dependences of
  and
and  on
on 
The DEC method does not polarize the corroding system away from the  of the metal corroding in the oxidizing environment of interest, but instead eliminates the reduction half-reaction of the oxidant occurring on the metal electrode. Determination of
  by DEC does not rely on prior knowledge or determination of the dependence of
  or
or  on
on 
Because the DEC method measures  at
at  directly, it allows for continuous real-time monitoring of
  as
as  varies with time. In other methods, individual polarization curves take finite amounts of time, and the electrode reaction system must be at a (pseudo) steady state during each measurement, in order to apply a Tafel equation to the observed
  vs
vs  relationship. Conventional polarization techniques are, therefore, not suitable when the system is evolving rapidly: i.e. the steady-state requirement is not met.3 A cogent example of the power of real-time measurement of
  when a corroding system does not remain a stable steady state but evolves rapidly is presented in Fig. 7. Shown in the figure are the time-dependent behaviours of
  and
and  observed during CS corrosion in aerated solutions at pHs between 7 and 8.29 At a pH in this range, the
  stays at the initial (pseudo-) steady state only for a certain duration, followed by a rapid change with time before it reaches another steady state. The time-dependent behaviour varies considerably with pH. The DEC method allows continuous monitoring of
  even when
  changes rapidly, as shown in Fig. 7. The reasons for the observed effects of pH on the evolution of
  and
and  and the non-linear corrosion dynamics underlying these observations are beyond the scope of this study and will be presented elsewhere.
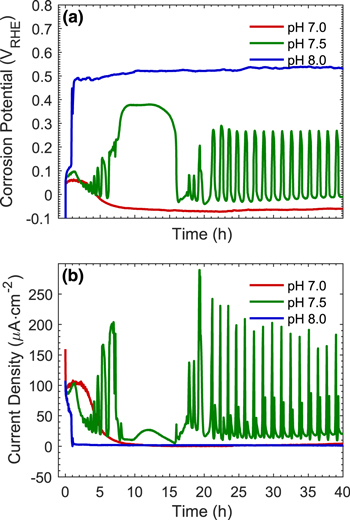
Figure 7. Time-dependent behaviour of (a) the  and (b) the
  determined by the DEC method during corrosion of CS in aerated solutions at different pHs.
Download figure:
Standard image High-resolution imageThe examples presented in this paper demonstrate that if corrosion is induced primarily by electrochemical oxidation of metal (and hence the corrosion rate can be studied effectively by electrochemical techniques) the DEC method is superior to other electrochemical methods which involve polarization away from the naturally corroding potential.
The DEC method is also the only reasonable method to use to investigate radiolysis-induced corrosion. Radiolysis products are formed in situ during irradiation. Under continuous irradiation the type and concentrations of radiolytically produced oxidants are difficult to quantify and the polarization results are difficult to analyze.43,44 The DEC method is also a very useful tool for investigating galvanic corrosion of dissimilar metals. In galvanic corrosion, the cathodic current on the more active metal is due to oxidant reduction on the surface as well as the coupling current ( ). As a result, the metal oxidation current increases, and the
  of the active metal, also known as the coupling potential (
 ), increases. The conventional way of analyzing galvanic corrosion rate is to measure the
  and
and  The coupling current on its own does not indicate the overall metal oxidation rate.45 The DEC method allows direct measurements of
  (=
(=  ) and
) and  after coupling.
Some ionic oxidants, that complex with metal cations and OH− to form a metal-hydroxide-anion salt, can affect ionic strength and pH, and their products can precipitate as salt crystals. Hence, these oxidants should not be removed from electrolyte solutions in any electrochemical analysis techniques, including DEC. If these chemically reactive species are the primary oxidants, and hence metals are being degraded primarily by chemical oxidation, no electrochemical technique (including DEC) is suitable. However, if they are not the primary oxidants, the DEC method still allows for a more accurate measurement of corrosion current than other electrochemical methods.
Conclusions
A new electrochemical method for  measurement has been proposed, which we have named the DEC ("Dual Electrochemical Cell") method. In an experimental case-study comparison with conventional PD and LPR techniques, DEC gave
  values that were more accurate and consistent with corroborating experimental observations. Compared with conventional electrochemical methods used for
  determination, the DEC method offers four main advantages:
- (1)It allows for continuous real-time monitoring of
- (2)It does not require the system to be at steady state.
- (3)It avoids any ambiguities resulting from Tafel extrapolation.
- (4)It avoids polarizing the electrode potential away from corrosion potential, which can affect the corrosion behaviour.

We have presented the electrode reaction dynamics underlying the DEC vs conventional polarization methods to demonstrate that the assumptions underlying conventional polarization-based methods of determining the corrosion current can often break down, resulting in corrosion current values that can differ significantly from the actual values. The new method we have presented here allows the corrosion current to be measured continuously without extrapolation based on uncertain assumptions, even when the system is evolving rapidly. This new capability will allow the mechanisms and dynamics of electrochemical processes to be probed in greater detail and with more assurance than previous methods have permitted.
Acknowledgments
The authors would like to thank G. Whitaker for editing the manuscript, and Drs. P. Keech and M. Behazin at Nuclear Waste Management Organization (NWMO) for their encouragement and discussion throughout the project. This work was funded by NWMO, Toronto and the Natural Sciences and Engineering Research Council of Canada (NSERC) under the Industrial Research Chair agreement in Radiation-Induced Chemistry and Corrosion, and by the NSERC Discovery grant in Radiation-Induced Materials Performance.